Impact Factor




Theranostics 2027; 17(2):734-754. doi:10.7150/thno.126404 This issue Cite
Research Paper
Fluorescent modification of a PSMA-targeting probe reveals preferential uptake by actively dividing cells in metastatic prostate cancer
Shuyang Feng1,2,13, John J. Hayward3,12, Gobi Thillainadesan1, Minzhi Sheng1,4, Andrew Kennedy1,11, Yanxiang Shao1,2, Boyang Su1,4, Yiting Wu2, Jonathan W. Houser3,12, Philipp Wolf9, Danny Vesprini6, Andrew Loblaw6, Laurence Klotz5, Christopher S. Lim7, Urban Emmenegger1,8,11, Stanley K. Liu1,4,6, Xiang Li2, John F. Trant3,10,12, Hon S. Leong1,4 
1. Biological Sciences Platform, Sunnybrook Health Sciences Centre, Toronto, ON, Canada.
2. Department of Urology, West China Hospital, Sichuan University, Chengdu, China.
3. Department of Chemistry and Biochemistry, University of Windsor, Windsor, ON, Canada.
4. Department of Medical Biophysics, Temerty Faculty of Medicine, University of Toronto, ON, Canada
5. Division of Urology, Sunnybrook Hospital, University of Toronto, ON, Canada
6. Department of Radiation Oncology, Temerty Faculty of Medicine, University of Toronto, ON, Canada
7. Department of Medical Imaging, Temerty Faculty of Medicine, University of Toronto, ON
8. Division of Medical Oncology, Sunnybrook Health Sciences Centre, Toronto, ON, Canada
9. Department of Urology, Medical Center –University of Freiburg, Freiburg, Baden-Württemberg, Germany
10. Binary Star Research Services, LaSalle ON, Canada
11. Institute of Medical Science, Temerty Faculty of Medicine, University of Toronto, ON, Canada
12. WE-Spark Research Institute, 401 Sunset Ave., Windsor, ON, N9B 3P4, Canada
13. Department of Urology, Sichuan Cancer Hospital, University of Electronic Science and Technology of China, Chengdu, China
Received 2025-10-8; Accepted 2026-10-23; Published 2027-1-1
Abstract
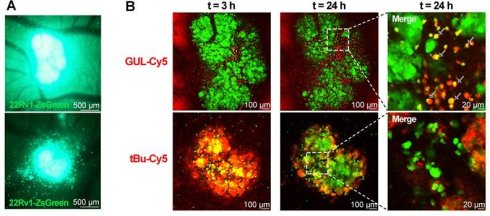
Rationale: Glutamate-Ureido-Lysine (GUL) based probes are well-established ligands of the prostate specific membrane antigen (PSMA) receptor. GUL is the PSMA-specific targeting moiety within PSMA PET probes used for clinical imaging of prostate cancer. Fluorescent versions of these probes could offer new insights during in vivo studies to further understand the behavior of present and future GUL-based theranostics.
Methods: GUL-Cy5 probe and its isotype, tBu-Cy5, were synthesized and then validated in prostate cancer cell lines in vitro. Mass spectrometry of immunoprecipitants of anti-PSMA IgG or GUL-Cy5 drawn from 22Rv1 cell lysates was performed to determine protein specificity. GUL-Cy5 and tBu-Cy5 pharmacokinetics at the single cell level were evaluated in vivo with 22Rv1-ZsGreen xenografts with intravital imaging. Flow cytometry, immunofluorescence and single cell transcriptomics (scRNA-seq) was used to track PSMA and AR protein and mRNA dynamics throughout cell cycle stages.
Results: GUL-Cy5 co-localization with anti-PSMA mAb signal was observed in various prostate cancer cell lines and negligible binding was observed in PSMA-negative cell lines. Mass spectrometry of proteins bound to GUL-Cy5 revealed high specificity to PSMA. Intravital imaging revealed GUL-Cy5 uptake in 22Rv1-ZsGreen xenografts, particularly in cells that were undergoing cell division. Cell cycle analysis revealed that cells in G2/M phase had the highest uptake of GUL-Cy5 probe which concurrently exhibited the highest levels of PSMA protein. PSMA and AR mRNA levels were significantly elevated during G1 and lower during G2/M in the majority of cell clusters as per scRNA-seq.
Conclusions: GUL-Cy5 is highly specific to PSMA protein and binds to individual PSMA expressing cells in vitro and in vivo. Higher GUL-Cy5 probe uptake in actively proliferating prostate cancer cells was observed in vivo and in vitro, likely due to elevated PSMA receptor levels. The GUL-Cy5 probe offers new insights for prostate cancer theranostics and prostate cancer cell biology.
Keywords: prostate cancer, PSMA, GUL-Cy5, DCFPyL, cell division, fluorescent probe, intravital imaging
Introduction
An estimated 299,010 U.S. men will be diagnosed with prostate cancer and 35,250 will die from prostate cancer (PCa) in 2025, making it the most commonly diagnosed cancer and second most common cause of cancer-related death in men [1]. Due to widespread early detection and advances in treatment, prostate cancer mortality has fallen 53% since its peak in 1993 [1]. Prostate-specific membrane antigen (PSMA, gene name: FOLH1) is a well-established biomarker for prostate cells and prostate cancer cells and a major target for emerging liquid biopsies and imaging probes. PSMA probes for positron emission tomography (PET) imaging ([68Ga]PSMA-11, [18F]PSMA-1007, [18F]DCFPyL) are widely used for radiologic detection of metastases in prostate cancer patients [2]. These PSMA probes consist of an 18F/68Ga-based chemical complex attached to the ligand for PSMA. The glutamate-ureido-lysine (GUL) warhead comprises lysine and glutamic acid bridged through their backbone nitrogen atoms with a urea; the ε-nitrogen of the lysine is then used for conjugation to an imaging moiety, leaving the three carboxylic acids of the amino acids to interact with the zinc ions and hydrogen bond donors deep in the PSMA binding pocket [3]. GUL-derived materials have immense theranostic potential, with 177Lu-DOTA-PSMA-GUL recently approved for the treatment of castration-resistant prostate cancer (CRPC) (NCT03511664, NCT04689828).
A fluorescently tagged version of DCFPyL could also have significant research applications when developing future GUL-based theranostics for PCa. Previously, a GUL moiety labeled with fluorescein isothiocyanate (FITC) demonstrated binding to both PSMA-positive and PSMA-negative cell lines, suggesting off-target binding [3]. This FITC labeled GUL-Dextran conjugate (PDC) was observed to bind to a PSMA-positive cell line but was accompanied by slight background binding in PSMA-negative cell lines. FITC is not an ideal fluorescent label as it is easily photobleached and many cells in vivo are autofluorescent within the excitation/emission spectra of FITC, meaning the signal-to-noise ratio is less than ideal.
Another probe, GUL-Cy3, demonstrates binding specificity for PSMA but its Cyanine3 (Cy3) fluorescent tag is not amenable to whole-body in vivo imaging of metastatic prostate cancer xenografts because of its non-infrared emission wavelength (550-600 nm) [4]. However, a Cyanine5 (Cy5) version of GUL would have more utility in pre-clinical model research and clinical research applications because of its near-infrared fluorescence properties and freedom from interference of other fluorescent tags [5].
A ligand-based probe (such as GUL) would have two main advantages over antibody-based probes in pre-clinical research and molecular based studies. Antibody-based probes may have off-target binding affinities which could lead to a loss of specificity to PSMA [6-8]. A ligand-based probe based on a highly selective small molecule offers greater specificity due to its natural biochemical property of binding to the PSMA surface receptor and would also outperform antibody-based probes in terms of stability [9-11]. Moreover, antibody labeling with fluorescent dyes can be variable if not done using site-specific technologies and while a large number of fluorescent molecules are bound to an antibody, there is variability in what proportion of antibody is labeled and with how much dye. In contrast, each molecule of GUL-Cy5 would contain a single fluorescent dye always attached in the same way to the warhead such that it does not interfere with PSMA binding, offering a more reliable quantitation of probe uptake in vivo.
We synthesized the GUL-Cy5 probe, comprising the GUL warhead bearing a Cy5 fluorescent tag at the ε-nitrogen of the lysine, as well as its companion isotype control probe, tBu-Cy5, a simple hydrophobic amide of the parent cyanine dye. The magnitude of in vitro uptake of GUL-Cy5 was consistent with the immunoreactivity of anti-PSMA monoclonal antibody (mAb; henceforth termed anti-PSMA mAb) against various PSMA-positive cell lines. Binding affinity and specificity of GUL-Cy5 against PSMA protein was deemed equivalent as determined by flow cytometry and immunoprecipitation-mass spectrometry (IP-MS), compared to anti-PSMA mAb. We observed preferential uptake of GUL-Cy5 by actively dividing cells both in vitro and in vivo which validates the value of this approach for developing future GUL-based theranostics.
Materials and Methods
Reagents and antibodies
PSMA (gene ID: FOLH1) Human Tagged Lenti ORF Clone (Table S1) and PSMA (FOLH1) Human siRNA Oligo duplex (Table S2) were purchased from OriGene (USA, RC218310L3, SR301643). pLVX-ZsGreen1-N1 lentiviral vector was purchased from Takara Bio (Japan, 632565). Click-iT™ Plus EdU Pacific Blue™ Flow Cytometry Assay Kit was purchased from Invitrogen (USA, C10636). The following antibodies were used: PSMA (Sigma, MABC291), PSMA (clone 3/E7, provided by Dr. Philipp Wolf) [12], PSMA (Cell Signaling Technology, 12702S), PSMA APC-conjugated (Miltenyi Biotec, 130-117-678), Cy5 (Abcam, ab52061), GAPDH HRP-conjugated (ABclonal, AC035), Cyclin B1 (Cell Signaling Technology, 12231S), and isotype control IgG antibodies: anti-mouse IgG (Invitrogen, 10400C), anti-rabbit IgG (Invitrogen, 31235), and IgG APC-conjugated (Miltenyi Biotec, 130-113-434).
GUL-Cy5 synthesis
General synthetic considerations: Solvents were purchased from Caledon Labs (Ontario, CA), Sigma-Aldrich (Ontario, CA) or VWR Canada (Ontario, CA). Other chemicals were purchased from Sigma-Aldrich, AK Scientific, Oakwood Chemicals, Alfa Aesar or Acros Chemicals and were used without further purification unless otherwise noted. Anhydrous N,N-dimethylformamide (DMF) was obtained from an Innovative Technology (Massachusetts, USA) solvent purification system based on aluminum oxide columns. Dichloromethane (DCM) and N,N-diisopropylethylamine (DIPEA, Hünig’s base) were freshly distilled from CaH2 prior to use. Purified water was obtained from a Millipore deionization system. All heated reactions were conducted using mineral or silicone oil baths on IKA RET Basic or equivalent stir plates equipped with a P1000 temperature probe. Thin layer chromatography was performed using EMD aluminum-backed silica 60 F254-coated plates and were visualized using either UV-light (254 nm), KMnO4, vanillin, Hanessian’s stain, or Dragendorff’s stain. Preparative TLC was done using glass-backed silica plates (Silicycle) of either 250, 500, 1000 or 2000 µm thickness depending on application and conducted according to standard practice [13]. Column chromatography was carried out using standard flash technique with silica (Siliaflash-P60, 230-400 mesh Silicycle) under compressed air pressure. Solvent evaporation under reduced pressure was conducted using a rotary evaporator (Buchi or Synthware). 1H NMR spectra were obtained at 300 or 500 MHz and 13C NMR spectra were obtained at 75 or 125 MHz on Bruker instruments. NMR chemical shifts (δ) are reported in ppm and are calibrated against residual solvent signals of CHCl3 (δ 7.26) or methanol-d3 (δ 3.31). HRMS were conducted on a Waters XEVO G2-XS TOF instrument with an ASAP probe in CI mode.
Synthesis of GUL-Cy5 (as the BF4 salt, GUL-Cy5·BF4): The starting material, tBu3-GUL, was prepared in the manner described by Maresca et al [14]. The Cy5 moiety was purchased from Lumiprobe (Maryland, USA) as the N-hydroxysuccinimide (NHS) activated ester, Cy5-NHS·BF4, and used as received.
Synthesis of protected tBu3-GUL-Cy5·BF4: Commercial Cy5-NHS·BF4 (6.4 mg, 9.6 µmol, 1 equiv.) and tBu3-GUL (7.0 mg, 14.3 µmol, 1.5 equiv.) were weighed into a 2-dram vial fitted with a rubber septum and a stir bar and purged with N2. Dry DMF (0.5 mL) and Hünig’s base (17 µL, 97 µmol, 10 equiv.) were then added and the reaction mixture stirred at room temperature for 16 h. After the reaction was deemed complete by TLC (no stain required), the solution was poured into water (20 mL) and extracted with EtOAc (3 × 5 mL). The organic extracts were combined and the solvent removed under reduced pressure. The blue residue was dissolved in a small volume of DCM and applied to a preparative TLC plate (1000 µm). The plate was developed four times using a gradient (1 to 4% MeOH in DCM). The desired blue band had some co-elution but the purest section could be removed by careful use of a suction apparatus [13]. The blue product was washed from the silica using methanol until the liquid ran clear and the solvent removed under reduced pressure to provide the product as a blue glassy film (3.6 mg, 35% yield). Yields were found to range from 8-35% over different batches.
Note: Brine washes were not used to avoid salt metathesis of the tetrafluoroborate to chloride. Attempts at drying the organic extracts with salts such as MgSO4 resulted in salt metathesis, and loss of material to the solid phase and this is strongly contraindicated.
Rf (5% MeOH in DCM) = 0.41. 1H NMR (500 MHz, CDCl3) δ 7.83 (td, J = 13.1, 4.7 Hz, 2H), 7.41 – 7.31 (m, 4H), 7.22 (t, J = 7.5 Hz, 1H), 7.20 (t, J = 7.5 Hz, 1H), 7.10 (m; pseudo-dd, J = 16.7, 7.8 Hz, 3H), 6.88 (t, J = 12.5 Hz, 1H), 6.40 (d, J = 13.7 Hz, 1H), 6.33 (d, J = 13.5 Hz, 1H), 6.01 (br d, J = 7.5 Hz, 1H), 5.79 (br d, J = 8.4 Hz, 1H), 4.30 (dt, J = 8.3, 4.1 Hz, 1H), 4.23 – 4.15 (m, 1H), 4.04 (t, J = 7.6 Hz, 2H), 3.61 (s, 3H), 3.21 (br q, J = 6.0 Hz, 2H), 2.32 (t, J = 7.7 Hz, 4H), 2.10 – 2.00 (m, 3H), 1.91 – 1.80 (m, 4H), 1.78 – 1.63 (m, 3H), 1.69 (s, 2×3H), 1.68 (s, 2×3H), 1.60 – 1.48 (m, 2H), 1.41 (s, 9H), 1.40 (s, 2×9H). 13C NMR (126 MHz, CDCl3) δ 174.02, 173.07, 172.82, 172.81 172.65, 172.41, 157.89, 153.36, 152.86, 143.06, 142.18, 141.20, 140.87, 128.94, 128.78, 127.00, 125.37, 125.03, 122.23, 111.04, 110.46, 104.64, 104.11, 81.43, 80.99, 80.33, 53.89, 53.20, 49.39, 49.09, 44.60, 38.48, 36.15, 31.94, 31.60, 29.83, 29.49, 28.77, 28.22, 28.19, 28.15, 28.12, 27.13, 26.45, 25.32, 22.38.
Synthesis of GUL-Cy5·BF4: The product of the previous reaction, tBu3-GUL-Cy5·BF4, (3.1 mg) was dissolved in DCM (1 mL) and trifluoroacetic acid (1 mL) was added. The reaction was stirred uncapped for 1 h, with the loss of the t-butyl groups monitored by direct injection into an LC-MS. The solvent was primarily removed by nitrogen blowdown with any residual solvent removed by exposure to high vacuum for 10 min. No further purification was performed.
Note: upon addition of TFA the solution changed from dark blue to bright orange; however, the typical blue color of the Cy5 dye was restored upon the evaporation of the reaction mixture.
1H NMR (500 MHz, MeOD) δ 8.27 – 8.22(m, 2H), 7.51 (d, J = 7.4 Hz, 2H), 7.47 – 7.39 (m, 2H), 7.34 – 7.25 (m, 4H), 6.64 (t, J = 12.4 Hz, 1H), 6.30 (dd, J = 13.7, 9.8 Hz, 2H), 4.33 (dd, J = 8.6, 4.9 Hz, 2H), 4.28 (dd, J = 8.4, 4.8 Hz, 1H), 4.12 (t, J = 7.4 Hz, 2H), 3.64 (s, 3H), 3.16 (t, J = 6.8 Hz, 2H), 2.46 – 2.39 (m, 3H), 2.22 (t, J = 7.2 Hz, 2H), 2.15 (dddd, J = 13.8, 9.0, 7.3, 5.1 Hz, 1H), 1.95 – 1.81 (m, 4H), 1.74 (s, 4×3H), 1.73 – 1.61 (m, 3H), 1.56 – 1.41 (m, 4H).
13C NMR (126 MHz, MeOD) δ 176.38, 176.33, 175.81, 175.32, 174.64, 160.10, 155.44, 144.27, 143.57, 142.65, 142.52, 129.77, 129.71, 126.57, 126.23, 123.41, 123.27, 112.06, 111.81, 104.33, 55.84, 53.93, 53.51, 44.78, 40.04, 36.71, 33.22, 31.50, 31.10, 29.85, 28.95, 28.21, 27.96, 27.81, 27.32, 26.53, 23.92, 18.70, 17.26.
Synthesis of tBu-Cy5 (as the BF4 salt, tBu-Cy5·BF4): Commercial Cy5-NHS·BF4 (5.9 mg, 8.8 µmol, 1 equiv.) was weighed into a 2-dram vial fitted with a rubber septum and a stir bar and purged with N2. Dry DMF (0.5 mL) and tert-butylamine (50 µL, 440 µmol, 50 equiv.) were then added and the reaction mixture stirred at room temperature for 16 h. After the reaction was deemed complete by TLC (no stain required), the solution was poured into water (20 mL) and extracted with EtOAc (3 × 5 mL). The organic extracts were combined and the solvent removed under reduced pressure. No further purification was performed.
Note: Brine washes were not used to avoid salt metathesis of tetrafluoroborate to chloride. Attempts at drying the organic extracts with salts such as MgSO4 resulted in salt metathesis and loss of material to the solid phase.
1H NMR (500 MHz, CDCl3) δ 7.90 (t, J = 13.0 Hz, 2H), 7.38 – 7.33 (m, 4H), 7.24-7.19 (m, 2H), 7.10 – 7.07 (m, 2H), 6.86-6.83 (m, 1H), 6.34 (d, J = 13.7 Hz, 1H), 6.29 (d, J = 13.7 Hz, 1H), 4.02 (t, J = 7.6 Hz, 2H), 3.60 (s, 3H), 2.20 (t, J = 7.2 Hz, 2H), 1.82 (p, J = 7.7 Hz, 2H), 1.69 (s, 4×3H), 1.60 (m, 2H), 1.51 (m, 2H), 1.31 (s, 9H). 13C NMR (126 MHz, CDCl3) δ 173.20, 172.99, 172.88, 162.67, 153.68, 153.23, 142.98, 142.14, 141.29, 140.91, 128.86, 128.77, 126.96, 125.38, 125.08, 122.31, 110.87, 110.38, 104.45, 104.01, 44.59, 37.06, 36.62, 31.56, 29.83, 28.95, 28.87, 28.12, 27.36, 26.59, 25.30.
Synthetic schemes for both probes are shown in Supplementary Figure S1, and all relevant ¹H NMR, ¹³C NMR and mass spectrometry spectra are found in Supplementary Figures S2-S4.
Cell culture methods
All cell cultures were routinely incubated in a humidified atmosphere at 37 °C, 5% CO2. Human prostate cancer cell lines LNCaP, 22Rv1, PC-3, DU 145, human benign prostate hyperplasia cell line BPH-1, human benign human prostate stromal cell line BHPrS-1, and non-PCa cancer cell lines HeLa and U-87 were a generous gift from Dr. Simon Hayward (North Shore University Health System, Illinois, USA). LNCaP, 22Rv1, BPH-1 and BHPrS-1 cells were cultured in Roswell Park Memorial Institute (RPMI, WISENT) 1640 medium supplemented with 10% fetal bovine serum (FBS) and 1% penicillin/streptomycin solution (P/S). PC-3 and HeLa cells were cultured in Dulbecco’s Modified Eagle Medium (DMEM, WISENT) medium supplemented with 10% FBS and 1% P/S. DU 145 and U-87 cells were cultured in Eagle's Minimal Essential Medium (EMEM, WISENT) medium supplemented with 10% FBS and 1% P/S.
All cells were authenticated using short tandem repeat (STR) profiling and were routinely tested for mycoplasma contamination using a Mycoplasma Detection Kit (Sigma, USA). All experiments were performed with cells within 20 passages after thawing to ensure consistency and physiological relevance of the results.
Immunofluorescence staining of cells in vitro
LNCaP, 22Rv1, PC-3, DU 145, BPH-1, BHPrS-1, HeLa and U-87 cells were seeded into 12-well plates which contained 18 mm cover slides pretreated with 0.5 M NaOH for 10 min. All these cells were incubated at 37 °C, 5% CO2 for 48 h (cultured to confluency of 50-60%), then fixed with 4% formalin for 10 min. Cells were blocked with 5% goat serum in room temperature for 1 h on a shaker and then incubated with primary antibody at 4 °C overnight in the dark. Primary antibodies against PSMA (Sigma, 3A/12, 1:500) or cyclin B1 (Cell Signaling Technology, 1:500) or isotype IgG (Invitrogen, 1:500) were used as indicated in the figures. Secondary anti-mouse Alexa Fluor 594 (Invitrogen, 1:2000) or anti-rabbit Alexa Fluor 488 (Invitrogen, 1:2000) antibody were diluted in 5% goat serum and incubated with cells in room temperature for 1 h in the dark and then washed 3 times with PBS. Cells were incubated with GUL-Cy5 probe or tBu-Cy5 at a concentration of 0.5 µg/mL at ambient temperature for 30 min and then washed 3 times with PBS. Then the cell membranes were stained with wheat germ agglutinin (WGA)-AF 488 (Invitrogen, 1:500) and the cell nuclei with Hoechst 33342 (Invitrogen, 1:2000) in the dark. Images were taken by confocal laser scanning fluorescence microscopy (Nikon Instruments, Japan). Mean fluorescence intensity (MFI) of cells and Pearson’s correlation coefficient values of channels were calculated by NIS-Element AR Analysis software (Nikon Instruments, Japan). Colocalization analyses for single cells were performed with ImageJ software (NIH, USA).
Western blot analysis
Protein levels of interest such as PSMA were assessed by Western blot/immunoblot analysis. Protein samples were extracted from cultured cells using RIPA lysis buffer (ThermoFisher Scientific, USA) supplemented with 1% of protease and phosphatase inhibitors (ThermoFisher Scientific, USA). Protein concentration of cell lysates was assessed using the Protein Assay Dye Reagent Concentrate (Bio-Rad, USA) and quantified using the Cytation5 spectrophotometer plate reader (Agilent, USA) at 595 nm. Equal amounts of protein (20 µg) from each sample were denatured in Laemmli sample buffer (Bio-Rad, USA) at 95 °C for 10 min and separated by SDS-PAGE on 4-20% or 8% Tris-Glycine gels (Invitrogen, USA) using the Mini Gel Tank (Invitrogen, USA). Following electrophoresis, proteins were transferred onto a 0.2 µm Hydrophobic PVDF membrane (MilliporeSigma, USA) using the Mini Blot Module (Invitrogen, USA) at 25 V for 1 h. The membrane was blocked in 5% skim milk powder in TBS-T for 1 h at room temperature. Primary antibodies against specific target proteins, including anti-PSMA (Cell Signaling Technology, 1:1000), were incubated with the membrane overnight at 4 °C with gentle shaking. After a triple wash with TBS-T, the membrane was probed with HRP-conjugated secondary antibodies (Cell Signaling Technology, USA) at a dilution of 1:8000 for 1 h at room temperature. GAPDH HRP-conjugated antibody (ABclonal, 1:5000) required only overnight incubation at 4 °C with gentle shaking and then triple washed with TBS-T. Protein bands were visualized using the UltraScence Western Substrate (FroggaBio, CA) and imaged with the ChemiDoc Imaging System (Bio-Rad, USA). Quantitative analysis of the bands was performed using ImageJ software (NIH, USA). All Western blot experiments were performed in triplicate and non-cropped representative images are shown.
Lentiviral transduction
Lenti ORF Clone encoding the PSMA (FOLH1) open reading frame (ORF) was verified by sequencing (Table S1). The plasmids were amplified from chloramphenicol-selected E. coli and extracted using the Presto Mini Plasmid Kit (FroggaBio, CA). Lentiviral particles were generated in HEK293T cells via co-transfection with the Lenti ORF plasmid and packaging plasmids (pMD2.G and psPAX2) using JetPrime transfection reagent (PolyPlus, France). Viral particles were harvested 48-72 h post-transfection, filtered, and then used to transduce BPH-1 cells at an optimized multiplicity of infection (MOI) with polybrene (9 µg/mL) to enhance transduction. Transduced cells were selected with puromycin (1.0 µg/mL) and then cultured with routine medium containing puromycin (0.2 µg/mL). Overexpression of PSMA in transduced cells was confirmed by Western blot.
Lentivirus plasmid pLVX-ZsGreen-1-N1 (Takara Bio, Japan, Table S3) was co-transfected into HEK-293T cells with pMD2.G (Addgene, USA) and psPAX2 (Addgene, USA) plasmids following the same aforementioned protocol. 22Rv1 cells were transduced with ZsGreen lentiviral particles and puromycin was used to select (1.25 µg/mL) and to maintain (0.2 µg/mL) routine selective pressure for resistant colonies (22Rv1-ZsGreen). Transduction efficiency was confirmed by quantitative analysis using a Cytation5 spectrophotometer plate reader at brightField and GFP channels.
siRNA knockdown of FOLH1
siRNAs targeting the mRNA of FOLH1 (siFOLH1) and a Universal Scrambled Negative Control siRNA (siCON) were used in knockdown of FOLH1. For transfection, 22Rv1 cells were seeded into 6-well plates and allowed to reach 50-70% confluency. 22Rv1 cells were incubated with 10 nM or 20 nM siFOLH1/siCON and JetPrime transfection reagent for 24 h. PSMA protein levels were measured at 48-72 h post-transfection by quantitative Western blot analysis.
Binding affinity assessment by flow cytometry
 22Rv1 (PSMA-positive control) and BPH-1 (PSMA-negative control) cells were used to perform GUL-Cy5 and PSMA APC-conjugated mAb (Miltenyi Biotec, Germany) binding affinity assessment via flow cytometry [15]. Cells were harvested using 5 mM EDTA and washed twice with ice-cold PBS. Ice-cold FACS buffer (PBS, 1% BSA, 0.1% NaN3, 4 mM EDTA) was used to resuspend cells at a concentration of 5 × 10⁶ cells/mL. Serially diluted GUL-Cy5 and APC-conjugated anti-PSMA mAb in FACS buffer were added to cells at concentrations ranging from 1 nM to 1 mM and 0.2 µg/mL to 20 µg/mL, respectively. Cells were incubated at 4 °C for 1 h in the dark. After incubation, cells were washed three times with ice-cold FACS buffer to remove unbound ligand/antibody and analyzed on a BD FACSymphony A5 SE Cell Analyzer (BD Biosciences, USA). Each concentration was tested in triplicate and MFI for Cy5 channel (R660-A) was obtained. Specific binding units were calculated using Eq. (1) below and used to plot the binding curves. The apparent dissociation constant (KD) was determined by fitting the binding curves to a one-site binding model using nonlinear regression analysis in GraphPad Prism 9 (GraphPad Software, USA).


Immunoprecipitation and LC-MS assessment
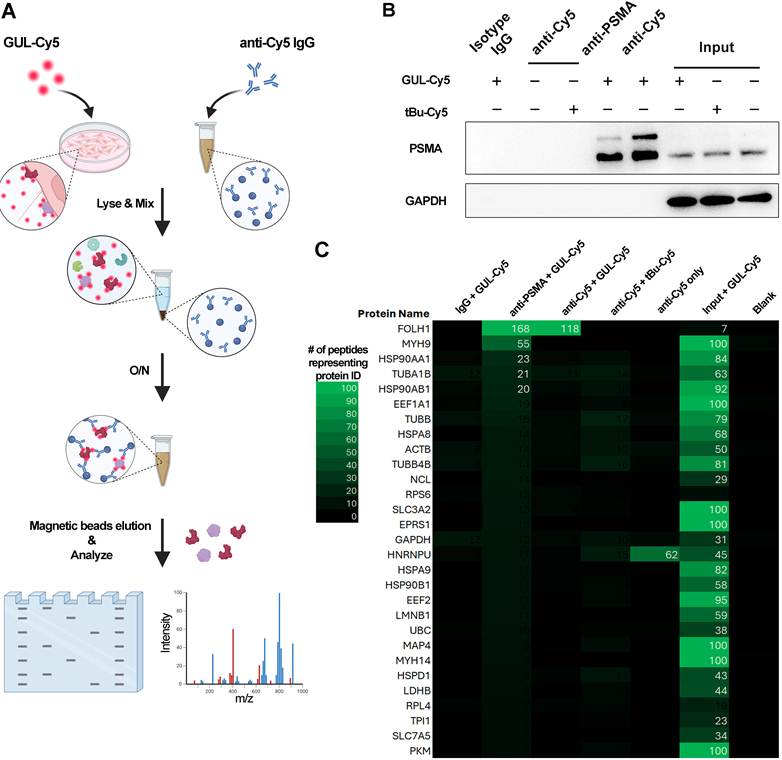
An indirect pulldown immunoprecipitation method using anti-Cy5 mAb is illustrated in Figure 4A. 22Rv1 cells were plated into 10 cm plates at 70-80% confluency in advance. Three plates of cells with similar growth status were selected for experimentation. Culture media for each were replaced with complete medium (CM), CM + 5 µg/mL GUL-Cy5 and CM + 5 µg/mL tBu-Cy5, respectively. After overnight incubation, protein samples were extracted from them using RIPA buffer (RIPA lysis buffer supplemented with 1% of protease and phosphatase inhibitors). The protein concentration of each sample was determined using the Pierce Bradford Protein Assay Kit (ThermoFisher Scientific, USA). Meanwhile, 20 µL of Protein G magnetic beads (New England BioLabs, USA) for each microcentrifuge tube was used to separately conjugate isotype IgG, anti-PSMA (3/E7) and anti-Cy5 antibodies after being washed with ice-cold PBS twice. The concentration for each antibody was 4 µg/mL. After overnight incubation in a 4 °C cold room, the remaining liquid was carefully aspirated and the beads were washed twice for 10 min using ice-cold RIPA buffer. Cell lysates were then mixed with the beads conjugated to either isotype IgG, anti-PSMA or anti-Cy5 antibodies. The amount of protein for each tube was 1 mg balanced with RIPA buffer. After overnight mixing on a rotating shelf (ThermoFisher Scientific, USA) in a cold room, the remaining liquid was aspirated, and beads were subsequently washed using ice-cold RIPA buffer on a chilled magnetic rack (Invitrogen, USA). Beads were then eluted with 20 mL mixture of RIPA buffer and Laemmli sample buffer (Bio-Rad, USA) (1:1) at 95 °C for 10 min. After centrifugation at 14,000 rpm for 5 min in a cold room, the eluate was collected as the supernatant by placing the beads mixture on a magnetic rack. Equal volume of eluate from each sample was then separated by SDS-PAGE on 8% Tris-Glycine gels using the Mini Gel Tank. After electrophoresis, the mini-gel was rinsed 3 times for 5 min with 50 mL deionized water to remove SDS and buffer salts and then stained with 30 mL InstantBlue Coomassie Protein Stain (Abcam, UK) for 1 h at room temperature with gentle shaking. Coomassie stained gels were triple washed for 1 h with 50 mL deionized water and protein bands of interest on different lanes were excised with a sharp sterile scalpel using a protocol from the SPARC BioCentre (SickKids, CA). All gel bands were covered with 1% acetic acid and shipped immediately to the SPARC BioCentre at 4 °C for proteomics mass spectrometry analysis. Another sister gel not used for Coomassie staining was submitted to immunoblot analysis for detection of PSMA or GAPDH protein. The aforementioned procedures were all performed in a qualified biological safety cabinet, with operator worn masks, medical protective cap and double-layer gloves to avoid any potential protein contamination.
PSMA expression mouse xenograft and IVIS imaging
Male athymic NOD-SCID male mice aged 5-6 weeks were purchased from (Charles River, USA) and housed in SPF conditions. Human prostate cancer cell lines 22Rv1 cells were maintained in a satisfactory condition before the harvest for injection. 22Rv1 cells were harvested and washed twice with D-PBS before being resuspended in a mixture of D-PBS/Matrigel at a ratio of 1:1 to a density of 2 × 10⁶ cells/mL. Cell suspension was injected into the right flank region and tumor growth was monitored by measuring the tumor size every 3 days using a digital caliper. Tumor volume was calculated using the following formula:

Xenografts were grown to 1,500-2,000 mm3 and prepared for imaging. GUL-Cy5 and tBu-Cy5 were prepared by dissolving in saline to concentrations of 5 mg/kg and 0.5 mg/kg for high-dose and low-dose group, respectively. Mice were restrained in a restraint holder device and the tail veins were warmed under a heat lamp for 5 min. Probe solution or saline was then slowly injected into the lateral tail vein with 100 µL per mouse. In vivo imaging for all mice was performed at five timepoints (t = 1, 2, 4, 10, 24 h) with the Newton 7.0 In vivo Imaging System (Scintica Inc., London, ON). Each mouse was anesthetized with isoflurane during tumor cell injection and in vivo imaging. All animal experiments were performed in accordance with Sunnybrook IACUC guidelines and ethical approval was obtained (Approval number: 24873). All whole body in vivo imaging data was acquired and analyzed by Kuant software (Vilber Inc., London, ON). IVIS images were analyzed with Kuant software by generating an ellipse that covers the majority of the tumor found on the right flank side designated as the tumor ROI (red). This ROI was duplicated, called the background ROI and then placed contralaterally to the tumor without placing it over the left kidney. Using the Kuant software, average radiant efficiency was collected within each ROI. These values were used to determine the tumor to normal tissue ratio.
Cell sorting and ex vivo chick embryo preclinical model
22Rv1-ZsGreen cells were harvested and washed twice with PBS. Cells were resuspended in FACS buffer at a density of 5 × 10⁶ cells/mL. Cell sorting was carried out on a BD FACSAria™ Fusion Flow Cytometer (BD Biosciences, USA). The 22Rv1-ZsGreen subpopulation with the highest expression level of ZsGreen (top 1.3%) was sorted based on fluorescence intensity of GFP B530/30. Sorted 22Rv1-ZsGreen cells were collected into tubes containing RPMI 1640 medium supplemented with 10% FBS and 0.2 µg/mL puromycin and expanded for downstream experiments such as the ex vivo chick embryo pre-clinical model.
22Rv1-ZsGreen cells were expanded in vitro and subsequently harvested and pelleted with centrifugation at 200 × g for 10 min at room temperature. Cells were then diluted to a concentration of 1 × 10⁵ cells/mL and then injected into the chorioallantoic membrane (CAM) of Embryonic Day 9 of chick embryos with a microinjection needle fabricated as described in [16,17]. This injection results in a bolus of cancer cells implanted within the cell layers of the CAM and they are then allowed to grow for several days until the time of intravital imaging.
At t = 4 days post-injection of cancer cells (also Day 13 of embryonic development), intravenous injections of GUL-Cy5 or tBu-Cy5 probe were performed at various concentrations. This consisted of 100 µL injections of each probe at either 0.5 or 5.0 mg/kg in PBS vehicle. Intravital imaging was performed with a Nikon A1R Fast resonance scanning confocal microscope (Nikon, Japan) as described in our previous work [17,18]. Specifically, a 20× and 60× oil immersion objective lens was used to capture images from 2 different fluorescent channels representing ZsGreen (500-520 nm wavelength), and Cy5 (640-660 nm wavelength). Nyquist sampling was used to ensure confocality of acquired images. Nikon Elements software (Nikon, Japan) was used to acquire and process all images. Images were acquired at t = 6 and t = 24 h post-injection of probe for each concentration. Embryos were placed within a 37 °C incubator when not actively being imaged.
Cell cycle analysis
22Rv1 cells were seeded on coverslips in two 12-well plates. Cells in one plate were treated with 2 µg/mL mitomycin C overnight in the dark after reaching 60% confluency. Fixation, blocking, and incubation with primary, secondary antibodies, as well as GUL-Cy5 probe incubation and nucleus staining with Hoechst 33342, were performed according to the protocol described earlier. Primary antibodies against PSMA (Sigma, 3A/12, 1:500) and cyclin B1 (Cell Signaling Technology, 1:500) were used for immunostaining. For cell cycle flow cytometry, 22Rv1-ZsGreen cells were cultured in two 10 cm plates, one was treated with 2 µg/mL mitomycin C overnight in the dark after reaching 60% confluency. Cells were prepared and harvested using the Click-iT™ Plus EdU Pacific Blue™ Flow Cytometry Assay Kit (Invitrogen, USA) as per the manufacturer’s instructions with GUL-Cy5 incubation at 20 µg/mL for 30 min post-harvest. Cell analysis was performed using a BD FACSymphony A5 SE Cell Analyzer (BD Biosciences, USA) and data were analyzed using FlowJo™ v10.10 (BD Biosciences, USA).
In vitro live cell microscopy for GUL-Cy5 uptake
22Rv1-zsGreen cells were seeded in 6 well plates to achieve 60% confluency within 2 days of culture. Wells were incubated with various concentrations of GUL-Cy5 to achieve a final concentration of 0.025 µg/mL in triplicate with a vehicle (DMSO, 5% v/v in ddH20) control. Plates were immediately placed into the Incucyte SX5 live microscopy instrument (Sartorius, Göttingen, Germany). Incubation conditions were 37 °C and image acquisition settings were 1024×1024 pixel images in the Cy5 channel and brightfield channel using a 10× objective. Images in each channel were obtained every 15 min over the course of 24 h. Image analysis was performed using ImageJ software (NIH, Bethesda). Time-lapse videos were processed using the Stack registration plugin to align the cells within the video. The mean signal within each timepoint was quantitated by manual segmentation of the cell boundary subtracted by the mean signal of background which was defined as a non-cell area of similar segment size in that timepoint.
Single cell RNA transcriptomics of 22Rv1 cells
22Rv1 cells were seeded in 6 well plates to achieve 60% confluency within 2 days of culture and harvested with trypsin-EDTA. Cells were resuspended in 90% FBS + 10% DMSO and stored at 4 °C until loaded into the GEM-X OCM 3’ Chip; 4-plex v4 Kit (10x Genomics Inc., CA). The GEM-X Universal 3’ Gene Expression v4 reagent kit was used for RNA library generation (10x Genomics Inc., CA). RNA library preparations were sequenced at the Centre for Applied Genomics (SickKids Hospital, ON) using the Illumina NovaSeqX (Illumina Inc., CA).
Raw sequencing data from 10x Genomics single-cell RNA-seq libraries were processed using Cell Ranger (v10.0, 10x Genomics Inc., CA). FASTQ files were analyzed using the Cell Ranger count pipeline with default parameter settings. Reads were aligned to the GRCh38 reference genome using the STAR-based aligner implemented within Cell Ranger. The pipeline performed cell barcode demultiplexing, UMI collapsing, and gene expression quantification to generate gene count matrices. Cell-associated barcodes were identified using the default Cell Ranger cell-calling algorithm. The resulting filtered feature–barcode matrices were used for downstream analyses.
Filtered feature, barcode matrices generated by Cell Ranger were used for downstream single-cell RNA-seq analysis in Seurat. Cells expressing fewer than 200 genes or with elevated mitochondrial gene content were excluded with sample-specific thresholds applied to remove low-quality cells and potential doublets. Mitochondrial gene expression was quantified based on transcripts encoded by the mitochondrial genome.
Gene expression values were normalized using a global-scaling normalization approach followed by log transformation. Highly variable genes (n = 3,000) were identified for each dataset and used for downstream integration. To correct for batch effects across samples, datasets were integrated using an anchor-based integration approach. Integration features were selected from the variable genes, and shared correlation structures across datasets were used to align cells into a common expression space. The integrated data were scaled and subjected to principal component analysis. A shared nearest-neighbor graph was constructed using the top principal components, and cells were clustered using a graph-based clustering approach. Uniform Manifold Approximation and Projection (UMAP) was used for visualization of the low-dimensional embedding.
Gene expression patterns were visualized using multiple approaches, including feature-level embedding plots, violin plots, and dot plots. Average gene expression per cluster was also calculated. In addition, cluster-specific gene–gene associations were assessed using Spearman correlation analysis, performed on normalized expression values with a minimum cell threshold applied per cluster.
Statistical analysis
All statistical analyses were performed using GraphPad Prism 9 and FlowJo™ v10.10. Data are presented as mean ± standard error (SEM) unless otherwise specified. The apparent dissociation constant (KD) was calculated by fitting the binding curves to a one-site binding model using nonlinear regression analysis. Group comparisons were conducted using two-way ANOVA with a Bonferroni correction applied to adjust for multiple comparisons. Statistical significance was set at p < 0.05, with specific significance levels indicated where appropriate.
Results
GUL-Cy5 and its isotype control tBu-Cy5
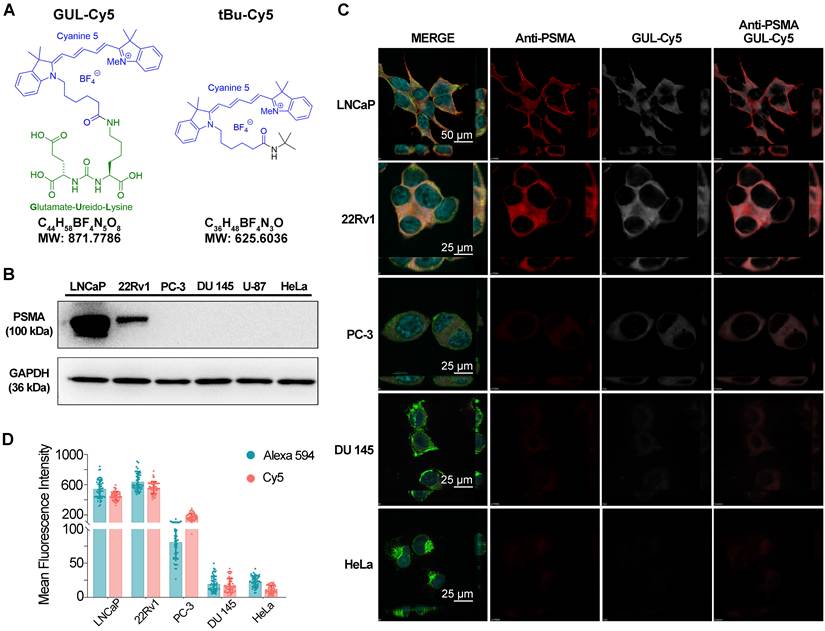
GUL-Cy5 is the Cyanine5 (Cy5) analogue of the GUL-Cy3 fluorescent probe [4]. It consists of a Glutamate-Ureido-Lysine (GUL) moiety with a Cy5 fluorescent moiety attached by an amide bond to the ε-nitrogen of the lysine (Figure 1A, left chemical structure); we have previously shown that such GUL-based probes bind to PSMA [4]. Development of an isotype control for GUL-Cy5 consisted of replacing the flexible, highly polar GUL moiety with a sterically bulky non-polar tert-butyl group (tBu-Cy5, Figure 1A, right chemical structure).
Binding characteristics of GUL-Cy5 probe and its isotype control tBu-Cy5 in PSMA-expressing cell lines. A. Chemical structure of the GUL-Cy5 probe and its isotype control, tBu-Cy5. Blue coloration denotes the Cy5 fluorophore, green denotes the GUL warhead. B. Western immunoblot for protein levels of PSMA (gene name: FOLH1) in various cell lines. C. Immunofluorescence images of various prostate and non-prostate cell lines immunostained with anti-PSMA mAb (red channel), GUL-Cy5 (white channel), wheat germ agglutinin (green channel, membrane stain), and Hoechst (blue channel, nucleus stain). Scale bars are 25 and 50 µm. D. Mean fluorescence intensity of 50 cells per cell line in Alexa 594 channel (0.5 µg/mL anti-PSMA mAb, blue columns) and Cy5 channel (0.5 µg/mL GUL-Cy5, red columns).
GUL-Cy5 probe binds to PSMA-expressing cell lines
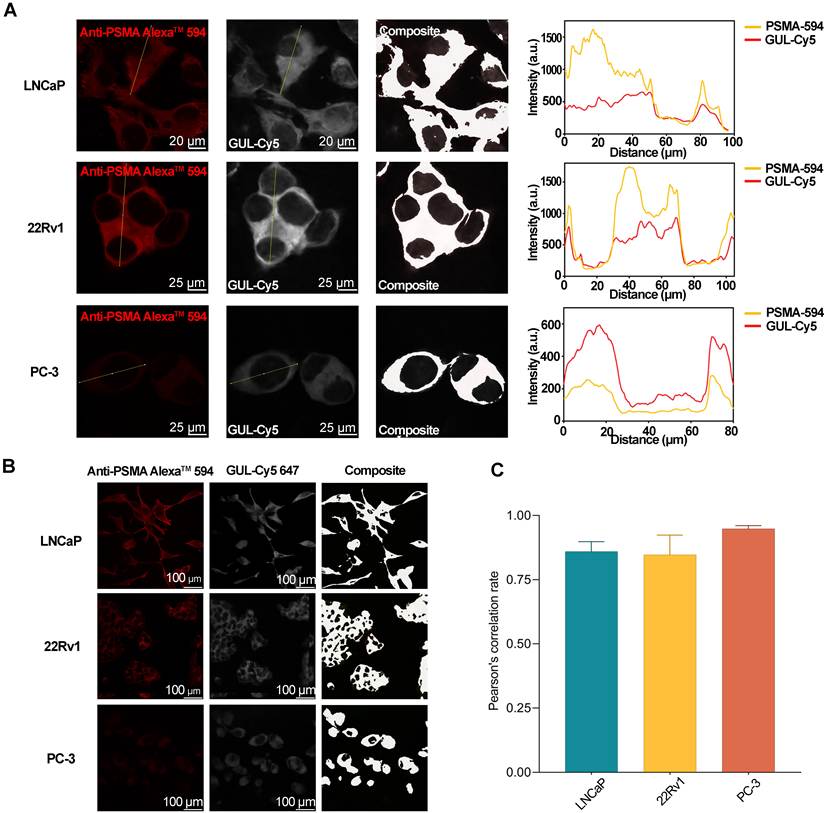
Not all established prostate cancer cell lines express FOLH1 mRNA (Supplementary Figure S5) or PSMA protein (gene name: FOLH1, protein atlas: PSMA; Figure 1B); hence, the GUL-Cy5 probe should bind to these cell lines in a correlative fashion and the isotype binding control, tBu-Cy5, should not bind to these cell lines. An important consideration, although unlikely, is that strong non-specific Cy5 binding is possible due to hydrophobic absorption; any such effect would be amplified for the isotype control (tBu-Cy5) as the “dummy” t-butylated warhead (tBu) is more hydrophobic than GUL. If background absorption to lipid membranes or structural proteins is a significant source of noise, then it would be anticipated to be greater for the negative control than for the labeled GUL probe. Under non-permeabilized conditions, immunofluorescence staining with anti-PSMA mAb (clone 3/A12) revealed a similar trend as FOLH1 mRNA levels as shown in Figure 1C. Immunoreactivity of anti-PSMA mAb (red channel, Figure 1C) was observed in LNCaP and 22Rv1 cell lines whereas moderate signal was observed in PC-3 (Figure 1C, Supplementary Figure S6A) and BPH-1 cell lines (Supplementary Figure S6A-B). Low signal was observed in the HeLa and DU 145 cell lines (Figure 1C) as anticipated via their PSMA protein levels (Figure 1B). In terms of GUL-Cy5 immunoreactivity, Cy5 signal (white channel, Figure 1C) for each cell line was consistent with signal representing anti-PSMA mAb immunoreactivity (red channel). tBu-Cy5 did not bind to any of the cell lines tested (Supplementary Figures S6, S7). Quantitative analysis of anti-PSMA mAb and GUL-Cy5 signal for all cell lines revealed the highest specificity of both anti-PSMA mAb and GUL-Cy5 to LNCaP and 22Rv1 cell lines (Figure 1D). Both anti-PSMA mAb based signal and GUL-Cy5 based signal were specific to the cell surface of LNCaP, 22Rv1 and PC-3 cells, and closely mirrored each other in the peaks and troughs observed in the single-cell colocalization analysis (Figure 2A). Colocalization analysis of GUL-Cy5 and anti-PSMA mAb signal indicated that GUL-Cy5 performed equivalently to anti-PSMA in both high- and low-expressing PSMA cell lines such as LNCaP and PC-3 (Figure 2B). Pearson’s correlation coefficient values for anti-PSMA mAb signal vs. GUL-Cy5 signal in these cell lines exceeded 0.80 (Figure 2C). The lack of signal for the tBu-Cy5 implies that meaningful background off-target binding (i.e., to lipid membranes) is unlikely for GUL-Cy5.
Colocalization of anti-PSMA and GUL-Cy5 binding in PSMA-expressing cell lines. A. Colocalization analysis of single cells in LNCaP, 22Rv1 and PC-3 cell lines immunostained with anti-PSMA Alexa™ 594 (red channel, left panel) and GUL-Cy5 (white channel, middle panel). Composite images (right panel) generated using the Colocalization Finder plugin in ImageJ. Yellow lines indicate regions used for intensity analysis across single cells. Intensity profiles (right graphs) of anti-PSMA Alexa™ 594 (yellow) and GUL-Cy5 (red) along selected lines. Scale bars are 25 µm. B. Composite images (right column) generated using the Colocalization Finder plugin in ImageJ. Scale bars are 100 µm. C. Pearson’s correlation rate of colocalization between anti-PSMA Alexa™ 594 and GUL-Cy5 across the aforementioned cell lines that express different levels of PSMA protein.
Binding specificity of GUL-Cy5 probe corresponds to genetically manipulated levels of PSMA
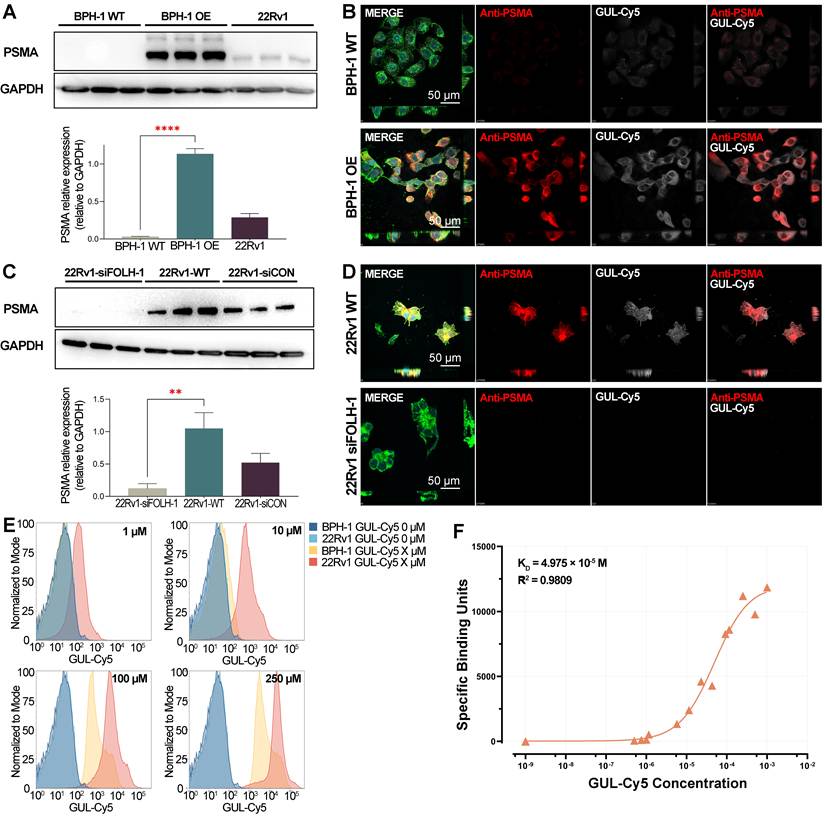
PSMA is absent from the BPH-1 cell line and therefore we used this cell line to overexpress PSMA with lentivirus to insert a FOLH1 mRNA expression cassette driven by a CMV promoter (Supplementary Figure S8), resulting in BPH-1 OE cells as per Western immunoblot analysis (Supplementary Figure S8A) and immunofluorescence staining (Supplementary Figure S9). In Figure 3A, Western immunoblot analysis confirmed high PSMA protein levels in the BPH-1 OE cell line (middle three lanes) relative to the BPH-1 and 22Rv1 cell lines. Quantitative analysis of PSMA protein expression relative to GAPDH revealed significant differences (p < 0.0001) between the BPH-1 OE and BPH-1 cell lines (Figure 3A bottom graph). Immunofluorescence analysis performed with anti-PSMA mAb and GUL-Cy5 revealed higher GUL-Cy5 immunoreactivity to BPH-1 OE relative to BPH-1 cell line and this was consistent with the immunoreactivity of anti-PSMA mAb in both (Figure 3B). The 22Rv1 cell line has high expression levels of PSMA protein and the highest immunoreactivity to GUL-Cy5 (Figure 1D). Hence, we used siRNA of FOLH1 to knockdown PSMA in this cell line. The screening and titration experiments for siRNA were conducted first, accompanied by immunoblotting and qPCR validation (Supplementary Figures S8A-B), with 20 nM of siFOLH-1-B ultimately identified as the optimal concentration for FOLH1 mRNA knockdown. 22Rv1 siFOLH1 cells (first three lanes from left) lacked detectable levels of PSMA relative both to 22Rv1 and 22Rv1 siCON as per the immunoblot in Figure 3C. Quantitative analysis of PSMA protein levels relative to GAPDH also revealed significant differences (p < 0.01) between the 22Rv1 siFOLH1 and 22Rv1 cell lines (Figure 3C bottom graph). Relative to 22Rv1 and 22Rv1 siCON (Supplementary Figure S9C), only the 22Rv1 siFOLH1 cell lines showed no detectable signal by immunofluorescence analysis using anti-PSMA mAb and GUL-Cy5 (Figure 3D).
Binding specificity and affinity of GUL-Cy5 probe correlate with PSMA expression levels. A. Immunoblot analysis of BPH-1 cell line genetically manipulated to overexpress PSMA (BPH-1 OE) relative to BPH-1 and 22Rv1 cell lines. * denotes p < 0.01, 2-way ANOVA, Bonferroni alpha correction. B. Immunofluorescence images of BPH-1 WT and BPH-1 OE cells immunostained with GUL-Cy5 (0.5 µg/mL) and anti-PSMA mAb (0.5 µg/mL). Scale bars are 50 µm. C. Immunoblot analysis confirming siRNA knockdown of PSMA/FOLH1 in the 22Rv1 cell line (siFOLH-1) relative to its controls (WT and siCON). * denotes p < 0.01, 2-way ANOVA, Bonferroni alpha correction. D. Immunofluorescence images of 22Rv1-siFOLH-1 and 22Rv1-siCON cells immunostained with GUL-Cy5 (0.5 µg/mL) and anti-PSMA mAb (0.5 µg/mL). Scale bars are 50 µm. E. Binding of GUL-Cy5 to the corresponding PSMA-negative (BPH-1) and PSMA-positive (22Rv1) cell lines in concentrations ranging from 0 µM to 250 µM. F. Direct binding-saturation graph for cell-based flow cytometry measurements with KD and R2 values for GUL-Cy5 probe using PSMA-negative and PSMA-positive cell lines.
Fluorescence intensity of GUL-Cy5 probe signal corresponds to levels of PSMA in cell lines
Measurement of the GUL-Cy5 probe’s affinity to PSMA protein by a cell-based method [15] requires the use of PSMA-positive control (22Rv1) and negative control (BPH-1) cell lines over a broad range of titration gradients. In Figure 3E, increasing binding of GUL-Cy5 to 22Rv1 cells was observed at titration concentrations exceeding 1 µM. No binding of GUL-Cy5 to BPH-1 was observed in titrations lower than 100 µM. The BPH-1 cell line lacks PSMA expression but exhibited the highest binding preference among PSMA-negative cell lines as per binding analysis (Supplementary Figure S6) and the MFI quantitative analysis (Figure 1D). Thus, the oversaturation or nonspecific binding of GUL-Cy5 at high concentrations may account for the significant shifts in binding peaks with BPH-1 cells at 100 µM and 250 µM. The binding affinity of the GUL-Cy5 probe to PSMA was quantified using specific binding units (SBU) calculated using Eq. (1) from flow cytometry data, yielding a dissociation constant (KD) of 4.975 × 10⁻⁵ M with R2 value of 0.9809, as per the binding curves in Figure 3F. This indicates strong binding affinity of GUL-Cy5 to PSMA protein.
PSMA is the main immunoprecipitant of GUL-Cy5
An indirect immunoprecipitation method was used whereby an anti-Cy5 IgG mAb would pulldown any GUL-Cy5/tBu-Cy5 protein complexes. In this approach, we could immediately pulldown any immunoprecipitants of GUL-Cy5/tBu-Cy5 without incurring target bias. The methodology is presented in Figure 4A, wherein 22Rv1 cells were first incubated with the probe of interest (GUL-Cy5) or its control (tBu-Cy5). After overnight incubation, the cell lysates were then immunoprecipitated with either isotype IgG control, anti-PSMA IgG mAb (3E7 clone), or anti-Cy5 IgG mAb. Eluates were then submitted to immunoblot analysis for detection of PSMA or GAPDH protein (Figure 4B). Eluates from any other controls and inputs were also submitted to Coomassie blue staining and immunoblot analysis in Supplementary Figure S10. Immunoprecipitants were detected in high amounts in cell lysates incubated with GUL-Cy5 and pulled down with either anti-PSMA IgG (fourth lane from the left) or anti-Cy5 IgG (fifth lane from the left). Controls were clean as evidenced by the absence of PSMA protein under any other combination of probe/pulldown reagent (first three lanes from left), suggesting that the anti-Cy5 pulldown of immunoprecipitants was successful and that PSMA is present. To determine whether any other proteins can bind to GUL-Cy5, we submitted all immunoprecipitants in Figure 4A to mass spectrometry. As shown in the heatmap in Figure 4C (representing peptide abundance for each protein), high levels of PSMA were present in the GUL-Cy5+anti-Cy5 pulldown combination (third column from left). This was further confirmed by a similarly high abundance of PSMA protein in the GUL-Cy5+anti-PSMA pulldown combination (second column from left). No other proteins were detected in the GUL-Cy5+anti-Cy5 pulldown combination whereas there were still some additional proteins such as MYH9, HSP90AA1, TUBA1B and HSP90AB1 that co-immunoprecipitated with PSMA in the GUL-Cy5+anti-PSMA pulldown combination. However, these are at a significantly lower magnitude than PSMA. All other controls were devoid of any protein of interest.
IP-Mass Spectrometry of GUL-Cy5, tBu-Cy5, and anti-PSMA IgG with 22Rv1 cell lysates. A. Schematic representation of immunoprecipitation (IP) pulldown with anti-Cy5 antibody (clone name: CY5-15). B. Proteins obtained from pulldowns and controls were submitted to immunoblot analysis to confirm PSMA immunoreactivity. C. Heatmap from LC-MS reveals relative abundance and absolute number of peptides representing each protein hit.
GUL-Cy5 probe uptake by PSMA-expressing mouse xenografts
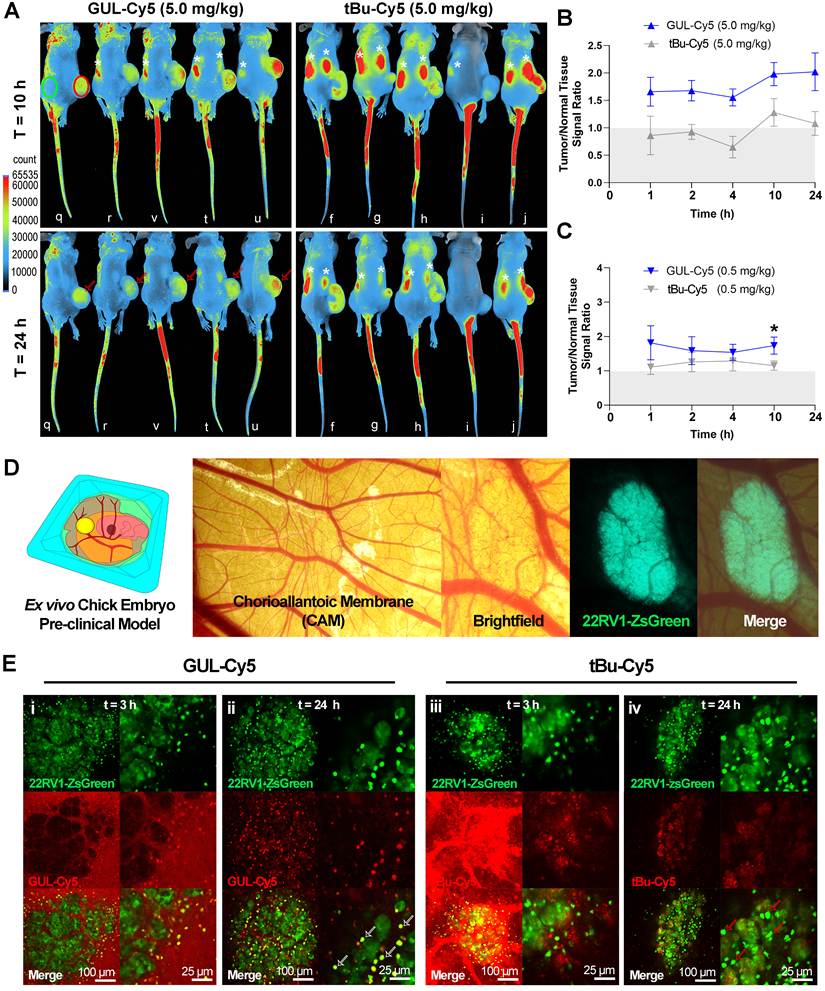
Pharmacokinetic studies of the GUL-Cy5 and its isotype control, tBu-Cy5, used 22Rv1 human prostate cancer xenografts in athymic NOD-SCID male mice. Xenografts were formed at the right flank and grown to 1,500-2,000 mm3. GUL-Cy5 probe tumor uptake was observed as early as 1 h post-IV injection and the tumor versus normal tissue ratio increased over the 24-h timeframe (Figure 5A). Bilateral uptake of both types of probe at either dose was observed at early timepoints, which allowed us to identify areas of the body for normal tissue and non-kidney signal acquisition to determine the tumor/normal tissue signal ratio. At t = 10 and t = 24 h post-IV injection, kidney uptake of GUL-Cy5 probe was minimal compared to the tBu-Cy5 probe (Figure 5A). tBu-Cy5 probe was high at t = 10 h but dropped below tumor signal at later timepoints (Figure 5B-C). Given the accumulation of tBu-Cy5 probe at the kidneys at t > 10 h, IVIS images of the probe are best interpreted at t = 10 and t = 24 h.
Intravital imaging of 22Rv1-ZsGreen xenografts to quantitate PSMA-specific uptake of GUL-Cy5 probe in various pre-clinical models. A. IVIS fluorescence images of 22Rv1 tumor-bearing mice after tail vein injection of GUL-Cy5 (5.0 mg/kg) and its isotype tBu-Cy5 (5.0 mg/kg) at 10 h and 24 h. Red, green and blue denote the areas with high, medium and low fluorescent intensity. The location of mice kidneys (normal tissue) and tumors were indicated by white stars and red arrows respectively. Red ellipse denotes the ROI for tumor average radiant efficiency. Green ellipse denotes the ROI for background average radiant efficiency. B, C. Comparative quantitative analysis of GUL-Cy5 and tBu-Cy5 uptake by tumor and normal tissue in high-dose (5.0 mg/kg, upper graph) and low-dose (0.5 mg/kg, lower graph). * denotes p < 0.01, 2-way ANOVA, Bonferroni alpha correction. D. Diagram of ex vivo chick embryo pre-clinical model and in vivo fluorescence imaging of 22Rv1-ZsGreen tumor-bearing chick embryo. BF image (middle panel) denotes the vascular circulation around the tumor. FITC image (second right panel) denotes the location of 22Rv1-ZsGreen tumor. E. Intravital images of the primary tumor where individual tumor cells are visualized over time (i and iii = 3 h; ii and iv = 24 h) when injected with 5.0 mg/kg GUL-Cy5 (panels i, ii) or 5.0 mg/kg tBu-Cy5 (iii, iv). Cells with uptake of GUL-Cy5 are indicated by white arrows in ii. Cells with no uptake of tBu-Cy5 are indicated by red arrows in iv.
GUL-Cy5 probe is taken up by PSMA-expressing xenografts at single-cell resolution
We formed prostate cancer xenografts with the ex vivo chick embryo model in order to determine uptake of GUL-Cy5 at the single cell level using intravital imaging with resonance scanning confocal microscopy (Figure 5D). Chick embryos were chosen because intravital imaging of single prostate cancer cells is technically challenging in murine pre-clinical models [16,17,19]. A 22Rv1 human prostate cancer line variant that overexpresses ZsGreen fluorescent protein (22Rv1-ZsGreen) was used to form xenografts that were ~0.5-2.0 mm in diameter (Figure 5D, right side panels). In Figure 5E, intravenous injection of GUL-Cy5 at 5.0 mg/kg revealed uptake of the probe in rounder and smaller sized 22Rv1-ZsGreen cells within clusters of cancer cells as visualized by intravital imaging at t = 3 h post-injection (yellow co-localization signal). A high amount of background was observed throughout the metastatic colony microenvironment due to high circulating levels of the GUL-Cy5 probe (Figure 5E, panel i, red channel) at this early timepoint. At t = 24 h post-injection, the background signal had significantly decreased while cells at the tumor periphery remained fluorescently labeled due to GUL-Cy5 uptake (yellow co-localization signal, Figure 5E, panel ii).
Intravenous injection of the isotype control tBu-Cy5 was also performed with 22Rv1-ZsGreen tumors. At t = 3 h post-injection, tBu-Cy5 signal was present throughout the entire microenvironment and microvessels surrounding the tumor (Figure 5E, panel iii). No specific uptake of probe was observed by any 22Rv1-ZsGreen cells (red arrowheads). At t = 24 h post-injection, there was minimal background signal throughout the microenvironment and microvasculature and minimal signal within the smaller sized 22Rv1-ZsGreen cells within or at the periphery of the tumor, thought to be proliferating (Figure 5E, panel iv, red arrowheads).
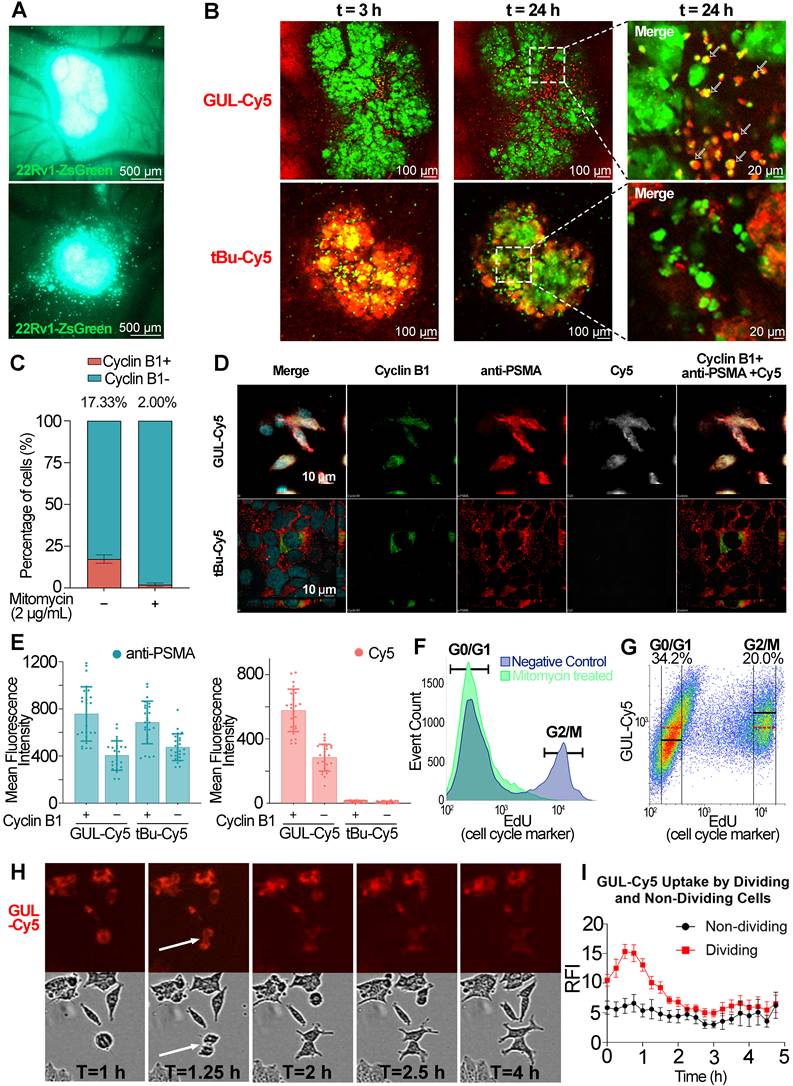
The ex vivo chick embryo model can also be used to image metastases when metastatic cancer cells are intravenously injected to form metastases as previously described [16]. In this experimental metastasis model, a proportion of metastases that were > 100 µm were formed at t = 6 days post-injection of 22Rv1-ZsGreen cells. The largest ones were used to perform intravital imaging to also determine if proliferating cells within metastases preferentially internalized GUL-Cy5 probe over the tBu-Cy5 probe. In Figure 6A, these large metastases had round cells at all timepoints imaged. At t = 24 h post-injection of GUL-Cy5, these round cells exhibited high levels of uptake as evidenced by the yellow signal representing co-localization of the ZsGreen signal and the GUL-Cy5 signal (Figure 6B, top panel). In contrast, the tBu-Cy5 signal did not reveal uptake as evidenced by the lack of yellow co-localization signal (Figure 6B, bottom panel). These intravital imaging experiments demonstrate that round cells preferentially internalize the GUL-Cy5 probe within primary tumor xenografts and metastases.
Intravital imaging of 22Rv1-ZsGreen xenografts to quantitate uptake of GUL-Cy5 probe in cells across cell cycle phases. A. In vivo fluorescence intravital imaging of 22Rv1-ZsGreen tumor-bearing chick embryo. The green signal denotes the location of 22Rv1-ZsGreen tumor. Scale bars are 200 µm. The top image is the stereoscopic image of the same tumor in the top panel in B. The bottom image is the stereoscopic image of the same tumor in the bottom panel in B. B. In vivo fluorescence intravital confocal images (green: 22Rv1 tumor cells; red: GUL-Cy5/tBu-Cy5 probes) at t = 3 and 24 h post-injection of GUL-Cy5 (5.0 mg/kg) and tBu-Cy (5.0 mg/kg). White arrows denote individual tumor cells of a smaller size. Scale bars are 20 and 100 µm. C. Cell cycle analysis of 22Rv1 cells after 0 µM and 2 µM of Mitomycin C treatment. D. Immunofluorescence confocal images of 22Rv1 cells immunostained with anti-Cyclin B1 mAb (green channel, second left panel), anti-PSMA mAb (red channel, middle panel) and GUL-Cy5/tBu-Cy5 (white channel, second right panel). Scale bars are 10 µm. E. Mean fluorescence intensity of 25 cells for Cyclin B1 positive and negative in Alexa 594 channel (anti-PSMA mAb, left histogram) and Cy5 channel (GUL-Cy5, right histogram). F. Cell cycle analysis of 22Rv1 cells in negative control and mitomycin C treated conditions. G. Correlation between EdU (cell cycle marker) and uptake of GUL-Cy5 in 22Rv1 cells. Red dashed lines denote the mean fluorescence intensity of GUL-Cy5 (R660-A) in all events. Black lines within the G0/G1 and G2/M subpopulations denote the mean fluorescence intensity of GUL-Cy5 in their respective phases. H. Timelapse live cell imaging of 22Rv1 cells grown in vitro with 0.025 µg/mL of GUL-Cy5. I. Graphical representation of GUL-Cy5 accumulation within round cells that are undergoing cell division (red dots) and non-round cells that are not undergoing cell division (black dots). N = 15 for round/dividing and non-round/non-dividing cells. Error bars are SEM.
Uptake of GUL-Cy5 probe by dividing cells in vitro
Uptake of GUL-Cy5 probe by the smaller sized 22Rv1-ZsGreen cells as visualized by intravital imaging suggested preferential uptake by cells undergoing mitosis. Non-viable cells typically reveal membrane blebbing, extracellular vesicle release, and loss of cytoplasmic marker signal (i.e., ZsGreen) which was not the case in these cells. Immunofluorescence of cells stained with antibody specific for cyclin B1, a marker of active cell proliferation, was performed on 22Rv1 wildtype cells in vitro (Figure 6C) [20,21], revealing 17.33% of cells undergoing active proliferation as determined by immunostains with the anti-Cyclin B1 mAb (Figure 6D, green channel), a common marker of cell division. Immunostains with the GUL-Cy5 probe (top white channel) revealed co-localization with both cyclin B1 signal and anti-PSMA mAb signal. This co-localization was not observed with tBu-Cy5 (Figure 6D, lower panel of images). Image analysis of immunofluorescence images obtained in Figure 6E revealed that cells with high cyclin B1 levels (indicated by + sign in the X-axis labels) contained the highest levels of PSMA protein as determined by anti-PSMA mAb immunostains (light blue bars in left graph). Moreover, GUL-Cy5 levels were highest in the cells with high cyclin B1 signal (red left bar, right graph) and lower in cells with low cyclin B1 signal (red bar second from left, right graph). tBu-Cy5 levels were negligible in cells regardless of cyclin B1 signal.
Flow cytometry of mitomycin or vehicle treated 22Rv1-ZsGreen cells was performed to determine which cells at what stage of the cell division cycle exhibited the greatest uptake of GUL-Cy5 probe. Mitomycin was successful in minimizing cell division in the 22Rv1 wildtype cells (Figure 6C, right bar; Supplementary Figure S11A). The EdU (5-ethynyl-2ʹ-deoxyuridine) cell cycle marker was used to confirm that the cells were actively proliferating (Figure 6F, light blue curve, Supplementary Figure S11) and these cells revealed significant uptake of the GUL-Cy5 probe as evidenced by the subpopulation of cells within the G2/M gate and above the median signal (horizontal part of gate) in Figure 6G [22,23].
Live microscopy was performed to confirm that cells of a round morphology representing the G2/M phase of the cell cycle exhibit higher GUL-Cy5 probe internalization than cells at the G1 phase of cell division. Over the 24 h imaging time course, all cells in any field of view were observed to contain some level of GUL-Cy5 signal. The majority of cells were non-dividing cells within the 24 h point but at t = 0 there were round cells that exhibited high levels of GUL-Cy5 signal relative to non-round cells (Figure 6I). These were later tracked over the 24 h time course and found to be dividing cells as evidenced by the round cells subsequently forming two daughter cells that separated from each other after cell division (Figure 6H, white arrows). Round cells that subsequently divided were measured for GUL-Cy5 signal over time which revealed an increase in GUL-Cy5 signal at the time of cell division and then a subsequent dilution of the GUL-Cy5 signal in the daughter cells to levels similar to non-dividing cells (Figure 6I, red line).
PSMA mRNA expression precedes G2 and M phase
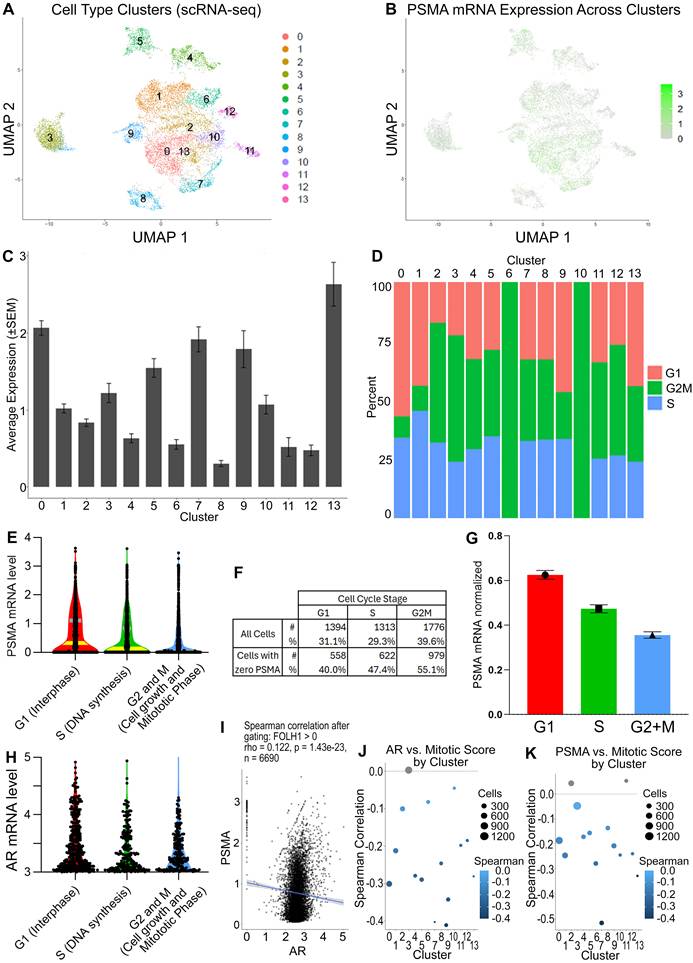
Seurat analysis of scRNA-seq data of 22Rv1 cells revealed 14 different clusters (Figure 7A) with clusters 0, 5, 7, 9 and 13 exhibiting the highest PSMA mRNA levels and clusters 8, 11, and 12 exhibiting the lowest PSMA mRNA levels (Figure 7B-C). No correlation between the proportion of cells in the G1, S and G2/M cell cycle stages was observed across the 14 clusters (Figure 7D). Pan-cluster analysis of PSMA mRNA levels as per stages of the cell cycle was highest in G1 (Figure 7E and 7G, red violin plot and bar) and the lowest in G2/M (Figure 7E and 7G, blue violin plot and bar). The number of cells that had zero PSMA mRNA transcripts was highest in the G2/M cell cycle stage (Figure 7F). Assessment of Androgen Receptor (AR) mRNA, which is the main transcription factor responsible for PSMA/FOLH1 mRNA transcription, also revealed the highest levels of AR in cells at the G1 phase (Figure 7H). Spearman correlation between PSMA and AR mRNA expression cells revealed a minor correlation (0.122) suggesting that AR expression precedes PSMA expression in cells regardless of cell cycle stage (Figure 7I). However, Spearman correlation analyses of AR versus mitotic score (Figure 7J) and PSMA (Figure 7K) reveal that both transcripts are negatively correlated to mitotic score in nearly all clusters except cluster 4 in Figure 7J and cluster 3 and 11 in Figure 7K. In other words, AR and PSMA mRNA levels are highest in cells prior to cell division (G1 and S stages of the cell cycle) and diminish during cell division (G2/M stage of the cell cycle). Consequently, elevated levels of PSMA mRNA produced in G2 and S are translated into PSMA protein, resulting in the accumulation of PSMA during the G2/M stage of a dividing 22Rv1 cell.
Single cell RNA sequencing (scRNA-seq) reveals elevated PSMA mRNA levels in dividing cells. A. Seurat plot of different cell subpopulations represented as different cell clusters. B. Levels of PSMA/FOLH1 mRNA across cell clusters in the Seurat plot. C. Levels of PSMA mRNA across cell clusters from 0-13. D. Distribution of cells at each cell cycle stage within each cell cluster. E. Interquartile representation (yellow bands represent 25% and 75% quartiles) of PSMA mRNA expression in cell clusters in G1, S, and G2 and M stages of the cell cycle. F. Table representing the percentage of cells with zero PSMA mRNA expression. G. Expression of PSMA mRNA across cell cycle stage normalized to number of RNA transcripts. H. Androgen Receptor (AR) mRNA expression in all cell clusters based on stage of the cell cycle. I. Spearman correlation between PSMA and AR mRNA expression in all cells. J. Spearman correlation of AR versus mitotic score as per each cell cluster. K. Spearman correlation of PSMA versus mitotic score as per each cell cluster. All error bars are SEM.
Discussion
There are several clinically used PSMA-targeting GUL-containing probes: PSMA-11, PSMA-1007 and DCFPyL, and these can be tagged with an 18F or 68Ga tracer molecule for PET imaging as either oncological diagnostics or theranostics. Here, we show that a fluorescent version of this probe has several applications in prostate cancer research such as immunofluorescence staining, flow cytometry, whole body imaging, and intravital imaging. We also synthesized an isotype control called tBu-Cy5 which enabled titration experiments and optimization of the GUL-Cy5 probe in various in situ and in vivo applications. With these two probes, specific uptake of GUL-Cy5 was observed in PSMA-positive cell lines cultured in vitro and minimal uptake observed in PSMA-negative cell lines; the non-specific control, tBu-Cy5, was not meaningfully taken up by any of the cells. This set of experiments also addressed a significant concern about labeled small molecules. As a fluorescent or radioisotopic ligand can comprise a significant percent of the mass, volume, and surface of these tools, it is essential that one is not simply measuring the uptake of the dye. Cy5, being hydrophobic, can absorb onto lipid membranes and protein surfaces non-selectively, like any dye. However, given that the very hydrophobic tBu-Cy5 did not show any appreciable binding, and that GUL-Cy5 showed binding only to PSMA-positive cell lines, it seems likely that at the concentrations of probe used, this non-specific “sticky” background binding is not a confound. In fact, the antibodies proved to be less specific than the fluorescent small molecules as using an innovative immunoprecipitation pulldown strategy specific for the Cy5 dye, it was determined that the GUL-Cy5 probe was more specific for PSMA protein than a commercially available anti-PSMA mAb but did exhibit lower binding affinity than the antibody against PSMA which is important to consider. Importantly, the availability of an anti-Cy5 antibody ensured that we could detect the proposed probe directly as we did not require the synthesis of another GUL tagged molecule such as biotin to determine its binding affinity to PSMA — as biotin or the fluorophore are a meaningful percentage of the mass, this change in molecule could be anticipated to affect the entropy (due to changes in desolvation) if not the enthalpy (interfering with the intermolecular interaction) of binding. Binding affinity assays revealed a KD = 4.9 × 10⁻⁵ M for the GUL-Cy5 probe against PSMA protein which indicates that the GUL-Cy5 probe is likely not equivalent to antibodies’ affinity against PSMA, however the affinity of these antibodies has not, to the best of our knowledge, been established. Intravital imaging of 22Rv1-ZsGreen xenografts revealed specific uptake of the GUL-Cy5 probe by smaller sized cells at the invasive front, which were determined to be cells undergoing the G2/M phase of the cell cycle. Finally, we performed single cell RNA sequencing of the 22Rv1 cell line and determined that FOLH1/PSMA mRNA levels are elevated in cells undergoing the first phase of the cell cycle, suggesting that the PSMA protein is subsequently translated during G2/M but this remains a hypothesis.
Our observation of increased GUL uptake by actively dividing cells relative to non-dividing cells has not been previously reported. This observation was made possible by the intravital imaging experiments wherein the greatest uptake in 22Rv1-ZsGreen cells was observed in the smallest and roundest cells within tumor xenografts in the process of outward migration. This was confirmed by immunofluorescence staining revealing co-localization of relatively higher levels of PSMA and cyclin B1 in 22Rv1 cells. As a key regulatory protein in the G2/M transition, cyclin B1 overexpression correlates with enhanced proliferation and increased tumor invasiveness in various cancers [21,24,25], including prostate cancer [26-28]. This means that the PSMA probe is preferentially being internalized by actively proliferating cells within primary tumors as observed in Figure 5 and metastases as observed in Figure 6. This observation is consistent with some patients exhibiting no PSMA-avidity upon [18F]PSMA-1007 PET scans but their lesions reveal the presence of PSMA using immunohistochemistry [29]. In other imaging modalities, there is also a small percentage of patients where the metastases are PSMA-negative based on a first imaging scan, but where PSMA expression is regained in subsequent scans [30-34]. Our findings point to optimal PSMA probe uptake if cells within the primary tumor or metastases are actively undergoing cell proliferation. While we would like to evaluate the clinical versions of the PSMA PET probe, it is not possible to quantitate uptake by proliferating cells at single cell resolution with PET imaging. Fluorescent tools, like GUL-Cy5, are needed to provide this level of spatial resolution.
The GUL-Cy5 probe and its isotype binding control, tBu-Cy5, have significant promise in various areas related to prostate cancer research. Current methods rely on the use of commercially available anti-PSMA IgG mAb reagents, but our results show that the most commonly employed antibodies are also immunoreactive to other proteins (Figure 4C) although they almost certainly have far superior binding affinities to those of the GUL-Cy5 probe. In contrast, the GUL-Cy5 probe is highly specific to PSMA and did not meaningfully bind to any other prostate cancer related proteins within typical prostate cancer cell lysates. This specificity may be very important for other immunoprecipitation experiments related to PSMA. At very high concentrations of the probe, we do note fluorescence in PSMA-negative cell lines; however, it has already been established that GUL has some, although far lower, affinity for other aminopeptidases such as NAALADase, and for certain isoforms of the metabotropic glutamate receptors. Specificity of GUL over anti-PSMA approaches may influence the use of anti-PSMA F(ab) sequences to generate novel cell therapies such as CAR-T cells or CAR-NK cells. It is unclear why the GUL-Cy5 probe, which is substantially smaller than an IgG molecule, has superior binding specificity to that of its anti-PSMA IgG counterpart — the difference in binding modalities is significant, with GUL interacting directly through a strong bond to the two zinc atoms in the protein’s active site, while an antibody takes advantage of a large number of individually far weaker intermolecular interactions with the protein. However, this difference is reminiscent of the superiority of the GUL-based PSMA-11/PSMA-1007 PET imaging probes over ProstaScint, which is derived from the anti-PSMA 7E11-C5 antibody clone. Important to note is that tBu-Cy5 also exhibits kidney retention at all timepoints but does diminish over time.
The GUL-Cy5 probe also provided insight into its uptake into PC-3 cells, which are known to have low to null levels of PSMA. This was observed in Figure 2 and Supplementary Figure S6 wherein PC-3 cells exhibited GUL-Cy5 uptake but also have low to negligible levels of PSMA/FOLH1 mRNA and protein. As we have shown previously [4], GUL-Cy3 uptake in PC-3 cells may follow alternative shuttling mechanisms that exist in neuroendocrine prostate cancers. In these previous investigations, PSMA-like aminopeptidase NAALADaseL and metabotropic glutamate receptors (mGluRs) were determined to be the other alternative carriers of GUL into PC-3 cells [4]. More research is needed to understand how the GUL-Cy5 probe is able to undergo rapid uptake in cell types such as those similar to PC-3 and if that uptake is also dependent on cell proliferation.
Despite the novel and intriguing findings in our study, some limitations should be noted. First, the GUL-Cy5 imaging moiety is larger than that of DCFPyL. Conversely the imaging moieties of PSMA-11 and PSMA-1007 are significantly larger still. While the bulky imaging moieties of GUL-Cy5, PSMA-11 and PSMA-1007 are separated from the GUL warhead by linker chains to minimize the effective bulk, consideration should be taken when extrapolating the findings of the GUL-Cy5 to DCFPyL, PSMA-11 and PSMA-1007. It should also be noted that absence of the GUL on the tBu-Cy5 probe and its lack of in vivo specificity support the contention that the GUL-Cy5 probe is a reasonable analogue of PSMA-11/PSMA-1007. Second, the binding affinity of the Glutamate-Ureido-Lysine ligand has not been previously reported, highlighting the need for further research into other related probes that might be able to further improve the affinity; the warhead is the same in all the commercial probes, but this value suggests that there is considerable room for improvement. Third, the concentrations used in vivo were not adapted to mouse or chick embryo physiologies. The concentrations used are meant to help uncover the overall benefits of the probe which enabled the discovery of the uptake of GUL-Cy5 in proliferating cells. Fourth, the single-cell RNA sequencing findings reveal elevated levels of FOLH1 mRNA in the G1 and S phases of the cell cycle, but it is not proven that these transcripts immediately lead to protein production before cell division is complete, indicating that other molecular biology techniques are needed to prove this translation. Lastly, the prolonged in vivo washout time for GUL-Cy5 and its isotype control may constrain its clinical use for tumor imaging, necessitating further validations in other preclinical models. Nonetheless, the exceptional specificity of GUL-Cy5 probe for actively dividing cells offers considerable potential in drug development endeavors, specifically in delivering nucleic acid topoisomerase (TOP) inhibitors that are most effective during cell division due to higher DNA breaks during G2 phase of the cell cycle [35], ultimately leading to a “smarter” targeted therapy in metastatic prostate cancer patients.
Conclusions
We have demonstrated that GUL-Cy5 is highly specific to the PSMA protein and binds to individual PSMA-expressing cells in vitro and in vivo. Its isotype, tBu-Cy5, is a suitable negative companion control for pre-clinical experiments. Higher GUL-Cy5 probe uptake in actively proliferating prostate cancer cells observed in vivo and in vitro offers new insights for prostate cancer theranostics.
Abbreviations
ANOVA: analysis of variance; APC: allophycocyanin; AR: androgen receptor; BF4: tetrafluoroborate; BSA: bovine serum albumin; CAM: chorioallantoic membrane; CM: complete medium; CMV: cytomegalovirus; CRPC: castration-resistant prostate cancer; Cy3: Cyanine3; Cy5: Cyanine5; DCM: dichloromethane; DCFPyL: 2-(3-{1-carboxy-5-[(6-fluoropyridine-3-carbonyl)amino]pentyl}ureido)pentanedioic acid; DIPEA: N,N-diisopropylethylamine; DMEM: Dulbecco’s Modified Eagle Medium; DMF: N,N-dimethylformamide; DMSO: dimethyl sulfoxide; DOTA: 1,4,7,10-tetraazacyclododecane-1,4,7,10-tetraacetic acid; EDTA: ethylenediaminetetraacetic acid; EdU: 5-ethynyl-2′-deoxyuridine; EMEM: Eagle’s Minimum Essential Medium; EtOAc: ethyl acetate; FACS: fluorescence activated cell sorting; FBS: fetal bovine serum; FID: free induction decay; FITC: fluorescein isothiocyanate; FOLH1: folate hydrolase 1; GAPDH: glyceraldehyde-3-phosphate dehydrogenase; GFP: green fluorescent protein; GUL: glutamate-ureido-lysine; HRMS: high-resolution mass spectrometry; HRP: horseradish peroxidase; IACUC: Institutional Animal Care and Use Committee; IgG: immunoglobulin G; IP: immunoprecipitation; IP-MS: immunoprecipitation-mass spectrometry; IV: intravenous; IVIS: in vivo imaging system; KD: dissociation constant; LC-MS: liquid chromatography-mass spectrometry; mAb: monoclonal antibody; MeOH: methanol; MFI: mean fluorescence intensity; MOI: multiplicity of infection; mRNA: messenger RNA; NHS: N-hydroxysuccinimide; NMR: nuclear magnetic resonance; ORF: open reading frame; PBS: phosphate-buffered saline; PCa: prostate cancer; PET: positron emission tomography; P/S: penicillin and streptomycin; PVDF: polyvinylidene difluoride; qPCR: quantitative polymerase chain reaction; RIPA: radioimmunoprecipitation assay; ROI: region of interest; RPMI: Roswell Park Memorial Institute; SBU: specific binding units; scRNA-seq: single-cell RNA sequencing; SDS-PAGE: sodium dodecyl sulfate-polyacrylamide gel electrophoresis; SEM: standard error of the mean; siCON: scrambled control siRNA; siFOLH1: siRNA targeting FOLH1; siRNA: small interfering RNA; SPF: specific pathogen-free; STR: short tandem repeat; TBS-T: Tris-buffered saline with Tween-20; tBu: tert-butyl; TFA: trifluoroacetic acid; TLC: thin-layer chromatography; TOP: topoisomerase; UMAP: Uniform Manifold Approximation and Projection; UMI: unique molecular identifier; WGA: wheat germ agglutinin; WT: wild-type.
Supplementary Material
Supplementary figures and tables.

Acknowledgements
Funding
Funding Sources: CIHR Project Grant #: 480369 (D.V., A.L., L.K., C.S.L., S.K.L., H.S.L.), Terry Fox Research Institute PPG grant (H.S.L.). Ride for Dad Prostate Cancer Fight Foundation Grant (H.S.L.), Cancer Research Society #836994 (J.F.T), NSERC Discovery Grant RGPIN-2024-04113 (J.F.T); J.F.T. wishes to recognize that aspects of this work were made possible by the facilities of the Digital Research Alliance of Canada (#QKH-310, J.F.T.). China Scholarship Council: CSC Student ID: 202206240115 (S.F.).
Authorship contribution statement
Experimental design and investigation: S.F., J.J.H., J.F.T., Y.S., M.S., Y.W., H.S.L. Execution of experiments: S.F., J.J.H., A.K., Y.S., B.S., Y.W., J.W.H., H.S.L. Data analysis and interpretation: S.F., J.J.H., M.S., B.S., C.S.L., S.K.L., J.W.H., J.F.T., H.S.L. Provision of proprietary reagents: J.J.H., J.F.T., P.W. Provision of funding: S.F., D.V., A.L., L.K., C.S.L., S.K.L., J.F.T., H.S.L. Preparation of manuscript and editing: S.F., J.J.H., L.K., U.E., S.K.L., X.L., J.F.T., H.S.L.
Data and materials availability
All data associated with this article is provided in the supporting information and in the body of this text. The original FID and parameter files associated with the NMR spectra reported in this article are available for download as a .zip archive from the Trant Team Dataverse at: https://doi.org/10.5683/SP4/BE2ZOQ. This is hosted by the Borealis Dataverse, a repository jointly funded and hosted by the Canadian Universities and Research Institutes. Research aliquots of both GUL-Cy5 and tBu-Cy5 are available for collaboration purposes to academic and non-profit partners while supplies last on written request to H.S.L. (hon.leong@sri.utoronto.ca) or J.F.T. (j.trant@uwindsor.ca). The original FID and parameter files associated with the NMR spectra reported in this article are available for download as a .zip archive from the Trant Team Dataverse at: https://doi.org/10.5683/SP4/BE2ZOQ. This is hosted by the Borealis Dataverse, a repository jointly funded and hosted by the Canadian Universities and Research Institutes.
Declaration of AI-assisted technologies
During the preparation of this manuscript, the authors used Claude (Anthropic) to assist with language editing, reference formatting, and checking internal consistency of units, nomenclature and figure citations. No content was generated by artificial intelligence. The authors reviewed and verified all edits and take full responsibility for the content of the published article.
Competing Interests
H.S.L., J.J.H., and J.F.T., are named co-inventors on a provisional patent for the GUL-Cy5 and tBu-Cy5 molecules. J.F.T. is the CEO of Binary Star Research Services (BSRS). C.S.L has a collaborative research agreement with IBM Watson Health Imaging (WHI) and received an honorarium from AstraZeneca (AZ). Neither BSRS, IBM WHI nor AZ had any input into this project, nor do they have any commercial interests in the subject of this work. None of these entities hold IP related to this project, nor did they provide any funding to support this work.
References
1. Siegel RL, Giaquinto AN, Jemal A. Cancer statistics, 2024. CA Cancer J Clin. 2024;74:12-49
2. Siva S, Udovicich C, Tran B, Zargar H, Murphy DG, Hofman MS. Expanding the role of small-molecule PSMA ligands beyond PET staging of prostate cancer. Nat Rev Urol. 2020;17:107-118
3. Holmberg AR, Marquez M, Lennartsson L, Meurling L, Nilsson S. Synthesis and binding of a novel PSMA-specific conjugate. Anticancer Res. 2018;38:1531-1537
4. Bakht MK, Hayward JJ, Shahbazi-Raz F, Skubal M, Tamura R, Stringer KF. et al. Identification of alternative protein targets of glutamate-ureido-lysine associated with PSMA tracer uptake in prostate cancer cells. Proc Natl Acad Sci U S A. 2022;119:e2025710119
5. Ma X, Shi L, Zhang B, Liu L, Fu Y, Zhang X. Recent advances in bioprobes and biolabels based on cyanine dyes. Anal Bioanal Chem. 2022;414:4551-4573
6. Lone SN, Nisar S, Masoodi T, Singh M, Rizwan A, Hashem S. et al. Liquid biopsy: a step closer to transform diagnosis, prognosis and future of cancer treatments. Mol Cancer. 2022;21:79
7. Xie W, Suryaprakash S, Wu C, Rodriguez A, Fraterman S. Trends in the use of liquid biopsy in oncology. Nat Rev Drug Discov. 2023;22:612-613
8. Jones W, Griffiths K, Barata PC, Paller CJ. PSMA theranostics: review of the current status of PSMA-targeted imaging and radioligand therapy. Cancers (Basel). 2020;12:1367
9. Wang T, Ray J. Aptamer-based molecular imaging. Protein Cell. 2012;3:739-754
10. Wang AZ, Farokhzad OC. Current progress of aptamer-based molecular imaging. J Nucl Med. 2014;55:353-356
11. Fang H, Peng B, Ong SY, Wu Q, Li L, Yao SQ. Recent advances in activity-based probes (ABPs) and affinity-based probes (AfBPs) for profiling of enzymes. Chem Sci. 2021;12:8288-8310
12. Wolf P, Freudenberg N, Bühler P, Alt K, Schultze-Seemann W, Wetterauer U. et al. Three conformational antibodies specific for different PSMA epitopes are promising diagnostic and therapeutic tools for prostate cancer. Prostate. 2010;70:562-569
13. Hayward JJ, Mader L, Trant JF. Giving preparative thin-layer chromatography some tender loving care. Synthesis. 2022;54:2391-2394
14. Maresca KP, Hillier SM, Femia FJ, Keith D, Barone C, Joyal JL. et al. A series of halogenated heterodimeric inhibitors of prostate specific membrane antigen (PSMA) as radiolabeled probes for targeting prostate cancer. J Med Chem. 2009;52:347-357
15. Yu X, Pegram CN, Bigner DD, Chandramohan V. Development and validation of a cell-based fluorescent method for measuring antibody affinity. J Immunol Methods. 2017;442:49-53
16. Leong HS, Chambers AF, Lewis JD. Assessing cancer cell migration and metastatic growth in vivo in the chick embryo using fluorescence intravital imaging. Methods Mol Biol. 2012;872:1-14
17. Kim Y, Williams KC, Gavin CT, Jardine E, Chambers AF, Leong HS. Quantification of cancer cell extravasation in vivo. Nat Protoc. 2016;11:937-948
18. Butler KS, Brinker CJ, Leong HS. Bridging the in vitro to in vivo gap: using the chick embryo model to accelerate nanoparticle validation and qualification for in vivo studies. ACS Nano. 2022;16:19626-19650
19. Berish RB, Ali AN, Telmer PG, Ronald JA, Leong HS. Translational models of prostate cancer bone metastasis. Nat Rev Urol. 2018;15:403-421
20. Ersvær E, Kildal W, Vlatkovic L, Cyll K, Pradhan M, Kleppe A. et al. Prognostic value of mitotic checkpoint protein BUB3, cyclin B1, and pituitary tumor-transforming 1 expression in prostate cancer. Mod Pathol. 2020;33:905-915
21. Xie B, Wang S, Jiang N, Li JJ. Cyclin B1/CDK1-regulated mitochondrial bioenergetics in cell cycle progression and tumor resistance. Cancer Lett. 2019;443:56-66
22. Radwan B, Rocchetti S, Matuszyk E, Sternak M, Stodulski M, Pawlowski R. et al. EdU sensing: the Raman way of following endothelial cell proliferation in vitro and ex vivo. Biosens Bioelectron. 2022;216:114624
23. Lim JS, Ibaseta A, Fischer MM, Cancilla B, O'Young G, Cristea S. et al. Intratumoural heterogeneity generated by Notch signalling promotes small-cell lung cancer. Nature. 2017;545:360-364
24. Wang T, Wang S, Wang T, Jia L, Nan G, Wang L. Cdc14B/Cyclin B1 signaling modulates the pathogenesis of sonic hedgehog subtype medulloblastoma. Am J Cancer Res. 2024;14:2868-2880
25. Yoshida T, Tanaka S, Mogi A, Shitara Y, Kuwano H. The clinical significance of cyclin B1 and Wee1 expression in non-small-cell lung cancer. Ann Oncol. 2004;15:252-256
26. Itkonen HM, Urbanucci A, Martin SES, Khan A, Mathelier A, Thiede B. et al. High OGT activity is essential for MYC-driven proliferation of prostate cancer cells. Theranostics. 2019;9:2183-2197
27. Yu Y, Zhang Y, Guan W, Huang T, Kang J, Sheng X. et al. Androgen receptor promotes the oncogenic function of overexpressed Jagged1 in prostate cancer by enhancing cyclin B1 expression via Akt phosphorylation. Mol Cancer Res. 2014;12:830-842
28. Li Y, Zhang DY, Ren Q, Ye F, Zhao X, Daniels G. et al. Regulation of a novel androgen receptor target gene, the cyclin B1 gene, through androgen-dependent E2F family member switching. Mol Cell Biol. 2012;32:2454-2466
29. Ahmadi Bidakhvidi N, Gevaert T, De Schepper M, Baldewijns M, Havinga E, Deckers W. et al. Comparison of PSMA immunohistochemistry scoring systems to parametric [18F]PSMA-1007 PET/MRI in primary prostate cancer. Eur J Nucl Med Mol Imaging. 2025;52:766-778
30. Wang Q, Ketteler S, Bagheri S, Ebrahimifard A, Luster M, Librizzi D. et al. Diagnostic efficacy of [99mTc]Tc-PSMA SPECT/CT for prostate cancer: a meta-analysis. BMC Cancer. 2024;24:982
31. Boinapally S, Lisok A, Lofland G, Minn I, Yan Y, Jiang Z. et al. Hetero-bivalent agents targeting FAP and PSMA. Eur J Nucl Med Mol Imaging. 2022;49:4369-4381
32. Farolfi A, Calderoni L, Mattana F, Mei R, Telo S, Fanti S. et al. Current and emerging clinical applications of PSMA PET diagnostic imaging for prostate cancer. J Nucl Med. 2021;62:596-604
33. Harsini S, Martineau P, Plaha S, Saprunoff H, Chen C, Bishop J. et al. Prognostic significance of a negative PSMA PET/CT in biochemical recurrence of prostate cancer. Cancer Imaging. 2024;24:117
34. Werner P, Neumann C, Eiber M, Wester HJ, Schottelius M. [99mTc]Tc-PSMA-I&S-SPECT/CT: experience in prostate cancer imaging in an outpatient center. EJNMMI Res. 2020;10:45
35. Kellner U, Sehested M, Jensen PB, Gieseler F, Rudolph P. Culprit and victim - DNA topoisomerase II. Lancet Oncol. 2002;3:235-243
Author contact
Corresponding author: Dr. Hon S. Leong, Translational Urology Research Laboratory, S2-18, 2075 Bayview Ave, Toronto, ON. M4N 3M5, Tel No.: 416-480-6100 ext. 5748 Email: hon.leongutoronto.ca