Impact Factor




Theranostics 2027; 17(1):445-467. doi:10.7150/thno.134471 This issue Cite
Research Paper
FCHO1 sustains mitochondrial oxidative phosphorylation in T cells and predicts response to cancer immunotherapy
Zidan Zhao1,11†, Xuezeng Sun1,3†, Huaping Huang1,4†, Yuewei Sheng5†, Yu Sun1, Dongjie Chen5, Zuyan Li6, Yuntao Shi1, Kuan Li1, Xiaowei Qin7, Charles R. Ashby Jr.8, Zhe-Sheng Chen8, Jia Li1  , Chen Dai1,9 , Xiaofang Lu10 , Leli Zeng1,2
1. Digestive Diseases Center, Guangdong Provincial Key Laboratory of Digestive Cancer Research, The Seventh Affiliated Hospital of Sun Yat-sen University, Shenzhen, China.
2. The Biobank, Scientific Research Center, The Seventh Affiliated Hospital of Sun Yat-Sen University, Shenzhen, Guangdong 518107, China.
3. Department of Gastrointestinal Surgery, The Second Qilu Hospital of Shandong University, Jinan, 250033, Shandong, PR China.
4. Division of Thyroid surgery, Department of General Surgery, Shenzhen People’s Hospital (The First Affiliated Hospital, Southern University of Science and Technology; The Second Clinical Medical College, Jinan University), Shenzhen 518020, Guangdong, China.
5. Shanghai Medical College of Fudan University.
6. Zhongshan School of Clinical Medicine, Fudan University.
7. Department of Gastroenterology Surgery, Heji Hospital Affiliated to Changzhi Medical College, Shanxi 046012, China.
8. Department of Pharmaceutical Sciences, College of Pharmacy and Health Sciences, St John’s University, Queens, New York, United States of America.
9. Thyroid Department, The Affiliated Lihuili Hospital of Ningbo University, Ningbo, Zhejiang, China.
10. Department of Pathology, The Seventh Affiliated Hospital of Sun Yat-Sen University, Shenzhen, Guangdong, China.
11. Department of Gastrointestinal Surgery, Peking University Shenzhen Hospital, Shenzhen, Guangdong, China.
†These authors have contributed equally to this work and share the first authorship
Received 2026-3-15; Accepted 2026-10-6; Published 2027-1-1
Abstract
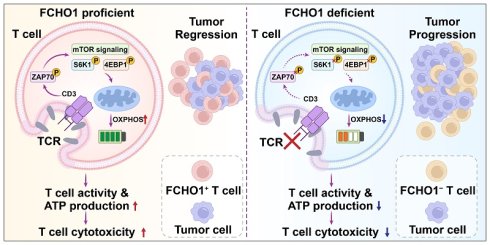
Rationale: Immunotherapy has transformed the clinical management of cancer; however, only a minority of patients achieve durable responses, underscoring the need for reliable predictive biomarkers and novel therapeutic targets. Here, we identify FCH domain only protein 1 (FCHO1) as a critical regulator of T-cell-mediated anti-tumor immunity.
Methods: Integrative analysis of single-cell and bulk transcriptomic data across multiple cancer types was performed to characterize FCHO1 expression and immune correlations. Functional studies of FCHO1 depletion, mechanistic investigations of endocytic and metabolic signaling, in vivo tumor models, and clinical analysis of immunotherapy cohorts and gastrointestinal cancer patients receiving neoadjuvant chemoimmunotherapy were conducted.
Results: FCHO1 is predominantly expressed in tumor-infiltrating immune cells, particularly T cells, and is positively correlated with immune activation and T-cell infiltration in the tumor microenvironment (TME). FCHO1 depletion impaired T-cell proliferation, activation, and cytotoxicity while promoting exhaustion. Mechanistically, FCHO1 facilitates clathrin-mediated endocytosis (CME) of the TCR/CD3 complex, sustaining downstream mTOR signaling and mitochondrial oxidative phosphorylation (OXPHOS), thereby maintaining the metabolic fitness required for effective T-cell anti-tumor responses. In vivo, FCHO1 overexpression enhanced T-cell-mediated tumor killing and potentiated the efficacy of immune checkpoint blockade. Clinically, high FCHO1 expression was associated with improved overall survival and progression-free survival across multiple immunotherapy cohorts and with objective responses to neoadjuvant chemoimmunotherapy in gastrointestinal cancer patients.
Conclusions: These findings establish FCHO1 as a promising predictive biomarker and therapeutic target for enhancing anti-tumor immunity in cancer immunotherapy.
Keywords: FCHO1, T cells, tumor microenvironment, cancer immunotherapy
Introduction
Cancer remains one of the leading causes of mortality worldwide[1], despite significant advancements in traditional treatments such as surgery, chemotherapy, and radiotherapy. The emergence of immunotherapy in recent years has revolutionized cancer treatment, offering promising therapeutic strategies with the potential for long-lasting clinical benefits[2]. Immune checkpoint inhibitors (ICIs), adoptive T-cell therapies, and cancer vaccines have been shown to have efficacy in a variety of cancers, including melanoma, non-small cell lung cancer, and bladder cancer[3-5]. However, the efficacy of immunotherapy is often limited by resistance, immune-related adverse events, and a lack of predictive biomarkers for therapeutic response[6-8]. Consequently, identifying reliable biomarkers to predict immunotherapy efficacy remains a critical objective for improving treatment outcomes and decrease adverse effects.
The tumor microenvironment (TME) is a complex and dynamic milieu, consisting of a variety of cell types, including malignant cells, immune cells, fibroblasts, endothelial cells, and extracellular matrix components[9]. The immune component of the TME plays a crucial role in determining tumor progression and therapeutic response[10]. Tumor-infiltrating lymphocytes (TILs), particularly CD4+ and CD8+ T cells, have been shown to be correlated with a better prognosis and response to immunotherapy[11,12]. However, within the TME, T-cell function is frequently suppressed, causing T-cell exhaustion, characterized by the upregulation of inhibitory receptors, such as programmed cell death 1 receptor (PD-1), cytotoxic T-lymphocyte antigen 4 (CTLA-4), and T-cell immunoglobulin and mucin-containing protein 3 (TIM-3)[13]. Elucidating the molecular mechanisms that govern immune cell infiltration and function within the TME is therefore essential for developing more effective immunotherapy strategies.
Clathrin-mediated endocytosis (CME) is essential for the internalization of membrane proteins involved in cellular signaling, development, and immune regulation[14]. The dysregulation of CME-related proteins has been implicated in tumorigenesis and metastasis[15]. For example, disabled homolog 2 (DAB2), a CME adaptor protein, is frequently downregulated in various cancers and is involved in mediating key oncogenic processes, such as apoptosis, migration, and epithelial–mesenchymal transition (EMT)[16]. FCH only domain 1 (FCHO1), a defined coat nucleator in CME[17], is a modulator of innate and adaptive immunity[18]. Autosomal recessive FCHO1 deficiency has been reported in combined immunodeficiency, characterized by lymphoproliferation, malignancy susceptibility, growth failure, and autoimmune manifestations, including Guillain–Barré syndrome[19,20]. These clinical observations implicate FCHO1 as a critical regulator of T-cell biology; however, its role in T-cell-mediated anti-tumor immunity within the TME remains unexplored.
In this study, we investigated the role of FCHO1 in the TME, with a focus on its effect on T-cell function and anti-tumor immunity. Using a comprehensive multi-omics approach, we demonstrated that FCHO1 is predominantly expressed in immune cells within the TME across multiple cancer types, particularly in gastrointestinal cancers, and is closely associated with T-cell infiltration and immune activation. Functional assays revealed that FCHO1 modulates T-cell activation, exhaustion, and cytotoxicity through clathrin-mediated endocytosis of the TCR/CD3 complex and downstream regulation of mitochondrial oxidative phosphorylation via mTOR signaling. In vivo experiments showed that FCHO1 depletion impaired T-cell-mediated tumor killing, whereas FCHO1 overexpression enhanced anti-tumor immunity and potentiated the efficacy of immune checkpoint blockade. Importantly, high FCHO1 expression in T cells correlated with improved clinical outcomes following immunotherapy across multiple human cohorts, supporting its potential as a predictive biomarker for patient selection and treatment response.
Materials and Methods
Data sources
We collected 28 pan-cancer single-cell RNA sequencing (scRNA-seq) datasets, consisting of 327 individual samples and 710,030 cells, to evaluate the expression of FCHO1 within the TME. The Seurat R package, a widely utilized tool for scRNA-seq data analysis, was used to process these extensive datasets, which contained 16 different cancer types. Raw data were obtained from public repositories, including the Gene Expression Omnibus (GEO), Array Express and the European Genome-phenome Archive (EGA). To ensure data integrity, cells having fewer than 500 detected genes or those with mitochondrial gene expression exceeding 5%, were excluded from the analysis. Principal Component Analysis (PCA) was conducted for dimensionality reduction, with the optimal number of principal components determined using the elbow plot method. These components were subsequently used for cell clustering, followed by Uniform Manifold Approximation and Projection (UMAP) for further dimensional reduction. Cells were annotated using known marker genes or by retrieving annotations from their respective original datasets. Differential gene expression was assessed using the FindAllMarkers function with default thresholds of logFC > 0.25 and a minimum percentage of cells expressing the gene (min.pct) > 0.1. See detailed information in Table S1. The Cancer Genome Atlas (TCGA) database is currently the largest cancer gene information database, including gene expression data, copy number variation and clinicopathological data[21]. The original mRNA expression data of 33 tumors were downloaded for subsequent analyses. The gene expression data of different tissues were downloaded from the Genotype-Tissue Expression (GTEx) database and merged with the TCGA data, and they were corrected by the log2 method to calculate the difference in gene expression in different cancers using the Kruskal-Wallis test. The data from each tumor cell line were downloaded from the Cancer Cell Line Encyclopedia (CCLE) database, and the gene expression level in these tumor cells was analyzed according to the source. The Human Protein Atlas (HPA) is a program for mapping human proteins in cells, tissues, and organs using the integration of various omics technologies[22,23]. Therefore, we used the HPA database to illustrate the distribution of FCHO1 protein in normal tissues. The datasets (GSE10950, GSE35834, GSE62932, GSE74602, GSE26899, GSE172032, GSE29272, and GSE66229) containing clinical samples with both normal and tumor tissues from CRC and GC were downloaded from the GEO.
To verify the prognostic value of the FCHO1 for immunotherapy sensitivity, we further selected 11 immunotherapy data sets from patients with urothelial cancer (IMvigor210; GSE176307; ccRcc), melanoma (Nathanson; PRJEB23709, SRP067586; GSE100797), non-small cell lung cancer (GSE91061; GSE126044; GSE135222), gastric cancer (GSE179351) and colorectal and pancreatic cancer (GSE179351), to analyze the OS, PFS and different immunotherapy responses.
Analyses of immune cell infiltration
The ESTIMATE algorithm and the "immunedeconv" R package (integrating TIMER, xCell, MCP-counter, CIBERSORT, EPIC, and quanTIseq) were used to evaluate the immune cell infiltration landscape across cancers. GSVA enrichment analyses were conducted using gene sets downloaded from the MSigDB (v7.0), and implemented through the “GSVA”, “clusterProfiler”, and “enrichplot” packages to infer biological pathway changes between high and low expression groups.
Cell culture and transfection
Peripheral blood mononuclear cells (PBMCs) were isolated from whole blood, using density gradient centrifugation with Ficoll-Paque™. To isolate CD3+ T cells, the BD IMag™ Human T Lymphocyte Enrichment Set-DM (BD, 557874) was used for negative selection. This method uses a biotinylated cocktail of monoclonal antibodies that specifically target non-T lymphocytes, including antigens on erythrocytes, platelets and peripheral leukocytes. Following antibody incubation, BD IMag™ Streptavidin Particles Plus-DM, which are magnetic nanoparticles, were used to label non-T cells. The labeled cells were then removed, using the BD IMag™ Cell Separation Magnet, leaving the unlabeled T lymphocytes in suspension. The T cells were then further concentrated through a two-step negative selection process. The isolated CD3+ T cells were then resuspended in serum-free medium (SuperCulture), supplemented with 0.5‰ IL-2 (STEMCELL,78036), and stimulated for 48 hours in 12-well plates (approximately 5×10⁶ cells per well) pre-coated with T cell activators, including anti-CD3 and anti-CD28 antibodies (STEMCELL, 10971). The activation process was maintained for 5-7 days, after which activated T cells were obtained.
Jurkat human T-cell leukemia cells were cultured in RPMI-1640 medium (Nacalai Tesque) supplemented with 10% fetal bovine serum (Gibco) and 1% penicillin-streptomycin-antimycotic solution. Cells were maintained at 37 °C in a humidified incubator with 5% CO₂ and 95% air.
The mouse colorectal cancer cell line CT26-OVA was cultured in RPMI-1640 medium, while the MC38-OVA cell line was cultured in DMEM medium. Both culture media were supplemented with 10% fetal bovine serum (FBS) and 1% penicillin-streptomycin. Cells were maintained in a 37 °C incubator with 5% CO2, and passaged every 3 days. After passaging, cells were seeded at a density of 2 x 10^6 cells per 100 mm culture dish. Cells were harvested once they reached approximately 80% confluence. OT-1 CD8+ T cells were isolated from 6-8 week-old female OT-1 mice, using the Mouse CD8+ T Cell Isolation Kit (STEMCELL, 19053), following the manufacturer’s protocol. RPMI-1640 medium was supplemented with 50 μM β-mercaptoethanol, 10 mM of HEPES, 1 mM of sodium pyruvate, and 1% penicillin-streptomycin. To activate CD8+ T cells, 24-well plates, pre-coated with anti-CD3 and anti-CD28 (STEMCELL, 100-1572) antibodies, were used to stimulate the cells for 2 days. Following the stimulation, the culture medium was replaced, and recombinant mouse IL-2 (BioLegend, 575402) was added to support the proliferation and activation of CD8+ T cells.
The siRNA sequences targeting FCHO1, and Fcho1, with their respective negative control sequences, were designed and synthesized. These sequences were synthesized by Genomeditech Co., Ltd. A complete list of all sequences is provided in Table S2. For the design and synthesis of human FCHO1 (hFCHO1) and mouse Fcho1 (mFcho1) mRNA, the plasmid DNA template, containing the gene of interest (GOI) flanked by the 5' untranslated region (UTR) and a 3' polyA tail, is linearized by digestion with SapI. The linearized DNA template was then purified to remove any residual contaminants. In vitro transcription (IVT) was carried out using the linearized DNA template, T7 RNA polymerase, NTP mixtures, IVT reaction buffer, and the cap analog AG for co-transcriptional capping. The transcribed mRNA was subsequently purified via LiCl precipitation or magnetic bead-based purification. Following purification, the mRNA was dissolved in sodium citrate buffer and stored at temperatures ≤ -65 °C to maintain stability. This method ensures the production of high-quality mRNA for transfection into primary T cells. Transfection was performed using the Transfection kit (ProteanFect™) following the manufacturer’s instructions.
Western blot
Total protein was extracted from T cells using RIPA lysis buffer (Beyotime) for western blot analysis. Protein samples were separated by SDS-PAGE, according to their molecular weights and transferred to a PVDF membrane for antibody incubation. Immunodetection was performed with primary antibodies, and the target proteins are listed in Table S3. Protein blots were visualized using the iBright imaging system (Invitrogen).
RNA purification and RT-PCR analyses
RNA was extracted using Trizol, according to the manufacturer’s instructions and then reverse-transcribed with the RT SuperMix kit for qPCR (Vazyme). RT-qPCR was performed using SYBR Green PCR Master Mix (Biorad). The 2-ΔΔCT method was used to quantify relative gene expression. Relevant sequencing primers are listed in Table S4.
RNA sequencing analysis
RNA quality was assessed using the A260/A280 ratio on a Nanodrop ND-2000 system (Thermo Scientific), and RNA integrity number (RIN) was determined on an Agilent Bioanalyzer 4150 system (Agilent Technologies). Only RNA samples with satisfactory quality were used for library preparation. Paired-end libraries were prepared using the ABclonal mRNA-seq Library Prep Kit (ABclonal), following the manufacturer's instructions. mRNA was isolated from 1 μg total RNA using oligo(dT) magnetic beads, fragmented, and converted into cDNA. The library was amplified by PCR, purified using the AMPure XP system, and quality was assessed on an Agilent Bioanalyzer 4150 system. Sequencing was performed on the Illumina Novaseq 6000 platform. The data were processed and analyzed using an in-house bioinformatics pipeline at Shanghai Applied Protein Technology. To investigate the transcriptional changes induced by FCHO1 knockdown, RNA-seq data were clustered using the “Mfuzz” and “pheatmap” R packages to identify distinct gene expression patterns. Subsequently, Gene Ontology (GO) and Kyoto Encyclopedia of Genes and Genomes (KEGG) pathway enrichment analyses were performed to explore the biological functions and signaling pathways associated with the differentially expressed genes. Gene Set Enrichment Analysis (GSEA) was also conducted to further identify key pathways affected by FCHO1 deficiency.
Flow cytometric analyses
Cells were harvested, centrifuged, washed and resuspended in 100 μL of pre-cooled 1% BSA solution dissolved in PBS. The cells were then stained in the dark, according to the manufacturer's instructions, with a flowing antibody bound to a specific fluorescent dye, at the recommended concentration for 30 min. The specific antibodies used are listed in Table S3. After unbound antibodies were discarded, corresponding fluorescence signals were recorded using the CytoFLEX S flow cytometer (Beckman). Various groups, including a blank group, a single antibody-stained group and a sample group, were used for voltage adjustment and compensation.
Immunofluorescence staining of cells
Cells were seeded onto coverslips in 24-well plates and allowed them to adhere overnight. After appropriate treatment, cells were washed with phosphate-buffered saline (PBS) and fixed with 4% paraformaldehyde for 15 minutes at room temperature. Subsequently, cells were permeabilized with 0.1% Triton X-100 in PBS for 10 minutes and blocked with 5% bovine serum albumin (BSA) for 1 hour at room temperature to prevent nonspecific binding. Cells were incubated with primary antibodies diluted in blocking buffer at 4 °C overnight. The specific antibodies used are listed in Table S3. After washing with PBS, cells were incubated with species-appropriate fluorophore-conjugated secondary antibodies for 1 hour, at room temperature, in the dark. Nuclei were counterstained with DAPI for 5 minutes. Coverslips were mounted using antifade mounting medium. Fluorescent images were captured using a confocal laser scanning microscope (Zeiss LSM 880), and image processing was performed using ImageJ software.
Transferrin uptake assay
Jurkat cells and T cells were detached using PBS containing 10 mM EDTA and subsequently serum-starved in DMEM at 37 °C for 30 minutes. After washing with glucose buffer (PBS supplemented with 20 mM glucose and 1% BSA), both the cells and AlexaFluor 488-labeled transferrin (Thermo Fisher Scientific) were chilled on ice. The cells were incubated with 25 µg/ml of the fluorescently labeled transferrin on ice for 10 minutes. Following this, the cells were shifted to 37 °C for various durations to allow internalization. At the designated time points, surface-bound transferrin was removed using an acid wash solution (PBS with 0.1 M glycine and 150 mM NaCl, pH 3), and internalized fluorescent transferrin was quantified by confocal fluorescent microscopy.
Oxygen consumption rate analysis
The oxygen consumption rate of T cells and Jurkat cells were assessed using the Seahorse XF96 Flux Analyzer (Seahorse Biosciences, USA), in conjunction with the XF Cell Mito Stress Test Kit and XF96 FluxPak reagents (Agilent Technologies, USA). Cells (2 × 10⁴ per well) were seeded into XF96 microplates and incubated overnight. Baseline OCR was recorded prior to the sequential administration of oligomycin, FCCP (an uncoupler of mitochondrial membrane potential[24]), and a combination of rotenone and antimycin A (Rote/AA), which inhibit mitochondrial complexes I and III[25,26], respectively. Final OCR values were normalized to the total protein content of each well.
TCR internalisation assays
To assess TCR internalization, FCHO1-sufficient, -deficient, T cells and Jurkat cells, were seeded onto poly-D-lysine (0.1 mg/mL) and anti-CD3 and anti-clathrin coated glass coverslips. After incubation for the indicated time, cells were fixed with 3% formaldehyde, and autofluorescence was quenched using 50 mM of NH₄Cl. Cells were permeabilized and blocked in PBS with 0.1% BSA and 0.05% saponin, followed by staining with mouse anti-CD3 and Alexa Fluor 594-conjugated goat anti-mouse IgG, rabbit anti-clathrin and Alexa Fluor 488-conjugated goat anti- IgG. Nuclei were counterstained with DAPI. Coverslips were mounted using Fluoromount-G and dried in the dark overnight. Imaging was performed on a ZEISS LSM800 confocal microscope. We used Fiji software to quantify the number of CD3 and clathrin co-localization in Jurkat cells and T cells from the NC and si-FCHO1 groups.
Intracellular ATP detection
Intracellular ATP levels were assessed using the pCMV-AT1.03 ATP fluorescent probe (Beyotime, D2604), a FRET-based biosensor in which intracellular ATP binding induces conformational changes that alter the ratio of FRET emission (527 nm) to donor emission (475 nm). Jurkat cells were transfected with the pCMV-AT1.03 plasmid and, at 24–48 h post-transfection, subjected to the indicated treatments. Fluorescence was acquired by confocal microscopy (excitation 435 nm), and the FRET ratio (527 nm / 475 nm) was quantified using ImageJ as a surrogate index of intracellular ATP concentration.
Mitochondrial membrane potential assessment by JC-1
Mitochondrial membrane potential (ΔΨm) was assessed using the JC-1 Mitochondrial Membrane Potential Assay Kit (Beyotime, C2006) according to the manufacturer's instructions. Jurkat cells were incubated with JC-1 working solution at 37 °C for 20 min in the dark, washed, and imaged by confocal microscopy. CCCP (10 µM, 20 min) was used as a positive control for membrane depolarization. The ratio of red J-aggregate (excitation 525 nm, emission 590 nm) to green monomer (excitation 490 nm, emission 530 nm) fluorescence was quantified using ImageJ as an index of ΔΨm.
Mitochondrial membrane potential assessment by TMRE
Mitochondrial membrane potential was independently validated using the TMRE Mitochondrial Membrane Potential Assay Kit (Beyotime, C2001S) according to the manufacturer's instructions. Jurkat cells were incubated with TMRE working solution (1×) at 37 °C for 15–30 min in the dark, washed, and imaged by fluorescence microscopy (excitation 550 nm, emission 575 nm). CCCP (10 µM, 20 min) was used as a positive control. Fluorescence intensity was quantified using ImageJ and normalized to the vehicle-treated control.
Mitochondrial superoxide detection
Mitochondrial superoxide levels were measured using the MitoSO™ Red Mitochondrial Superoxide Assay Kit (Beyotime, S0061) according to the manufacturer's instructions. Jurkat cells were incubated with MitoSO™ Red working solution (5 µM) at 37 °C for 30 min in the dark, washed, and imaged by confocal microscopy (excitation 510 nm, emission 580 nm). mSoxUp (1×, 4 h) was used as a positive control for mitochondrial superoxide accumulation. Mean fluorescence intensity was quantified using ImageJ and normalized to the untreated control.
In vitro cytotoxicity assay
CT26-OVA and MC38-OVA cells were cultured in 96-well plates until they reached approximately 70% confluency. To investigate the cytotoxic effect of OT-1 CD8+ T cells on tumor cells, tumor cells were co-cultured with activated OT-1 CD8+ T cells for 24 hours. IncuCyte™ Cytotox Reagents (Sartorius) were added to the culture (5:1 ratio) to assess cytotoxicity. Cytotox Red Reagent was added at the 24-hour mark to indicate dead cells. Importantly, these reagents do not interfere with the growth of normal cells. When cells undergo apoptosis or necrosis, the loss of plasma membrane integrity allows the reagent to bind to DNA, resulting in increased red fluorescence. Cells were then analyzed using a confocal laser scanning microscope, where cells displaying red fluorescence were classified as dead.
In a parallel experiment, tumor cells and OT-1 CD8+ T cells were co-cultured in six-well plates under the same conditions for 24 hours. After co-culture, T cells were carefully washed away using PBS, and the remaining adherent tumor cells were fixed with 4% paraformaldehyde for 15 minutes. Following fixation, the tumor cells were stained with crystal violet for 30 minutes to visualize and quantify the remaining viable cells.
ELISA
The supernatant from the co-cultured cells was collected and analyzed to measure the levels of interferon-gamma (IFN-γ), tumor necrosis factor alpha (TNF-α), and granzyme B (GZMB), using ELISA kits (Table S3). The supernatant was centrifuged at 4,000 rpm for 20 minutes at 4 °C to remove any debris, and the cleared supernatants were then stored at -80 °C until they were used for the ELISA assay. The ELISA kits were used following the manufacturer’s instructions to ensure accurate measurements of the cytokine and enzyme levels in the supernatant.
Patient-derived organoid construction
Colorectal tumor tissues were obtained from patients at the Seventh Affiliated Hospital of Sun Yat-sen University. The study protocol was approved by the Research Ethics Committee of the Seventh Affiliated Hospital of Sun Yat-sen University, and all participants provided written informed consent. The acquisition of biological specimens strictly followed the principles of the Declaration of Helsinki.
Fresh sterile tumor tissues were placed in phosphate-buffered saline (PBS) supplemented with penicillin-streptomycin and maintained on ice. Under a biosafety cabinet, tissues were minced into small fragments on ice and transferred to a 15-mL tube. Digestion was performed in DMEM containing 10% fetal bovine serum and collagenase V (1 mg/mL) at 37 °C for 1 h, with intermittent shaking every 15 min. Digestion was terminated by addition of cold PBS, followed by centrifugation at 300 x g for 10 min at 4 °C. The pellet was further digested with TrypLE (Thermo Fisher) at 37 °C for 5 min, and the reaction was stopped with cold PBS. The cell suspension was filtered through a 40-um nylon mesh strainer and centrifuged at 1000 rpm for 5 min. The resulting cells were resuspended in DMEM, mixed with pre-chilled Matrigel (BioCoat) at a 1:1 ratio, and seeded as 10-uL droplets in 6-well plates. After Matrigel polymerization at 37 °C for 30 min, complete human colorectal cancer organoid culture medium (Solarbio) was added, and organoids were maintained at 37 °C in a 5% CO2 humidified incubator.
For passaging, organoids were washed with PBS, dissociated with TrypLE at 37 °C for 15 min, and centrifuged at 7000 rpm for 8 min. The pellet was resuspended in DMEM containing 10% fetal bovine serum, mixed 1:1 with Matrigel, and re-seeded. Culture medium was replaced every 3–5 days by exchanging half of the medium volume, and organoids were passaged every 7-8 days. Organoid viability was assessed using the Cell Counting Kit-8 (CCK-8) assay (Yeasen) according to the manufacturer's instructions. All co-culture experiments were performed using organoids within passages 1–3 (P1–P3).
In vivo tumor assay
For in vivo experiments, 6-week-old C57BL/6 mice were subcutaneously inoculated with either 5 x 10⁵ MC38-OVA or B16F10-OVA cells. Mice were randomly assigned to experimental groups as detailed in the group information shown in Figures S6, S7, and Figure 6. For knockdown experiments, OT-1 T cells were transfected with NC or si-Fcho1 siRNA prior to adoptive transfer. For overexpression experiments, OT-1 T cells were transfected with Fcho1-encoding mRNA or empty vector control in vitro prior to adoptive transfer.
On day 7 post-tumor inoculation, when subcutaneous tumors became palpable, OT-1 T cells were administered via intravenous (i.v.) injection to the indicated subgroups, with repeat injections on days 15 and 23. For PD-1 blockade, 200 µg of anti-PD-1 monoclonal antibody (Selleck, A2122) was administered by intraperitoneal (i.p.) injection every 3 days beginning on day 12 post-tumor inoculation, continuing for 2 weeks. Tumor volume was monitored at regular intervals. Mice were sacrificed on day 31 post-tumor inoculation; tumors were excised, photographed, and weighed. For MC38-OVA experiments, tumor tissues were embedded in paraffin, sectioned, and subjected to IHC analysis to evaluate immune cell infiltration and expression of key immune markers; specific antibodies are listed in Table S3.
For B16F10-OVA experiments, tumor-infiltrating lymphocytes were isolated from excised tumors and analyzed by flow cytometry. Single-cell suspensions were prepared by mechanical dissociation followed by density gradient centrifugation. Cells were stained with fluorochrome-conjugated antibodies against Gzmb, Ifn-γ, Tnf-α, and Pd-1, and acquired on a flow cytometer. Data were analyzed using FlowJo software (v10.8.1).
Patients and tissue samples
GC and CRC paraffin-embedded slices of surgical specimens were collected from 60 patients who underwent surgery at Seventh Affiliated Hospital of Sun Yat-sen University between 2019 and 2024. Based on the response of the patients, they were classified into four categories: complete response (CR) (GC:n=11, CRC:n=6), partial response (PR) (GC:n=9, CRC:n=8), stable disease (SD) (GC:n=7, CRC:n=7) or progressive disease (PD) (GC:n=9, CRC:n=3). All patients provided informed consent and had received neoadjuvant chemotherapy supplemented with anti-PD-1 therapy. The CPS (Combined Positive Score) for each patient, representing the total number of PD-L1 positive tumor cells and PD-L1 positive tumor-associated immune cells per 100 tumor cells, was collected for the study. All patients were regularly followed up. The study was approved by the Medical Ethics Committee of the Seventh Affiliated Hospital of Sun Yat-sen University, and written informed consent was obtained from all patients who provided samples. All patients had histologically confirmed diagnoses of GC or CRC.
Histological and immunohistochemical analyses
For HE staining, paraffin-embedded tissue sections underwent a series of preparatory steps, including dewaxing, rehydration, antigen retrieval, and antigen blocking. Hematoxylin and Eosin staining were performed sequentially.
For IHC, the expression of specific molecules in paraffin-embedded tissue sections was analyzed by immunohistochemical staining. Tissue sections were incubated with target antibodies, with the specific antibodies used listed in Table S3. After washing, sections were incubated with anti-rabbit/mouse IgG secondary antibody and DAB reagents. Each case was then scored by a pathologist blinded to the study.
For multiplex immunofluorescence staining, primary antibodies were incubated with the tissue sections, followed by incubation with HRP-labeled secondary antibodies. The Opal signal was generated using a TSA amplification working solution combined with a tyramide signal amplification reagent (1:200). Antigen retrieval was performed using a microwave heating method. The tissue was placed in Ethylene Diamine Tetraacetic Acid (EDTA) antigen retrieval buffer, heated to boiling on high power, and maintained on low power for 10 minutes. After heating, the retrieval buffer was removed and allowed to cool to room temperature. Sections were then stained with additional primary antibodies as per the protocol (specific antibodies listed in Table S3). The Whole Slide Scanner VS200 (Olympus) was used to obtain both single-channel and merged images, which were then analyzed using the XV Viewer software. The expression levels and spatial distribution of marker proteins within the tumor microenvironment were assessed in five randomly selected fields at 40× magnification from each gastric or colorectal cancer section. Representative images were extracted and processed with ImageJ (v1.8.0) to quantify fluorescence intensity and sample area.
Statistical Analyses
R software (V.4.1.1) and associated R packages were used for data analyses, such as the “limma” package for difference analyses and the “survminer” package for survival analyses. The data analyses in this study were primarily conducted using GraphPad Prism V.8.0, with a priori statistical significance set at p < 0.05. Comparative analyses were performed using independent t-tests between groups, while categorical data were analyzed using the χ² test. No artificial intelligence (AI) tools were used for study design, data collection, data analysis, or figure generation in this study; AI (Biomni, Phylo) was used only for language editing, as stated in the Acknowledgements.
Results
FCHO1 expression in immune cells of the tumor microenvironment
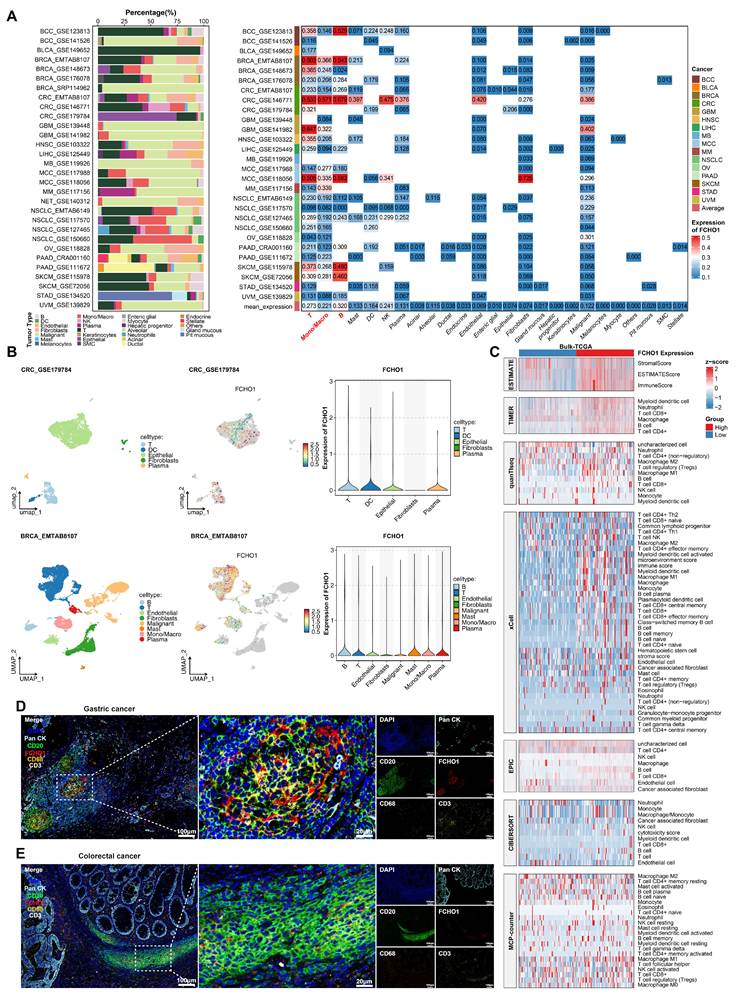
The analysis of normal tissues and pan-cancer cell lines indicated FCHO1 is highly expressed in immune-rich organs, including lymph nodes, spleen, appendix, and hematopoietic tissues, whereas its expression is significantly lower in the lung, prostate, cervix, and smooth muscle (Figure S1A-B). FCHO1 was significantly overexpressed in T cells, B cells, and NK cells (Figure S1C). To determine the expression of FCHO1 within the TME, we analyzed 28 pan-cancer single-cell RNA sequencing (scRNA-seq) datasets, encompassing a total of 710,030 cells. In 16 cancer types, FCHO1 was predominantly expressed in immune cells, particularly B cells, T cells, and macrophages, at levels significantly greater in malignant cells and other TME cell populations, such as epithelial, endothelial, and fibroblastic cells (Figure 1A). Additional subgroup analysis of colorectal cancer (GSE179784) and breast cancer (EMTAB8107) indicated that, based on Uniform Manifold Approximation and Projection (UMAP), FCHO1 was predominantly expressed in T and B cells (Figure 1B). To further elucidate the distribution and potential functional implications of FCHO1 in tumors, we integrated immune infiltration data from The Cancer Genome Atlas Program (TCGA) across 23 cancer types, using a variety of analytical tools, including Estimation of STromal and Immune cells in MAlignant Tumor tissues using Expression data (ESTIMATE), Tumor Immune Estimation Resource (TIMER), Quantitative Tissue Immune Estimation by RNA-seq (quanTIseq), Microenvironment Cell Populations-counter (MCP-counter), Estimating the Proportions of Immune and Cancer cells (EPIC), Cell-type Identification By Estimating Relative Subsets Of RNA Transcripts (CIBERSORT) and Xcell. These analyses indicated a significant positive correlation between FCHO1 expression and immune infiltration, particularly for CD4+ T cells, CD8+ T cells, and B cells (Figure 1C). Multiplex immunofluorescence assays of gastric and colorectal cancer tissues confirmed that FCHO1 primarily co-localizes with T and B cells, rather than macrophages or tumor cells (Figure 1D-E).
Evaluation of FCHO1 expression in the tumor microenvironment (TME) in pancancer. (A) Left: Proportion of annotated cell types in the 28 pan-cancer scRNA-seq datasets. Right: Heatmap showing the distribution of FCHO1 expression among the 28 pan-cancer scRNA-seq datasets. (B) Uniform Manifold Approximation and Projection (UMAP) plot displaying cell type annotations and FCHO1 expression distribution from two scRNA-seq datasets. The violin plot shows the distribution of FCHO1 within the cell clusters. (C) Heatmap based on seven immune infiltration algorithms (ESTIMATE, TIMER, quanTIseq, xCell, EPIC, CIBERSORT, MCP-counter), showing higher immune infiltration in the high FCHO1 expression group. A total of 7,781 tumor samples from 23 TCGA cancer types were dichotomized into FCHO1-high (n = 3,890) and FCHO1-low (n = 3,891) groups by the median FCHO1 expression level (for deconvolution-based algorithms, samples were de-duplicated at the sample level, n = 7,736); infiltration scores were z-score-transformed for visualization (truncated at ±2). Between-group differences were assessed using two-sided Wilcoxon rank-sum tests with Benjamini-Hochberg adjustment, with adjusted p < 0.05 considered statistically significant. (D-E) Multiplex immunofluorescence staining (DAPI, FCHO1+, CD20+, CD3+, CD68, PanCK) showing co-localization of FCHO1 with CD3 and CD20 markers (gastric and colorectal cancer). Scale bar, 20 μm.
To determine the biological functions of FCHO1, pathway enrichment analysis, using Gene Set Variation Analysis (GSVA), indicated immune and inflammatory pathways, including interferon-γ and α responses, complement activation, IL2-Signal transducer and activator of transcription 5 (STAT5) signaling, and IL6-Janus activated kinase (JAK)-STAT3 pathways, were consistently enriched in high FCHO1-expressing groups (Figure S2A). Conversely, for oxidative phosphorylation, bile acid metabolism, lipogenesis and fatty acid metabolism, there was a significant inverse correlation with FCHO1 expression. Kyoto Encyclopedia of Genes and Genome (KEGG) pathway enrichment analysis further validated a significant positive correlation with T cell and B cell receptor signaling pathways (Figure S2B-C), while hallmark analysis indicated the involvement of cell cycle progression and inflammation, and the suppression of angiogenesis and metabolic processes (Figure S2D-E).
Further analysis of TCGA and Genotype-Tissue Expression (GTEx) datasets indicated that FCHO1 expression was significantly increased in tumor samples across more than 20 cancer types, compared to adjacent normal tissues (Figure S1D-F). To validate these findings in gastrointestinal cancers, we analyzed FCHO1 expression in colorectal and gastric cancer datasets from Gene Expression Omnibus (GEO) and further confirmed its expression at the mRNA and protein levels in 10 paired patient samples (Figure S3A-B). Multiplex immunofluorescence staining further demonstrated that FCHO1 expression was markedly elevated in both gastric and colorectal cancer tissues compared to matched normal tissues, and that FCHO1 co-localized predominantly with CD8+ T cells rather than Pan-CK+ tumor cells within the tumor microenvironment (Figure S3C-D). In conclusion, our comprehensive multi-omics pan-cancer analysis indicated that FCHO1 was broadly expressed in tumor-infiltrating lymphocytes in the TME of solid tumors.
FCHO1 regulates T cell immune phenotype via clathrin-mediated endocytosis
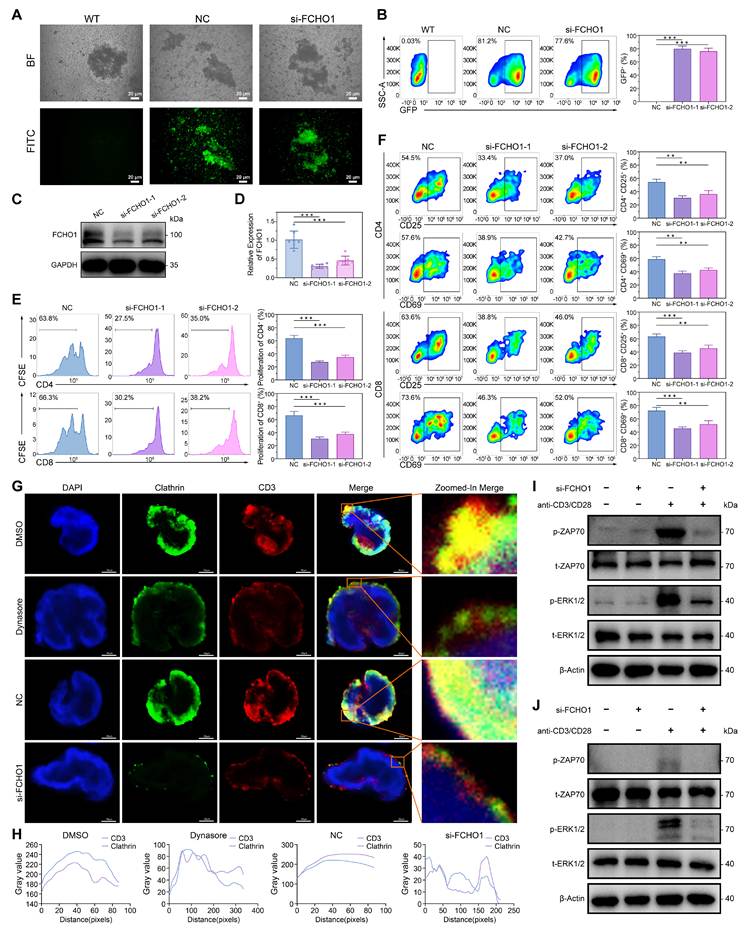
To determine the specific role of FCHO1 in lymphocytes, peripheral blood mononuclear cells (PBMCs) were isolated from healthy donors, followed by CD3+ T-cell isolation using the BD IMag™ Cell Separation Magnet bead method. Small interfering RNA (siRNA) targeting FCHO1 and negative controls were delivered into T cells using a biomolecular condensate system, and immunofluorescence analysis confirmed successful nucleic acid delivery into T cells (Figure 2A-B). Knockdown of FCHO1 was confirmed at both the mRNA and protein levels (Figure 2C-D). Flow cytometry analysis indicated that FCHO1 knockdown significantly inhibited the proliferation of CD4+ and CD8+ T cells (Figure 2E), suggesting that FCHO1 plays an important role in T-cell proliferation. FCHO1 knockdown also produced a significant decrease in the expression of activation markers CD25 and CD69 in both CD4+ and CD8+ T cells (Figure 2F), further supporting the crucial role of FCHO1 in maintaining T-cell activation.
FCHO1 regulates T-cell immune phenotype by clathrin-mediated endocytosis (CME). (A-B) Immunofluorescence and flow cytometry indicate successful delivery of nucleic acids into T cells using a biomolecular condensate delivery system. Scale bar, 20 μm. (C-D) Western blot and qPCR confirm FCHO1 knockdown in T cells. (E) FCHO1 knockdown affects the proliferation of CD4+ and CD8+ T cells. (F) FCHO1 knockdown affects activation markers in CD4+ and CD8+ T cells. (G-H) Immunofluorescence staining and confocal microscopy reveal the co-localization of clathrin and CD3 proteins in Jurkat cells after FCHO1 knockdown or treatment with a CME inhibitor. Scale bar, 20 and 50 μm. (I) Western blot analysis of ZAP70 and ERK1/2 phosphorylation levels in primary human CD3+ T cells following FCHO1 knockdown under anti-CD3/CD28 stimulation. (J) Western blot analysis of ZAP70 and ERK1/2 phosphorylation levels in Jurkat cells following FCHO1 knockdown under anti-CD3/CD28 stimulation. Data are presented as mean ± s.d. from n = 3 biologically independent experiments. **p < 0.01; ***p < 0.001.
FCHO1 is a key molecule involved in clathrin-mediated endocytosis (CME), and the transferrin receptor is a well-established marker for clathrin-dependent uptake. To further determine whether FCHO1 deficiency impairs CME in T cells, we assessed transferrin receptor internalization. Jurkat cells and primary T cells were incubated with fluorescently labeled transferrin at low temperature, followed by a shift to physiological temperature to allow internalization. FCHO1 knockdown significantly impaired transferrin uptake in both Jurkat cells and primary T cells compared to negative controls (Figure S4A-B), confirming that FCHO1 is required for efficient CME.
T-cell activation and effector functions are primarily dependent on the extent and specificity of TCR-mediated signaling. The CD3 complex, an essential component of the TCR complex, is crucial for mediating T-cell activation. To determine whether FCHO1 modulates T-cell activation by affecting CME of the TCR complex, immunofluorescence and confocal microscopy were performed. Treatment with Dynasore, a dynamin GTPase inhibitor that blocks CME, and FCHO1 knockdown both significantly decreased the co-localization of CD3 and clathrin in Jurkat cells (Figure 2G-H), suggesting that FCHO1 regulates TCR membrane dynamics through CME. CME-mediated internalization of the TCR/CD3 complex is known to facilitate receptor recycling and sustain downstream signal transduction by concentrating signaling components within endosomal compartments[27,28]. To determine whether impaired CME upon FCHO1 knockdown consequently attenuates TCR proximal signaling, we examined the phosphorylation of ZAP70 and ERK1/2, two key kinases downstream of TCR engagement. Western blot analysis demonstrated that FCHO1 knockdown markedly reduced the phosphorylation of ZAP70 and ERK1/2 in primary CD3+ T cells following anti-CD3/CD28 stimulation (Figure 2I), and similar results were observed in Jurkat cells (Figure 2J). These findings indicate that FCHO1-dependent CME is required for sustained TCR signal transduction.
Further analysis indicated that FCHO1 knockdown upregulated the exhaustion markers PD-1 and CTLA-4 (Figure S4C), as well as LAG-3 and TIM-3 (Figure S4D), in both CD4+ and CD8+ T cells. These changes indicate that loss of FCHO1 impairs T-cell activation and promotes T-cell exhaustion, thereby diminishing anti-tumor immune efficacy. Collectively, these results demonstrate that FCHO1 plays a vital role in maintaining the activation and functional integrity of T cells through regulation of CME of the TCR complex.
FCHO1 deficiency impairs mitochondrial oxidative phosphorylation in T cells
As a membrane-associated protein, FCHO1 may also play roles within the cell beyond its established function in endocytosis. To determine the downstream signaling mechanisms affected by FCHO1, we first isolated total RNA from negative control (NC) and si-FCHO1 groups in both Jurkat cells and primary T cells, followed by quality control and high-throughput sequencing (Figure 3A). Using the Mfuzz clustering algorithm, we identified nine expression clusters, with Cluster 7 showing a consistent downregulation trend in the si-FCHO1 group across both cell types (Figure 3B). Gene heatmap analysis of Cluster 7 revealed enrichment in pathways related to oxidative phosphorylation, mitochondrial function, aerobic respiration, and ATP synthesis-coupled electron transport, suggesting impaired mitochondrial function upon FCHO1 loss (Figure 3C). Gene Ontology (GO) and KEGG enrichment analyses of Cluster 7 genes consistently highlighted mitochondrial function and metabolic processes, including oxidative phosphorylation, aerobic respiration, and electron transport chain components (Figure S5A-D). Gene Set Enrichment Analysis (GSEA) further confirmed that oxidative metabolism-related gene signatures, including ATP metabolic process, mitochondrial ATP synthesis-coupled proton transport, and oxidative phosphorylation, were significantly suppressed in both Jurkat cells and primary T cells after FCHO1 knockdown (Figure S5E-F).
Loss of FCHO1 impairs mitochondrial function and suppresses OXPHOS. (A) Schematic diagram of the RNA-seq workflow. (B) Mfuzz clustering analysis of RNA-seq data identifies nine expression clusters across Jurkat and primary T cells. (C) Heatmap of genes in Cluster 7 reveals enrichment of pathways related to oxidative phosphorylation, mitochondrial function, aerobic respiration, and ATP synthesis-coupled electron transport. (D) Representative fluorescence images and quantification of intracellular ATP levels detected by ATP probe staining in NC, si-FCHO1, DMSO, si-FCHO1+Oligomycin, and si-FCHO1+AICAR groups. (E) Oxygen consumption rate (OCR) analyses of mitochondrial respiration capacity, including basal respiration, maximal respiration, ATP production, and spare respiratory capacity, in Jurkat cells and primary T cells across the indicated treatment groups. (F) Western blot analysis of mitochondrial respiratory chain complex proteins (CV-ATP5A1, CIII-UQCRC1, CII-SDHB, CIV-MTCO2, CI-NDUFB8) in Jurkat cells and primary T cells across the indicated treatment groups. Data are presented as mean ± s.d. from n = 3 biologically independent experiments. *p < 0.05; **p < 0.01; ***p < 0.001; ****p < 0.0001; ns, not significant.
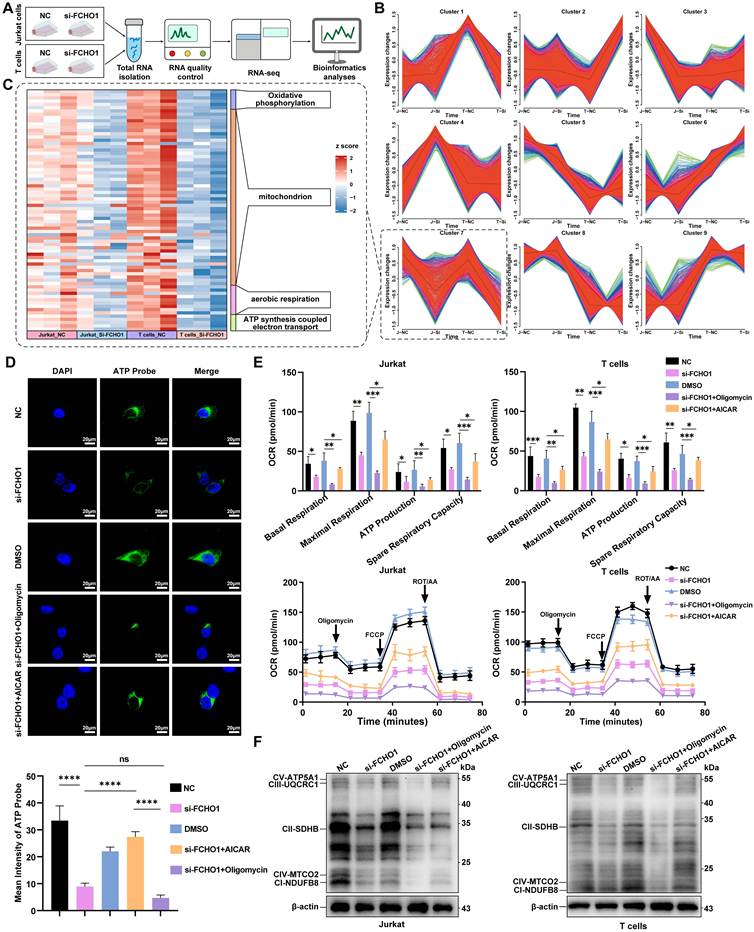
To functionally validate these transcriptomic findings, intracellular ATP levels were assessed by ATP probe fluorescence staining across five experimental groups: NC, si-FCHO1, DMSO, si-FCHO1 + oligomycin (an inhibitor of OXPHOS), and si-FCHO1 + AICAR (an AMPK activator and OXPHOS activator). ATP levels were significantly decreased in the si-FCHO1 group compared to NC, with the si-FCHO1 + oligomycin group showing the lowest ATP production. In contrast, AICAR partially restored ATP levels in si-FCHO1 cells (Figure 3D). Seahorse metabolic flux analysis further demonstrated that FCHO1 knockdown significantly reduced basal respiration, maximal respiration, ATP-linked respiration, and spare respiratory capacity in both Jurkat cells and primary T cells. Oligomycin further suppressed these parameters, while AICAR partially reversed the effects of FCHO1 silencing (Figure 3E), supporting the role of FCHO1 in maintaining mitochondrial energy output. Western blot analysis of mitochondrial respiratory chain complex proteins (CV-ATP5A1, CIII-UQCRC1, CII-SDHB, CIV-MTCO2, and CI-NDUFB8) confirmed the downregulation of OXPHOS complexes in si-FCHO1 Jurkat cells and primary T cells (Figure 3F), corroborating the transcriptomic and metabolic findings.
FCHO1 deficiency impairs mitochondrial homeostasis and suppresses mTOR signaling
To further characterize the mitochondrial alterations induced by FCHO1 deficiency, transmission electron microscopy (TEM) was performed. FCHO1 knockdown resulted in marked changes in mitochondrial morphology in Jurkat cells, with significant reductions in both mitochondrial length and area compared to NC cells (Figure 4A). Assessment of mitochondrial membrane potential by JC-1 staining revealed a significant decrease in the JC-1 aggregate-to-monomer ratio in si-FCHO1 cells, comparable to the depolarization induced by the uncoupler CCCP, indicating impaired mitochondrial membrane potential (Figure 4B, E). Consistent results were obtained with TMRE staining, which showed reduced mitochondrial membrane potential in si-FCHO1 cells relative to vehicle controls (Figure 4C, F). Furthermore, MitoSOX Red staining demonstrated a significant elevation of mitochondrial reactive oxygen species (ROS) in si-FCHO1 cells compared to NC controls (Figure 4D, G), indicating increased mitochondrial oxidative stress upon FCHO1 loss.
FCHO1 deficiency impairs mitochondrial homeostasis and suppresses mTOR signaling in T cells. (A) Transmission electron microscopy images of mitochondrial morphology in NC and si-FCHO1 Jurkat cells, with quantification of mitochondrial length and area. Scale bar, 1 and 5 µm. (B, E) Representative fluorescence images and quantification of mitochondrial membrane potential assessed by JC-1 staining in Vehicle, CCCP, NC, and si-FCHO1 groups. The ratio of JC-1 aggregates to monomers is shown. Scale bar, 10 µm. (C, F) Representative fluorescence images and quantification of mitochondrial membrane potential assessed by TMRE staining in Vehicle, CCCP, NC, and si-FCHO1 groups. Scale bar, 20 µm. (D, G) Representative fluorescence images and quantification of mitochondrial reactive oxygen species (ROS) levels assessed by MitoSOX Red staining in Control, mSoxUp, NC, and si-FCHO1 groups. Scale bar, 20 µm. (H) Gene Set Enrichment Analysis (GSEA) showing significant negative enrichment of the mTOR signaling pathway in si-FCHO1 primary T cells (NES = -1.5781, nominal P = 0.0086, adjusted P = 0.046), with a similar but statistically non-significant trend in Jurkat cells (NES = -1.5379, nominal P = 0.0235, adjusted P = 0.8551). (I) Western blot analysis of p-mTOR, t-mTOR, p-S6K1, t-S6K1, p-4EBP1, and t-4EBP1 in primary T cells and Jurkat cells following FCHO1 knockdown under anti-CD3/CD28 stimulation with or without Rapamycin treatment. (J) Oxygen consumption rate (OCR) analyses of mitochondrial respiration in NC, si-FCHO1, NC+Rapamycin, si-FCHO1+Rapamycin, and si-FCHO1+MHY1485 groups, with quantification of ATP production, basal respiration, maximal respiration, and spare respiratory capacity. Data are presented as mean ± s.d. from n = 3 biologically independent experiments. ns, not significant; *p < 0.05; **p < 0.01; ***p < 0.001; ****p < 0.0001.
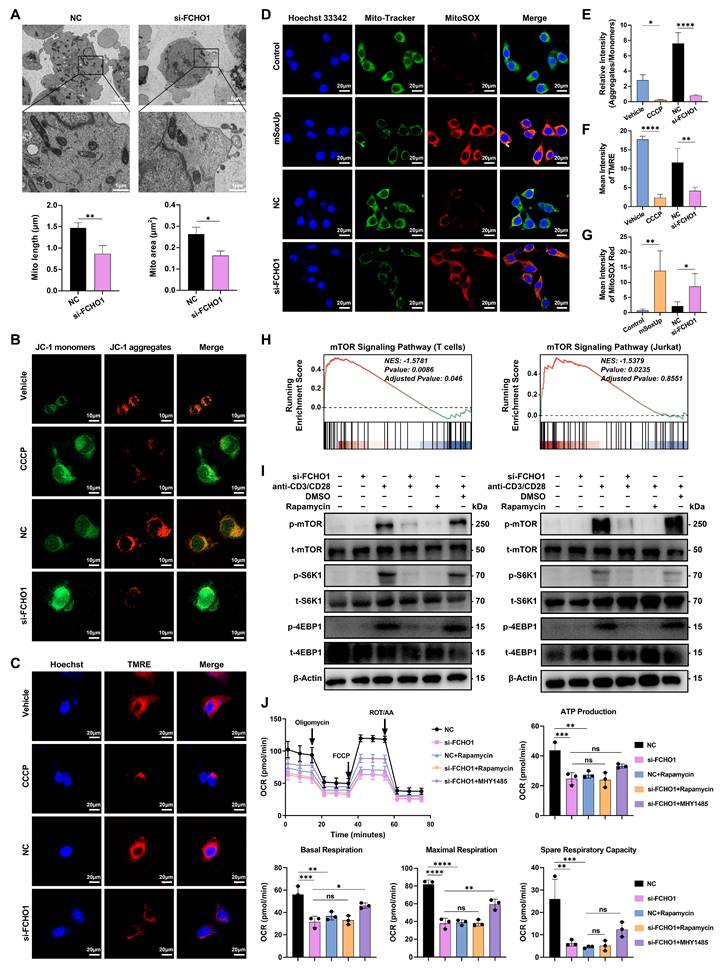
To investigate the upstream signaling mechanism linking FCHO1-dependent CME to mitochondrial dysfunction, GSEA was performed on the RNA-seq data. The mTOR signaling pathway was significantly negatively enriched in si-FCHO1 primary T cells (NES = -1.5781, Adjusted P = 0.046), with a similar trend observed in Jurkat cells (NES = -1.5379, Adjusted P = 0.8551) (Figure 4H). To validate this at the protein level, Western blot analysis demonstrated that FCHO1 knockdown markedly reduced the phosphorylation of mTOR, S6K1, and 4EBP1 in both primary T cells and Jurkat cells under anti-CD3/CD28 stimulation, and these effects were further enhanced by Rapamycin treatment (Figure 4I). To establish a causal link between mTOR signaling suppression and the observed mitochondrial OXPHOS defects, Seahorse metabolic flux analysis was performed with pharmacological modulation of mTOR activity. Rapamycin treatment phenocopied the FCHO1 knockdown-induced reduction in mitochondrial respiration, while the mTOR activator MHY1485 partially rescued the OXPHOS impairment in si-FCHO1 cells, restoring ATP production, basal respiration, maximal respiration, and spare respiratory capacity (Figure 4J). Collectively, these findings demonstrate that FCHO1 sustains mitochondrial oxidative metabolism in T cells through activation of the mTOR signaling pathway, establishing a functional axis linking CME to metabolic fitness in T cells.
FCHO1 influences T cell anti-tumor activity
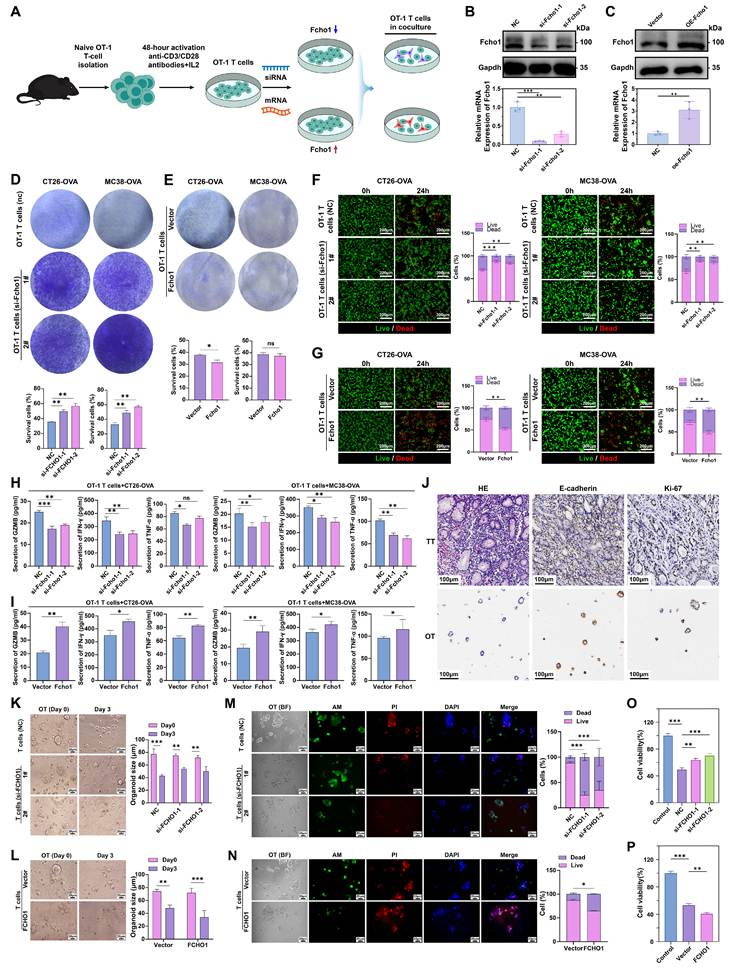
Cytotoxic T lymphocytes (CTLs) are the primary effector cell population responsible for eliminating tumor cells within the TME[29]. We used a co-culture system to determine the cytotoxic activity of OT-1 CD8+ T cells in tumor cells. OT-1 CD8+ T cells were activated, in vitro, using anti-CD3 and anti-CD28 antibodies, with IL-2 supplementation, to increase T-cell activation. Subsequently, siRNA and mRNA were transfected into the CD8+ T cells, using a biomolecular condensate system to produce Fcho1 knockdown and overexpression. These modified T cells were then co-cultured with the ovalbumin (OVA)-expressing tumor cells, CT26 and MC38 (Figure 5A). The efficiency of the Fcho1 knockdown and overexpression was confirmed at the mRNA and protein level (Figure 5B-C). In vitro cytotoxicity assays, using crystal violet staining (Figure 5D) and IncuCyte™ Cytotoxicity Reagents (Figure 5F), indicated that silencing Fcho1 significantly impaired T-cell-mediated tumor cell elimination. In contrast, cytotoxicity was significantly increased in T cells overexpressing Fcho1, indicating a greater efficacy in removing tumor cells, compared to the vector control (Vec) group (Figure 5E and G). These results indicated that Fcho1 plays a critical role in T cell-mediated tumor killing, with Fcho1 knockdown inhibiting T-cell effector function and Fcho1 overexpression increasing function. Furthermore, Fcho1 knockdown produced a significant decrease in the expression of the effector cytokines, interferon-γ (IFN-γ), tumor necrosis factor-α (TNF-α), and granzyme B (GZMB) in T cells (Figure 5H). In contrast, there was a significant increase in the expression of these cytokines and granzyme B in T cells overexpressing Fcho1 (Figure 5I). To further validate these findings in a physiologically relevant model, we established patient-derived organoids (PDOs) from colorectal cancer tissue and confirmed their histopathological characteristics (Figure 5J). Under normal conditions, PDOs formed well-structured spheroids. After co-culturing with T cells for 3 days, the organoids in the FCHO1 knockdown group appeared larger, more translucent, and had lower apoptosis levels, compared to the control group (Figure 5K). In contrast, organoids co-cultured with FCHO1-overexpressing T cells were smaller in size and had higher apoptosis levels, compared to vector control (Figure 5L). Live/dead staining using Calcein-AM and propidium iodide (PI) indicated that, compared to FCHO1-knockdown T cells, the negative control T cells were significantly more cytotoxic in the organoids (Figure 5M). Conversely, T cells overexpressing FCHO1 had a higher level of cytotoxicity, producing greater apoptosis in the organoids, further confirming the critical role of FCHO1 in T-cell anti-tumor efficacy (Figure 5N). To directly quantify organoid viability, CCK-8 assays were performed. Consistent with the imaging results, organoids co-cultured with FCHO1-knockdown T cells showed significantly higher cell viability compared to NC controls, while organoids co-cultured with FCHO1-overexpressing T cells exhibited significantly reduced viability compared to vector controls (Figure 5O-P). Together, these results provide direct quantitative evidence that FCHO1 expression level governs the cytotoxic capacity of CD8+ T cells in organoid models.
FCHO1 modulates T-cell-mediated tumor cell killing. (A) Schematic representation of co-culture experiments using activated OT-1 T cells co-cultured with OVA-expressing tumor cells. (B-C) Western blot and qPCR confirm Fcho1 knockdown and overexpression efficiency in OT-1 CD8+ T cells. (D-E) Colony formation assays demonstrating the cytotoxic effect of Fcho1 knockdown and overexpressing OT-1 CD8+ T cells on CT26-OVA and MC38-OVA cells, with quantification of surviving colonies. (F-G) Live/dead cell imaging assays of CT26-OVA and MC38-OVA cells co-cultured with Fcho1 knockdown and overexpressing OT-1 CD8+ T cells at 0 h and 24 h. Representative merged images show live cells (green) and dead cells (red), with quantification of live and dead cell proportions. Scale bar, 200μm. (H-I) ELISA analysis of IFN-γ, TNF-α, and GZMB secretion in the supernatant from co-cultures of CT26-OVA and MC38-OVA cells with Fcho1 knockdown and overexpressing OT-1 CD8+ T cells. (J) Representative images of HE staining, E-cadherin immunohistochemistry, and Ki-67 immunohistochemistry in tumor tissue (TT) and organoid tissue (OT). Scale bar, 100 μm. (K-L) Representative brightfield images of colorectal cancer organoids cultured alone or co-cultured with FCHO1 knockdown (K) and overexpressing (L) T cells at Day 0 and Day 3, with quantification of organoid area. Scale bar, 20μm. (M-N) Calcein-AM/PI/DAPI staining of colorectal cancer organoids co-cultured with FCHO1 knockdown (M) and overexpressing (N) T cells. Calcein-AM (green) indicates live cells, PI (red) indicates dead cells, and DAPI (blue) marks nuclei. Scale bar, 20 μm. (O-P) Quantification of cell viability and cytotoxicity in organoids co-cultured with FCHO1 knockdown (O) and overexpressing (P) T cells. Data are presented as mean ± s.d. from n = 3 biologically independent experiments. *p < 0.05; **p < 0.01; ***p < 0.001; ns, not significant; TT: tumor tissue; OT: organoid tissue.
FCHO1 enhances t-cell-mediated immunotherapy efficacy in vivo
To explore the role of Fcho1 in T-cell-mediated anti-tumor immune responses in vivo, we established a subcutaneous syngeneic MC38-OVA model in C57BL/6 mice (Figure S6A). In the Fcho1 knockdown experiment, mice without OT-1 T-cell therapy showed the most rapid tumor progression, confirming the anti-tumor efficacy of adoptively transferred OT-1 T cells. Mice treated with Fcho1-deficient OT-1 T cells had significantly larger tumor volumes and weights compared to NC T-cell-treated mice (Figure S6B-D), demonstrating that Fcho1 deficiency impairs T-cell-mediated tumor suppression. Furthermore, Fcho1 knockdown attenuated the tumor-suppressive effect of anti-PD-1 combination therapy. IHC staining demonstrated that Fcho1 knockdown decreased intratumoral CD8+ T-cell infiltration and Gzmb and Tnf-α expression, while increasing Pd-1 and Tigit expression (Figure S6E), supporting the role of Fcho1 in maintaining T-cell effector function and preventing exhaustion.
In the Fcho1 overexpression experiment using the MC38-OVA model (Figure S7A), tumor volume and weight were significantly smaller in the Fcho1 overexpression group compared to the Vec group (Figure S7B-D), indicating that Fcho1 overexpression enhances T-cell-mediated anti-tumor immunity. Notably, the combination of mRNA-Fcho1 OT-1 T cells with anti-PD-1 therapy achieved the greatest tumor suppression among all groups, demonstrating that Fcho1 overexpression potentiates immune checkpoint blockade efficacy. IHC staining confirmed that Fcho1 overexpression increased intratumoral CD8+ T-cell infiltration and Gzmb and Tnf-α expression, while reducing Pd-1 and Tigit expression (Figure S7E).
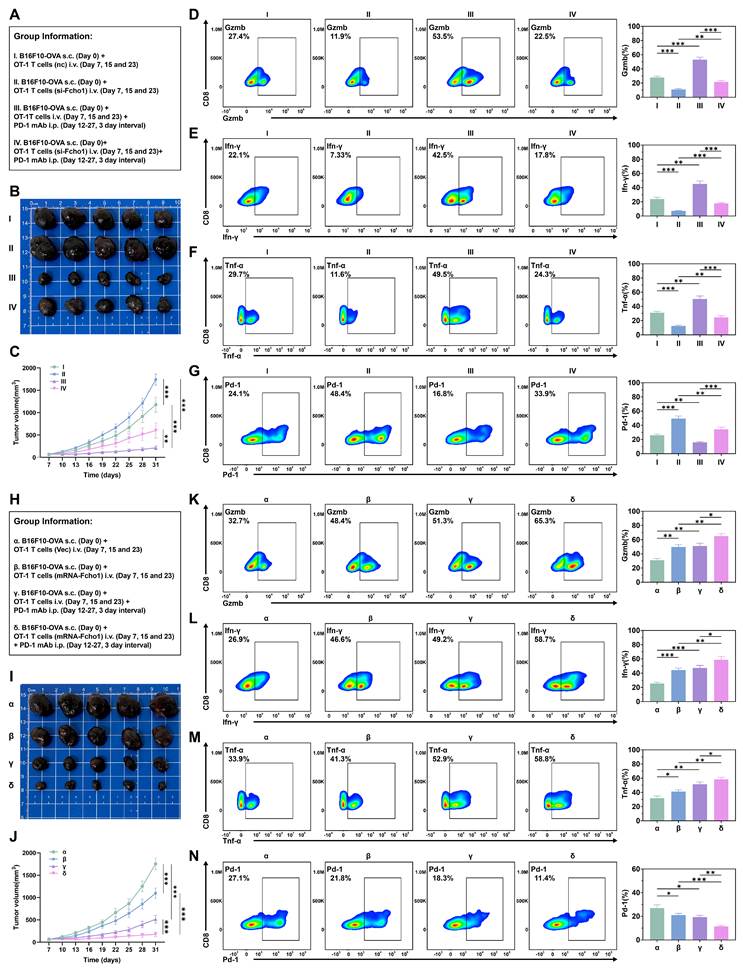
To further validate these findings in an independent tumor model and characterize the intratumoral immune landscape by flow cytometry, we established a subcutaneous syngeneic B16F10-OVA model in C57BL/6 mice. In the Fcho1 knockdown experiment, si-Fcho1 OT-1 T cells were significantly less effective at controlling tumor growth compared to NC controls, and anti-PD-1 therapy only partially rescued this impairment (Figure 6A-C). Flow cytometry analysis of intratumoral CD8+ T cells revealed that Fcho1 knockdown significantly reduced the proportions of granzyme B-positive (Gzmb+), Ifn-γ+, and Tnf-α+ cells, while markedly increasing Pd-1 expression (Figure 6D-G), indicating impaired effector function and enhanced exhaustion. In the Fcho1 overexpression experiment, mRNA-Fcho1 OT-1 T cells significantly enhanced tumor suppression compared to vector controls, and their combination with anti-PD-1 therapy achieved the greatest anti-tumor efficacy among all groups (Figure 6H-J). Flow cytometry analysis confirmed that Fcho1 overexpression significantly increased the proportions of Gzmb+, Ifn-γ+, and Tnf-α+ intratumoral CD8+ T cells, while reducing Pd-1 expression (Figure 6K-N). Collectively, these in vivo results across two independent tumor models demonstrate that FCHO1 expression in CD8+ T cells is a critical determinant of anti-tumor immunity and immune checkpoint blockade efficacy.
FCHO1 expression in OT-1 T cells modulates anti-tumor immunity and immune checkpoint blockade efficacy in vivo. (A-G) Fcho1 knockdown experiment (B16F10-OVA model). (A) Experimental group information. Group I: B16F10-OVA s.c. (Day 0) + OT-1 T cells i.v. (Day 7, 15 and 23); Group II: B16F10-OVA s.c. (Day 0) + OT-1 T cells si-Fcho1 i.v. (Day 7, 15 and 23); Group III: B16F10-OVA s.c. (Day 0) + OT-1 T cells i.v. (Day 7, 15 and 23) + PD-1 mAb i.p. (Day 12-27, 3-day interval); Group IV: B16F10-OVA s.c. (Day 0) + OT-1 T cells si-Fcho1 i.v. (Day 7, 15 and 23) + PD-1 mAb i.p. (Day 12-27, 3-day interval). (B) Representative images of subcutaneous tumors from each group at the experimental endpoint. (C) Tumor volume growth curves across the four groups over time. (D-G) Flow cytometry analysis of intratumoral CD8+ T-cell effector function, including Gzmb (D), Ifn-γ (E), Tnf-α (F), and Pd-1 (G) expression, with quantification shown in bar graphs. (H-N) Fcho1 overexpression experiment (B16F10-OVA model). (H) Experimental group information. Group α: B16F10-OVA s.c. (Day 0) + OT-1 T cells (Vec) i.v. (Day 7, 15 and 23); Group β: B16F10-OVA s.c. (Day 0) + OT-1 T cells (mRNA-Fcho1) i.v. (Day 7, 15 and 23); Group γ: B16F10-OVA s.c. (Day 0) + OT-1 T cells (Vec) i.v. (Day 7, 15 and 23) + PD-1 mAb i.p. (Day 12-27, 3-day interval); Group δ: B16F10-OVA s.c. (Day 0) + OT-1 T cells (mRNA-Fcho1) i.v. (Day 7, 15 and 23) + PD-1 mAb i.p. (Day 12-27, 3-day interval). (I) Representative images of subcutaneous tumors from each group at the experimental endpoint. (J) Tumor volume growth curves across the four groups over time. (K-N) Flow cytometry analysis of intratumoral CD8+ T-cell effector function, including Gzmb (K), Ifn-γ (L), Tnf-α (M), and Pd-1 (N) expression, with quantification shown in bar graphs. Data are presented as mean ± s.e.m. from n = 5 mice per group. *p < 0.05; **p < 0.01; ***p < 0.001.
FCHO1 as a Promising Biomarker for Predicting Immunotherapy Response
Given the significant correlation between FCHO1 and anti-tumor immune responses, we hypothesized that FCHO1 could serve as a predictive biomarker for immunotherapy efficacy. In 11 human immunotherapy cohorts, patients with high FCHO1 expression had significantly improved overall survival (OS) and progression-free survival (PFS) (Figure S8 and Figure S9A–C). Furthermore, clinical response analyses indicated that high FCHO1 expression was significantly correlated with a greater proportion of complete response (CR) and partial response (PR), whereas the low-expression group had a higher proportion of progressive disease (PD) and stable disease (SD) (Figure S9D). These findings indicated a significant positive correlation between FCHO1 expression and clinical benefit from immune checkpoint blockade (ICB) therapy (Figure S9E).
To further investigate the predictive potential of FCHO1 among cancer tumor types, we performed pan-cancer analyses based on multiple public immunotherapy datasets. In 10 murine immunotherapy cohorts, higher FCHO1 expression was significantly correlated with an increased treatment response (Figure S10A). To assess its value relative to established biomarkers, we compared the area under the receiver operating characteristic curve (AUC) for FCHO1 and several known predictors. Notably, in 15 out of 25 human immunotherapy cohorts, FCHO1 had an AUC greater than 0.5 (Figure S10B). In comparison, tumor mutational burden (TMB), microsatellite instability (MSI) score, T cell clonality, and B cell clonality yielded AUCs > 0.5 in 8, 13, 9, and 7 cohorts, respectively, indicating that FCHO1 may outperform some conventional biomarkers in certain contexts. Cluster heatmap analyses indicated that FCHO1 expression was significantly negatively correlated with indicators of T cell dysfunction, immune exclusion, and ICB resistance phenotypes from Clustered Regularly Interspaced Short Palindromic Repeats (CRISPR) screening datasets but was significantly positively correlated with cytotoxic T lymphocyte infiltration among the majority of immunotherapy cohorts (Figure S10C–D). Together, these findings suggest that FCHO1 may represent a suitable biomarker linked to immune activation and favorable clinical outcomes in the context of ICB therapy.
To determine whether FCHO1 can specifically predict therapeutic outcomes among different ICB regimens, we analyzed ROC plotter data comparing FCHO1 expression to treatment response in patients receiving anti-PD-1, anti-PD-L1, and anti-CTLA-4 therapies. FCHO1 expression was significantly greater in responders among all immunotherapy patients (Figure S10E). In the anti-PD-1 subgroups, FCHO1 levels has a higher predictive value in patients treated with nivolumab, compared to those receiving pembrolizumab (Figure S10F). There was no significant difference in predictive capacity between the different anti-PD-L1 treatment groups (Figure S10G). FCHO1 had the greatest predictive performance in patients receiving durvalumab, a monoclonal antibody that binds to the programmed cell death ligand, PD-L1[30] (Figure S10H).
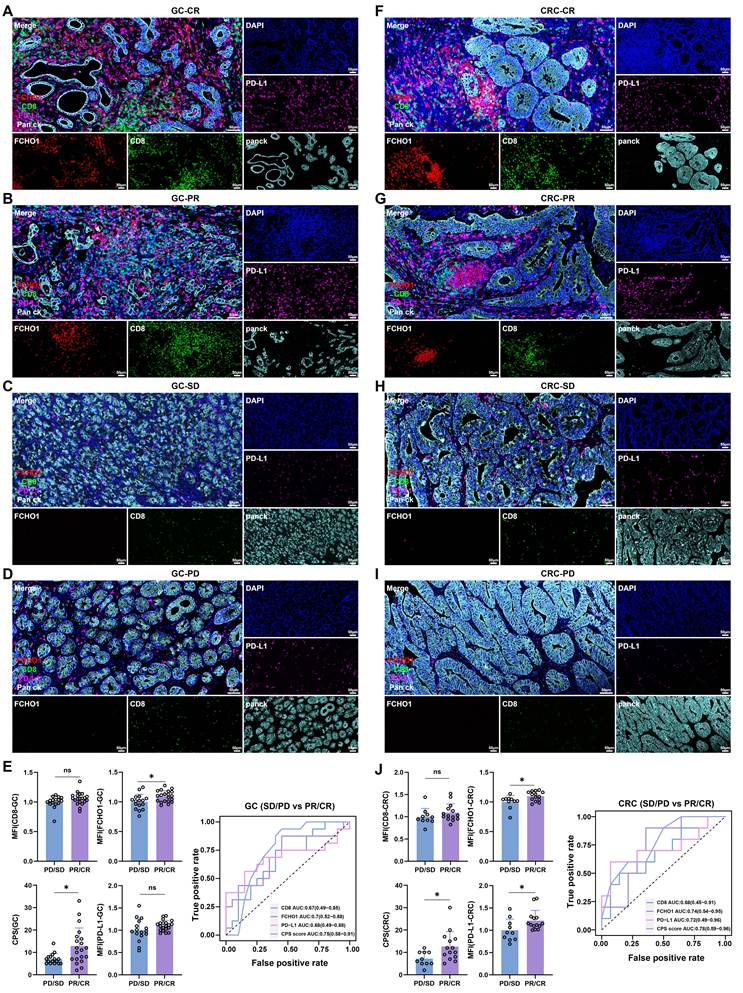
To further evaluate the clinical relevance of FCHO1 in the context of immunotherapy, we analyzed its expression in relation to treatment efficacy in gastrointestinal cancers. Specifically, we performed multiplex immunofluorescence (mIF) staining for pan cytokeratin (PanCK), FCHO1, PD-L1 and CD8, on formalin-fixed paraffin-embedded tumor tissues from 60 patients with GC and CRC, who received neoadjuvant immunotherapy and were categorized into CR, PR, SD, or PD groups. Among these patients, those with favorable responses (CR/PR) had greater levels of FCHO1, CD8, and PD-L1, whereas non-responders (SD/PD) showed significantly weaker staining, particularly in GC cases (Figure 7A–D) and CRC cases (Figure 7F–I). These results suggested that high FCHO1 expression is positively correlated with immunotherapy responsiveness in gastrointestinal cancers. To further assess the predictive utility of FCHO1⁺ T cells in the neoadjuvant setting, we compared its efficacy with CD8 and PD-L1 by analyzing mean fluorescence intensity (MFI) and combined positive score (CPS). ROC curve analyses were conducted to quantify the discriminatory power of each marker. In GC patients, FCHO1 had an AUC of 0.70 (95% CI: 0.52–0.88), outperforming both CD8 (AUC = 0.67, 95% CI: 0.40–0.85) and PD-L1 (AUC = 0.68, 95% CI: 0.49–0.88) in predicting the response to immunotherapy (Figure 7E). Similarly, in CRC patients, FCHO1 had an AUC of 0.74 (95% CI: 0.54–0.95), which was greater than that of CD8 (AUC = 0.68, 95% CI: 0.45–0.91) and PD-L1 (AUC = 0.72, 95% CI: 0.49–0.96) (Figure 7J). Notably, CPS had the highest predictive accuracy, with an AUC of 0.75 (95% CI: 0.58–0.91) in GC and 0.78 (95% CI: 0.59–0.96) in CRC, outperforming the individual markers CD8, PD-L1, and FCHO1. These results underscore the clinical utility of FCHO1 as a novel biomarker for predicting immunotherapy response in gastrointestinal cancer, particularly when used in conjunction with existing markers. Collectively, these results provide compelling evidence that FCHO1 may be a potential predictive biomarker for immunotherapy response, with broad applicability among different cancer tumor types and ICB regimens.
Multiplex immunofluorescence analysis indicated that high FCHO1 expression predicts a better response to immunotherapy. Tissue sections from 36 gastric cancer (A-D) and 24 colorectal cancer (F-I) patients who received neoadjuvant chemotherapy and immunotherapy were stained for FCHO1 (red), CD8 (green), PD-L1 (pink), PanCK (cyan), and DAPI (blue). Based on treatment response, patients were classified as complete response (CR; GC: n = 11, CRC: n = 6), partial response (PR; GC: n = 9, CRC: n = 8), stable disease (SD; GC: n = 7, CRC: n = 7), or progressive disease (PD; GC: n = 9, CRC: n = 3). Average immunofluorescence intensity and ROC curves for gastric cancer (E) and colorectal cancer (J) patient samples; for quantitative comparisons, patients were grouped as responders (CR/PR) and non-responders (SD/PD), and between-group differences were assessed using two-tailed independent Student's t-tests. ROC curves with area under the curve (AUC) and 95% confidence intervals were used to evaluate predictive performance. Scale bar, 50 μm. GC: gastric cancer; CRC: colorectal cancer; CR: complete response; PR: partial response; SD: stable disease; PD: progressive disease; Data are presented as mean ± s.d. *p < 0.05; ns, not significant.
Discussion
FCHO1 is a constituent of the Fes/Cip4 homology Bin/amphiphysin/Rvs (F-BAR) protein family and was first functionally defined as a nucleator of clathrin-mediated endocytosis[31]. Subsequent genetic and multi-omics association studies link FCHO1 to coronary artery disease, Alzheimer's disease, and Guillain-Barré Syndrome[19,32,33]. However, studies on the functional role of FCHO1 in the TME are relatively scarce. In the present study, single-cell pan-cancer analysis demonstrated that FCHO1 is predominantly expressed in immune cells within the TME. Gene set variation analysis (GSVA) and gene set enrichment analysis (GSEA) further revealed that the high FCHO1 expression group is primarily enriched in immune-related pathways, including T cell receptor signaling, B cell receptor signaling, NK cell-mediated cytotoxicity, and chemokine signaling. A recent study shows that its deficiency impairs clathrin-coated pit formation in T cells[34]. Notably, 17 patients with FCHO1 deficiency had severe immune deficiencies[19,20,34], underscoring the non-redundant role of FCHO1 in immune homeostasis. Our in vitro analyses extended these observations, demonstrating significant differences in immunosuppressive phenotypes between FCHO1 knockdown and control T cells, suggesting that reduced FCHO1 expression in tumor-infiltrating T cells may contribute to immune dysfunction within the TME. In vivo experiments using murine tumor models further confirmed that FCHO1 modulates T cell activity and anti-tumor immune responses, and that combining FCHO1 overexpression with immune checkpoint blockade potentiated therapeutic efficacy.
Based on these findings, we next examined the clinical relevance of FCHO1 expression in cancer patients undergoing immunotherapy. Analysis of multiple pan-cancer datasets demonstrated that high FCHO1 expression was significantly associated with improved survival outcomes in patients receiving immunotherapy, suggesting that FCHO1 may facilitate immune cell infiltration, tumor antigen recognition, and ICI efficacy. Consistent with transcriptomic findings, multiplex immunofluorescence (mIF) analysis of gastrointestinal cancer patients receiving neoadjuvant chemoimmunotherapy revealed that patients achieving objective responses (CR/PR) exhibited higher FCHO1 expression compared to non-responders (SD/PD). Elevated CD8 and PD-L1 expression in the CR/PR group further indicated greater immune cell infiltration and more active immune checkpoint engagement, both of which are essential for effective immunotherapy. Together, these findings support FCHO1 expression as a clinically relevant indicator of a favorable tumor immune microenvironment and a potential predictive biomarker for immunotherapy response.
The role of FCHO1 in CME remains to be completely elucidated. Calzoni et al. reported that FCHO1 deficiency impaired transferrin receptor internalization in T-cell blasts[20], while other studies in fibroblasts suggested only minor effects on CME[34]. In our study, using Jurkat cells and T cells, consistent with the findings by Calzoni et al., there was a significant decrease in transferrin uptake after FCHO1 silencing, supporting the hypothesis that FCHO1 is required for efficient internalization of the transferrin receptor in T cells. Furthermore, the loss of FCHO1 disrupted the CME process more broadly, impairing the internalization of the TCR–CD3 complex, a critical step for sustained T-cell activation[27,28,35]. As a result, T-cell functional responses, including tumor cell killing, were significantly decreased. These findings suggested that FCHO1 regulates T-cell anti-tumor activity by maintaining CME-dependent receptor trafficking. Transcriptomic profiling of FCHO1-silenced T cells revealed significant downregulation of genes involved in the oxidative phosphorylation (OXPHOS) pathway, implicating FCHO1 in the regulation of mitochondrial bioenergetics — a previously unrecognized function. Similar findings have been reported in other models, where disruption of mitochondrial respiration produces impaired T-cell effector function[36,37]. Since OXPHOS is essential for sustaining ATP production in activated T cells, the decreased expression of OXPHOS-related genes resulted in a decrease in intracellular ATP levels, thereby compromising the metabolic processes required for effective immune responses[38,39]. Further investigation revealed that FCHO1 loss suppressed mTOR signaling, as evidenced by decreased phosphorylation of S6K1 and 4EBP1, establishing a mechanistic link between CME dysfunction, mTOR inactivation, and mitochondrial metabolic failure in T cells. Functionally, this cascade of metabolic impairment was associated with attenuated tumor cell killing in FCHO1-deficient T cells. Of note, the inverse correlation between FCHO1 expression and the bulk OXPHOS signature across TCGA cohorts (Figure S2) may reflect the cellular heterogeneity of bulk tumors: FCHO1 is expressed predominantly by tumor-infiltrating lymphocytes (Figure 1), whereas the bulk OXPHOS signature is likely shaped mainly by malignant cells, which often adopt glycolytic metabolism in hypoxic, inflamed microenvironments. Cross-sample correlations from mixed cell populations may therefore not reflect regulatory relationships within individual cell subsets and are not necessarily at odds with the cell-intrinsic, positive role of FCHO1 in T-cell OXPHOS.
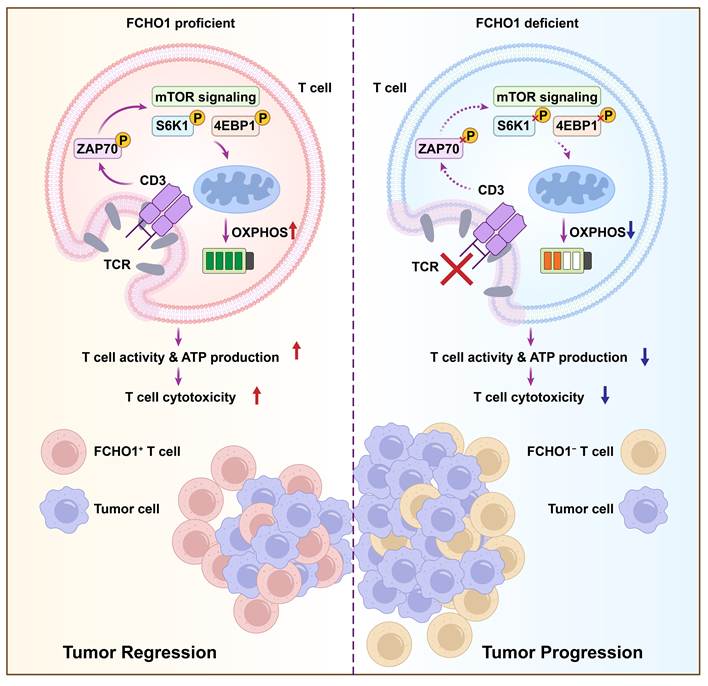
Our study demonstrates that FCHO1 plays a critical role in T-cell-mediated anti-tumor immunity by coordinating CME-dependent receptor trafficking and mitochondrial energy metabolism. Mechanistically, FCHO1 facilitates internalization of the TCR/CD3 complex via CME, sustaining downstream ZAP70-mediated signaling and mTOR pathway activation, which in turn supports mitochondrial OXPHOS and ATP production required for T-cell cytotoxic function (Figure 8). Loss of FCHO1 disrupts this axis, impairing T-cell activation, promoting exhaustion, and ultimately reducing anti-tumor immunity. These findings identify FCHO1 as a key regulator of T cell-dependent tumor killing and suggest that strategies to enhance FCHO1 expression or activity in tumor-infiltrating T cells may represent a novel approach to potentiate anti-tumor immunity and improve the efficacy of immune checkpoint blockade therapy.
Schematic summary of this study. FCHO1 promotes clathrin-mediated endocytosis (CME) of the TCR/CD3 complex, sustaining TCR signal transduction and ZAP70 phosphorylation. In FCHO1-proficient T cells, intact CME maintains downstream mTOR signaling activity, as evidenced by phosphorylation of S6K1 and 4EBP1, which in turn supports mitochondrial oxidative phosphorylation (OXPHOS) and ATP generation, thereby preserving T-cell cytotoxic activity and promoting tumor regression. In contrast, FCHO1 deficiency impairs TCR/CD3 internalization, attenuates ZAP70-mediated TCR signaling, suppresses mTOR signaling, and disrupts OXPHOS and ATP production, ultimately leading to diminished T-cell effector function and tumor progression.
Conclusions
In summary, this study identifies FCHO1 as a novel immune-regulatory molecule with significant clinical relevance in pan-cancer settings, particularly in gastrointestinal tumors. FCHO1 promotes T-cell-mediated anti-tumor immunity by sustaining clathrin-mediated endocytosis of the TCR/CD3 complex, maintaining mTOR-dependent mitochondrial oxidative phosphorylation, and supporting T-cell cytotoxic function. High FCHO1 expression correlates with favorable immunotherapy outcomes across multiple human cohorts, and its overexpression enhances the efficacy of immune checkpoint blockade in preclinical models. These findings support FCHO1 as a promising predictive biomarker and potential therapeutic target in cancer immunotherapy.
Abbreviations
FCHO1: FCH domain only 1; ICBs: Immune checkpoint blockers; CME: Clathrin-mediated endocytosis; TME: Tumor microenvironment; TCGA: The Cancer Genome Atlas; GEO: Gene Expression Omnibus; GTEx: Genotype-Tissue Expression; CCLE: Cancer Cell Line Encyclopedia; HPA: Human Protein Atlas; CRC: Colorectal cancer; GC: Gastric cancer; OS: Overall Survival; PFS: Progression Free Survival; ESTIMATE: Estimation of stromal and Immune cells in malignant tumor tissues using Expression; GSVA: Gene Set Variation Analyses; GSEA: Gene Set Enrichment Analyses; TMB: Tumor Mutation Burden; MSI: Microsatellite Instability; MOI: Multiplicity of Infection; PDOs: Patient-Derived Organoids; PCR: Polymerase Chain Reaction; ELISA: Enzyme Linked ImmunoSorbent Assay; IFN-γ: Interferon-gamma; TNF-α: Tumor Necrosis Factor alpha; Gzmb: Granzyme B; PBS: Phosphate Buffer Saline; CR: Complete Response; PR: Partial Response; PD: Progressive Disease; SD: Stable Disease; CPS: Combined Positive Score; IHC: Immunohistochemistry; HE: Hematoxylin-Eosin Staining; mfIHC: Multiplex Fluorescence Immunohistochemistry Analyses; TIGIT: T-cell immunoreceptor with Ig and ITIM domains; CTLA-4: Cytotoxic T Lymphocyte-Associated Antigen-4; TIM-3: T Cell Immunoglobulin Domain and Mucin Domain-3; LAG-3: Lymphocyte activation gene 3 protein; PD-1: Programmed death-1; PD-L1: Programmed death-ligand 1; DCs: Dendritic cells; NKs: Natural killer cells; AUC: Area Under the Curve; ROC: Receiver Operating Characteristic Curve; Mfuzz: Microarray Fuzzy Clustering.
Supplementary Material
Supplementary figures and tables.

Acknowledgements
We would like to express our gratitude to the BioNexus Platform of the Department of Pancreatic Surgery in Zhongshan Hospital, Fudan University, Shanghai, China, for providing the GitHub repository (https://github.com/zsliangliulab), which has been instrumental in the completion of this work. During the preparation of this manuscript, the authors used Biomni (an AI assistant developed by Phylo) for language editing to improve readability and grammar. After using this tool, the authors reviewed and edited the content as needed and took full responsibility for the content of the publication.
Funding
This study was supported by Shenzhen Medical Research Fund (Grant No. A2403045); National Natural Science Foundation of China (Grant No. 22477150, 22307151); the Guangdong Provincial Basic and Applied Basic Research Fund Committee, General Project (Grant No. 2025B1515020001); Shenzhen Science and Technology Program (Grant No. JCYJ20240813150506008); Scientific and Technological Innovation Programs of Higher Education Institutions in Shanxi (Grant No. 2023L230); Guangdong Basic and Applied Basic Research Foundation (2025A1515220167); Shenzhen Fundamental Research Program (Grant No. JCYJ20250604143310014); the Guangdong Provincial Key Laboratory of Digestive Cancer Research Provincial Key (Grant No. 2021B1212040006).
Authorship contribution statement
Z.Z., J.L., C.D., X.L., and L.Z. contributed to the conception of the study. Z.Z., X.S., C.D., YW.S., and Y.Sun performed the experiments and interpreted the data. D.C., Z.L., YT.S., J.L., and X.Q. contributed significantly to the analyses and manuscript preparation. Z.Z., X.S., C.D., K.L., and H.H. performed the data analyses and wrote the manuscript. H.H., YW.S., and D.C. helped perform the analyses with constructive discussions. H.H., C.R.A., Jr., Z-S.C., and Z.Z. critically revised the manuscript. J.L., X.L., L.Z., Z.Z., and K.L. contributed to the manuscript review and final approval. All authors contributed to the article and approved the final version.
Availability of data and materials
The data used to support the findings of this study are included in the article and supplementary materials. Publicly available datasets analyzed in this study can be found in TCGA, GTEx, CCLE, DICE, HPA, GEO, and the IMvigor210 cohort from published studies. All other data generated in this study are available from the corresponding author upon reasonable request.
Ethics approval and consent to participate
The study involving human samples was approved by the Ethics Committee of the Seventh Affiliated Hospital of Sun Yat-sen University (No. KY-2024-117-01) and was conducted in compliance with the Declaration of Helsinki. Written informed consent was obtained from all patients prior to specimen collection. Animal experiments were approved by the Animal Experiment Ethics Committee of Top Biology (TOPGM-IACUC-2023-0208). All mice were housed under specific pathogen-free (SPF) conditions, and all animal procedures were performed, at the SPF animal facility of Top Biology (Shenzhen Lingfu Topu Biotechnology Co., Ltd., Shenzhen, China; Laboratory Animal Use License No. SYXK (Yue) 2022-0293), a preclinical contract research organization engaged by the Seventh Affiliated Hospital of Sun Yat-sen University for animal housing and experimentation. Mice were acclimatized for at least one week before experimentation and were monitored regularly throughout the study.
Competing Interests
The authors have declared that no competing interest exists.
References
1. Bray F, Laversanne M, Sung H, Ferlay J, Siegel RL, Soerjomataram I. et al. Global cancer statistics 2022: GLOBOCAN estimates of incidence and mortality worldwide for 36 cancers in 185 countries. CA Cancer J Clin. 2024;74(3):229-63
2. Tang L, Huang Z, Mei H, Hu Y. Immunotherapy in hematologic malignancies: achievements, challenges and future prospects. Signal Transduct Target Ther. 2023;8(1):306
3. Huang AC, Zappasodi R. A decade of checkpoint blockade immunotherapy in melanoma: understanding the molecular basis for immune sensitivity and resistance. Nat Immunol. 2022;23(5):660-70
4. Lahiri A, Maji A, Potdar PD, Singh N, Parikh P, Bisht B. et al. Lung cancer immunotherapy: progress, pitfalls, and promises. Mol Cancer. 2023;22(1):40
5. Holzbeierlein JM, Bixler BR, Buckley DI, Chang SS, Holmes R, James AC. et al. Diagnosis and Treatment of Non-Muscle Invasive Bladder Cancer: AUA/SUO Guideline: 2024 Amendment. J Urol. 2024;211(4):533-8
6. Vesely MD, Zhang T, Chen L. Resistance Mechanisms to Anti-PD Cancer Immunotherapy. Annu Rev Immunol. 2022;40:45-74
7. Postow MA, Sidlow R, Hellmann MD. Immune-Related Adverse Events Associated with Immune Checkpoint Blockade. N Engl J Med. 2018;378(2):158-68
8. Catalano M, Iannone LF, Nesi G, Nobili S, Mini E, Roviello G. Immunotherapy-related biomarkers: Confirmations and uncertainties. Crit Rev Oncol Hematol. 2023;192:104135
9. Chen Q, Jiang K, Bronze MS, Li M, Houchen CW, Zhang Y. Tumor microenvironment and macroenvironment: A new perspective on holistic oncology. Cancer Lett. 2025;634:218076
10. Bejarano L, Jordāo MJC, Joyce JA. Therapeutic Targeting of the Tumor Microenvironment. Cancer Discov. 2021;11(4):933-59
11. Brummel K, Eerkens AL, de Bruyn M, Nijman HW. Tumour-infiltrating lymphocytes: from prognosis to treatment selection. Br J Cancer. 2023;128(3):451-8
12. Paijens ST, Vledder A, de Bruyn M, Nijman HW. Tumor-infiltrating lymphocytes in the immunotherapy era. Cell Mol Immunol. 2021;18(4):842-59
13. Burugu S, Dancsok AR, Nielsen TO. Emerging targets in cancer immunotherapy. Semin Cancer Biol. 2018;52(Pt 2):39-52
14. Kaksonen M, Roux A. Mechanisms of clathrin-mediated endocytosis. Nat Rev Mol Cell Biol. 2018;19(5):313-26
15. McMahon HT, Boucrot E. Molecular mechanism and physiological functions of clathrin-mediated endocytosis. Nat Rev Mol Cell Biol. 2011;12(8):517-33
16. Ogbu SC, Musich PR, Zhang J, Yao ZQ, Howe PH, Jiang Y. The role of disabled-2 (Dab2) in diseases. Gene. 2021;769:145202
17. Umasankar PK, Sanker S, Thieman JR, Chakraborty S, Wendland B, Tsang M. et al. Distinct and separable activities of the endocytic clathrin-coat components Fcho1/2 and AP-2 in developmental patterning. Nat Cell Biol. 2012;14(5):488-501
18. Alomari O, Ertan SN, Mokresh ME, Yazicilar E, Pourali M, Akyokus FE. et al. Comprehensive exploration of FCHO1 mutations: Clinical manifestations and implications across disorders. Am J Med Genet A. 2025;197(1):e63855
19. Aydemir S, Islek A, Nepesov S, Yaman Y, Baysoy G, Beser OF. et al. Inflammatory Bowel Disease and Guillain Barre Syndrome in FCHO1 Deficiency. J Clin Immunol. 2021;41(6):1406-10
20. Calzoni E, Platt CD, Keles S, Kuehn HS, Beaussant-Cohen S, Zhang Y. et al. F-BAR domain only protein 1 (FCHO1) deficiency is a novel cause of combined immune deficiency in human subjects. J Allergy Clin Immunol. 2019;143(6):2317-21.e12
21. Goldman MJ, Craft B, Hastie M, Repečka K, McDade F, Kamath A. et al. Visualizing and interpreting cancer genomics data via the Xena platform. Nat Biotechnol. 2020;38(6):675-8
22. Uhlén M, Fagerberg L, Hallström BM, Lindskog C, Oksvold P, Mardinoglu A. et al. Proteomics. Tissue-based map of the human proteome. Science. 2015;347(6220):1260419
23. Uhlen M, Zhang C, Lee S, Sjöstedt E, Fagerberg L, Bidkhori G. et al. A pathology atlas of the human cancer transcriptome. Science. 2017;357(6352):eaan2507
24. Georgakopoulos ND, Wells G, Campanella M. The pharmacological regulation of cellular mitophagy. Nat Chem Biol. 2017;13(2):136-46
25. Park WH. Antimycin A: From mitochondrial poison to multifaceted biological probe and therapeutic agent. Chem Biol Interact. 2025;422:111805
26. Barrientos A, Moraes CT. Titrating the effects of mitochondrial complex I impairment in the cell physiology. J Biol Chem. 1999;274(23):16188-97
27. Liu H, Rhodes M, Wiest DL, Vignali DA. On the dynamics of TCR:CD3 complex cell surface expression and downmodulation. Immunity. 2000;13(5):665-75
28. Yudushkin IA, Vale RD. Imaging T-cell receptor activation reveals accumulation of tyrosine-phosphorylated CD3ζ in the endosomal compartment. Proc Natl Acad Sci U S A. 2010;107(51):22128-33
29. Farhood B, Najafi M, Mortezaee K. CD8(+) cytotoxic T lymphocytes in cancer immunotherapy: A review. J Cell Physiol. 2019;234(6):8509-21
30. Doroshow DB, Bhalla S, Beasley MB, Sholl LM, Kerr KM, Gnjatic S. et al. PD-L1 as a biomarker of response to immune-checkpoint inhibitors. Nat Rev Clin Oncol. 2021;18(6):345-62
31. Henne WM, Boucrot E, Meinecke M, Evergren E, Vallis Y, Mittal R. et al. FCHo proteins are nucleators of clathrin-mediated endocytosis. Science. 2010;328(5983):1281-4
32. Teerlink CC, Miller JB, Vance EL, Staley LA, Stevens J, Tavana JP. et al. Analysis of high-risk pedigrees identifies 11 candidate variants for Alzheimer's disease. Alzheimers Dement. 2022;18(2):307-17
33. Bian R, Li D, Xu X, Zhang L. The impact of immunity on the risk of coronary artery disease: insights from a multiomics study. Postgrad Med J. 2024;101(1191):50-9
34. Łyszkiewicz M, Ziętara N, Frey L, Pannicke U, Stern M, Liu Y. et al. Human FCHO1 deficiency reveals role for clathrin-mediated endocytosis in development and function of T cells. Nat Commun. 2020;11(1):1031
35. Dong D, Zheng L, Lin J, Zhang B, Zhu Y, Li N. et al. Structural basis of assembly of the human T cell receptor-CD3 complex. Nature. 2019;573(7775):546-52
36. Baixauli F, Acín-Pérez R, Villarroya-Beltrí C, Mazzeo C, Nuñez-Andrade N, Gabandé-Rodriguez E. et al. Mitochondrial Respiration Controls Lysosomal Function during Inflammatory T Cell Responses. Cell Metab. 2015;22(3):485-98
37. Corrado M, Samardić D, Giacomello M, Rana N, Pearce EL, Scorrano L. Deletion of the mitochondria-shaping protein Opa1 during early thymocyte maturation impacts mature memory T cell metabolism. Cell Death Differ. 2021;28(7):2194-206
38. Li F, Liu H, Zhang D, Ma Y, Zhu B. Metabolic plasticity and regulation of T cell exhaustion. Immunology. 2022;167(4):482-94
39. Reina-Campos M, Scharping NE, Goldrath AW. CD8(+) T cell metabolism in infection and cancer. Nat Rev Immunol. 2021;21(11):718-38
Author contact
Corresponding authors: Leli Zeng, zenglli6sysu.edu.cn. Xiaofang Lu, luxiaofangcom. Chen Dai, daichen0408com. Jia Li, lijia88sysu.edu.cn.