Impact Factor




Theranostics 2027; 17(1):404-429. doi:10.7150/thno.132995 This issue Cite
Research Paper
Ribosome profiling reveals distinct translational alterations in steatohepatitis-associated and virus infection-associated hepatocellular carcinoma
Asier González1,2#  , Meric Ataman1#, Aleksei Mironov1#, Niels Schlusser1, Muskan Pandey1, Alexander Schmidt3, Mairene Coto-Llerena4,5, Salvatore Piscuoglio6, Nitish Mittal1, Mihaela Zavolan1
1. Computational and Systems Biology, Biozentrum, University of Basel, 4056 Basel, Switzerland.
2. Departament de Bioquímica i Biologia Molecular and Institut de Biotecnologia i de Biomedicina, Universitat Autònoma de Barcelona, 08193 Cerdanyola del Vallès, Spain.
3. Proteomics Core Facility, Biozentrum, University of Basel, 4056 Basel, Switzerland.
4. Institute of Medical Genetics and Pathology, University Hospital Basel, 4031 Basel, Switzerland.
5. Department of Biomedicine, University of Basel, 4031 Basel, Switzerland.
6. IRCCS Humanitas Research Hospital, Rozzano (MI), Italy.
# These authors contributed equally.
Received 2026-2-11; Accepted 2026-9-25; Published 2027-1-1
Abstract
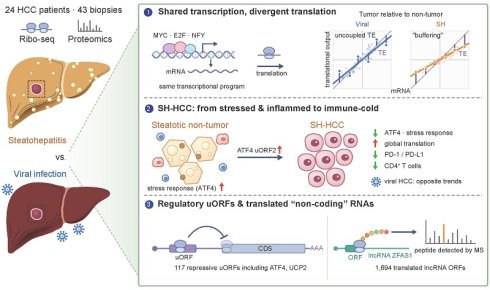
Hepatocellular carcinoma (HCC) is one of the most lethal cancer types. Infections with hepatitis B or hepatitis C viruses remain the primary risk factors for HCC development worldwide, but metabolic dysfunction-associated steatohepatitis has become the fastest-growing etiology of HCC, particularly in Western countries. Because translational control is important for tumor metabolism, we combined ribosome profiling and mass spectrometry to map the translation landscape of steatohepatitis-associated HCC, which has so far remained uncharacterized.
Methods: We performed ribosome profiling and mass spectrometry on tumor and non-tumor tissues from HCC patients across viral and non-viral (steatohepatitis-associated) etiologies, and quantified the relationship between ribosome occupancy of upstream open reading frames (uORFs) and coding sequences (CDSs).
Results: While transcriptional alterations are largely shared across etiologies, translational alterations differ substantially between HCC with viral and non-viral backgrounds, with the latter characterized by translational “buffering” of RNA changes, systematically lowering the magnitude of protein level variability between tumor and non-tumor tissues. Etiology-specific translational alterations are converging on pathways such as mRNA translation, protein localization, and immune activity, with possible implications in explaining etiology-specific response to HCC immunotherapy treatment. By quantifying the relationship between the ribosome occupancy of upstream open reading frames (uORFs) and coding regions (CDSs), we identify and characterize more than a hundred uORFs whose occupancy is coupled with the translation output of the CDS, including well-characterized repressive regulatory uORFs in ATF4 and UCP2. We also identify numerous RNAs currently annotated as non-coding that show evidence of translation, some yielding peptides that can be reproducibly identified in mass spectrometry datasets. They include the ORFs in the HCC-related, highly expressed ZFAS1 lincRNA.
Conclusions: These results reveal extensive translational alterations in steatohepatitis-associated HCC supporting a model whereby an immune-inflamed, non-tumor steatotic state with high activity of the stress response pathway in non-viral HCC switches to an “immune-cold” malignant state with decreased stress response and decreased presence of molecules targeted by immune checkpoint inhibition (ICI) therapies.
Keywords: hepatocellular carcinoma, steatohepatitis, ribosome profiling, translational regulation, non-canonical ORFs
Introduction
Liver cancer, of which the main type is hepatocellular carcinoma (HCC), is the sixth most common cancer worldwide and the third leading cause of cancer-related deaths [1]. It arises in the background of chronic liver disease caused by infection with hepatitis B or C viruses (HBV or HCV), and increasingly by metabolic dysfunction (often progressing to steatohepatitis (SH)) associated with diabetes or obesity, as well as alcohol use [2,3]. Genomic [4,5], proteomic [6], and integrative multi-omic [7-9] analyses have been carried out to decipher the molecular alterations occurring in this heterogeneous disease and enable more specific treatments. However, the effect of the specific chronic disease background on the progression to HCC remains poorly understood.
The liver has one of the highest rates of protein synthesis among adult mammalian organs [10-12], regulated in concert with all its essential biological activities, including insulin-dependent fatty acid synthesis, lipogenesis, glycolysis, and ATP production [13,14]. Interest in how mRNA translation is remodeled to support the survival and proliferation of cancer cells is growing [15-18], as translational control could enable cancer cells to rapidly adapt to stress without relying on new mRNA transcription. Several mechanisms of translational control, such as high expression of eIF4E [19] or high PI3K-AKT-mTOR signaling [20,21], could play a role in HCC [22]. These mechanisms are of particular interest in a metabolic background, where nutrient excess, lipid overload and the associated endoplasmic reticulum stress converge on the very pathways that set the rate of protein synthesis [23]. However, their investigation in human tissue samples has remained limited and their potential relevance in HCC of different etiologies is unknown.
Ribosome profiling/footprinting, also known as ribo-seq, is broadly used to quantitatively study translation dynamics with subcodon resolution [24]. It has generated a wealth of data primarily from cell lines [25], with data from human tissues starting to emerge [26]. In addition to canonical protein-coding sequences (CDSs), recent studies have uncovered a variety of non-canonical open reading frames (ncORFs), some generating peptides essential for cancer cell survival and proliferation [27-29], others giving rise to neoantigens [30,31]. These ncORFs can be located upstream or downstream of the main CDS (uORFs and dORFs, respectively), or in transcripts currently annotated as non-coding (long non-coding RNA, lncRNA), and efforts to generate reference annotations of them are ongoing [32]. Miscoding and stop codon readthrough arising from perturbed expression of small nucleolar RNAs [33] or from nonstop extension mutations [34,35] can further diversify the proteome of cancer cells. Although ribosome profiling has been applied to HBV-associated HCC to reveal only limited translational control [36], no such analysis has so far been done for metabolic dysfunction-associated HCC.
In this study, we carried out ribosome profiling and mass spectrometry-based measurements of protein expression in 43 samples from 24 patients to characterize the translation landscape of HCC of both viral infection and SH-associated metabolic dysfunction (non-viral) backgrounds. We further integrated transcriptome data from The Cancer Genome Atlas (TCGA [5]) and applied computational analyses to assess the relative contribution of various regulatory layers in HCC occurring on the background of viral infection or non-viral liver disease. Beyond differential expression, we quantified the coupling between uORF and CDS ribosome occupancy and searched for translated ORFs in transcripts currently annotated as non-coding. Our data reveal marked, background-dependent changes in the translatome and proteome of HCC, providing an extensive resource for studies of translational control in HCC.
Results
Ribosome profiling of human liver samples
We obtained data from an etiologically heterogeneous cohort of 24 patients clinically classified before the recent change in nomenclature [37]: 11 had steatohepatitis of unknown – alcoholic or non-alcoholic (ASH/NASH) – origin, 3 had ASH, 3 were hepatitis B virus (HBV)-positive, 2 were hepatitis C virus (HCV)-positive, 1 had ASH/NASH and was also HCV-positive, and the remaining 4 had unclear disease background. NASH corresponds to metabolic dysfunction-associated steatohepatitis (MASH) in the current nomenclature; we retain the original clinical designations throughout. In total we analyzed 43 samples: in 16 of the 24 cases we analyzed tumor (T) and matched non-tumoral tissue (NT) from the same patients, in one additional case we had three distinct tumor sites sampled along with one NT control, and the remaining 7 cases contributed 4 unpaired tumor and 3 unpaired non-tumor samples (Figure 1A, Table S1). Following the experimental design shown in Figure 1A, we obtained ribosome profiling libraries of 18-28 million reads per sample (Table S2), with read lengths peaking at 30-31 nucleotides (Figure 1B). Upon mapping the reads to the transcriptome (see Methods), we found that 30-65% of reads in a library were derived from mRNAs (Table S2), with 85-95% of these mapping to annotated CDSs (Figure 1C). We inferred the location of the P site in each read using our previously established approach [38,39] (see Methods) and found that 40-60% of reads in a library matched the annotated codon frame (Figure 1D). A metagene plot showed the expected periodicity at both start and stop codons (Figure 1E), and the per-sample frame analysis showed that the frame bias was clear regardless of sample classification (Figure 1F). Altogether, these metrics fulfill the expected quality criteria for ribosome profiling data [40], notably given that resected tissue samples often yield RNA of lower concentration and integrity compared to cell lines [26].
Summary of the data set. A. Experimental design: 43 samples from 24 HCC patients were analyzed by ribosome profiling, including 16 tumor and matched non-tumoral (T-NT) pairs, one case of 3 tumors - 1 non-tumor samples, 3 unpaired tumors and 4 unpaired non-tumor samples. In panels A, C, and D, samples are indicated by the red (T) and blue (NT) colors, respectively. Image created with BioRender. B. Read length distribution of pooled ribosome profiling libraries. C. Fraction of RPFs in each library mapping to 5’UTR, CDS, or 3’ UTR. D. Fraction of RPFs with inferred P-site mapping to each of the 3 reading frames of annotated transcripts. E. Metagene plots showing the relative proportion of P sites mapping in the [-50;+50] nucleotide windows centered on the start (left panel) or stop (right panel) codons of mRNAs. The proportions were calculated for each gene individually, then averaged across genes. F. Proportion of P sites mapping to frames 0, +1, and +2 of mRNAs. Each dot corresponds to one sample, colored by the group to which it belongs. Error bars represent standard deviations within the respective groups. G. PCA of gene TO values (10’290 genes that have at least 1 RPF in all samples) calculated from ribosome profiling data. Tumor samples are shaded according to the Edmondson grade (Ed); higher Edmondson grade indicates a less differentiated tumor. H. Similar to G, but coloring the samples by disease background and T/NT status. I. Correlation of sample-average TO with the sample-average protein iBAQ signal in non-tumor samples, for 2’866 protein-coding genes with average TO > 1 TPM and detected at proteomic level in all samples. J. Similar to G, based on normalized protein-level intensity values from proteomics (3’227 proteins with expression in all samples). K. Similar to H, based on protein-level intensity values from proteomics.
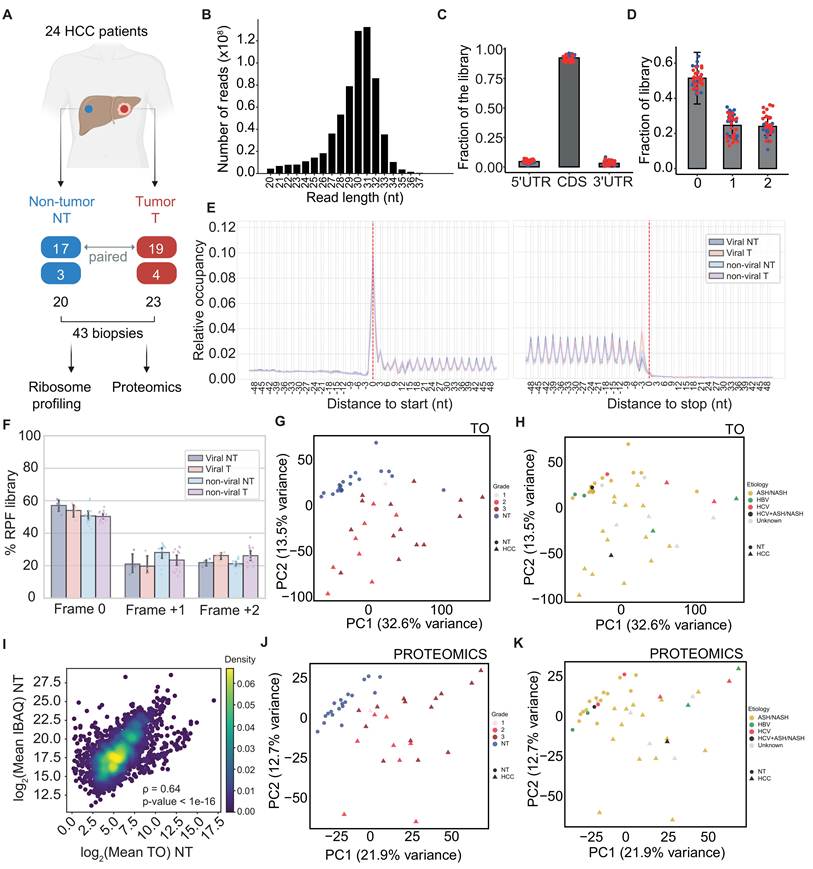
We detected ribosome-protected fragments (RPFs, i.e. uniquely-mapped reads obtained with the procedure described above) from ~19’200 genes, with ~10’300 genes being represented with at least one RPF in each sample. We estimated the translational output (TO) of individual mRNA species as the normalized density of RPFs per CDS nucleotide; technically, this is the well-known metric of transcripts per million (TPM), computed from RPFs rather than RNA-seq reads. We transformed the values to log2 scale, standardized them, and carried out principal component (PC) analysis (PCA). The first two PCs explained almost half (46%) of the variance in TO, with tumor samples separating well from matched non-tumoral tissue (Figure 1G, p < 0.0001 in PERMANOVA analysis, 10000 permutations are used for all tests). Clustering of tumor samples by Edmondson grade (p = 0.15, PERMANOVA analysis, Figure 1G) or by presence/absence of cirrhosis (p = 0.55, PERMANOVA analysis, Figure S1A) was not detectable at this sample size. In contrast, tumor samples clustered significantly when grouped based on the viral/non-viral etiology as indicated in Figure 1H (p = 0.0008, PERMANOVA analysis), whereas non-tumor samples showed no significant separation (p = 0.27, PERMANOVA analysis).
We further measured the proteomes of all samples by mass spectrometry in a data-independent acquisition (DIA) manner, detecting 4’340-5’628 proteins per sample. 6468 of all 6602 proteins whose expression could be quantified in at least 1 sample by mass spectrometry were also quantified by ribosome profiling and the Spearman correlation coefficient of the sample-average TO with the level of the corresponding protein was 0.64 and 0.65 for NT and T samples, respectively (Figure 1I for NT samples, Figure S1B for T samples, per sample correlations in Figure S1C). Following quantification, normalization and standardization (see Methods), PCA showed that the first two PCs of the proteome data explained 34.6% of the variance (Figure 1J), and the PERMANOVA results reflected those from the ribosome footprints: tumor and non-tumor samples separated from each other (p < 0.0001), with no significant separation by Edmondson grade (p = 0.15, Figure 1J), or presence/absence of cirrhosis (p = 0.47, Figure S1D), but significant clustering based on the viral/non-viral etiology (p = 0.0056, Figure 1K). In contrast, non-tumor samples show no significant separation based on etiology (p = 0.58, PERMANOVA analysis).
The transcriptome wide TO profiles were more similar when comparing non-tumor samples with each other and less similar when comparing tumor with non-tumor samples or tumor samples with each other (Figure S1E). The true tumor/non-tumor pairing of samples from individual patients did not yield significantly different distances compared to random pairing (p = 0.42, Wilcoxon rank-sum test Figure S1E). The proteomics measurements yielded similar results (Figure S1F). Of note, samples with lower Edmondson grades were, on average, more similar to non-tumor ones than those with higher grades, both at the level of TOs and proteins (Figure S1G-H), consistent with prior reports [9]. Thus, the TO and the protein level measurements partially reflect the Edmondson grade, even though the grade does not resolve distinct clusters in the PC space analyzed above.
We further checked the consistency of the data from our etiologically heterogeneous cohort with those previously obtained from 10 HCC patients, 9 of whom were HBV-positive [36]. We reanalyzed the latter with our pipeline and observed that for genes quantified in both datasets (17’773 of the 17’796 in the Zou study [36]) the sample-averaged TO values correlated very well when conditions were matched (NT-NT or T-T, Pearson correlation coefficients of 0.95 and 0.93, respectively, Figure S1I-J), and slightly less when tumor samples from one study were compared with non-tumor samples from the other (NT-T or T-NT, Pearson correlation coefficients of 0.89 and 0.92, Figure S1K-L). We then performed differential analysis at TO level between T and NT conditions using DESeq2 package [41] (Table S3) followed by Gene Set Enrichment Analysis (GSEA) [42]. The functional categories of genes that are up- or down-regulated at TO level in tumor relative to non-tumor tissue are also largely similar in the two datasets (Figure S1M). Moreover, the T vs. NT protein level changes that we measured matched well those reported in the study of Ng et al. [9] (Figure S1N). Thus, while highly consistent with prior measurements, our RPF data provides so-far lacking information on the non-viral etiology and almost triple the number of available HCC ribosome profiles.
Altogether, these results demonstrate the consistency of ribosome profiling and proteomics measurements and highlight that malignancy has a strong effect on the translational profile of the liver, with the etiological background contributing a significant secondary structure to both the translatome and the proteome. Edmondson grade and presence or absence of cirrhosis did not define distinct clusters, and patient-specific features such as germline genetic variation had no detectable effect on cluster separation at this sample size. Because true T-NT pairing did not yield distances different from random pairing, we first conducted global analyses of gene expression without requiring matching between T-NT pairs, focusing on the etiology-dependent gene expression alterations in HCC.
The effect of disease background is more apparent in the translatome than in the transcriptome
The number of ribosome footprints captured for an individual gene (and the derived TO) is determined by both the abundance of the mRNA and by the efficiency with which ribosomes are recruited to translate the mRNA. The latter quantity is typically called translation efficiency (TE) and is estimated as the ratio of the library-size-normalized RPF counts to the library-size-normalized counts of RNA-seq reads, both mapped to mRNA coding regions [24]. To distinguish which of these factors underlie the observed TO changes, measurements of mRNA abundance are needed. While the limited amount of material we obtained in our study did not allow us to carry out both ribosome profiling and RNA-seq from the same samples, a large HCC RNA-seq dataset is available from TCGA [5], with associated metadata, including etiology. As the mRNA measurements from this dataset and our RPF measurements originate from different individuals, we established a series of controls, described below, to verify that the differences we report do not arise from this design.
First, we reanalyzed the above-mentioned study of Zou et al. [36], in which ribosome profiling and RNA-seq data were obtained from the same 10 tissue samples. T-NT changes in RNA levels in virus-infection-associated HCC samples from TCGA were moderately correlated (Pearson r = 0.63, slope = 0.71, Figure S2A) with those measured by Zou et al. [36], possibly due to a reduced RNA integrity in Zou et al. samples relative to TCGA, as indicated by transcript integrity scores [43] (Figure S2B). Nevertheless, the T-NT TO changes estimated from the Zou et al. ribosome profiling data could be explained equally well by the mRNA changes estimated either from the same samples or from the TCGA dataset (Pearson r = 0.71 vs. 0.75, slope = 0.72 vs. 0.86, Figure S2C-D). This indicates that TCGA provides a suitable – and at the same time more comprehensive – reference of mRNA level expression in HCC, which we could use along with our TO data to identify translation-level effects.
To further validate the molecular profiles of the cohorts of different backgrounds, we examined gene expression signatures of key cellular processes previously found for viral or non-viral-background HCC (see Methods, Table S4). Notably, gene expression alterations in the liver prior to the development of HCC have been described, but they were more linked to the process of fibrosis [44-46] rather than to a specific etiology. The suppression of urea cycle (CPS1, ARG1, OTC) and arginine-to-polyamine conversion enzymes along with the upregulation of downstream polyamine metabolism represent a well-known signature of HCC [47], replicated in our data (Figure S3A). Similarly, we observed the downregulation of drug metabolism genes CYP2E1 [48] and ALDH2 [49] in tumor relative to non-tumor samples of both etiologies (Table S4). GSEA of the TCGA RNA-seq alongside our in-house translatome (TO) and proteomics data revealed very similar, statistically significant enrichments and depletions of the expected markers in both cohorts, indicating that they capture HCC biology shared by the two etiologies rather than etiology-specific programs (Figure S3B-M). We therefore took this analysis as evidence that both cohorts display the canonical alterations of HCC, rather than as a test of background specificity. We also compared the NT samples of the two backgrounds with each other, focusing on reactome pathways expected to be perturbed in liver disease [46] (immune system and inflammation, extracellular matrix and collagen, lipid, fatty acid, bile acid, and xenobiotics metabolism). This analysis revealed differences between the two backgrounds that were consistent between our TO data and TCGA’s RNA level data; the activity of pathways related to the extracellular matrix was higher in non-viral compared to viral NT samples, while the activity of antigen processing, presentation and interferon signaling pathways, as well as lipid metabolism, bile acid and xenobiotic metabolism was decreased (Figure S3N). However, we cannot rule out that these differences are due to factors such as the degree of fibrosis of the tissues rather than the underlying etiology.
To then study the HCC-related remodeling of gene expression, we first submitted the TCGA RNA-seq data to the Integrated Motif Activity Response Analysis (ISMARA) [50], which uncovers transcription factors driving the observed gene expression changes. We found an increased activity of cell proliferation-related transcription factors (TFs) in T samples relative to NT controls, while the activity of TFs linked to metabolic and detoxification functions was reduced (Figure 2A). In particular, YBX1, FOS, NFYC, NFYA, NFYB, and CEBPZ TFs acting on binding sites with the core motif ATTGG formed a central hub of factors with increased activity in tumors; expression of these factors is stimulated by MYC, and, in turn, they promote the expression of E2F family members, whose activity also increases in HCC (Figure 2B). These results are in line with reports of MYC and E2F integrating several HCC-relevant upstream oncogenic pathways [51-53] to implement a switch from specialized liver functions to cell proliferation. Importantly, no significant difference in above mentioned TF activities was detected between tumors of viral and non-viral origin, and none of these factors showed a significant change in TE between tumor and non-tumor tissue (Table S3).
Transcriptional vs. translational control of gene expression in HCC. A. ISMARA results for top 10 transcription factor binding site motifs with strongest explanatory power in TCGA RNA-seq data, as assessed by their z-scores (left-most part of the panel) for both disease backgrounds. The center part of the panel depicts average motif activities in the tumor (red) and non-tumor (blue) samples. Reactome [54] enrichment analysis of each motif’s target genes was obtained from ISMARA detailed report, obtained categories were further ranked by significance (total log-likelihood). Selected categories and their ranks are shown in the right part of the panel. All translated genes are used as background. B. First level transcriptional regulatory network centered on the YBX1-FOS-NFYC-NFYA-NFYB-CEBPZ TFs. Outgoing regulatory interactions of the central factors are shown with red arrows, incoming ones with blue, and in violet are interactions not involving the central factors. C. Changes in the translational output of mRNAs in tumor (T) relative to non-tumor (NT) samples for viral background (cutoff at adjusted p-value < 0.05 from DESeq2 differential analysis; NS means not significant). D. Same as in panel C, for non-viral background samples. E. Relationship of mRNA level changes in T vs. NT samples from the TCGA RNA-seq dataset (x-axis), and RPF level changes in our ribosome profiling dataset for viral samples. The diagonal line (light blue, dashed) corresponds to changes in translational output that are entirely explained by changes in mRNA levels. Paired ordinary least squares (OLS) regression line is shown in red, and its slope is depicted at the top-left of the panel. F. Same as in panel E, for non-viral samples. G. Reactome pathways undergoing concordant TO changes in the two backgrounds in gene set enrichment analysis (GSEA). Shown is the normalized enrichment score (NES) from GSEA, red indicates upregulation of a pathway in the T-NT comparison, whereas blue indicates downregulation. H. Reactome pathways undergoing discordant TO changes in the two backgrounds. I. Reactome pathways undergoing a significant change at TE level in at least one of the backgrounds, displayed as two blocks for convenient reading. In both blocks, the left column corresponds to the non-viral and right column to the viral cohort. J. Expression changes of immunity-related markers in HCC of viral infection and non-viral backgrounds. K-L. Scatterplot of protein vs. RNA level T-NT changes of individual genes in samples of viral (K) and non-viral (L) background. Each gene is represented by the circle, further colored by the direction and magnitude of TE change. M. TO and protein level changes for PSMA6, PSMD7, PSMD8, PSMB4, UBA52, UBE2D2, RBX1 genes for samples with viral and non-viral background.
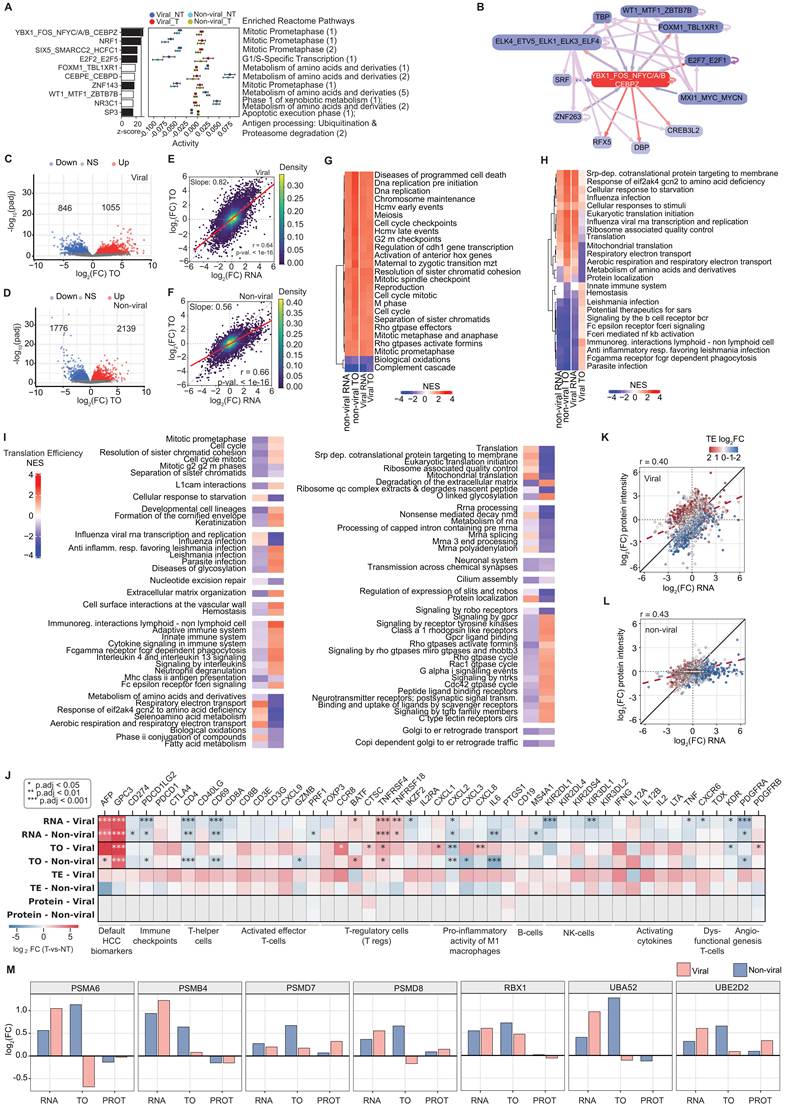
In contrast, the TO analysis uncovered clear differences in the translatome response occurring on the viral vs. non-viral infection backgrounds (Figure 2C-D). For these comparisons we grouped our samples into a viral cohort (4 NT, 4 T) and a non-viral cohort (13 NT, 14 T), leaving out the remaining samples, from patients of unclear etiology. While mRNA-level changes correlate very well among the two backgrounds (TCGA data, Pearson’s r = 0.91, slope 0.9, Figure S2E), TO-level changes do not (Pearson’s r = 0.47, slope 0.71, Figure S2F). Notably, the pairwise linear regression (ordinary least squares, OLS) of TO as a function of mRNA changes (Figure 2E-F) yielded significantly different slopes (0.82 for the viral and 0.56 for non-viral background, p = 6.29e-83, Welch’s t-test). Given the smaller size of the viral relative to the non-viral cohort, we verified that this difference is not a consequence of cohort size: resampling from the non-viral cohort subsets of the same size as the viral cohort (4 NT, 4 T) never yielded a slope as high as we obtained for the viral background (1000 resamplings, maximum slope 0.72, Figure S2G). Thus, the TO changes more closely reflect mRNA changes in tumors occurring on the viral infection background than on the non-viral; in the latter TO changes are “buffered”, having roughly two-fold smaller magnitude relative to RNA changes. The prediction power was similar in the viral and non-viral cohorts (Pearson’s r = 0.64 for viral and 0.66 for non-viral, Figure 2E-F), indicating that the TOs were measured with similar precision in the two backgrounds. Importantly, we obtained similarly high slopes for our virus-associated samples (slope = 0.82, Figure 2E) and the virus-associated samples from the Zou et al. study and in the latter case, both when the paired RNA-seq (slope = 0.72, Figure S2C, p = 0.074, Welch’s t-test for slope comparison with the viral cohort from our study) or the TCGA RNA-seq (slope = 0.86, Figure S2D) were used as reference. While our virus-associated cohort was extremely small, further analyzing separately samples with HBV and HCV backgrounds still yielded higher slopes relative to the non-viral samples, namely 0.91 for the HBV-associated samples and 0.61 for the HCV-associated ones (Figure S2H-I). These results indicate that the difference we observed between samples of viral and non-viral background is neither due to our dataset containing relatively few virus-associated samples, nor to systematic batch effects of cross-dataset comparisons.
To reveal the functional significance of translatome changes in the two backgrounds, we carried out Gene Set Enrichment Analysis (GSEA) [42] of the RNA and TO data using the Reactome knowledge base [54]. Of the 243 pathways that contain at least 100 genes, 154 showed T vs NT TO changes reaching significance in at least one of the disease backgrounds: 80 were concordant (significant and changing in the same direction in both backgrounds) and 74 discordant (opposite direction, or significant in only one background). The 25 most significant pathways from each of these subsets are shown in Figure 2G-H, while the full results are in Table S5. Pathways related to DNA replication and the cell cycle were significantly upregulated, while the complement cascade and oxidation processes were downregulated at both RNA and TO level, and in both disease backgrounds (Figure 2G, Table S5), in-line with results in previous studies that did not specifically consider the disease background [55-57]. In contrast, despite similar RNA level response, pathways related to mRNA translation, electron transport chain, and protein localization were upregulated in non-viral and decreased in the viral infection background (Figure 2H, Table S5). Conversely, infection and immunity-related pathways had decreased TO in the non-viral but not viral background samples. These differences were also apparent in the GSEA analysis of translation efficiency (TE) changes between T and NT samples, which we obtained by subtracting RNA from TO log2FC values and assessing significance with DESeq2-based deltaTE model [58] (Figure 2I). Given the particular clinical relevance of the immune microenvironment to HCC, with immune checkpoint inhibition (ICI) being current first-line therapy (despite somewhat lower efficacy in the non-viral relative to the viral background [59,60]), we further inspected immunity-related translational alterations in greater detail.
We collected key immunity-related marker genes from a previous foundational study of HCC molecular subtypes [5] and from studies that aimed to identify molecular correlates of the response to ICI treatment [61,62]. For most marker genes, TO and TE levels differentiate the non-viral and viral backgrounds, while RNA levels were more similar (Figure 2J, Table S3). For example, the CD4 marker of T-helper cells in tumors is similarly depleted at RNA level in both etiologies, but only in the viral background the TO appears to be largely restored by a 2-4 fold increased TE (Figure 2J, top-right). Thus, translational rather than transcriptional level might implement the previously reported NASH-specific loss of intrahepatic CD4+ cells in fatty liver driven by selective lipid-induced mitochondrial dysfunction [63,64] and further depletion in NASH-HCC tumor [65]. Furthermore, genes encoding immune checkpoint proteins targetable by ICI therapies tend to have substantially increased TE only in the viral background, while the RNA-level changes are substantially less pronounced, as reported before [5] (Figure 2J, top-left). The RNA-level depletion of activated effector T cell markers, similarly, pronounced in both etiologies, is only counteracted at the TE level in the viral background. Increased presence of PD-1 together with T-regulatory cells is an indication of T-cell “exhaustion” [61]; “exhausted” T-cells are targets of ICI treatments; their absence being associated with diminished response to ICI treatments [66]. In our data, the corresponding genes are consistently upregulated at TE level in the viral but not in the non-viral background. Of note, in NASH, dysfunctional, auto-aggressive “exhausted” T cells localize at the tumor periphery and in nearby non-tumor liver tissue, and carry markers such as TNF, CXCR6, and TOX, which then can paradoxically promote carcinogenesis upon ICI treatment via increased necro-inflammation [62]. These markers, as most others, are consistently upregulated at TE level in the viral, but not in the non-viral T-NT comparison (Figure 2J, bottom right). The functional implication of these TE trends is unclear, although it may be linked to the specific localization pattern of immune cells relative to the tumors. Beyond T cells, we also found the pro-inflammatory activity of M1 macrophages significantly upregulated in the viral and downregulated in the non-viral background T-NT comparison, with the mild RNA effect being amplified at TO and TE levels (Figure 2J, bottom left). This may reflect the transition from an inflamed lipotoxic state in the non-tumor tissue to a tumor-suppressive state in the non-viral condition. Lastly, the angiogenesis-promoting factors PDGFRA and PDGFRB tend to be translationally upregulated in viral and downregulated in non-viral tumors, while KDR shows the opposite trend (Figure 2J, bottom right). These growth factor receptors are targets of sorafenib, currently a second-line HCC therapy; the observed trends in translational control might thus contribute to varying clinical response to sorafenib in viral and non-viral HCCs [60].
Overlaying the TE on the scatter of protein-vs-mRNA level changes revealed that in the viral background, the TE and mRNA levels vary along orthogonal axes, which indicates that they make independent contributions to protein-level changes (Figure 2K). In contrast, in the non-viral background, the TE buffers the mRNA level changes, which could explain the narrower range of protein level variation compared to the viral background HCC (Figure 2L). To further quantify these effects, we applied a generalized linear model (GLM), finding that in the viral background, 37.4% of the variance in T-NT protein level changes could be explained by changes in mRNA and TE, with comparable contribution of these two components (mRNA - 16.1%, TE - 21.3%). In contrast, the proportion of explained variance was smaller in the non-viral background, 26.3%, where the TE contribution was substantially smaller – 8.0% (compared to mRNA - 18.3%, Figure S2J). This could be due to the buffering effect we already observed: in the non-viral cohort, most TE T-NT changes across genes can be explained by RNA T-NT changes that are coupled to TE changes (Figure 2F), so that an orthogonal contribution of TE to protein changes is very limited.
GLM results indicate that in both backgrounds, most of the variation in protein abundance is not explained by factors that contribute to the protein synthesis rate. This is to some extent expected, given that the mRNA and RPF measurements originate from different cohorts and that the depth and precision of quantification at mRNA, RPF, and protein level vary. Another potential contributor is protein degradation. We then examined the changes in expression of leading-edge genes of quality control pathways from GSEA analysis (Figure 2M). At the RNA level, these genes showed a small degree of upregulation in both backgrounds (<2-fold), while at the level of TO that we measured from our samples the upregulation was observable only in samples from the non-viral background (Figure 2M). However, these changes were not reflected at the protein level (Figure 2M), indicating that a coordinated upregulation of the degradation machinery does not by itself account for the unexplained variance, and that any contribution of protein turnover would have to arise from regulation not captured by the abundance of these components. These results may also indicate substantially more heterogeneous, gene-specific translational and post-translational control of gene expression in the non-viral cohort, where each gene’s correspondence between transcription-translation-protein intensities can’t be easily approximated by a single genome-wide linear coefficient.
Quantitative uORF–CDS coupling analysis recovers the repressive effect of ATF4 uORF
A well-studied mechanism for modulating the translational output of CDSs involves uORFs (reviewed in [67-69]). While believed to generally hinder the translation of the downstream canonical ORFs, specific combinations of uORFs are also instrumental for the translation of mRNAs encoding proteins that help alleviate stress, the activating transcription factor 4 (ATF4, homolog of yeast’s GCN4) being the key example [70-72]. As ATF4 has been linked to HCC before [73-75], we evaluated the expression pattern of the ATF4 uORFs and CDS in our samples.
ATF4 is a highly conserved gene, consisting of three exons. The mRNA is expressed in liver cell lines as well as in liver tumor tissue, without marked differences between normal and tumor tissue, independent of the etiology (Figure 3A TCGA RNA-seq coverage track). ATF4’s uORF1 and uORF2 (Figure 3A) have been implicated in the regulation of CDS expression, with 180 nt long (59 AAs + stop codon) uORF2 - overlapping with the CDS in a different reading frame - hindering CDS translation [71]. Both uORFs are supported by RPF evidence in our data. A previous study in the yeast S. cerevisiae reported a markedly decreased RPF density at repressive uORFs and higher density at the main CDS under stress, corresponding to a decreased uORF/CDS ratio [76]. Applying this quantification to our ribo-seq samples we found that the uORF2/CDS TO ratio varies ~8 fold across samples within each condition, though without significant T-NT differences (p-value = 0.24 for the non-viral cohort, Mann-Whitney U-test, Figure 3B, left, Table S6). To assess a potential coupling of CDS TO to that of uORF2 TO (general, irrespective of condition), we checked for systematic associations between their per-sample measurements (Figure 3B, right). To avoid spurious correlations that could be introduced by the CDS TO contributing to both uORF/CDS TO ratio and TE [77], we use the following approach. If the uORF2 and CDS TOs were merely driven by fluctuations in the abundance of the mRNA molecules that contain both the uORF and CDS, we would expect a proportional relationship between them, corresponding to the data points stretched along the diagonal. This is not what we observed. We quantified the relationship using principal component analysis (PCA), in which neither variable is privileged and the fitted direction can approach the vertical, and reported the angle of the first principal component relative to the x-axis. Rather than the angle being 45° (corresponding to the data stretched along the diagonal) we obtained steeper angles of ~60°, regardless of the etiological background of samples (Figure 3B). Thus, as the TO of the CDS increases, the uORF2/CDS TO ratio decreases, as expected when the uORF has a repressive effect on CDS expression.
Repressive effect of ATF4 uORF on CDS translation. A. Summary annotation of the ATF4 gene. Left panel: ATF4 gene locus on chromosome 22, with the following tracks - poly(A) site given in the PolyASite database [80], somatic mutations observed in the TCGA cohort of HCC patients obtained from UCSC [81], nucleotide-level PhyloP score computed from 100 vertebrates as well as 30 primates [82], codon-level PhyloCSF score indicating selection for protein coding capacity [83], coverage of the locus by RNA-seq reads from the TCGA data, CAGE data showing transcription start sites [84], coverage of the locus by RNA-seq reads, including spliced reads, from liver cell lines [85]. Right panel: ribosome A-sites inferred in the ATF4 mRNA (indicated in violet in the left panel) from ribo-seq reads of selected patient samples. The disease background of the individual patients is also indicated, as well as calculated log2 uORF2/CDS TO ratio in every sample. B. Left panel: distribution of log2 uORF/CDS TO ratio in various categories of samples (indicated in the legend). Right panel: Scatter of uORF (x-axis) vs. CDS (y-axis) TO across all samples. EVR = explained variance ratio of the first principal component, in the PCA analysis performed over the indicated categories of samples. C. Similarity of uORF-dependent ATF4 CDS TO to expression level of stress response-related factors (see Methods). Expression of the factors was given by the TO (top panel) or protein level (bottom panel). The actin-related protein 1B (ACTR1B) was used as control. D. T-NT log2 fold changes of ATF4 and stress-response-related factors at RNA, TO, TE and protein levels.
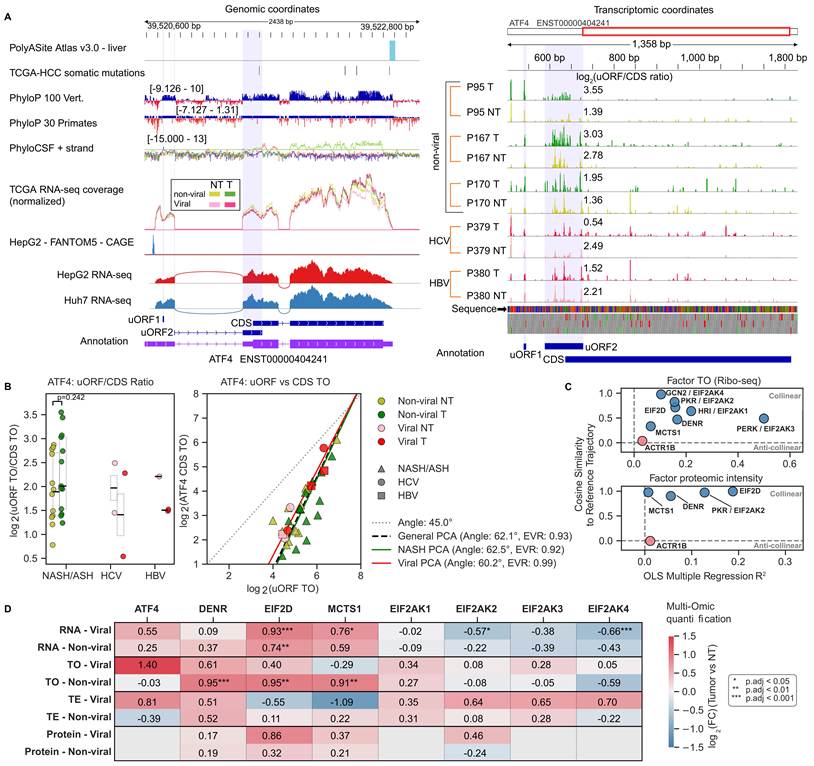
The translation of the ATF4 protein is triggered by protein phosphorylation-dependent signaling cascades involving EIF2α kinases [78] and requires factors such as DENR, MCTS1, and EIF2D to reinitiate translation at the ATF4 CDS, downstream of the uORF [79]. The TOs and protein levels of these factors tend to track ATF4’s uORF-CDS TO trajectory across all samples (see Methods), while the unrelated control gene ACTR1B does not (Figure 3C, Figure S4A-B). This indicates coherent changes of the integrated stress response pathway when considering the entire set of samples. For an additional validation we examined SLC7A11, a key transcriptional target of ATF4 conferring protection to ferroptosis [73], finding it to be upregulated in tumors relative to matched non-tumor tissue at both RNA and TO levels, yet at markedly different levels: ~10/~14 fold, respectively, in non-viral case and ~40/~108 in the viral background (DESeq2 p-values < 0.001, Figure S4C). This is consistent with the trend for upregulation of the uORF2/CDS ratio in the non-viral background and downregulation in the viral background (Figure 3A, right and 3B, left) and the corresponding trend for downregulation of TO and TE of the ATF4 CDS in the non-viral background, and upregulation in the viral background (Figure 3D). Thus, the ATF4 analysis validates our approach for inferring regulatory uORFs from ribosome profiling data.
Further comparing the tumors with control tissue, we found consistently increased expression of the reinitiation factors at all levels of gene expression, primarily driven by transcription (Figure 3D), with few significant T-NT changes in EIF2α kinases; for the latter the trend was towards downregulation at the RNA level and upregulation in TE, yielding relatively stable TO and protein levels (Figure 3D).
Identification of uORFs potentially impacting the translation of downstream CDSs
We first identified translated uORFs by testing the frame bias (3-nucleotide periodicity) of RPF coverage in each sample individually (p-value < 0.01 in Wilcoxon's rank sum test), using a previously developed computational workflow [38]. Requiring significant periodicity in at least one sample yielded 6'722 uORFs, of which 5’648 had RPF support in more than 5 samples (count matrices and the uORF selection results in Table S6); we used this more stringent set for all subsequent analyses. Of these, 2’639 (47%) are present in a recently published reference catalog of translated non-canonical ORFs in humans [86]. The uORFs were ~20-80 codons long (~60-240 nucleotides; Figure 4A), and their frame preference was evident both in individual samples (Figure 4B) and in metagene plots centered on their start and stop codons (Figure 4C). For a small subset, we also found peptide-level evidence in the PRIDE database [87] (Figure S8A).
uORF-associated translational control in HCC. A. Length distribution of uORFs with significant frame bias (n = 5’648). B. Frame bias of reads mapping to uORFs in individual samples of different groups. Each sample is indicated by a dot superimposed on the respective bar plot. Error bars represent standard deviations. C. Metagene plots showing the relative proportion of P sites mapping in the [-50;+50] nucleotide windows centered on the start (left panel) or stop (right panel) codons of the uORFs. Proportions were calculated for each gene individually, then averaged across genes. D. Selection of uORFs showing coupling to CDS TO based on the angle and explained variance ratio of PC1. Angle is determined in the 2D space with uORF TO on x-axis and CDS TO on y-axis. E. Empirical cumulative distributions of selected feature values for uORFs of different categories (not mutually exclusive). P-values from pairwise statistical tests between all possible pairs of uORF categories are displayed. Two statistical tests were conducted for each pair: Kolmogorov-Smirnov (KS) test and bootstrap test for selected distribution quantiles (10’000 iterations, random selection with replacement). Top: median uORF/CDS TO ratio across non-viral NT Ribo-seq samples, log2 scale. Bottom: characteristic TE of the main CDS in the non-viral NT samples, calculated as median TO (across ribo-seq samples) divided by median RNA TPM levels (corresponding TCGA RNA-seq samples), log2 scale. F. Cellular compartment GO categories with significant enrichment in genes containing RI uORFs, obtained with ShinyGO 0.86 web application [95]. As background, genes with at least one out of all 5’648 uORFs were used. G. Biological process GO categories with significant enrichment in genes containing RD uORFs, same methodology as in panel F. H. Distribution of EDEM3 (left) and UCP2 (right) uORF/CDS log2 TO ratio in T and NT samples of non-viral, HBV and HCV background, along with the principal component fit of CDS (y-axis) TO vs. uORF (x-axis) TO across the entire sample set (general PCA), non-viral samples (non-viral PCA), viral samples (Viral PCA). I. T-NT changes of EDEM3 and UCP2 at RNA, TO, TE and protein levels in samples of viral and non-viral backgrounds. The UCP2 protein was not detected in mass spectrometry. P-values are from DESeq2 tests for RNA, TO, TE analyses, and from limma tests for protein analyses. J. T-NT changes in uORF/CDS TO ratio vs. angle of the CDS-uORF TO PC1 fit. The uORF categories are mutually exclusive.
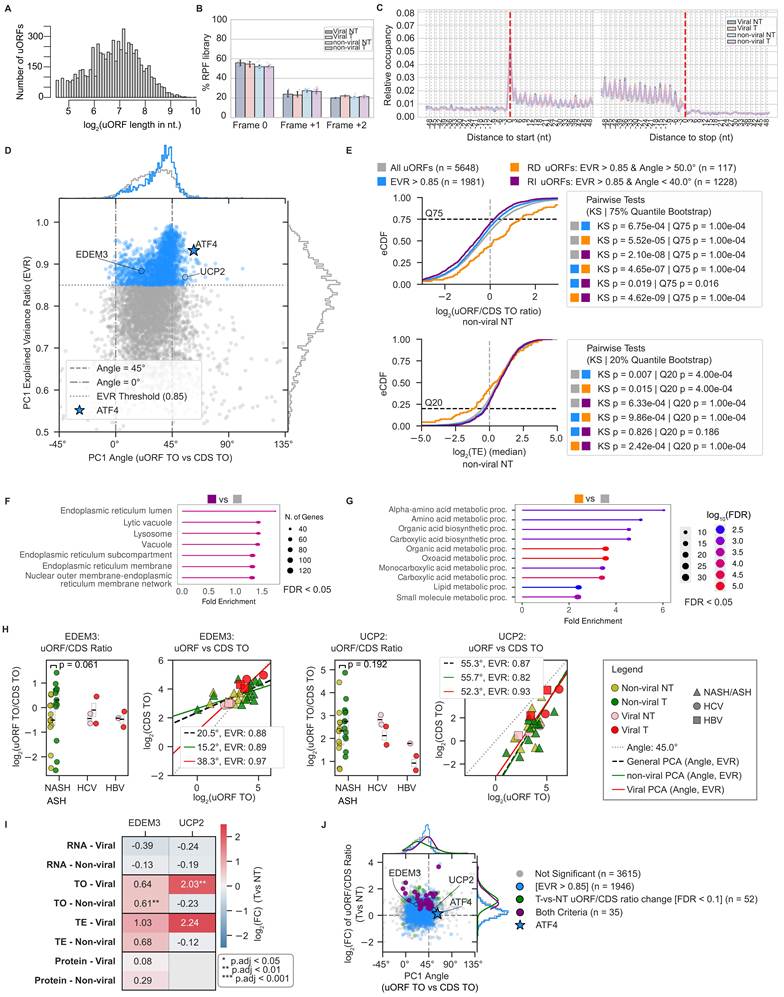
Applying the analysis described above for ATF4 (Figure 3B, right), we retained 1’981 uORFs for which PC1 explained at least 85% of the variance in uORF and CDS TO levels across all samples (Figure 4D), indicating a well-defined linear relationship between the two. From this set, we used the angle of the fitted CDS-vs-uORF TO line to define two categories, taking as reference the angle of 45° expected if uORF and CDS translation were driven solely by fluctuations in the abundance of the shared mRNA. 117 uORFs behaved similarly to ATF4, with an angle > 50°, that is, a uORF/CDS TO ratio that decreases as the CDS TO increases; we refer to these as ratio-decreasing (RD) uORFs. Conversely, with a symmetric threshold at an angle < 40°, 1'228 uORFs showed the opposite coupling, increasing uORF/CDS ratio as the CDS TO increased; we refer to these as ratio-increasing (RI) uORFs.
We next asked whether RD and RI uORFs differ in properties beyond their coupling to CDS. The strength of RPF 3-nucleotide periodicity did not differ significantly between RI/RD and all 5’648 uORFs with RPF support (Figure S5A). However, in non-tumor samples of non-viral background, the RD uORFs have substantially higher median uORF/CDS TO ratio (p-value of Kolmogorov-Smirnov (KS) test = 5.52e-05) and lower CDS TE (p-value of KS-test = 0.015, Figure 4E), while RI uORFs showed opposite effects that were statistically significant but milder. To verify whether this was due to the substantially larger size of the RI compared to the RD dataset, we performed a rolling window analysis, sorting all 1’981 uORF by the PC1 angle, and evaluating specific properties in consecutive subsets of uORFs (Figure S5B). The angle was indeed monotonically associated with the median uORF/CDS TO ratios, with the extremes of the angle ranges showing highest significance and similar effect magnitude (Figure S5B, top). However, the association with CDS TE among the RI uORFs was consistently weak in all rolling windows, whereby RD uORFs stood out as giving substantially lower CDS TE (Figure S5B, bottom). Similar patterns of association with TE and uORF/CDS TO ratios with the PC angle hold for non-tumor samples of viral background (Figure S5C). RD uORFs are significantly longer (p-value of KS test = 0.001), and RI uORFs are shorter (p-value of KS-test = 2.04e-07) than other uORFs (Figure S5D, left). Furthermore, RD uORFs are situated significantly closer to the start codon of the CDS (p-value of KS-test = 9.3e-04), ~40% of them overlapping with the CDS, compared to ~25% of the other uORFs (p-value of bootstrap 75% quantile test = 9.34e-04, Figure S5D, right). Thus, the RD category that contains ATF4’s uORF2, exhibits genomic features and strong association with lower CDS TE that was previously attributed to repressive uORFs [88,89] while the features of RI uORFs display opposite trends though with substantially weaker magnitude.
Gene ontology enrichment analysis revealed that RI uORFs are located in genes associated with membrane-bounded subcellular compartments such as the endoplasmic reticulum, lytic vacuole and lysosome (Figure 4F, Figure S5E). In contrast, RD uORFs are found in genes involved in amino acid metabolism (Figure 4G), a process for which ATF4 is a key regulator [90]. One RI uORF in the EDEM3 gene (ER degradation-enhancing α-mannosidase-like protein 3) and one RD uORF in the UCP2 (uncoupling protein 2) gene are shown in Figure 4H. EDEM3 (Figure S5F) is an α-1,2-mannosidase in the ER lumen controlling the degradation of misfolded glycoproteins [91], which in our data is slightly downregulated at RNA level but upregulated at TE and TO levels in tumors of both backgrounds. UCP2 (Figure S5G) is a mitochondria-localized protein for which translational repression by a uORF has been demonstrated experimentally [92], as for ATF4; its assignment to the RD category by our analysis therefore provides independent support for this class. In our data, the TE and TO of UCP2 are upregulated in the viral but not in the non-viral background (Figure 4I) consistent with weak upregulation of the uORF/CDS TO ratio in the non-viral background and downregulation trend in the viral background (Figure 4H, Figure S5G, right). The enrichment of RI uORFs in genes encoding proteins of the secretory pathway could reflect different pools of ribosomes being involved in the translation of their uORFs (in the cytoplasm) and CDSs (at the ER) [93], with the bottleneck being the signal recognition-particle-dependent translocation of the translated mRNAs to the ER, when a transient elongation arrest may yield an increased abundance of RPFs at the 5’ end of the CDS. More generally, besides increased translation initiation, CDSs may acquire an increased abundance of RPFs via decreased translation elongation speed [94], which could confound the above analysis of uORF-CDS coupling.
Our results thus reveal hundreds of uORFs whose translational output is coupled to that of the corresponding CDS. At the same time, only 35 of the 1981 uORFs showed a significantly changing uORF/CDS ratio in tumors compared to control tissue, all of them in the direction of increased uORF/CDS ratio and predominantly characterized by the PC1 angle similar to or below 45 degrees, i.e. not belonging to the RD category (FDR < 0.1 in Mann-Whitney U-tests, Figure 4J, Table S6). The small size of our cohorts diminished the statistical power to detect small condition-dependent effects in uORF/CDS ratios with conservative Mann-Whitney (MW) statistical tests. However, the overall trends in the magnitude of uORF/CDS TO ratio changes were remarkably consistent with orthogonal multi-omic measurements of the respective genes (Figure S5E). Most notably, 7 out of 8 genes related to alpha-amino acid metabolism, with RD uORFs in their transcripts, had increased uORF/CDS ratio in tumors alongside decreased RNA, TE, and/or protein levels (Figure S5E, right), similar to the RD uORF-containing ATF4 (Figure 3D). In contrast, genes with RI uORFs tend to have increased RNA, TE, and/or protein levels (Figure S5E, left). In summary, these results suggest that uORF architecture modulates how the downstream CDS responds to the altered translational environment of the tumor, though the evidence for the specific effect direction in the patient tissue data is scarce and only around a hundred uORFs display multiple, consistent features supporting their repressive effect on the translation of the main CDS.
Beyond uORFs: increased translation of lncRNA-encoded ORFs in HCC of non-viral background
Having characterized uORFs, we asked whether the other classes of non-canonical translation proposed in the literature are detectable in our data. As ribosomes lacking specific rRNA modifications have been implicated in miscoding and stop codon readthrough in liver cancer cell lines [33], we first assessed the evidence of translation downstream of annotated stop codons in our data. With the same methodology of ORF annotation that we employed for uORFs and the same criterion of significant periodicity in at least one sample and comprehensive coverage across the samples of a given condition, we found substantially fewer ORFs with evidence of translation (400, Table S6) located in 3’UTRs (downstream ORFs, dORFs) compared to 5’UTRs (6’722). The lengths of translated dORFs and uORFs were similar, in the range of ~20-80 codons (Figure S7A), and metagene (Figure S7B) as well as per-sample frame bias (Figure S7C) analyses supported the dORF-derived reads being ribosome footprints. Given the relatively small size of this set and the limited evidence for their coupling to CDS TO compared to the uORFs (Figure S7D), we did not analyze them further.
Prior studies also reported the generation of proteins with specific subcellular localization via stop codon readthrough (SCRT) [96,97]. Searching for evidence of SCRT in our data, we identified 290 genes with significant frame preference of RPFs mapping downstream of the stop codon (Wilcoxon rank sum test p-value < 0.01 in at least one sample, all sample data in Figure S7E-F, Table S6) and robust coverage (> 1 RPF) in all samples of a given condition. Genes with readthrough evidence encode proteins mainly involved in intra- and extracellular traffic (Figure S7G). Similar to dORFs, there was limited evidence for coupling to CDS TO compared to the uORFs (Figure S7H). The RPF density in the SCRT region relative to the CDS was approximately -6 on the log2 scale, suggesting that ~1.5% of proteins synthesized from these mRNAs carry C-terminal extensions. SCRT efficiency did not differ significantly between T and NT samples, in either the viral or non-viral background (Figure S7I).
Long noncoding RNAs (lncRNAs) have been strongly linked to HCC, largely through transcriptional effects (reviewed in [98]). However, an increasing number of studies have identified lncRNAs that undergo translation and generate functional peptides [99,100]. To check the presence of such lncRNAs in our system, we mapped the reads that did not match rRNAs or mRNAs to the lncRNA set from version 6 of the NONCODE database [101] and then evaluated the evidence of 3-nucleotide periodicity of ribosome footprints on lncRNA-encoded ORFs. With the same criteria as for other types of translation units (Wilcoxon rank-sum test of 3-nt periodicity p-value < 0.01 in at least one sample and at least 1 RPF in all samples of a condition, viral/non-viral NT or T), we obtained 1’694 lncRNA-derived ORFs (Figure 5A, B), 254 of which are present in the recently-published catalog of non-canonical ORFs [86]. Their length distribution was shifted slightly towards larger values relative to lncRNA-encoded ORFs that did not pass our criteria of translation evidence (Figure 5C, D), which could be due to longer ORFs accumulating more RPFs and being more likely to reach significance in the periodicity test.
Analysis of lncRNA translation. A. Metagene plots showing the relative proportion of P sites mapping in the [-100;+100] nucleotide windows centered on the start (left panel) or stop (right panel) codons of the select lncRNA-derived ORFs. The proportions were calculated for each gene individually, then averaged across genes. B. Frame bias of reads mapping to the inferred lncRNA-derived ORFs in individual samples of different groups. Error bars represent standard deviations. C. Length distribution of lncRNA-derived ORFs with significant RPF frame bias. D. Length distribution of predicted ORFs in lncRNA with (blue) and without (red) evidence of 3 nt-periodicity in our ribosome profiling data. E. Clustering TO z-scores of lncRNA derived-ORFs across all samples with viral or non-viral background. F. Distribution of T-NT change in lncRNA derived-ORF TE in samples of viral and non-viral backgrounds. G. Summary annotation of the ZFAS1 gene. Left panel: ZFAS1 gene locus showing the following tracks - poly(A) site given in the PolyASite database [80], nucleotide-level PhyloP score computed from 100 vertebrates as well as 30 primates [82], codon-level PhyloCSF score indicating selection for protein coding capacity [83], coverage of the locus by RNA-seq reads from the TCGA data, CAGE data showing transcription start sites [84], coverage of the locus by RNA-seq reads, including spliced reads, from liver cell lines [85]. The introns of ZFAS1 contain the SNORD12 cluster of snoRNAs. Right panel: coverage of the ZFAS1 longest, unspliced transcript (also indicated in violet in the left panel) by RPFs in individual patient samples. The disease background of the individual patients is shown on the left of the tracks. The ORFs covered by RPFs in our data are shown in the bottom right panel, which also highlights the peptide found in public mass spectrometry data.
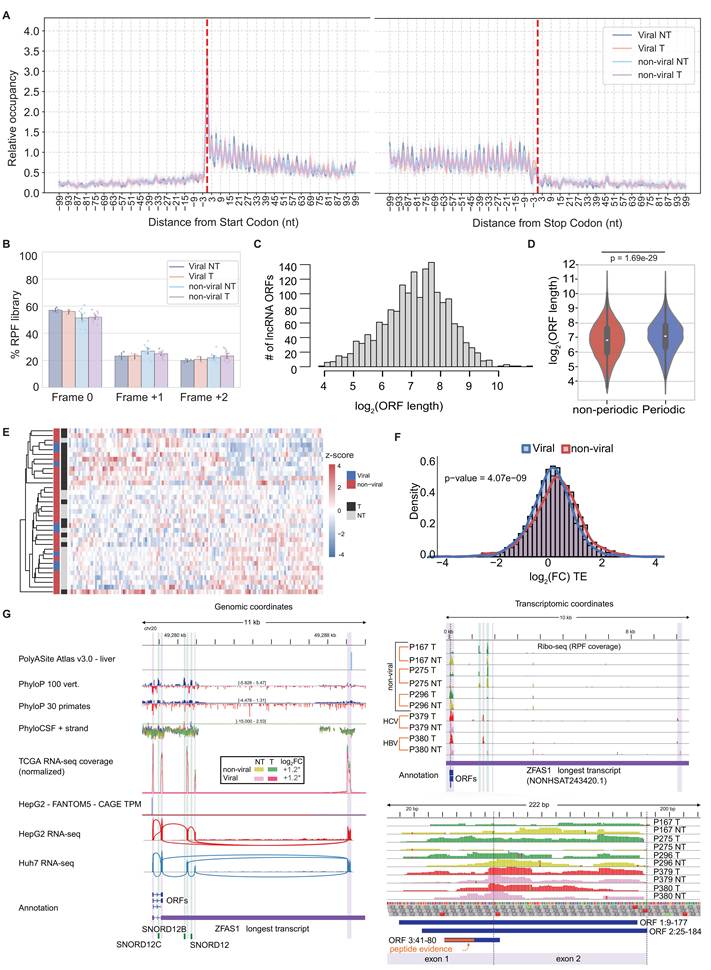
156 of the 1’694 candidates are supported by at least one spectrum and 15 of them at least two proteomics data sets, either from our study or from the 16 liver-related datasets from the PRIDE database [87] (Figure S8D, Table S7). Clustering samples by the z-score of TO of peptide-supported lncRNA-derived ORFs (all candidates shown in Figure S8E) reveals a pattern of segregation by the T/NT status, suggesting that lncRNA expression is regulated in tumors (Figure 5E, Table S7). Moreover, the TE of lncRNA-derived ORFs increased slightly (mean/median in viral etiology: 0.22/0.24, in non-viral etiology: 0.36/0.40), but significantly (p-value = 4.1e-09 in Wilcoxon rank-sum test) in tumors of non-viral relative to viral background (Figure 5F).
The example of the lncRNA ZFAS1 (ZNFX1 Antisense RNA 1), which is amplified and promotes metastasis in HCC [102], is shown in Figure 5G. The longest annotated lncRNA from this locus measures ~10kb, though most of this sequence is removed by splicing, which also releases the snoRNAs hosted in the introns (Figure 5G, left). Three ORFs, measuring from 13 to 52 codons, were identified spanning the first two exons, and our ribo-seq data provide ample evidence for their translation, with ribosome footprints observed in at least half of ribosome profiling samples (Table S6). The 13-codon (including the stop codon, Figure 5G, right) ORF3 is further supported by peptide evidence in public proteomic datasets from hepatocellular carcinoma cell lines [103,104] (Table S7). Thus, our data provides further support for lncRNA-derived peptides, particularly in the context of SH-associated HCC.
Discussion
Molecular studies of HCC have so far concentrated on the genome, transcriptome and proteome, revealing a heterogeneous disease in which recurrent mutations converge on a small number of targets such as TP53, CTNNB1 and the TERT promoter [9]. While it has been recognized that translational control is perturbed in HCC [9,36], the extent, targets and especially the dependence of this perturbation on the underlying liver disease has remained unresolved, largely because ribosome profiling of human liver has been restricted to virus-associated tumors [36]. By profiling the ribosome footprints of 43 samples from 24 patients, most with SH, and integrating them with matched proteomes and TCGA transcriptomes [5,105], we were able to separate transcriptional from post-transcriptional contributions across the two principal etiologies of HCC.
Our central finding is an asymmetry between the two regulatory layers. Transcriptional alterations were largely shared: both etiologies showed a reduction in liver-specific metabolic functions and an upregulation of proliferation-related programs driven by the same set of transcription factors, with no detectable activity differences between viral and non-viral tumours (Figure 2A-B). Translational alterations, by contrast, diverged. The slope relating TO to mRNA change was 0.82 in the viral background and 0.56 in the non-viral (Figure 2E-F), a difference that remained upon resampling to the size of the viral cohort and was reproduced when the virus-associated samples of Zou et al. were analyzed instead of our own. The slope substantially below one is indicative of widespread “translational buffering” of transcriptomic changes, a phenomenon with increased appreciation in recent literature but unclear mechanistic explanation [106-109]. The functional categories with divergent translational alterations were translation itself, protein traffic, the stress response, mitochondrial function, and immunity-related pathways (Figure 2H-I). The detailed analysis of the latter further suggested the systematic contribution of translational changes to the emergence of an “immune-cold” microenvironment in HCC tumors of non-viral etiology (Figure 2J). Many of our findings from differential TE analysis support recent spatial proteomics data comparing patient samples from NASH, HBV, and HCV-associated HCCs [110]. In the latter study, NASH-HCCs had consistently reduced overall tumor immune cell infiltrations (~34% vs ~56% in HCV and HBV background), decreased CD8+ and GZMB+ T-cells and increased polymorphonuclear myeloid-derived suppressor cells (PMN-MDSCs), indicative of a more immunosuppressive microenvironment. The study also found higher content of PD-1+ and PD-L1+ cells in NASH-HCCs compared to viral HCCs, but only in the peritumoral tissue rather than the tumor itself and its margin. Our findings of smaller TO and TE of PD-1 and PD-L1 in the non-viral relative to viral T-NT comparison (Figure 2J, top-left), are thus also consistent with the mentioned study.
The translational buffering was apparent also at the protein level: whereas in the viral background mRNA and TE changes contributed comparably and independently to protein-level change (Figure 2K, 16.1% and 21.3% of variance, Figure S2J), in the non-viral background, “buffering” resulted in TE being largely predictable from the RNA changes (Figure 2F), with only a small orthogonal contribution remaining, namely 8.0% (Figure 2L, Figure S2J). Moreover, most of the variance in protein abundance remained unexplained in both backgrounds, and a coordinated upregulation of the degradation machinery did not account for it (Figure 2M). This leaves differences in measurement technique, post-translational modifications, and error as likely contributors. In support of this notion comes the limited correlation of ribo-seq-based RPF estimates with the mass spectrometry-based estimates of protein abundance obtained from the same samples (Figure 1I).
Because translation initiation is rate-limiting [111] and is governed by regulatory elements in 5’UTRs, uORFs in particular [112], we asked how uORF and CDS translation are coupled in this tissue. We anchored the analysis on ATF4, whose uORF2 is an established repressor [71]. T-NT changes in ATF4’s uORF2/CDS ratio showed a trend toward upregulation in the non-viral and downregulation in the viral background (Figure 3B), which were accompanied by consistent changes in the ATF4’s CDS TO and TE, decreasing in the non-viral and increasing in the viral backgrounds. However, these trends did not reach statistical significance (Figure 3D). The ATF4-dependent integrated stress response represses cellular translation [113], and in our data, TE and TO of genes related to translation process are generally downregulated transcriptome-wide in the viral cohort T-NT comparison and upregulated in the non-viral cohort (Figure 2H). Further examining SLC7A11, a key transcriptional target of ATF4 conferring protection to ferroptosis [73], we found milder T-NT upregulation in the non-viral than in the viral background, at both the RNA (~10- vs. ~40-fold) and TO (~14- vs. ~108-fold) levels (Figure S4C). The reduction of ATF4 expression in this context may buffer SLC7A11’s upregulation, increasing the susceptibility to ferroptosis to further support oncogenesis [73]. These results suggest a model whereby in the non-viral background, oncogenesis hinders ATF4 translation via increased uORF2 usage, relieves the steatohepatitis-induced integrated stress response and globally upregulates translation. This corroborates previous immunohistochemistry measurements of translation initiation factors in HCCs of different etiologies [17] where the rate-limiting translation initiation factor eIF4E was strongly upregulated on the protein level in non-viral, but not viral-related HCCs. Another crucial factor, eIF6, increased its protein levels throughout progression from fatty liver disease to HCC and its depletion reduced oncogenesis in a mouse HCC model [14]; however, the eIF6 protein expression in patient tumor samples appeared to be highest in HBV tumors, followed by non-viral and then HCV tumors [17]. The same clear patterns for eIF4E and variable changes for eIF6 were observed in our TO and TE measurements; for eIF4E, the upregulation in non-viral background follows the general pattern of being implemented on TE and TO levels rather than the RNA level (Figure S8F).
Following the validated ATF4 signature — uORF/CDS occupancy ratio decreasing as CDS output increases — independently recovered at UCP2, a second locus with experimentally demonstrated uORF-mediated repression [92], we applied the analysis transcriptome-wide. This yielded 117 ratio-decreasing (RD) uORFs consistent with repression, and, unexpectedly, an order of magnitude more ratio-increasing (RI) uORFs. The prevailing view, supported by massively parallel reporter assays [114,115] and by the negative selection acting on uORF-creating variants [116,117], is that uORFs are predominantly repressive, so this imbalance is surprising. To gain additional insight, we compared the properties of RD and RI uORFs. We recapitulated the findings from population genetics studies, showing that relative to CDSs, uORFs have negligible evolutionary conservation both on nucleotide and amino-acid level, and uORFs with Ribo-seq support have only slightly increased conservation scores relative to decoy uORFs (Figure S6A). Interestingly, as sub-group, RD uORFs displayed even lower conservation than other uORFs, akin to random drift (Figure S6B). However, they displayed the features previously reported for uORF with a translation repressive effect [89], such as larger length (relative to other uORFs), overlapping in a different frame with the start codon of the main CDS, lower CDS TE (Figure 4E, Figure S5C-D).
Perhaps the most surprising finding is that only a small subset of uORFs with evidence of translation had these properties, while the much more numerous RI uORFs showed opposite trends for the same metrics (Figure 4E, Figure S5B). The apparent “translation-activating” function of RI uORFs, reflected in increased TE of the CDS in parallel to increasing uORF/CDS TO ratio, may be related to compartment-specific translation localization or systematic differences in translation elongation speed which can be further investigated, e.g. using data from ribosome run-off experiments [85]. Consistent with this hypothesis, RI uORFs are enriched among genes encoding proteins of the endoplasmic reticulum, lysosome and secretory pathway (Figure 4F, Figure S5E, left), whose CDSs are translated in part on ER-associated ribosomes while their uORFs are necessarily translated in the cytosol before targeting [93]. Recently emerged techniques such as proximity-labeling ribosome profiling [118] could be used to follow up on the compartmentalized translation hypothesis. Alternatively, these uORFs may be “inactive” or predominantly play a “bystander” role in the translation of the CDS. Supporting this hypothesis are the weak trends in uORF length and distance to CDS (Figure S5D) as well as CDS TE, even when controlled for uORF subset size (Figure S5B). Furthermore, filtering by ratio of variance explained by the first PC results in the distribution of PC angles converging to 45° primarily through depletion of smaller angles (Figure 4D, marginal distribution at the top). Lastly, the coupling analysis highly relies on the assumption that the uORF and the CDS are located on the same RNA transcript. While this appears to be true in the presented examples (Figure 3A, Figure S5F-G), it is, in principle, impossible to reliably assign RPFs to uORF and CDS of a given transcript isoform, if multiple compatible transcript isoforms are expressed simultaneously in the sample. Thus, if a uORF were present only on a specific isoform, e.g. with a longer 5’UTR, then the uORF/CDS TO ratio would be confounded by the relative transcription rate of the isoforms. Similarly, alternative polyadenylation and splicing at 3’ exons could create artifacts in the coupling analysis of dORFs and RT events. However, given the proportionality of uORF and CDS TO for many of the uORFs, the issue of transcript annotation appears less relevant for this category of ncORFs.
Whether uORFs modulate CDS translation outside of strong stress responses remains debated [76,119]. Our data argue for a modest contribution: only 35 of 1'981 uORF-CDS pairs showed a significantly altered ratio between tumour and non-tumour tissue (Figure 4J). This is probably an underestimate because our statistical analysis based on the MW U-test must be overly conservative given the small sample size. In support of this notion, RD uORFs displayed remarkable consistency between the uORF/CDS TO ratio changes (despite individual genes not reaching statistical significance) and changes in TE, TO, and protein levels of the main CDS (Figure S5E, right). Methods for increasing the sensitivity of differential uORF/CDS usage analysis could perhaps be adopted from the field of alternative splicing [120], if the uORF/CDS ratio behaves similarly to the ratio of alternative isoforms. Further, repression of CDS translation can lead to RNA decay [121], reducing the chance of capturing RPFs from the most repressed transcripts. Indeed, uORF-containing mRNAs are frequently stabilized upon depletion of RNA decay factors [122,123].
Reinitiation downstream of the ATF4 uORFs triggered by stress kinases requires the DENR-MCTS1 complex or the homologous EIF2D protein [79]. While in the non-viral background HCC these factors were significantly upregulated at the TO level, we did not find consistent changes in the TO and TE of ATF4 CDS, which was rather downregulated (Figure 3D). However, when analyzing the consistency of reinitiation factor expression levels with the change in ATF4 uORF/CDS TO ratio across all samples, irrespective of their disease status, we found remarkable consistency, especially at the protein level (Figure 3C, Figure S4A-B). In agreement with these results, in tumor-vs-non-tumor comparison, protein intensities of these factors showed only slight upregulation trends, a bit stronger in the viral than the non-viral background. Moreover, EIF2AK2, encoding the PKR stress kinase, was downregulated in the non-viral and upregulated in the viral condition (Figure 3D). This, as well as the changes in eIF4E and eIF6 described above (Figure S8F), together suggest that the stress response pathway may be upregulated in the viral and downregulated in the non-viral HCC relative to corresponding non-tumor tissue.
Beyond uORFs, we found translation downstream of stop codons for 290 genes. Our criterion – a dominant reading frame downstream of stop codons – allows for the possibility that alternative isoforms (other than those containing the extension region in the terminal exon, which we checked) or reinitiation immediately downstream of the stop codon explain the RPF coverage. The abundance of SCRT isoforms, estimated from the ribosome densities on CDS and 3’UTRs, is in the range of a few percentages relative to the canonical ORF, consistent with prior estimates [124,125]. The detection of RPF-supported readthrough peptides in proteomics datasets (Figure S8B) is further indication that such isoforms are expressed and sufficiently stable to be detected.
Finally, 1’694 ORFs in transcripts annotated as non-coding in the NONCODE database [101] showed robust translation evidence, and 15 were supported by peptide spectra from at least two proteomics datasets (Figure S8D). Their TE was increased in the non-viral background, partly counteracting the transcriptional change, whereas in the viral background the TO and mRNA changes were more concordant. Thus, if lncRNAs contribute neoantigens [126], the neoantigen load may be different in HCC of viral and non-viral background, with possible consequences for the immunotherapy response [62]. ZFAS1, a snoRNA host gene upregulated in HCC on the RNA level [102], is an example of this class: three short ORFs at its 5’ end yield RPFs, and one (ORF3) has peptide support in publicly available mass spectrometry datasets (Figure 5G). Besides increased RNA abundance (log2FC=1.2, p-value < 0.05 in DESeq2 analysis for both etiologies), ORF3 further has the trend of TE upregulation, both in non-viral (TE log2FC = 0.83, p-value = 0.26 in the deltaTE test) and viral (TE log2FC = 0.69, pval = 0.22) T-NT comparisons; in contrast, the TEs of ORF1 and ORF2 tend toward downregulation (Table S6).
Some limitations in sample availability could affect our conclusions. Our translational efficiency estimates combine ribosome footprints from our cohort with mRNA levels from TCGA, since the available material did not permit both measurements from the same tissue; the cross-dataset controls we provided argue that the etiology-dependent differences are not an artefact of this design, but our TE estimates remain a cross-cohort quantity. In particular, differences in tumor purity and in the cellular composition of the tissue between our samples and those of TCGA could affect gene-level TE estimates, and, as all our measurements come from bulk tissue, the T-NT changes in TO and TE of genes expressed predominantly in non-parenchymal cells, such as the immune markers in Figure 2J, may partly reflect differences in immune and stromal cell infiltration rather than translational regulation intrinsic to hepatocytes or tumor cells. The global relationship between TO and mRNA changes (Figure 2E-F) is less susceptible to these factors, as it is dominated by the thousands of genes expressed in parenchymal cells, and the high slope of the viral background was reproduced when RNA-seq from the same samples was used as reference (Zou et al. dataset, Figure S2C-D). The viral group consists of 4 tumors and 4 non-tumor samples, thus negative findings, e.g. regarding clustering by cirrhosis, limited regulatory role of uORFs could reflect the limit of detection rather than absence of effect. Conversely, gene-level differences observed in the viral background, such as the increased TE of immune checkpoint and T-cell markers (Figure 2J), should be regarded as exploratory. The SH group was classified before the recent change in nomenclature, and it is therefore broader than the MASH category. Finally, the cohort is demographically skewed: of the 21 patients for whom this information was available (Table S1), 18 were male and 19 were 60 years of age or older. This cohort composition is consistent with the epidemiology of HCC [1] but does not allow us to further stratify samples by sex. Given the known sex differences in hepatic lipid metabolism [127] and in HCC incidence [1,128], we cannot exclude that some of the etiology-associated differences we report are in part confounded by sex; resolving this will require larger cohorts.
Altogether, our study provides the first translational landscape of SH-associated HCC and shows that translational alterations in this background are very distinct from those in virus infection-associated HCC. The two backgrounds exhibit different global patterns of TE changes, i.e. transcriptome-wide RNA-dependent “buffering” in the non-viral vs. RNA-independent in the viral etiology. The study further provides rigorous characterization of uORF regulatory function using a newly developed computational analysis framework based on a PCA approach that tackles the issue of spurious associations potentially arising from coupling of variables [77]. The study further identifies numerous translated regions – for which the term translon has been recently coined [129] – including in RNAs currently annotated as non-coding, some yielding reproducibly detected peptides. The candidate genes and ORFs reported here provide a starting point for further validation experiments.
Methods
Samples collection and histopathological assessment
Samples were collected from patients undergoing surgery at the University Center for Gastrointestinal and Liver Disease (Clarunis), Basel, Switzerland. Written informed consent was obtained from all patients. The study was performed in accordance with the Helsinki Declaration and approved by the ethics committee (Ethics Committee of Basel, EKBB, no. 2019-02118). Histopathologic characterization was performed as per standard of care at the Institute of Pathology Basel from certified pathologists. The “tumor” samples represent a bulk tissue homogenate, while “non-tumor” samples were taken from distant liver parenchyma.
Tissue lysis and sample preparation
Tissues (20-40 mg) were lysed under cryogenic conditions with 100 µl per 10 mg of tissue of lysis buffer (20 mM Tris-HCl pH 7.5, 100 mM NaCl, 10 mM MgCl2, 1% Triton X-100, 0.5% sodium deoxycholate, 1 mM dithiothreitol (DTT), 100 µg/ml cycloheximide, 0.8 U/µl RNasin plus RNase inhibitor (Promega), 0.04 U/µl Turbo DNase (Invitrogen), and EDTA-free protease inhibitor cocktail (Roche)) on an automatic freeze mill (SPEX Sample prep) using the following program: Precool: 2 min, Run: 2 min, Cool: 2 min, Cycles: 2, CPS: 5. Pulverized samples were transferred to a pre-chilled 50 ml falcon tube and incubated with continuous rotation on an overhead shaker (15 rpm) for 60 min at 4 °C. Lysates were then passed through a 23G needle for 10 times on ice and kept with continuous rotation on an overhead shaker (15 rpm) at 4 °C for 5 min. Lysates were centrifuged at 3’000 xg for 3 min at 4 °C, supernatants were collected and centrifuged again at 10’000 xg for 5 min at 4 °C. RNA concentration was measured using a Nanodrop 2000. From these clarified lysates, the translatome (ribosome profiling) and the proteome (proteomics) were analyzed.
Ribosome profiling
RNA concentration from clarified lysates was measured using a Nanodrop 2000 spectrophotometer (ThermoFisher Scientific). Ribosome profiling was performed as described in [115] from equivalents to 4-6 OD260 of lysates treated with 8.25 U RNase I (Invitrogen) per unit of OD260 for 45 min at 22 °C in a thermomixer (1’000 rpm). Libraries were prepared in a ligation-free manner with the SMARTer smRNA-Seq Kit for Illumina (Takara) and sequenced on the Illumina NextSeq 500 sequencer in the Genomics Facility Basel (Department of Biosystems Science and Engineering (D-BSSE), ETH Zürich).
Analysis of ribosome profiling data
Processing of Ribo-seq reads was done with a previously developed Snakemake pipeline. Single-end reads from .fastq files were trimmed with fastx_clipper from FASTX-Toolkit version 0.0.14 with parameters ‘-a (3’adapter) AAAAAAAAAA, -l (minimum-length) 20, -c (discards non-clipped sequences) and -n (discards sequences with unknown (N) nucleotides)’. The trimmed reads were further trimmed with fastq_quality_trimmer from the same toolkit with -t (minimum quality) 20, -Q (quality type) 33. Then the trimmed reads were filtered with fastq_quality_filter from the same toolkit for read quality with the following parameters: ‘-q (minimum quality) 20, -p (minimum percent of bases that must have [-q] quality) 90’, -l (minimum-length) 20. These reads were first aligned to ribosomal RNA (rRNA) sequences obtained from Homo sapiens ribosomal DNA (rDNA), complete repeating unit (https://www.ncbi.nlm.nih.gov/nuccore/U13369) using Segemehl version 0.2.0 [130]. The reads that did not map to rDNA (25% to 65% of the total reads mapped to rDNA) were then aligned to the longest coding transcripts for each gene identified from Homo sapiens GRCh38–hg38 genome assembly, Ensembl 110 annotation using Segemehl. The uniquely mapped reads from this alignment were used for downstream analysis. Reads were further separated into groups by read lengths. In each such group, all plausible nucleotide distances from 5’end of read to a position of the 1st nucleotide of a presumable ribosomal P-site were compared in terms of compatibility with 1st nucleotide positions of annotated start codons across genes. Then, the distance giving highest compatibility was selected as characteristic for a particular read length. P-site positions in reads were further inferred by shifting the position of 5’ends using that characteristic distance. Lastly, reads with determined P-sites from different read length groups were pooled together for every sample. In addition, A-sites in reads were similarly inferred, by additional 3 nt shifting and were used for visualization of the translation signal in selected genes.
For P-site metagene plots, the P-site coordinates for all mapped reads are identified by using read length specific 5' offsets and quantified across 101-nucleotide length windows centered on target start and stop codons. Then to ensure equal weighting across all transcripts regardless of expression level, P-site counts were normalized on a per-ORF basis. Positional counts within 101-nucleotide length windows were converted to relative frequencies, averaged across the ORFs, and aggregated by experimental groups to visualize tri-nucleotide periodicity.
To identify lncRNA-derived ORFs, NONCODE database version 6 [101] is used as reference. First, the lncRNA genes that are expressed in liver tissue are obtained. Then the longest coding transcript isoform of each lncRNA gene is identified and used as the representative transcript for mapping step. The reads that did not map either to rDNA or protein coding transcripts are then mapped to this representative lncRNA transcriptome. The ORF identification step is identical as described above for protein coding isoforms’ untranslated regions. Counts of reads per translation unit per sample are available from Zenodo with DOI: 10.5281/zenodo.18339128.
Molecular signatures of disease background
Numerous prior studies contributed to defining recurrent transcriptional changes (signatures) of viral as well as non-viral (mostly NASH) background HCC. Literature was manually curated with the help from Gemini 3.1 Pro to construct consensus transcriptomic signatures. For non-viral HCC, the signature reflects metabolic reprogramming to increase the lipid biosynthetic capacity needed for tumor proliferation: transcriptional upregulation of de novo lipogenesis and cholesterol synthesis genes (FASN, SCD1, ACACA, ACLY, HMGCR [131]) and strong upregulation of ER stress chaperones and detoxification enzymes (HSPA5, AKR1B10) [132] to manage the lipotoxic microenvironment. Other regulators of lipogenesis and fatty acid processing (PPARA, SIRT1) are downregulated [133], reflecting the loss of normal hepatic homeostasis specific to the NASH environment. In contrast, for the virus-associated HCC, the composed signature reflects the distinct immunological profile, replicative stress, and viral-driven cell cycle dysregulation due to chronic infection. Intracellular interferon-stimulated genes and antiviral response markers (STAT1, ISG15, MX1, OAS1) [134], characteristic of the cellular response to the virus, are upregulated. Also upregulated are PARP1, PCNA, and MCM2 [135,136], genes associated with the response to replicative stress, hyperactive DNA replication, and associated repair mechanisms. Other markers reflecting common pathways of tissue injury and generic malignant transformation are shared across backgrounds. Specifically, reflecting the tumor's metabolic shift towards aerobic glycolysis (the Warburg effect), core carbon metabolism enzymes (HK2, PKM, LDHA) are upregulated [137]. Upregulated are also markers of fibrosis (ACTA2, COL1A1) [138,139], Wnt signaling (CTNNB1, AXIN2) [140], and hyper-proliferation (MKI67, CDK1, TOP2A, EZH2, BIRC5) [141-144]. Finally, markers of aggressive oncofetal dedifferentiation particularly AFP contribute to the viral signature [145,146], while KRT19 [147], EPCAM [148], and GPC3 [149] to both backgrounds (Table S4).
Identification of non-canonical open reading frames (ncORFs) and stop-codon readthrough isoforms (SCRTs)
To identify non-canonical translation products (u/dORF and lncRNA-derived peptides and SCRT isoforms, altogether referred to as ncORFs), we employed a Snakemake pipeline based on a previously developed and published method [38] (see Code availability section). The first step was to identify all alternative start and stop codons on all possible frames of untranslated regions (UTRs) of all protein coding transcripts and lncRNAs, based on the input .gtf annotation file and genome sequence. Next, we removed any ncORFs that fully overlapped with annotated ORFs within alternative transcript isoforms in Ensembl 110 annotation, as well as candidate ORFs shorter than 7 amino acids. The script further quantifies the coverage from inferred P-site locations for all three reading frames within each region, and if the number of inferred P-site positions along a putative ncORF was smaller than 5, the putative ncORF was filtered out. Next, we checked the periodicity of RPF coverage using the non-parametric Wilcoxon rank-sum test and kept for further analysis ncORFs and SCRTs if in at least one sample, the in-frame coverage was significantly higher than the coverage of the 2 alternative frames (Fisher's combined p-value < 0.01). The geometric means of these combined Fisher p-values were used in the analysis at Figure S5A. For ncORFs and SCRT that passed all the filters above, we checked for read support (at least 1 RPF) across all samples of NT or T conditions. For lncRNA-derived ncORFs, we applied it separately for viral and non-viral disease backgrounds and then kept ncORFs that satisfy the comprehensive coverage filter in either of the disease backgrounds. For the ncORFs remaining after these filtering steps, we generated the corresponding amino acid sequences. For SCRTs, we appended the amino acid sequence of the readthrough region to the last 50 amino acids from the canonical protein isoform to capture the peptides that span the canonical and SCRT region of the readthrough isoform for queries of the mass spectrometry data. Finally, we appended the obtained non-canonical peptides to the Homo sapiens Uniprot [150] protein database for further use in the analysis of LC-MS data.
Generalized linear model of protein and TO levels
To evaluate the combined and distinct contributions of transcription and translational efficiency (TE) to differential protein expression, joint multivariable linear regression was performed using the lm function in base R. Protein abundance fold changes were modeled first as a function of RNA fold changes and then as a function of both RNA and TE fold changes and the explained variances for each model were calculated. This approach enabled the statistical assessment of TE's additive effect on final protein levels, thereby isolating the specific regulatory impact of translation from the effects of transcription.
Clustering of lncRNA TO expression
Combined count matrix including all identified translational units (protein-coding transcripts and lncRNA-derived ORFs) was utilized for library size estimation. Variance stabilizing transformation (VST) was applied utilizing the vst function in DESeq2. Following the normalization step, the VST-transformed expression values were z-score scaled across rows. Finally, unsupervised bidirectional hierarchical clustering (clustering both rows and columns) was performed on these z-scores using the pheatmap package.
Analysis of differential expression, differential translational output, translational efficiency, differential ncORF/CDS ratio and differential protein output
Differential expression (based on RNA-seq reads) and differential translational output (based on ribosome profiling reads) analyses were performed using the DESeq2 R package [41] version 1.46.0 with default parameters, without log2FC significance shrinkage, to enable direct juxtaposition of the values obtained from RNA-seq and ribosome profiling. The deltaTE [58] procedure was applied for differential translation efficiency analysis using only ribosome profiling reads mapped to coding sequence (CDS) regions obtained from the GRCh38–hg38 genome assembly, Ensembl 110 annotation. For differential translational output (TO) and differential translation efficiency analysis for lncRNAs, the above procedure was followed after identifying translated ORFs on lncRNAs and treating them as CDS regions. For differential protein output analysis, limma R package version 3.62.2 was used [151]. Differential uORF/CDS TO ratio analysis was conducted by direct calculation of median values of the ratios in sample groups, with significance estimated by Mann-Whitney U-test implemented in scipy.stats Python package v.1.18.0.
Principal Component Analysis (PCA) and PERMANOVA analysis
PCA was performed on TO values and proteomics intensities using prcomp function in R. The expression values were filtered to retain only completely quantified genes (expression > 0 across all samples). Then the values were log2 transformed and standardized using the “scale = TRUE” parameter within the prcomp function. The resulting principal components were visualized to assess sample clustering based on tissue condition (T vs. NT), cirrhosis status, Edmondson grade, and etiology (with “ASH”, “NASH” and “ASH/NASH” combined into a single “ASH/NASH” category). For PERMANOVA analysis, Euclidean distance was applied to log2-transformed TO and protein intensity values to quantify the distance between samples. Statistical significance for all PERMANOVA tests was assessed using 10,000 permutations. Groups were defined by categorizing samples into tumor (T) and non-tumor (NT) subsets. Permutations were constrained such that matched samples were exclusively permuted within their respective patient blocks, treating them as dependent observations. Additional groupings were established by incorporating metadata regarding etiology, cirrhosis status, and Edmondson grade. For tumor-exclusive statistical comparisons, NT samples were excluded prior to distance calculation and testing.
uORF-CDS TO coupling analysis
To evaluate the coupling between translation outputs of uORFs and corresponding CDSs, a systematic screening was performed using a custom Python script (see Code Availability). Paired uORF and CDS TO values across ribo-seq samples were extracted for each uORF. Principal Component Analysis (PCA) as implemented in Python scikit-learn package v1.9.0 was applied to the log2-transformed, mean-centered TO values. The first principal component (PC1) was extracted to calculate the corresponding direction angle in uORF TO (x-axis) - CDS TO (y-axis) feature space as arc tangent between eigenvalues. The angle was then converted to degrees and wrapped to a [-45°, 135°) range thus covering all possibilities. The fraction of the total two-dimensional variance explained by PC1 (explained variance ratio, EVR) was also extracted. To investigate the influence of specific regulatory factors on the ATF4 uORF2-CDS axis, Ordinary Least Squares (OLS) multiple regression was employed using the scikit-learn LinearRegression module. Factor expression levels-derived from either TO or proteomic intensities - were modeled as a dependent variable against the uORF and CDS TO values. The fitted linear coefficients at uORF and CDS TO regressor variables thus represent 2D gradient vectors of factor changes in uORF-CDS TO 2D space (Figure S4A-B). R2 values from these fitted OLS models were extracted. Cosine similarities between factor gradient vectors and PC1 reference trajectory vector were calculated using the NumPy package v.2.5.0.
Gene Set Enrichment (GSEA) and Gene Ontology (GO) analysis
The ClusterProfiler [152] R package version 4.14.6 was used for all the GO term analyses reported in this study. ComplexHeatmap [153] version 2.22.0 and circlize [153,154] version 0.4.16 R packages were used to construct the heatmaps. For GSEA, the fgsea R package [155] version 1.32.0) was used. Concordance of pathways were defined as enrichment in the same direction with at least moderate significance in both GSEA runs (padj < 0.15), requiring a minimum of one comparison to have statistical significance (padj < 0.05). To select the top 25 concordant pathways, these concordant pathways were ranked by their minimum -log10(padj) value across both GSEA runs. This ranking method prioritizes pathways demonstrating robust, high-confidence activation in both GSEA results. Discordant pathways were identified as either complete reversals (opposite enrichments, both padj < 0.15) or condition-specific events (significantly active in one cohort with padj < 0.05, but inactive in the other with padj > 0.3). The top 25 discordant pathways were selected by ranking them according to the maximum absolute difference between their signed -log10(padj) scores.
Processing and analysis of the RNA sequencing data from the TCGA project
Genomic alignments (BAM format) of short paired-end reads from 371 primary tumor and 50 non-tumor RNA-seq samples of the TCGA-LIHC project (The Cancer Genome Atlas, liver hepatocellular carcinoma) were obtained from the GDC portal (accession number phs000178.v11.p8). To evaluate the abundance of transcripts supporting the expression of CDSs and ncORFs, their respective transcriptomic coordinates were converted to genomic coordinates with a custom python script. More precisely, each CDS and ncORF was represented as a unique “gene” element with a single transcript and specified exons, represented in the GENCODE GTF annotation format [156]. This GTF file was used as input to the FeatureCounts package [157] to obtain raw fragment counts per gene across samples, with the following parameters:
featureCounts -p --countReadPairs -O --fraction -Q 255 -s 0 -B -C -P -d 0 -D 10000000000000 -t exon -g gene_id.
The ISMARA web server [158] requires unmapped reads in .fastq format as input. Thus, we first converted the uniquely mapped reads from BAM files to .fastq using Samtools v. 1.18 [159,160]. Briefly, ISMARA uses a Bayesian procedure to model log2-transformed TPM expression levels of all mRNAs in a sample as a linear function of the transcription factor binding sites in the corresponding promoter sequences. The estimated coefficients of the linear model are the motif activities in a sample, where the motifs represent the sequence specificity of the transcription factors. An increased motif activity is inferred when the target genes of the respective transcription factor show relative increase in their TPM values. TPM values associated with every promoter are centered around zero across all samples before analysis, therefore across-sample average motif activity is always zero for all motifs. The explanatory power of any given regulatory motif relative to all other motifs across all samples of the data set is represented by its z-score.
Classification of TCGA data
To split the patient samples into viral and non-viral categories, we used the hepatocarcinoma risk factor information from metadata provided by the TCGA project. Patients with risk factors Hepatitis B, Hepatitis C, Hepatitis C|Other, Hepatitis B|Hepatitis C, Hepatitis B|Other are labeled as viral samples (12 NT, 110 T). Patients with risk factors Alcohol consumption|Nonalcoholic Fatty Liver Disease, Alcohol consumption, Nonalcoholic Fatty Liver Disease, Alcohol consumption|Other, Alcohol consumption|Nonalcoholic Fatty Liver Disease|Other, Nonalcoholic Fatty Liver Disease|Other are labelled as non-viral samples (11 NT, 90 T).
Evolutionary conservation and tumor somatic mutations in ncORFs and CDSs
To evaluate evolutionary conservation and somatic mutation density, transcriptomic coordinates for all ORF categories and annotated CDSs were first converted to genomic coordinates utilizing the zavolab_pyutils toolkit [161,162]. Obtained genomic coordinates of ORFs were used to quantify median values (across all nucleotide positions of the ORF) of various evolutionary conservation metrics in a custom Python script (see Code Availability). Frame-specific PhyloCSF tracks from the alignments of 58 mammal genomes anchored to the human hg38 genome [83] were downloaded from the Broad Institute repository. The median PhyloCSF score was calculated for each ORF based on the chromosome strand encoding the gene and the length of exons constituting the ORF, to account for variable frames in different exons of the same ORF. To isolate the specific signal of ncORFs, ncORFs segments overlapping with annotated protein-coding CDS regions were masked from the target coordinates using bedtools subtract [163]. Other conservation tracks—including 30-way and 100-way phyloP and phastCons, and somatic mutations from whole exome sequencing in HCC study of the The Cancer Genome Project Consortium (TCGA-LIHC [5]) —were downloaded from the UCSC Genome Browser [81] and signal densities were calculated accordingly.
Mass spectrometry-based proteome analysis
Protein samples (see “Tissue lysis and sample preparation” section) were incubated for 10 min at 95 °C. After cooling, a 1 M iodoacetamide solution was added to reach a final concentration of 20 mM and the cysteine residues alkylated for 30 min at 25 °C in the dark. Subsequently, the protein concentration was determined by fluorometric analysis of tryptophane content as described [164]. Sample aliquots containing 50 μg of total proteins were then purified and digested with the S-Trap cartridges (Protifi, Fairport NY, USA) following the manufacturer’s instructions. Resulting peptides were dried under vacuum and stored at -20 °C until LC-MS analysis.
Peptides were re-suspended in 0.1% aqueous formic acid and 0.2 µg of peptides subjected to LC–MS/MS analysis using an Orbitrap Exploris 480 MassSpectrometer fitted with an Vanquish Neo (both Thermo Fisher Scientific) and a custom-made column heater set to 60 °C. Peptides were resolved using a RP-HPLC column (75 μm × 30 cm) packed in-house with C18 resin (ReproSil-Pur C18–AQ, 1.9 μm resin; Dr. Maisch GmbH) at a flow rate of 0.2 μl/min. Separation of peptides was achieved using the following gradient: Proteome analysis: 4% buffer B to 10% in 5 min, to 35% buffer B in 45 min, to 50% buffer in 10 min. Buffer A was 0.1% formic acid in water and buffer B was 80% acetonitrile, 0.1% formic acid in water. The mass spectrometer was operated in DIA acquisition mode with a total cycle time not exceeding approximately 3 s. For MS1, the following parameters were set: Resolution: 120,000 FWHM (at 200 m/z); Scan Range: 350-1400 m/z; Injection time: 25 ms; Normalized AGC Target: 300%. MS2 (SWATH) scans were acquired using the following parameters: Isolation Window: 10 m/z; HCD Collision Energy (normalized): 28%; Normalized AGC target: 1000%; Resolution: 15,000 FWHM (at 200 m/z); Precursor Mass Range: 400 – 900 m/z; Max. Fill Time: 22 ms, DataType: Centroid. In total 49 DIA (MS2) mass windows per MS cycle followed by the one MS1 scan.
Analysis of LC-MS-based proteomics data
The acquired raw files were first converted to indexed mzML format using ThermoRawFileParser [165] and then searched against a protein database containing sequences of the SwissProt Release 2024 [150,165] entries of Homo sapiens (in total 20’420 protein sequences) along with commonly observed contaminants using the workflow for data-independent acquisition (downloaded from https://github.com/Nesvilab/FragPipe/releases) of FragPipe [166] version 23.0.0. For non-canonical peptide identification, the peptide-spectrum, ion and peptide matches were filtered to 1% FDR level. IBAQ values are calculated as the intensity of a protein estimated by DIA-NN approach [167] divided by the number of theoretically observable tryptic peptides for that protein.
All mass spectrometry proteomics data associated with this manuscript have been deposited to the ProteomicsXchange consortium via MassIVE (https://massive.ucsd.edu) with the accession number MSV000099492. Details on the correspondence between sample ID (MassIVE) and biopsy name are in Table S1.
Reanalysis of data from the PRIDE database
The proteomics datasets with the following accessions numbers were obtained from PRIDE database: PXD023000, PXD049964, PXD005647, PXD016790, PXD010294, PXD002171, PXD035928, PXD043841, PXD035261, PXD032201, PXD010085, PXD034886, PXD025705, PXD036643, PXD023143. The datasets were generated from liver tissue or liver cell lines. The raw files from these accessions were first converted to indexed .mzml format using ThermoRawFileParser [165] and then re-analyzed using FragPipe [166] version 23.0.0.
Abbreviations
HCC: Hepatocellular carcinoma; ORF: open reading frame; CDS: coding region; ncORF: non-canonical ORF; lncRNA: long non-coding RNA; HBV: hepatitis B virus; HCV: hepatitis C virus; TCGA: the cancer genome atlas; SH: steatohepatitis; ASH: alcoholic SH; NASH: non-alcoholic SH; NT: non-tumor; T: tumor; RPF: ribosome-protected fragment; TO: translational output; TE: translation efficiency; TPM: transcripts per million; PCA: principal component analysis; TF: transcription factor; ISMARA: integrated motif activity response analysis; UTR: untranslated region; RT: readthrough.
Supplementary Material
Supplementary figures and tables.

Supplementary table 1.
Supplementary table 2.
Supplementary table 3.
Supplementary table 4.
Supplementary table 5.
Supplementary table 6.
Supplementary table 7.
Acknowledgements
During the preparation of this work, the authors used Gemini 3.1 Pro and CLAUDE.ai to assist with the coding and supporting literature search. The authors reviewed the provided information and took full responsibility for the content of the publication.
This work was supported in part by a grant from the Helmut Horten Foundation and by the Swiss National Science Foundation grant # 310030_204517 to M.Z. The results shown here are in part based upon data generated by the TCGA Research Network: https://www.cancer.gov/tcga.
Author contributions
M.Z. conceived the study. A.G. and M.P. performed ribosome profiling and proteomics experiments. M.A., A.M., N.S., and M.Z. analyzed all data. A.S. carried out mass spectrometry experiments. M.C-L. and S.P. provided biopsies. N.M. provided advice on ribosome profiling experiments. M.Z. wrote the manuscript with help from A.G., M.A., A.M., N.S., M.C-L, and S.P. Funding was obtained by M.Z. All authors have read and approved the manuscript.
Code availability
The custom scripts for analyzing the ribosome profiling, RNA-sequencing and proteomics data are deposited on Zenodo with DOI: 10.5281/zenodo.18339128.
Competing Interests
The authors have declared that no competing interest exists.
References
1. Bray F, Laversanne M, Sung H, Ferlay J, Siegel RL, Soerjomataram I. et al. Global cancer statistics 2022: GLOBOCAN estimates of incidence and mortality worldwide for 36 cancers in 185 countries. CA Cancer J Clin. 2024;74:229-63
2. Burke L, Hinkson A, Haghnejad V, Jones R, Parker R, Rowe IA. Hepatocellular carcinoma risk scores for non-viral liver disease: A systematic review and meta-analysis. JHEP Rep. 2025;7:101227
3. Miller KD, Nogueira L, Devasia T, Mariotto AB, Yabroff KR, Jemal A. et al. Cancer treatment and survivorship statistics, 2022. CA Cancer J Clin. 2022;72:409-36
4. Pinyol R, Torrecilla S, Wang H, Montironi C, Piqué-Gili M, Torres-Martin M. et al. Molecular characterisation of hepatocellular carcinoma in patients with non-alcoholic steatohepatitis. J Hepatol. 2021;75:865-78
5. Cancer Genome Atlas Research Network. Electronic address: wheeler@bcm.edu, Cancer Genome Atlas Research Network. Comprehensive and Integrative Genomic Characterization of Hepatocellular Carcinoma. Cell. 2017;169:1327-41.e23
6. Jiang Y, Sun A, Zhao Y, Ying W, Sun H, Yang X. et al. Proteomics identifies new therapeutic targets of early-stage hepatocellular carcinoma. Nature. 2019;567:257-61
7. Gao Q, Zhu H, Dong L, Shi W, Chen R, Song Z. et al. Integrated proteogenomic characterization of HBV-related hepatocellular carcinoma. Cell. 2019;179:561-77.e22
8. Zhang Q, Lou Y, Yang J, Wang J, Feng J, Zhao Y. et al. Integrated multiomic analysis reveals comprehensive tumour heterogeneity and novel immunophenotypic classification in hepatocellular carcinomas. Gut. 2019;68:2019-31
9. Ng CKY, Dazert E, Boldanova T, Coto-Llerena M, Nuciforo S, Ercan C. et al. Integrative proteogenomic characterization of hepatocellular carcinoma across etiologies and stages. Nat Commun. 2022;13:2436
10. Shahbazian FM, Jacobs M, Lajtha A. Rates of protein synthesis in brain and other organs. Int J Dev Neurosci. 1987;5:39-42
11. Scagliola A, Miluzio A, Biffo S. Translational control of metabolism and cell cycle progression in hepatocellular carcinoma. Int J Mol Sci. 2023;24(5):4885
12. Gerashchenko MV, Peterfi Z, Yim SH, Gladyshev VN. Translation elongation rate varies among organs and decreases with age. Nucleic Acids Res. 2021;49:e9
13. Brina D, Miluzio A, Ricciardi S, Clarke K, Davidsen PK, Viero G. et al. eIF6 coordinates insulin sensitivity and lipid metabolism by coupling translation to transcription. Nat Commun. 2015;6:8261
14. Scagliola A, Miluzio A, Ventura G, Oliveto S, Cordiglieri C, Manfrini N. et al. Targeting of eIF6-driven translation induces a metabolic rewiring that reduces NAFLD and the consequent evolution to hepatocellular carcinoma. Nat Commun. 2021;12:4878
15. Faller WJ, Jackson TJ, Knight JR, Ridgway RA, Jamieson T, Karim SA. et al. mTORC1-mediated translational elongation limits intestinal tumour initiation and growth. Nature. 2015;517:497-500
16. Bracic Tomazic S, Schatz C, Haybaeck J. Translational Regulation in Hepatocellular Carcinogenesis. Drug Des Devel Ther. 2021;15:4359-69
17. Golob-Schwarzl N, Krassnig S, Toeglhofer AM, Park YN, Gogg-Kamerer M, Vierlinger K. et al. New liver cancer biomarkers: PI3K/AKT/mTOR pathway members and eukaryotic translation initiation factors. Eur J Cancer. 2017;83:56-70
18. Tang X, Li K, Wang Y, Rocchi S, Shen S, Cerezo M. Metabolism and mRNA translation: a nexus of cancer plasticity. Trends Cell Biol. 2025;35:562-75
19. Jiang X-M, Yu X-N, Huang R-Z, Zhu H-R, Chen X-P, Xiong J. et al. Prognostic significance of eukaryotic initiation factor 4E in hepatocellular carcinoma. J Cancer Res Clin Oncol. 2016;142:2309-17
20. Villanueva A, Chiang DY, Newell P, Peix J, Thung S, Alsinet C. et al. Pivotal role of mTOR signaling in hepatocellular carcinoma. Gastroenterology. 2008;135:1972-83 1983.e1-11
21. Lu X, Paliogiannis P, Calvisi DF, Chen X. Role of the mammalian target of rapamycin pathway in liver cancer: From molecular genetics to targeted therapies. Hepatology. 2021;73(Suppl 1):49-61
22. Kovalski JR, Kuzuoglu-Ozturk D, Ruggero D. Protein synthesis control in cancer: selectivity and therapeutic targeting. EMBO J. 2022;41:e109823
23. Lebeaupin C, Vallée D, Hazari Y, Hetz C, Chevet E, Bailly-Maitre B. Endoplasmic reticulum stress signalling and the pathogenesis of non-alcoholic fatty liver disease. J Hepatol. 2018;69:927-47
24. Ingolia NT, Ghaemmaghami S, Newman JRS, Weissman JS. Genome-wide analysis in vivo of translation with nucleotide resolution using ribosome profiling. Science. 2009;324:218-23
25. Michel AM, Kiniry SJ, O’Connor PBF, Mullan JP, Baranov PV. GWIPS-viz: 2018 update. Nucleic Acids Res. 2018;46:D823-30
26. Chothani SP, Adami E, Widjaja AA, Langley SR, Viswanathan S, Pua CJ. et al. A high-resolution map of human RNA translation. Mol Cell. 2022;82:2885-99.e8
27. Prensner JR, Enache OM, Luria V, Krug K, Clauser KR, Dempster JM. et al. Noncanonical open reading frames encode functional proteins essential for cancer cell survival. Nat Biotechnol. 2021;39:697-704
28. Zheng C, Wei Y, Zhang P, Lin K, He D, Teng H. et al. CRISPR-Cas9-based functional interrogation of unconventional translatome reveals human cancer dependency on cryptic non-canonical open reading frames. Nat Struct Mol Biol. 2023;30:1878-92
29. Zhu L, Liu F, Shi C, Su X, Tan M, Xie S. et al. Hepatic micropeptide modulates mitochondrial RNA processing machinery in hepatocellular carcinoma. Mol Cell. 2025;85:2303-19.e7
30. Weller C, Bartok O, McGinnis CS, Palashati H, Chang T-G, Malko D. et al. Translation dysregulation in cancer as a source for targetable antigens. Cancer Cell. 2025;43:823-40.e18
31. Camarena ME, Theunissen P, Ruiz M, Ruiz-Orera J, Calvo-Serra B, Castelo R. et al. Microproteins encoded by noncanonical ORFs are a major source of tumor-specific antigens in a liver cancer patient meta-cohort. Sci Adv. 2024;10:eadn3628
32. Mudge JM, Ruiz-Orera J, Prensner JR, Brunet MA, Calvet F, Jungreis I. et al. Standardized annotation of translated open reading frames. Nat Biotechnol. 2022;40:994-9
33. McMahon M, Contreras A, Holm M, Uechi T, Forester CM, Pang X. et al. A single H/ACA small nucleolar RNA mediates tumor suppression downstream of oncogenic RAS. Elife. 2019 8
34. Dhamija S, Yang CM, Seiler J, Myacheva K, Caudron-Herger M, Wieland A. et al. A pan-cancer analysis reveals nonstop extension mutations causing SMAD4 tumour suppressor degradation. Nat Cell Biol. 2020;22:999-1010
35. Ghosh A, Riester M, Pal J, Lainde K-A, Tangermann C, Wanninger A. et al. Suppressive cancer nonstop extension mutations increase C-terminal hydrophobicity and disrupt evolutionarily conserved amino acid patterns. Nature Communications. 2024;15:1-16
36. Zou Q, Xiao Z, Huang R, Wang X, Wang X, Zhao H. et al. Survey of the translation shifts in hepatocellular carcinoma with ribosome profiling. Theranostics. 2019;9:4141-55
37. Rinella ME, Lazarus JV, Ratziu V, Francque SM, Sanyal AJ, Kanwal F. et al. A multisociety Delphi consensus statement on new fatty liver disease nomenclature. J Hepatol. 2023;79:1542-56
38. Mittal N, Ataman M, Tintignac L, Ham DJ, Jörin L, Schmidt A. et al. Calorie restriction and rapamycin distinctly restore non-canonical ORF translation in the muscles of aging mice. NPJ Regen Med. 2024;9:23
39. Banerjee A, Ataman M, Smialek MJ, Mookherjee D, Rabl J, Mironov A. et al. Ribosomal protein RPL39L is an efficiency factor in the cotranslational folding of a subset of proteins with alpha helical domains. Nucleic Acids Res. 2024;52:9028-48
40. Tomuro K, Mito M, Toh H, Kawamoto N, Miyake T, Chow SYA. et al. Calibrated ribosome profiling assesses the dynamics of ribosomal flux on transcripts. Nat Commun. 2024;15:7061
41. Love MI, Huber W, Anders S. Moderated estimation of fold change and dispersion for RNA-seq data with DESeq2. Genome Biol. 2014;15:550
42. Subramanian A, Tamayo P, Mootha VK, Mukherjee S, Ebert BL, Gillette MA. et al. Gene set enrichment analysis: a knowledge-based approach for interpreting genome-wide expression profiles. Proc Natl Acad Sci U S A. 2005;102:15545-50
43. Wang L, Nie J, Sicotte H, Li Y, Eckel-Passow JE, Dasari S. et al. Measure transcript integrity using RNA-seq data. BMC Bioinformatics. 2016;17:58
44. Chen W, Sun Y, Chen S, Ge X, Zhang W, Zhang N. et al. Matrisome gene-based subclassification of patients with liver fibrosis identifies clinical and molecular heterogeneities. Hepatology. 2023;78:1118-32
45. Charlotte F, Le Naour G, Bernhardt C, Poynard T, Ratziu V, LIDO Study Group. A comparison of the fibrotic potential of nonalcoholic fatty liver disease and chronic hepatitis C. Hum Pathol. 2010;41:1178-85
46. Govaere O, Cockell S, Tiniakos D, Queen R, Younes R, Vacca M. et al. Transcriptomic profiling across the nonalcoholic fatty liver disease spectrum reveals gene signatures for steatohepatitis and fibrosis. Sci Transl Med. 2020;12:eaba4448
47. Mossmann D, Müller C, Park S, Ryback B, Colombi M, Ritter N. et al. Arginine reprograms metabolism in liver cancer via RBM39. Cell. 2023;186:5068-83.e23
48. Zhu L, Yang X, Feng J, Mao J, Zhang Q, He M. et al. CYP2E1 plays a suppressive role in hepatocellular carcinoma by regulating Wnt/Dvl2/β-catenin signaling. J Transl Med. 2022;20:194
49. Zhang H, Fu L. The role of ALDH2 in tumorigenesis and tumor progression: Targeting ALDH2 as a potential cancer treatment. Acta Pharm Sin B. 2021;11:1400-11
50. Pachkov M, Balwierz PJ, Arnol, Gruber AJ, Zavolan M, van Nimwegen E. ISMARA: Completely automated inference of gene regulatory networks from high-throughput data. PeerJ Preprints. 2017;5:e3328v1
51. Malz M, Pinna F, Schirmacher P, Breuhahn K. Transcriptional regulators in hepatocarcinogenesis-key integrators of malignant transformation. J Hepatol. 2012;57:186-95
52. Chao H-M, Huang H-X, Chang P-H, Tseng K-C, Miyajima A, Chern E. Y-box binding protein-1 promotes hepatocellular carcinoma-initiating cell progression and tumorigenesis via Wnt/β-catenin pathway. Oncotarget. 2017;8:2604-16
53. Bakiri L, Hamacher R, Graña O, Guío-Carrión A, Campos-Olivas R, Martinez L. et al. Liver carcinogenesis by FOS-dependent inflammation and cholesterol dysregulation. J Exp Med. 2017;214:1387-409
54. Milacic M, Beavers D, Conley P, Gong C, Gillespie M, Griss J. et al. The reactome pathway knowledgebase 2024. Nucleic Acids Res. 2024;52:D672-8
55. Huang R, Zhu G, Fu X, Liu W, Tao C, Gao J. et al. Comprehensive analysis of complement-associated molecular features in hepatocellular carcinoma. Acta Biochim Biophys Sin (Shanghai). 2022;54:1694-707
56. Zhang Z, Zhao Q, Wang Z, Xu F, Liu Y, Guo Y. et al. Hepatocellular carcinoma cells downregulate NADH:Ubiquinone Oxidoreductase Subunit B3 to maintain reactive oxygen species homeostasis. Hepatol Commun. 2024;8:e0395
57. Yuan P, Mu J, Wang Z, Ma S, Da X, Song J. et al. Down-regulation of SLC25A20 promotes hepatocellular carcinoma growth and metastasis through suppression of fatty-acid oxidation. Cell Death Dis. 2021;12:361
58. Chothani S, Adami E, Ouyang JF, Viswanathan S, Hubner N, Cook SA. et al. deltaTE: Detection of Translationally Regulated Genes by Integrative Analysis of Ribo-seq and RNA-seq Data. Curr Protoc Mol Biol. 2019;129:e108
59. Seyhan D, Allaire M, Fu Y, Conti F, Wang XW, Gao B. et al. Immune microenvironment in hepatocellular carcinoma: from pathogenesis to immunotherapy. Cell Mol Immunol. 2025;22:1132-58
60. Llovet JM, Willoughby CE, Singal AG, Greten TF, Heikenwälder M, El-Serag HB. et al. Nonalcoholic steatohepatitis-related hepatocellular carcinoma: pathogenesis and treatment. Nat Rev Gastroenterol Hepatol. 2023;20:487-503
61. Zhu AX, Abbas AR, de Galarreta MR, Guan Y, Lu S, Koeppen H. et al. Molecular correlates of clinical response and resistance to atezolizumab in combination with bevacizumab in advanced hepatocellular carcinoma. Nat Med. 2022;28:1599-611
62. Pfister D, Núñez NG, Pinyol R, Govaere O, Pinter M, Szydlowska M. et al. NASH limits anti-tumour surveillance in immunotherapy-treated HCC. Nature. 2021;592:450-6
63. Ma C, Kesarwala AH, Eggert T, Medina-Echeverz J, Kleiner DE, Jin P. et al. NAFLD causes selective CD4(+) T lymphocyte loss and promotes hepatocarcinogenesis. Nature. 2016;531:253-7
64. Brown ZJ, Fu Q, Ma C, Kruhlak M, Zhang H, Luo J. et al. Carnitine palmitoyltransferase gene upregulation by linoleic acid induces CD4+ T cell apoptosis promoting HCC development. Cell Death Dis. 2018;9:620
65. Heinrich B, Brown ZJ, Diggs LP, Vormehr M, Ma C, Subramanyam V. et al. Steatohepatitis impairs T-cell-directed immunotherapies against liver tumors in mice. Gastroenterology. 2021;160:331-45.e6
66. Tumeh PC, Harview CL, Yearley JH, Shintaku IP, Taylor EJM, Robert L. et al. PD-1 blockade induces responses by inhibiting adaptive immune resistance. Nature. 2014;515:568-71
67. Young SK, Wek RC. Upstream open reading frames differentially regulate gene-specific translation in the integrated stress response. J Biol Chem. 2016;291:16927-35
68. Johnstone TG, Bazzini AA, Giraldez AJ. Upstream ORFs are prevalent translational repressors in vertebrates. EMBO J. 2016;35:706-23
69. Renz PF, Valdivia-Francia F, Sendoel A. Some like it translated: small ORFs in the 5’UTR. Exp Cell Res. 2020;396:112229
70. Mueller PP, Hinnebusch AG. Multiple upstream AUG codons mediate translational control of GCN4. Cell. 1986;45:201-7
71. Vattem KM, Wek RC. Reinitiation involving upstream ORFs regulates ATF4 mRNA translation in mammalian cells. Proc Natl Acad Sci U S A. 2004;101:11269-74
72. Starck SR, Tsai JC, Chen K, Shodiya M, Wang L, Yahiro K. et al. Translation from the 5’ untranslated region shapes the integrated stress response. Science. 2016;351:aad3867
73. He F, Zhang P, Liu J, Wang R, Kaufman RJ, Yaden BC. et al. ATF4 suppresses hepatocarcinogenesis by inducing SLC7A11 (xCT) to block stress-related ferroptosis. J Hepatol. 2023;79:362-77
74. Gao R, Kalathur RKR, Coto-Llerena M, Ercan C, Buechel D, Shuang S. et al. YAP/TAZ and ATF4 drive resistance to Sorafenib in hepatocellular carcinoma by preventing ferroptosis. EMBO Mol Med. 2021;13:e14351
75. Zeng H, Yu J, Wang H, Shen M, Zou X, Zhang Z. et al. Cancer ATF4-mediated CD58 endocytosis impairs anti-tumor immunity and immunotherapy. J Transl Med. 2025;23:225
76. Moro SG, Hermans C, Ruiz-Orera J, Albà MM. Impact of uORFs in mediating regulation of translation in stress conditions. BMC Mol Cell Biol. 2021;22:29
77. Pearson K. Mathematical contributions to the theory of evolution.-On a form of spurious correlation which may arise when indices are used in the measurement of organs. Proc R Soc Lond. 1897;60:489-98
78. Taniuchi S, Miyake M, Tsugawa K, Oyadomari M, Oyadomari S. Integrated stress response of vertebrates is regulated by four eIF2α kinases. Sci Rep. 2016;6:32886
79. Bohlen J, Harbrecht L, Blanco S, Clemm von Hohenberg K, Fenzl K, Kramer G. et al. DENR promotes translation reinitiation via ribosome recycling to drive expression of oncogenes including ATF4. Nat Commun. 2020;11:4676
80. Moon Y, Herrmann CJ, Mironov A, Zavolan M. PolyASite v3.0: a multi-species atlas of polyadenylation sites inferred from single-cell RNA-sequencing data. Nucleic Acids Res. 2025;53:D197-204
81. Casper J, Speir ML, Raney BJ, Perez G, Nassar LR, Lee CM. et al. The UCSC Genome Browser database: 2026 update. Nucleic Acids Res. 2026;54:D1331-5
82. Pollard KS, Hubisz MJ, Rosenbloom KR, Siepel A. Detection of nonneutral substitution rates on mammalian phylogenies. Genome Res. 2010;20:110-21
83. Lin MF, Jungreis I, Kellis M. PhyloCSF: a comparative genomics method to distinguish protein coding and non-coding regions. Bioinformatics. 2011;27:i275-82
84. Kodzius R, Kojima M, Nishiyori H, Nakamura M, Fukuda S, Tagami M. et al. CAGE: cap analysis of gene expression. Nat Methods. 2006;3:211-22
85. González A, Pandey M, Schlusser N, Rahaman S, Ataman M, Mittal N. et al. Multi-omic assessment of mRNA translation dynamics in liver cancer cell lines. Sci Data. 2025;12:1-11
86. Chothani S, Ruiz-Orera J, Tierney JAS, Swirski MI, Tjeldnes H, Kok LW. et al. An expanded reference catalog of translated open reading frames for biomedical research. Nucleic Acids Res. 2026;54(6):gkag234
87. Perez-Riverol Y, Csordas A, Bai J, Bernal-Llinares M, Hewapathirana S, Kundu DJ. et al. The PRIDE database and related tools and resources in 2019: improving support for quantification data. Nucleic Acids Res. 2019;47:D442-50
88. Calvo SE, Pagliarini DJ, Mootha VK. Upstream open reading frames cause widespread reduction of protein expression and are polymorphic among humans. Proc Natl Acad Sci U S A. 2009;106:7507-12
89. Chew G-L, Pauli A, Schier AF. Conservation of uORF repressiveness and sequence features in mouse, human and zebrafish. Nat Commun. 2016;7:11663
90. Harding HP, Zhang Y, Zeng H, Novoa I, Lu PD, Calfon M. et al. An integrated stress response regulates amino acid metabolism and resistance to oxidative stress. Mol Cell. 2003;11:619-33
91. Hirao K, Natsuka Y, Tamura T, Wada I, Morito D, Natsuka S. et al. EDEM3, a soluble EDEM homolog, enhances glycoprotein endoplasmic reticulum-associated degradation and mannose trimming. J Biol Chem. 2006;281:9650-8
92. Hurtaud C, Gelly C, Bouillaud F, Lévi-Meyrueis C. Translation control of UCP2 synthesis by the upstream open reading frame. Cell Mol Life Sci. 2006;63:1780-9
93. Reid DW, Nicchitta CV. Diversity and selectivity in mRNA translation on the endoplasmic reticulum. Nat Rev Mol Cell Biol. 2015;16:221-31
94. Ingolia NT. Ribosome profiling: new views of translation, from single codons to genome scale. Nat Rev Genet. 2014;15:205-13
95. Ge SX, Jung D, Yao R. ShinyGO: a graphical gene-set enrichment tool for animals and plants. Bioinformatics. 2020;36:2628-9
96. Manjunath LE, Singh A, Sahoo S, Mishra A, Padmarajan J, Basavaraju CG. et al. Stop codon read-through of mammalian MTCH2 leading to an unstable isoform regulates mitochondrial membrane potential. J Biol Chem. 2020;295:17009-26
97. Schueren F, Lingner T, George R, Hofhuis J, Dickel C, Gärtner J. et al. Peroxisomal lactate dehydrogenase is generated by translational readthrough in mammals. Elife. 2014;3:e03640
98. Liang W, Zhao Y, Meng Q, Jiang W, Deng S, Xue J. The role of long non-coding RNA in hepatocellular carcinoma. Aging (Albany NY). 2024;16:4052-73
99. Patraquim P, Magny EG, Pueyo JI, Platero AI, Couso JP. Translation and natural selection of micropeptides from long non-canonical RNAs. Nat Commun. 2022;13:6515
100. Lv D, Chang Z, Cai Y, Li J, Wang L, Jiang Q. et al. TransLnc: a comprehensive resource for translatable lncRNAs extends immunopeptidome. Nucleic Acids Res. 2022;50:D413-20
101. Zhao L, Wang J, Li Y, Song T, Wu Y, Fang S. et al. NONCODEV6: an updated database dedicated to long non-coding RNA annotation in both animals and plants. Nucleic Acids Res. 2021;49:D165-71
102. Li T, Xie J, Shen C, Cheng D, Shi Y, Wu Z. et al. Amplification of long noncoding RNA ZFAS1 promotes metastasis in hepatocellular carcinoma. Cancer Res. 2015;75:3181-91
103. Wu C, Lu X, Lu S, Wang H, Li D, Zhao J. et al. Efficient detection of the alternative spliced human proteome using translatome sequencing. Front Mol Biosci. 2022;9:895746
104. Wang M, Weng S, Li C, Jiang Y, Qian X, Xu P. et al. Proteomic overview of hepatocellular carcinoma cell lines and generation of the spectral library. Sci Data. 2022;9:732
105. Cancer Genome Atlas Research Network, Weinstein JN, Collisson EA, Mills GB, Shaw KRM, Ozenberger BA. et al. The Cancer Genome Atlas Pan-Cancer analysis project. Nat Genet. 2013;45:1113-20
106. Rao S, Le AY, Persyn L, Cenik C. Translational buffering tunes gene expression in mice and humans. Genome Biol. 2026;27(1):113
107. Kusnadi EP, Timpone C, Topisirovic I, Larsson O, Furic L. Regulation of gene expression via translational buffering. Biochim Biophys Acta Mol Cell Res. 2022;1869:119140
108. Teyssonniere EM, Shichino Y, Mito M, Friedrich A, Iwasaki S, Schacherer J. Translation variation across genetic backgrounds reveals a post-transcriptional buffering signature in yeast. Nucleic Acids Res. 2024;52:2434-45
109. Sun Y, Duan Y, Gao P, Liu C, Jin K, Dou S. et al. Upstream open reading frames buffer translational variability during Drosophila evolution and development. Elife. 2025;14:RP104074
110. Li M, Wang L, Cong L, Wong CC, Zhang X, Chen H. et al. Spatial proteomics of immune microenvironment in nonalcoholic steatohepatitis-associated hepatocellular carcinoma. Hepatology. 2024;79:560-74
111. Sonenberg N, Hinnebusch AG. Regulation of translation initiation in eukaryotes: mechanisms and biological targets. Cell. 2009;136:731-45
112. Hinnebusch AG, Ivanov IP, Sonenberg N. Translational control by 5’-untranslated regions of eukaryotic mRNAs. Science. 2016;352:1413-6
113. Pakos-Zebrucka K, Koryga I, Mnich K, Ljujic M, Samali A, Gorman AM. The integrated stress response. EMBO Rep. 2016;17:1374-95
114. Sample PJ, Wang B, Reid DW, Presnyak V, McFadyen IJ, Morris DR. et al. Human 5′ UTR design and variant effect prediction from a massively parallel translation assay. Nat Biotechnol. 2019;37:803-9
115. Schlusser N, González A, Pandey M, Zavolan M. Current limitations in predicting mRNA translation with deep learning models. Genome Biol. 2024;25:227
116. Whiffin N, Karczewski KJ, Zhang X, Chothani S, Smith MJ, Evans DG. et al. Characterising the loss-of-function impact of 5’ untranslated region variants in 15,708 individuals. Nat Commun. 2020;11:2523
117. Lee DSM, Park J, Kromer A, Baras A, Rader DJ, Ritchie MD. et al. Disrupting upstream translation in mRNAs is associated with human disease. Nat Commun. 2021;12:1515
118. Luo J, Khandwala S, Hu J, Lee S-Y, Hickey KL, Levine ZG. et al. Proximity-specific ribosome profiling reveals the logic of localized mitochondrial translation. Cell. 2025;188:5589-604.e17
119. Dever TE, Ivanov IP, Hinnebusch AG. Translational regulation by uORFs and start codon selection stringency. Genes Dev. 2023;37:474-89
120. Wang Y, Xie Z, Kutschera E, Adams JI, Kadash-Edmondson KE, Xing Y. rMATS-turbo: an efficient and flexible computational tool for alternative splicing analysis of large-scale RNA-seq data. Nat Protoc. 2024;19:1083-104
121. Heck AM, Wilusz J. The interplay between the RNA decay and translation machinery in eukaryotes. Cold Spring Harb Perspect Biol. 2018;10:a032839
122. Yepiskoposyan H, Aeschimann F, Nilsson D, Okoniewski M, Mühlemann O. Autoregulation of the nonsense-mediated mRNA decay pathway in human cells. RNA. 2011;17:2108-18
123. Barbosa C, Peixeiro I, Romão L. Gene expression regulation by upstream open reading frames and human disease. PLoS Genet. 2013;9:e1003529
124. Manjunath LE, Singh A, Som S, Eswarappa SM. Mammalian proteome expansion by stop codon readthrough. Wiley Interdiscip Rev RNA. 2023;14:e1739
125. Suresh AN, Atkins JF, Loughran G. The dual luciferase assay does not support claims of stop codon readthrough on the AGO1 mRNA. EMBO J. 2025;44:3917-9
126. Li S, Dong Y, Liu J, Li SS, Pu D, Guo Y. et al. Discovery and validation of non-canonical antigens for Hepatocellular Carcinoma immunotherapy. Genomics, Proteomics & Bioinformatics. 2026 qzag082
127. Lonardo A, Nascimbeni F, Ballestri S, Fairweather D, Win S, Than TA. et al. Sex differences in nonalcoholic fatty liver disease: State of the art and identification of research gaps. Hepatology. 2019;70:1457-69
128. Naugler WE, Sakurai T, Kim S, Maeda S, Kim K, Elsharkawy AM. et al. Gender disparity in liver cancer due to sex differences in MyD88-dependent IL-6 production. Science. 2007;317:121-4
129. Świrski MI, Tierney JAS, Albà MM, Andreev DE, Aspden JL, Atkins JF. et al. Translon: a single term for translated regions. Nat Methods. 2025;22:2002-6
130. Hoffmann S, Otto C, Kurtz S, Sharma CM, Khaitovich P, Vogel J. et al. Fast mapping of short sequences with mismatches, insertions and deletions using index structures. PLoS Comput Biol. 2009;5:e1000502
131. Calvisi DF, Wang C, Ho C, Ladu S, Lee SA, Mattu S. et al. Increased lipogenesis, induced by AKT-mTORC1-RPS6 signaling, promotes development of human hepatocellular carcinoma. Gastroenterology. 2011;140:1071-83
132. Ma L-N, Ma Y, Luo X, Ma Z-M, Ma L-N, Ding X-C. AKR1B10 expression characteristics in hepatocellular carcinoma and its correlation with clinicopathological features and immune microenvironment. Sci Rep. 2024;14:12149
133. Herranz D, Muñoz-Martin M, Cañamero M, Mulero F, Martinez-Pastor B, Fernandez-Capetillo O. et al. Sirt1 improves healthy ageing and protects from metabolic syndrome-associated cancer. Nat Commun. 2010;1:3
134. Li C, Wang J, Zhang H, Zhu M, Chen F, Hu Y. et al. Interferon-stimulated gene 15 (ISG15) is a trigger for tumorigenesis and metastasis of hepatocellular carcinoma. Oncotarget. 2014;5:8429-41
135. Liao X, Liu X, Yang C, Wang X, Yu T, Han C. et al. Distinct diagnostic and prognostic values of minichromosome maintenance gene expression in patients with hepatocellular carcinoma. J Cancer. 2018;9:2357-73
136. Li J, Yong T, Chen Y, Zeng T, Zhang K, Wang S. et al. Targeting PCNA/PARP1 axis inhibits the malignant progression of hepatocellular carcinoma. Front Pharmacol. 2025;16:1571786
137. Feng J, Li J, Wu L, Yu Q, Ji J, Wu J. et al. Emerging roles and the regulation of aerobic glycolysis in hepatocellular carcinoma. J Exp Clin Cancer Res. 2020;39:126
138. Ma H-P, Chang H-L, Bamodu OA, Yadav VK, Huang T-Y, Wu ATH. et al. Collagen 1A1 (COL1A1) is a reliable biomarker and putative therapeutic target for hepatocellular carcinogenesis and metastasis. Cancers (Basel). 2019;11:E786
139. Liu J, Chen S, Wang W, Ning B-F, Chen F, Shen W. et al. Cancer-associated fibroblasts promote hepatocellular carcinoma metastasis through chemokine-activated hedgehog and TGF-β pathways. Cancer Lett. 2016;379:49-59
140. Xu C, Xu Z, Zhang Y, Evert M, Calvisi DF, Chen X. β-Catenin signaling in hepatocellular carcinoma. J Clin Invest. 2022;132:e154515
141. Ramos-Santillan V, Oshi M, Nelson E, Endo I, Takabe K. High Ki67 gene expression is associated with aggressive phenotype in hepatocellular carcinoma. World J Oncol. 2024;15:257-67
142. Cai H, Shao B, Zhou Y, Chen Z. High expression of TOP2A in hepatocellular carcinoma is associated with disease progression and poor prognosis. Oncol Lett. 2020;20:232
143. Zou Y, Ruan S, Jin L, Chen Z, Han H, Zhang Y. et al. CDK1, CCNB1, and CCNB2 are prognostic biomarkers and correlated with immune infiltration in hepatocellular carcinoma. Med Sci Monit. 2020;26:e925289
144. Ayoub AM, Mahmoud EA-B, Mohamed RH, Tolba MM, Hassan NS, Ghazy M. et al. BIRC5 as a master regulator in HCC: unraveling its role in tumor survival and therapeutic potential. Funct Integr Genomics. 2025;25:120
145. Montal R, Andreu-Oller C, Bassaganyas L, Esteban-Fabró R, Moran S, Montironi C. et al. Molecular portrait of high alpha-fetoprotein in hepatocellular carcinoma: implications for biomarker-driven clinical trials. Br J Cancer. 2019;121:340-3
146. Li W, Liu K, Chen Y, Zhu M, Li M. Role of alpha-fetoprotein in hepatocellular carcinoma drug resistance. Curr Med Chem. 2021;28:1126-42
147. Govaere O, Komuta M, Berkers J, Spee B, Janssen C, de Luca F. et al. Keratin 19: a key role player in the invasion of human hepatocellular carcinomas. Gut. 2014;63:674-85
148. Yamashita T, Forgues M, Wang W, Kim JW, Ye Q, Jia H. et al. EpCAM and alpha-fetoprotein expression defines novel prognostic subtypes of hepatocellular carcinoma. Cancer Res. 2008;68:1451-61
149. Capurro M, Wanless IR, Sherman M, Deboer G, Shi W, Miyoshi E. et al. Glypican-3: a novel serum and histochemical marker for hepatocellular carcinoma. Gastroenterology. 2003;125:89-97
150. The UniProt Consortium, Bateman A, Martin M-J, Orchard S, Magrane M, Adesina A. et al. UniProt: the Universal Protein Knowledgebase in 2025. Nucleic Acids Res. 2024;53:D609-17
151. Ritchie ME, Phipson B, Wu D, Hu Y, Law CW, Shi W. et al. limma powers differential expression analyses for RNA-sequencing and microarray studies. Nucleic Acids Res. 2015;43:e47
152. Xu S, Hu E, Cai Y, Xie Z, Luo X, Zhan L. et al. Using clusterProfiler to characterize multiomics data. Nat Protoc. 2024;19:3292-320
153. Gu Z, Eils R, Schlesner M. Complex heatmaps reveal patterns and correlations in multidimensional genomic data. Bioinformatics. 2016;32:2847-9
154. Gu Z, Gu L, Eils R, Schlesner M, Brors B. circlize Implements and enhances circular visualization in R. Bioinformatics. 2014;30:2811-2
155. Korotkevich G, Sukhov V, Budin N, Shpak B, Artyomov MN, Sergushichev A. Fast gene set enrichment analysis. bioRxiv. 2016 bioRxiv 060012
156. Mudge JM, Carbonell-Sala S, Diekhans M, Martinez JG, Hunt T, Jungreis I. et al. GENCODE 2025: reference gene annotation for human and mouse. Nucleic Acids Res. 2025;53:D966-75
157. Liao Y, Smyth GK, Shi W. featureCounts: an efficient general purpose program for assigning sequence reads to genomic features. Bioinformatics. 2014;30:923-30
158. Balwierz PJ, Pachkov M, Arnold P, Gruber AJ, Zavolan M, van Nimwegen E. ISMARA: automated modeling of genomic signals as a democracy of regulatory motifs. Genome Res. 2014;24:869-84
159. Li H, Handsaker B, Wysoker A, Fennell T, Ruan J, Homer N. et al. The Sequence Alignment/Map format and SAMtools. Bioinformatics. 2009;25:2078-9
160. Shen W, Le S, Li Y, Hu F. SeqKit: A cross-platform and ultrafast toolkit for FASTA/Q file manipulation. PLoS One. 2016;11:e0163962
161. zavolab_pyutils. Github. 2026; https://github.com/zavolanlab/zavolab_pyutils.
162. Pagani G, Casirati C, Pandini C, Fornezza S, Priami C, Fois G. et al. Mapping the NFYA 3′UTR landscape identifies alternative polyadenylation as a targetable vulnerability in prostate cancer. J Exp Clin Cancer Res. 2026 Available at: http://dx.doi.org/10.1186/s13046-026-03807-2
163. Quinlan AR, Hall IM. BEDTools: a flexible suite of utilities for comparing genomic features. Bioinformatics. 2010;26:841-2
164. Wiśniewski JR, Gaugaz FZ. Fast and sensitive total protein and Peptide assays for proteomic analysis. Anal Chem. 2015;87:4110-6
165. Hulstaert N, Shofstahl J, Sachsenberg T, Walzer M, Barsnes H, Martens L. et al. ThermoRawFileParser: Modular, scalable, and cross-platform RAW file conversion. J Proteome Res. 2020;19:537-42
166. Yu F, Teo GC, Kong AT, Fröhlich K, Li GX, Demichev V. et al. Analysis of DIA proteomics data using MSFragger-DIA and FragPipe computational platform. Nature Communications. 2023;14:1-14
167. Demichev V, Messner CB, Vernardis SI, Lilley KS, Ralser M. DIA-NN: neural networks and interference correction enable deep proteome coverage in high throughput. Nat Methods. 2020;17:41-4
Author contact
Corresponding authors: mihaela.zavolanch, +41 612071577; asier.gonzalezcat, +34 935811231.