Impact Factor




Theranostics 2027; 17(1):232-247. doi:10.7150/thno.135848 This issue Cite
Research Paper
Mechanistic insights into iRGD and α-melittin modified resveratrol liposomes for melanoma: a spatial lipidomics approach
Qi Zhang1,#, Xue-heng Sun1,#, Liyan Huang1, Lin Guo1, Peiyun Liu1, Rui Zheng1, Qianqian Zhan1, Xiaoqing Tan1, Ye Yao1, Chunyan Li3,  , Kai Xiong2, , Wenqiang Cao1, , Zhan-You Wang1,
1. Key Laboratory of Major Chronic Diseases of Nervous System of Liaoning Province, Health Sciences Institute of China Medical University, Shenyang 110122, China.
2. Department of Statistics, Inner Mongolia Forestry General Hospital (The Second Clinical Medical School of Inner Mongolia, University for the Nationalities), Yakeshi, 022150, China.
3. Science Experiment Center of China Medical University, Shenyang 110122, China.
#These authors contributed equally to this work.
Received 2026-4-8; Accepted 2026-9-15; Published 2027-1-1
Abstract
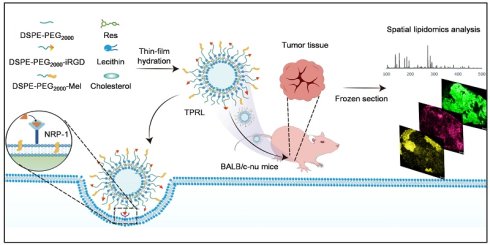
Rationale: Metabolic reprogramming, particularly dysregulated lipid metabolism, is a fundamental driver of melanoma progression; however, metabolic modulation evidence in-situ in treatment remains elusive. We engineered a nanodelivery platform, Targeting-Permeabilizing-Resveratrol-Liposomes (TPRL), to achieve metabolic intervention. The system innovatively integrates the tumor-homing peptide iRGD with the amphiphilic membrane-active peptide α-melittin (Mel), creating a "synergistic targeting" strategy that overcomes the barriers of tumor microenvironment and ensures high-efficiency delivery of Resveratrol (Res).
Methods: TPRL was synthesized via thin-film hydration and characterized by transmission electron microscopy (TEM) and dynamic light scattering. CCK8 assays, EdU staining, calcein-AM/PI staining, flow cytometry, wound healing assays, and transwell assays were conducted to evaluate the anti-melanoma effects on cell proliferation, cell cycle progression, apoptosis, migration, and invasion. TPRL was analyzed by molecular docking, cellular thermal shift assays (CETSA) and immunoblotting to study its anti-melanoma mechanisms. The A375-bearing mice were used to evaluate the anti-melanoma effects of TPRL. We applied Matrix-Assisted Laser Desorption/Ionization-Mass Spectrometry Imaging (MALDI-MSI) to establish an integrated process to analyze "drug delivery-metabolic regulation-spatial distribution". This process realized the visualized Res accumulation and its spatial regulation of the tumor lipidome.
Results: TPRL effectively suppressed proliferation, migration, and invasion in A375 cells by inducing S-phase arrest and apoptosis. TPRL disrupted the JAK/STAT and PI3K/AKT pathways. This dual inhibition downregulated lipid synthesis and fatty acid uptake, thereby correcting the lipid metabolic dysregulation that supports melanoma survival and progression. We demonstrated TPRL significantly downregulated lipogenic enzymes and disrupted the spatial heterogeneity of 366 lipid metabolites, particularly glycerophospholipids, which was closely correlated with ATP depletion and mitochondrial dysfunction.
Conclusions: We developed TPRL and integrated it with spatial metabolomic analysis to provide a sophisticated approach to melanoma treatment. By demonstrating Mel and iRGD co-modified liposomes enhance tumor accumulation and trigger a cascade of lipid and energy metabolic disruptions, with preliminary observations of altered amino acid profiles, this study establishes a framework for the design and evaluation of next-generation targeted nanomedicines.
Keywords: MALDI-MSI, melanoma, spatial lipidomics, targeted liposomes, resveratrol
Introduction
Melanoma represents one of the most aggressive malignancies of the skin, characterized by rapid progression, early hematogenous dissemination, and a disproportionately high mortality rate. Its global incidence continues to escalate [1], driven by shifting lifestyles and environmental stressors [2], making melanoma one of the fastest-growing malignancies worldwide. Despite significant therapeutic breakthroughs, the prognosis for advanced melanoma is poor, and the 5-year survival rate for Stage IV disease remains low [3]. Consequently, illustrating the complex molecular mechanisms of melanoma is essential for the development of next-generation precision therapies [1, 2].
Recent evidence emphasizes the vital role of lipid metabolism in driving chronic diseases, particularly oncogenesis. An important metabolic hallmark of cancer is the dysregulation of lipid metabolism. Upregulated lipogenic pathways provide the necessary energy and structural precursors for rapid proliferation while modulating key signaling and epigenetic landscapes [4-6]. However, tumors are not monolithic, and they display profound heterogeneity in terms of function and metabolism. Conventional bulk lipidomics, which relies on tissue homogenization, will obscure regional variations—such as those between the necrotic core and the invasive margin. Thus, this leads to the loss of essential spatial context. Spatial lipidomics techniques, such as Matrix-Assisted Laser Desorption/Ionization-Mass Spectrometry Imaging (MALDI-MSI), have emerged as powerful tools to map the molecular architecture of the tumor microenvironment with high spatial resolution [7, 8]. Resveratrol (Res), a natural polyphenolic compound, has potent anti-inflammatory, antioxidant, and anti-tumor properties [9]. Nonetheless, its clinical application is severely restricted by poor aqueous solubility, rapid systemic metabolism, and low bioavailability [10]. To face these challenges, nanocarrier-based delivery strategies offer a promising solution. Melittin, a membrane-disrupting peptide derived from bee venom, possesses anti-tumor ability but is limited by its hemolytic toxicity. Following the strategy of Yu et al. [11], we utilized a modified α-melittin (Mel) that retains therapeutic efficacy while minimizing hemolysis. At nanomolar concentrations, Mel interacts with membrane lipids through electrostatic and hydrophobic forces, modulating membrane fluidity and curvature, which may synergistically enhance the internalization of agents. Furthermore, the iRGD peptide (CRGDKGPDC) facilitates enhanced tumor-targeted delivery by sequentially binding to αv integrins and neuropilin-1 (NRP-1), thereby promoting vascular extravasation and tissue penetration [12-14]. We hypothesized that the integration of Mel and iRGD within a single platform could yield a powerful "synergistic targeting" effect. So, we developed a multifunctional nano delivery system in this study, termed TPRL (Targeting-Permeabilizing-Resveratrol-Liposomes), designed for the precise treatment of melanoma. We demonstrate that TPRL effectively suppresses melanoma growth by orchestrating lipid metabolic reprogramming through the inhibition of the PI3K-AKT and JAK-STAT signaling axes. Utilizing high-resolution MALDI-MSI (iMScope), we successfully mapped the spatial lipidomic landscape of melanoma tissues in situ, revealing the profound lipid metabolic shifts induced by TPRL. These findings provide a framework for understanding and targeting lipid metabolism in melanoma, offering a sophisticated engineering approach for advanced cancer therapy.
Methods and Materials
Chemicals and reagents
Mass spectrometry-grade chemicals, matrix moieties (1,5-DAN, 9AA, DHB, CHCA), derivatization reagents, and amino acid standards were bought from Sigma-Aldrich, Tag-ON, Macklin etc. Resveratrol was purchased from ABPHYTO Biological Technology (Chengdu, China). The syntheses of α-melittin and iRGD peptides were purchased by Apeptide Co., Ltd. and Motif Biotech Co., Ltd. Detailed catalog numbers and specifications of all chemicals and antibodies are provided in the Supplementary Materials.
Preparation of a tumor–targeting delivery system
The detailed preparation procedures are provided in the Supplementary Materials. Briefly, all liposomal formulations were prepared by the thin-film hydration method. In total, eight formulations were used in this study, comprising four blank liposomal formulations and four Res-loaded liposomal formulations. The four blank formulations were: LPs (blank liposomes); TL (iRGD-modified blank liposomes); PL (Mel-modified blank liposomes); TPL (Mel and iRGD-modified blank liposomes). The four Res-loaded formulations were: RL (Res-loaded liposomes); TRL (iRGD-modified Res-loaded liposomes); PRL (Mel-modified Res-loaded liposomes); TPRL (Mel and iRGD-modified Res-loaded liposomes). In this article, “T” symbolizes the tumor-targeting peptide iRGD. “P” symbolizes Mel modification with membrane-permeabilizing properties, “R” symbolizes Res, and “L” symbolizes liposomes. In addition, TPR symbolizes the physical mixture of unencapsulated Res, iRGD, and Mel.
In vitro cellular functional assays
A375 and HDMEC cells were cultured under standard conditions. Cell viability and cytotoxicity of different formulations were assessed by the CCK-8 assay (Glpbio, California). Cell proliferation was assessed via EdU assay. Cell death was visualized using Calcein-AM/PI live/dead staining. Cell cycle progression and apoptosis were assessed by flow cytometry (Biosharp, China). Intracellular neutral lipid droplets were tested using BODIPY 493/503 by flow cytometry. Wound-healing and Transwell assays were conducted to evaluate cell migration and invasion capabilities. Detailed experimental procedures and antibody information are provided in the Supplementary Materials.
Animal studies
Nude mice (4–5 weeks) and BALB/c mice (6–8 weeks) were obtained from Beijing HFK Bioscience Co., Ltd (Beijing, China). Subcutaneous tumors were generated by inoculating 2 × 10⁷ A375–luc cells into the right forelimb of nude mice. Bioluminescence imaging was performed using the IVIS Spectrum In Vivo Imaging System (Perkin Elmer). The mice were kept with free access to a standard diet and distilled water in a controlled environment (22–24 °C, 40%–60% humidity, and a 12 h light/dark cycle). In compliance with Chinese animal protection laws, the experimental procedures were approved by the Animal Ethics Committee of China Medical University (IACUC: CMU2023886).
In vivo antitumor effects
After 20 days of injection of A375-luc cells, 70 mice were randomly divided into 7 groups: (a) TL, (b) PL, (c) TPL, (d) RL, (e) TRL, (f) PRL, and (g) TPRL. Detailed chemical compositions, preparation procedures, and additional characterization of these formulations are provided in the Supplementary Materials. The equivalent doses of each component in the above groups were Res: 3 mg/mL (30 mg/kg/d for a 20 g mouse with 0.2 mL injection volume), and 10 mice in each group were administered intraperitoneally once daily for 30 days. From the first injection, five mice per group were checked for tumor growth, and on day 50, they were sacrificed for H&E, IHC, and imaging mass spectrometry analysis of major organs and tumor tissues. 5 mice in each group were recorded for body weight and survival.
For the B16-F10 model, BALB/c mice received a subcutaneous injection of 1 × 10⁷ B16-F10 cells. Once tumors reached ~100 mm3, mice were randomly divided into four groups (n = 3 per group) and given daily intraperitoneal injections of TPL, RL, TRL, or TPRL. Tumor volumes were measured every 3 days and calculated as (length × width2) / 2. At the endpoint, tumors were harvested for Western blot analysis.
Tissue preparation for iMScope
The tumor tissues were sectioned into 10 μm slices with a Leica CM1950 cryostat (Nussloch, Germany) at temperatures of –23 °C for the cryochamber and –16 °C for the specimen. The slices were mounted onto ITO-coated glass slides that were electrically conductive after being thawed. The relative abundance and distribution of lipids, amino acids and other small molecules in tumor tissues of each group were analyzed for group comparisons. The tumor sections to be compared were thaw-mounted on the same ITO slide, acquired, and normalized on the same slide.
Application of matrix coatings
The application of 9AA or CHCA as the matrix was achieved through a two-step process that combined sublimation with airbrushing, building on our previously outlined method [15]. Briefly, sublimation was the first step. The ITO-coated glass slide containing the tissue specimen was set in a sample holder and incorporated into a vacuum deposition system (SVC-700TMSG iMLayer, Sanyu Electron, Tokyo, Japan). A matrix holder containing about 300 mg of matrix powder was placed 8 cm away from the sample holder. The matrix powder was subsequently heated to the boiling point of the matrix crystals (9AA at 220 °C; CHCA at 250 °C). The next phase involved airbrushing. In short, a matrix solution at a concentration of 10 mg/mL was created by dissolving matrix powder in a mixture of acetonitrile and distilled water with 0.1% TFA, in equal volumes. The matrix solution, 2 mL in volume, was placed into an artist's airbrush (MR Linear Compressor L7/PS270 Airbrush, GSI Creos, Tokyo, Japan) and applied to tissue surfaces over 23 cycles. Vacuum drying was applied to the tissue sections before scanning them with a Shimadzu iMScope.
MALDI–MSI analysis
The samples were set on the instrument after being coated with matrix. MS acquisition was performed with the following settings: positive ion mode for CHCA-coated sections and negative ion mode for 9AA-coated sections; mass range, m/z 200–900; sample voltage, 3.0 kV; detector voltage, 1.90 kV. The laser was operated at a frequency of 1000 Hz with a spot diameter of 3 μm and an intensity of 55 iMScope units, delivering 100 shots per pixel. Data were processed using MS Solution Version 1.30 for image, background subtraction, and data extraction from tissue microregions. Lipid species were identified by matching m/z values with the LIPID MAPS database (https://www.lipidmaps.org/), and further confirmed by comparison with published spectra and MALDI-TOF-MS/MS analysis of authentic standards. To enhance reliability, MALDI-MSI results were validated against bulk LC-MS/MS lipidomics data from the same tissues, conducted by Shanghai Biotree Biomedical Technology Co., Ltd. Lipids which can be consistently identified across both platforms were considered confidently annotated, while discrepancies were resolved by manual inspection of MS/MS fragmentation patterns and exact mass matching against the LIPID MAPS Structure Database (LMSD). Ion images were generated using a mass tolerance window of ± 0.05 Da around the theoretical/assigned m/z value unless otherwise specified.
Data analysis and statistics
The experiments and analyses were performed without revealing any identifying information, and each was independently repeated a minimum of three times. All error bars indicate the standard error of the mean (SEM) with sample sizes of either 3 or 5, standardized against the control group; no data were specifically omitted from the analysis. For statistical analysis, two-group comparisons were performed using Student's unpaired t-test (or Welch's t-test when variances were unequal), while comparisons among three or more groups were analyzed using one-way ANOVA followed by appropriate post-hoc tests (including Fisher’s LSD where applicable). For non-parametric data, the Mann-Whitney U test was applied for two-group comparisons and the Kruskal-Wallis test for multi-group comparisons. The Kaplan–Meier method was used to determine the survival data for each group, and significance was tested using the log–rank (Mantel–Cox) test, with P-values calculated via GraphPad Prism 8 software. For semiquantitative comparison of MALDI–MSI data from different groups, a normalization procedure based on total ion current (TIC) and mass window was applied. Normalized peak intensities were determined as integrated values over the ROIs, and the ion intensities of lipid species were calculated using normalized TIC. Averaging the normalized intensities helped in evaluating group differences. Normality was assessed using the Shapiro-Wilk test, and homogeneity of variances was evaluated using Levene's test. Imaging MS Solution software (version 1.30) was used to conduct ROI assays. The p value for ROI analysis was determined by comparing average peak intensities or signals from MS spectra of ROI-marked regions. Extremely small software-generated P values were uniformly reported as P < 0.001.
Results
Preparation and characterization of TPRL
The clinical and experimental utility of Res is significantly hindered by its poor aqueous solubility. In this study, we employed a lipid nanoparticle-based strategy to overcome this limitation [16]. As illustrated in Figure 1A, liposomes were prepared by thin-film hydration method. To identify the best formulation, we evaluated the encapsulation efficiency across various Res/soy lecithin/cholesterol mass ratios. The highest encapsulation efficiency (84.33%) and the highest Res loading were achieved at a Res/lecithin ratio of 1:20 and a lecithin/cholesterol ratio of 10:1 (Figure 1B). Therefore, these ratios were used in all subsequent experiments. Chemical conjugation was verified via FTIR spectroscopy. The TPRL group exhibited characteristic absorption peaks at 1605 cm⁻¹ and 1475 cm⁻¹, which matched the stretching vibrations of C=O and N-H. These peaks are consistent with amide bond formation and were absent in the physical mixture group. The results confirm that Mel and iRGD were successfully conjugated to DSPE-PEG2000-COOH (Figure 1C) (Figure S1A-B). The conjugation efficiencies of Mel and iRGD in TPRL were further quantified by ninhydrin assay and MALDI-IT-TOF analysis, yielding approximately 88% and 86% (Figure S1C-F). Furthermore, release assays in vitro performed under physiological pH conditions demonstrated that the liposomes can continuously release Res (Figure 1D).
Preparation and characterization of pharmaceutical formulation. (A) Schematic workflow of the pharmaceutical formulation preparation. (B) Encapsulation rate of liposomes with different Res: lecithin/lecithin: cholesterol ratio. (C) IR spectra of different samples. (D) In vitro cumulative release profiles of Res, RL, TRL, PRL and TPRL at pH 7.4. (E) Representative TEM images of LPs, RL, TRL, PRL and TPRL. Scale bar, 50 nm. (F-H) Particle-size distribution, PDI and Zeta potentials of LPs, RL, TRL, PRL and TPRL obtained by DLS. (I, J) Time-dependent changes of size and PDI of LPs, RL, TRL, PRL and TPRL incubated at 4 ℃. All values were presented in at least three independent experiments. (K) Changes in the appearance of LPs, RL, TRL, PRL and TPRL incubated at 4 ℃ for 30 days.
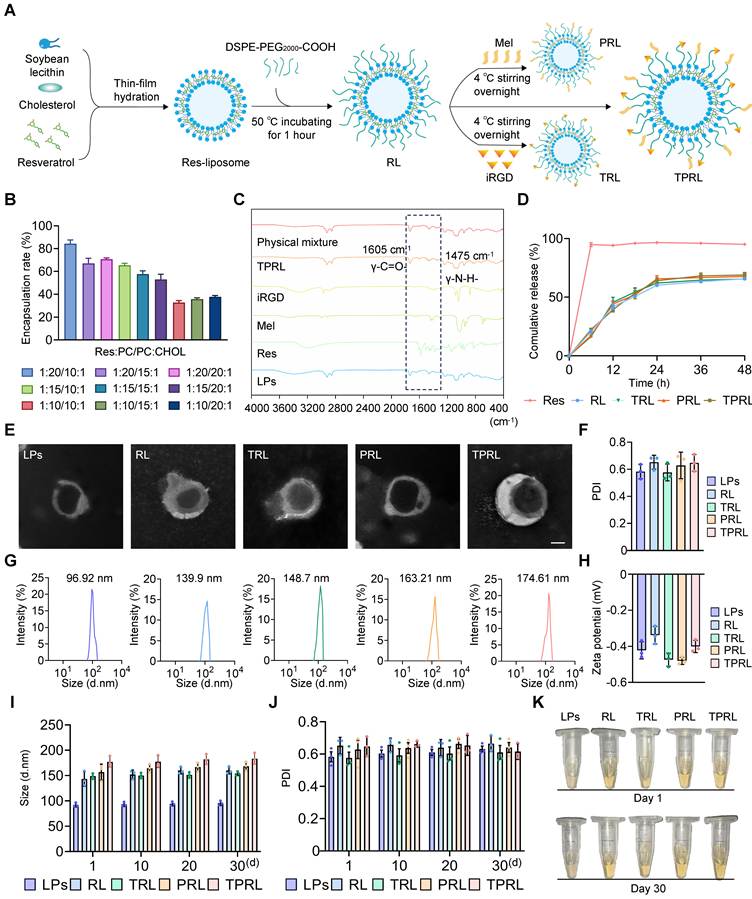
The liposomes mainly exhibited a uniform, disc-like structure via transmission electron microscopy (TEM) (Figure 1E). Dynamic light scattering (DLS) measurements indicated that the average of the particle sizes of LPs, RL, TRL, PRL, and TPRL were 96.92 nm, 139.9 nm, 148.7 nm, 163.21 nm, and 174.61 nm (Figure 1G). The size distribution maps showed a distinct unimodal pattern, reflecting high homogeneity of liposomes. The polydispersity indexes (PDIs) ranged from 0.58 to 0.65 (Figure 1F). These relatively higher PDI values are likely due to the inherent compositional heterogeneity of soybean lecithin. The zeta potentials for all formulations remained near-neutral, ranging from -0.34 mV to -0.48 mV (Figure 1H), which is characteristic of PEGylated liposomes prepared with non-ionic surfactants. Similarly, the other blank liposomal formulations (TL, PL, and TPL) exhibited comparable morphology and physicochemical properties to LPs (Figure S1G–K). Furthermore, the formulations displayed physical stability; no significant changes in particle size, PDI, or visual appearance were observed over 30 days of storage at 4 °C (Figure 1I-J), with no sediment (Figure 1K). In long-term stability assay, no significant changes in TPRL size were observed at 4, 25, and 37 °C or at pH 5.0, 6.5, and 7.4, and no discernible spectral changes over 30 days of storage (Figure S2A-B, D). Additionally, all formulations exhibited similar particle sizes in 10% serum to those in PBS (Figure S2C). Given the inherent hemolytic characteristic of melittin, the biosafety of the formulations is important. We used an in vitro hemolysis assay to evaluate the hemolytic effects of the formulations on red blood cells of mouse. The amount of Mel conjugated to TPRL was further quantified based on the molar ratio used in the preparation. The final Mel concentration in TPRL was calculated to be approximately 0.86 μg/mL and this value is substantially below the concentrations required for hemolytic activity, thus confirming the biosafety of the composite nanoplatforms (Figure S2E-G). The results above demonstrate the successful preparation of TPRL with excellent stability and biosafety.
In vitro anti-tumor efficacy of TPRL in A375 cells
We firstly evaluated the cytotoxicity of Res on cell viability. Res inhibited A375 cell viability in a dose-dependent manner; treatment with 50 µM, 100 µM, and 200 µM Res for 48 h reduced viability to 58%, 51%, and 16%, respectively. In contrast, HDMEC cells remained relatively resistant at these concentrations, maintaining viabilities of 96%, 88%, and 80% (Figure 2A-B). Based on these findings, 100 µM Res—a concentration approximating the IC50 for A375 cells while sparing HDMEC cells—was selected for subsequent studies. However, DMSO and blank LPs showed no obvious cytotoxic effects while Res, TPR, RL, and TPRL markedly reduced A375 viability (Figure 2C). To evaluate the effects of inhibiting proliferation, we performed Calcein-AM/PI staining, which revealed an increase in the proportion of dead cells when treated with Res, TPR, RL, and TPRL. The TPRL group exhibited the highest mortality rate (Figure 2D-F). Consistently, EdU assays indicated that TPRL suppressed A375 cell proliferation (Figure 2E-G). Besides, we used flow cytometry to analyze cell cycle distribution for investigating the mechanism of inhibition of growth. Compared to the LPs control, TPRL treatment led to an accumulation of cells in the S phase while a decrease in the G2/M phase, indicating that TPRL induces S-phase cell cycle arrest (Figure 2H-J).
In vitro anti-melanoma activity of TPRL. (A, B) Cell viability of A375 and HDMEC cells with Res treatment. (C) Cell viability of A375 cells with DMSO, Res, TPR, LPs, RL and TPRL treatment for 48 h. (D, F) Live/dead cell analyses. Cells were submitted to Calcein-AM/PI staining to assess the proportion of dead cells. PI, red for dead cells; Calcein-AM, green for live cells. Scale bar, 100 μm. 3 images were counted per group in each independent trial. (E, G) Representative images of EdU/DAPI staining in A375 cells. Scale bar, 100 μm. 3 images were counted per group in each independent trial. (H, J) Flow cytometry examined the cell cycle distribution in the indicated groups. (I, K) Following the treatment above, A375 cells were stained with Annexin V-FITC and PI and subsequently analyzed by flow cytometry. The percentages of early apoptotic (EA) and late apoptotic (LA) cells are shown. (L) Scratch assays were used to detect the migration ability of A375 cells in the groups above. Scale bar, 100 μm. 3 images were counted per group in each independent trial. *p < 0.05, **p < 0.01 and ***p < 0.001 versus DMSO group; #p < 0.05, ##p < 0.01 and ###p < 0.001 versus LPs group by one-way analysis of variance (ANOVA) with post hoc Fisher's LSD. All values were presented in at least three independent experiments.
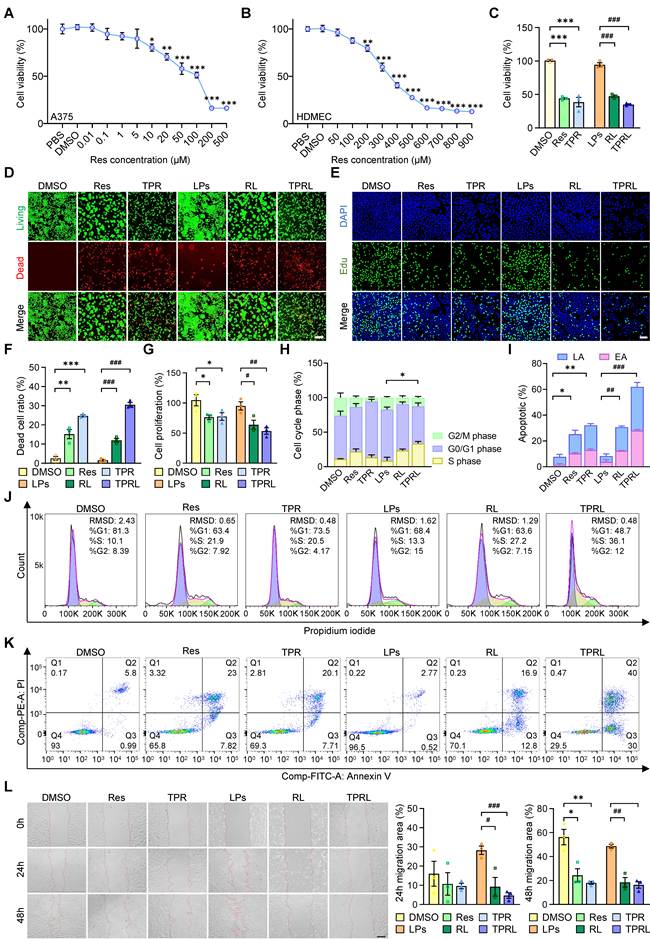
Furthermore, Annexin V-FITC/PI staining demonstrated a significant increase in both early and late apoptotic populations when treated with formulation that has Res inside, and the TPRL group had the most robust apoptotic induction (Figure 2I-K). Moreover, the impact of TPRL on the A375 cells was assessed via wound-healing and Transwell assays. TPRL significantly impaired the capacity of migration of A375 cells compared to the LPs group (Figure 2L). In Transwell assays, the TPRL group showed the strongest inhibition of cell invasion (Figure S3).
Efficient cellular uptake is critical for nanotherapy [17]. The time-dependent cellular uptake was observed through confocal fluorescence imaging. Surprisingly, TPRL showed higher accumulation than other formulations (Figure S4A). To investigate TPRL's capability of passing the blood-tumor barrier (BTB), we utilized transwell assay system to create an in vitro BTB model. The enhanced in vitro BTB model included HDMEC monolayers in the top chambers and A375 cells in the bottom chambers, replicating the physiological interface between endothelium and tumor (Figure S4C). Following a 48 h incubation with Cou6-labeled liposomes, A375 cells treated with TPRL showed stronger fluorescence signals than those treated with non-targeted RL (Figure S4D). Moreover, HDMEC cells did not experience notable cell death within 48 h of treatment with RL, PRL, TRL, and TPRL (Figure S4B), implying that the increased BTB penetration of TPRL was not caused by impairment of the endothelial monolayer's integrity. Overall, TPRL has diverse anti-melanoma effects by inducing apoptosis and cell cycle arrest, preventing migration and invasion, and achieving excellent cellular uptake and BTB penetration.
TPRL suppresses melanoma growth by modulating lipid metabolism via the PI3K/AKT and JAK/STAT pathways
To elucidate the molecular mechanisms underlying the anti-melanoma effects of TPRL, we performed transcriptome RNA-seq on A375 cells. A total of 3,608 differentially expressed genes (DEGs) were identified between the DMSO and Res groups, while 3,119 DEGs were found between the LPs and TPRL groups (Figure S5A-B). KOG functional classification hinted that these DEGs were primarily involved in signal transduction, lipid transport, and metabolism (Figure S5C-D). Furthermore, Gene Ontology (GO) enrichment analysis highlighted key biological processes such as glycolytic processes, phospholipid metabolism, and positive regulation of programmed cell death (Figure S5E-F). Given the important role of dysregulated lipid metabolism in cancer progression [18], these results suggest that TPRL may exert its anti-tumor activity by correcting metabolic abnormalities, particularly lipid metabolism disorders. To identify the specific targets of TPRL, network pharmacology was integrated with the transcriptomic data. We identified 110 overlapping candidate targets (Figure S6A), by intersecting "melanoma" and "resveratrol" associated targets with the top 20 GO biological processes. Protein-protein interaction (PPI) network analysis identified AKT as the central hub (degree: 242), alongside several critical lipid metabolism-related proteins, including FASN, ACLY, and ACACA (Figure S6B). KEGG pathway analysis indicated that these targets were enriched in the PI3K/AKT and JAK/STAT signaling pathways (Figure S6C). This prediction was demonstrated by KEGG of the TPRL induced DEGs, where the PI3K/AKT and JAK/STAT pathways emerged as the most prominent (Figure S6D-E). Molecular docking [19] and Cellular Thermal Shift Assays (CETSA) [20] showed that Res interacts with AKT and STAT3, causing a rightward shift in their respective melting curves (Figure S6F-I). Western blot analysis showed that TPRL suppressed the phosphorylation of AKT (Thr308) and STAT3 (Tyr705) without affecting total protein levels (Figure S6J). Washout experiments revealed that p-AKT and p-STAT3 levels remained suppressed at 24 and 48 h after washout (Figure S6K). This indicated that inhibition mediated by TPRL of AKT/STAT3 signaling is durable and not reversible after washout.
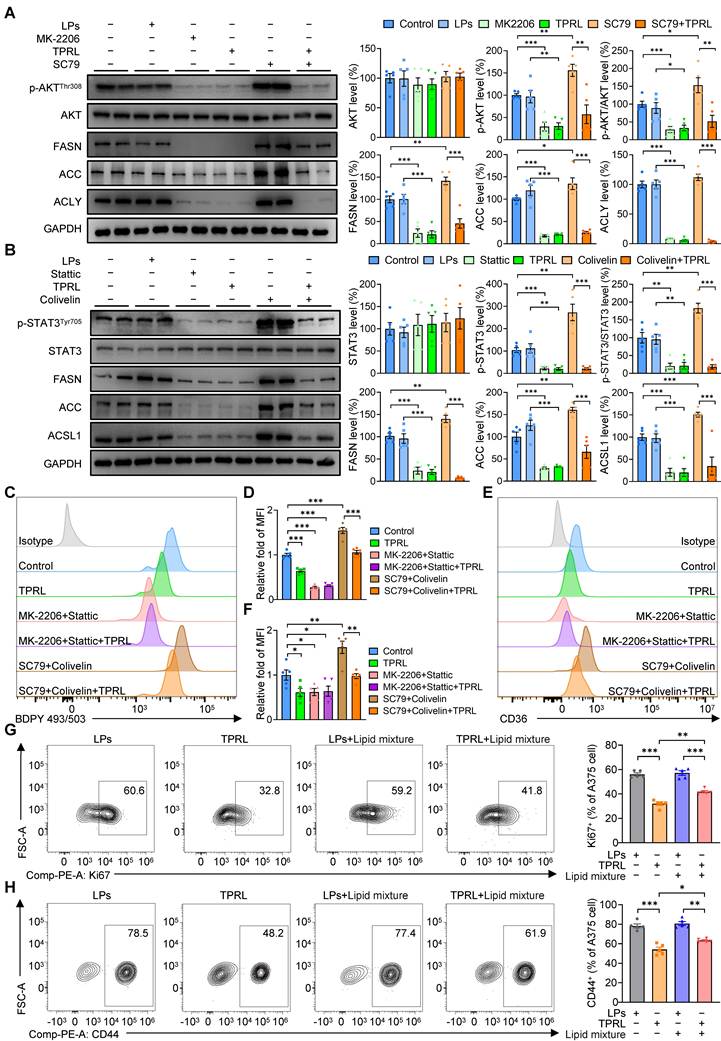
Specific inhibitors and activators were used to detect the relation between AKT/STAT3 signaling and lipid metabolism. Blocking AKT (MK-2206) or STAT3 (Stattic) mimicked the effects of TPRL, reducing the expression of lipid synthesis enzymes (FASN, ACC, ACLY, and ACSL1). Conversely, activating these pathways with SC-79 (AKT activator) or Colivelin (STAT3 activator) upregulated these proteins; however, these effects were effectively reversed by TPRL treatment (Figure 3A-B). Flow cytometric analysis of neutral lipids confirmed that TPRL-mediated reduction in intracellular lipid levels was consistent with the effects of combined AKT/STAT3 inhibition (Figure 3C-D). Additionally, CD36 is a fatty acid transporter implicated in tumor proliferation and progression [21, 22]. TPRL treatment or dual AKT/STAT3 inhibition downregulated CD36 (Figure 3E-F). To explore cross-regulation between AKT and STAT3, TPRL-treated cells were co-incubated with SC-79 or Colivelin. SC-79 partially restored p-AKT without affecting p-STAT3, while Colivelin partially restored p-STAT3 without altering p-AKT. Total protein levels remained unchanged (Figure S7), suggesting that the two pathways are not detectably cross-regulated under the tested conditions. Interestingly, after treatment with Lipid Mixture 1, the TPRL-induced phenotypes were partially rescued, as evidenced by a restoration of Ki67 [23] and CD44 [24] expression, increased cell migration, and elevated PD-L1 levels, and a reduction in apoptosis (Figure 3G-H) (Figure S8). In conclusion, these findings demonstrate that TPRL inhibits the PI3K/AKT and JAK/STAT signaling pathways by suppressing the phosphorylation of AKT and STAT3. This reaction downregulates lipid synthesis and fatty acid uptake, thereby correcting the lipid metabolic dysregulation and reducing melanoma survival and progression.
TPRL regulates lipid metabolism in melanoma by inhibiting AKT/STAT3 phosphorylation in vitro. (A) Western blot analysis of AKT, p-AKT, FASN, STAT3, p-STAT3, ACC and ACLY protein levels in A375 cells treated with LPs, MK-2206 (25 μM), TPRL, SC79 (5 μg/mL) and SC79 + TPRL. n = 5 independent biological replicates. (B) Western blot analysis of AKT, p-AKT, FASN, STAT3, p-STAT3, ACC and ACSL1 protein levels in A375 cells treated with LPs, Stattic (25 μM), TPRL, Colivelin (10 μg/mL) and Colivelin + TPRL. n = 5 independent biological replicates. (C, D) Intracellular neutral lipid levels in A375 cells assessed via flow cytometry after treated with various treatments and statistical analysis. n = 5 independent biological replicates. (E, F) Expression of CD36 were analyzed by flow cytometry in A375 cells treated with various treatments and statistical analysis. n = 5 independent biological replicates and statistical analysis. (G, H) Expression profiles of Ki67+ and CD44+ A375 cells were measured by flow cytometry and statistical analysis. n = 5 independent biological replicates. All values represent mean ± SEM, *p < 0.05, **p < 0.01 and ***p < 0.001.
In vivo anti-tumor efficacy, bio-distribution, and metabolic modulation of TPRL
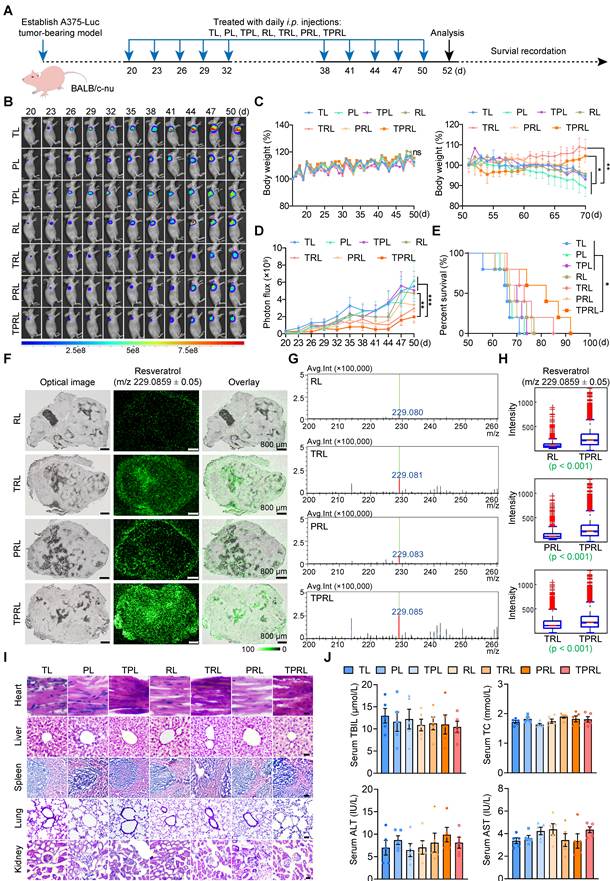
A375-Luc melanoma transplant model was employed to evaluate the therapeutic potential of TPRL in vivo as the timeline depicted in Figure 4A. Bioluminescence imaging revealed that TPRL treatment displayed the most significant effect of inhibition on tumor growth, followed by the TRL group (Figure 4B-D). Safety profiles were monitored through body weight and survival analysis. No remarkable weight changes were observed during the first 50 days in the TL, PL, TPL and RL groups. At the same time, these groups experienced rapid weight loss between days 50 and 90. In contrast, TRL and TPRL treated groups maintained stable body weights (Figure 4C). Notably, TPRL significantly prolonged the lifespan of tumor-bearing mice. The median survival period of TPRL group was 82 days, whereas other treatments showed only slight improvements (Figure 4E). Given the non-fluorescent characteristics of formulations, we innovatively employed imaging mass spectrometry (iMScope) to directly visualize the spatial distribution of Res in vivo, and it can avoid potential interference from exogenous fluorescent substances. Although Res primarily localized in the liver, kidney, and intestine after intraperitoneal injection (Figure S9), the most robust and uniform signal accumulation was exhibited by the TPRL group in tumor (Figure 4F-G). ROI-based semiquantitative analysis confirmed that the dual-modification with Mel and iRGD enhanced the tumor-targeting capacity of the liposomes (Figure 4H). To analyze the dynamic changes in Res distribution in mice after TPRL administration, our study used Dionone as an internal standard to draw standard curves and analyze Res levels in various tissues of mice at different time points after a single TPRL administration (Figure S10A-C). The results showed that Res levels gradually increased and subsequently decreased in liver, kidney and intestinal tissues of TPRL-treated mice. Of note, there was also a slight increase in Res levels in brain tissue, with a maximum at 8 h (2.24 % ID) and a subsequent decrease (Figure S10D). These data showed that TPRL not only efficiently delivered Res to melanoma tissue, but also had the potential to penetrate the blood-brain barrier (BBB). LC–MS was employed to determine the pharmacokinetics (PK) of TPRL in vivo. Sera were collected from mice at different timepoints after treatment and used for PK analysis. The concentration of serum Res reached Cmax (6.997 ± 0.164 μg/mL) at 1.33 ± 0.58 h and then slowly declined with a half-life (t1/2) of 6.03 ± 0.17 h, AUCinf of 34.27 ± 0.43 μg·h/mL (Figure S10E-F). Besides, histological evaluation (H&E staining) of major organs after 30 days of treatment showed no evidence of structural damage or inflammatory infiltration (Figure 4I). Serum biochemical markers, including TBIL, TC, ALT, and AST, remained within physiological ranges across all treatment groups (Figure 4J), serum IL-6, TNF-α, CREA, and BUN levels also showed no intergroup differences (Figure S11), confirming the biosafety and biocompatibility of TPRL. In addition, we investigated whether TPRL modulates lipid metabolism within the tumor microenvironment. Immunohistochemical (IHC) assay demonstrated downregulation of key lipogenic enzymes, including FASN, ACC, ACLY, ACSS1, and ACSL1, particularly in the TPRL treated group. However, no significant alterations were observed in lipolysis-related proteins such as PGC1α, ATGL, and CPT1A (Figure S12A).
TPRL inhibits melanoma growth in vivo. (A) Schematic of the experimental timeline. (B, D) Luciferase luminescence levels in mice following treatment with TL, PL, TPL, RL, TRL, PRL and TPRL. n = 5 mice. (C) Changes of mouse body weight. n = 5 mice. (E) Survival curves of A375-bearing mice exposed to the indicated treatments. n = 5 mice. (F) Representative MALDI-MSI images showing the spatial distributions of Res within tumor tissues from RL, TRL, PRL and TPRL groups. CHCA was used as the matrix. Scale bar, 800 μm. (G) MALDI-MSI single-pixel mass spectra of Res (m/z 229.0859 ± 0.05) in the tumor tissue slices. (H) ROI analysis of Res-associated ion-intensity distributions in tumor tissues. Statistical comparisons were performed using ROI-based analysis in Imaging MS Solution (version 1.30). (I) Histological analyses of major organs by H&E staining following different treatments in A375-Luc bearing nude mice. Scale bar: Heart = 10 μm, Liver = 20 μm, Spleen = 50 μm, Lung = 50 μm, Kidney = 20 μm. (J) Serum biochemical analysis of TBIL, TC, ALT and AST in A375-Luc bearing mice treated with TL, PL, TPL, RL, TRL, PRL and TPRL. n = 5 mice. All values represent mean ± SEM, *p < 0.05, **p < 0.01 and ***p < 0.001.
Western blotting and RT-PCR suggested that TPRL significantly suppressed the expression of Fasn, Srebp1c, Acly, and Scd1 without affecting catabolic markers like Atgl or Cpt1α (Figure S12B-C). Moreover, we established a B16-F10 melanoma model in BALB/c mice to further validate the therapeutic efficacy of TPRL in another melanoma subtype. Consistent with the findings in A375 cell line, TPRL group displayed the most potent inhibition of tumor growth (Figure S13A-C). Similarly, TRL and TPRL suppressed the expression of lipogenic enzymes (FASN, ACC, ACSS1 and ACSL1), and TPRL showed the most pronounced inhibition in Western blot assays of B16 tumor tissues (Figure S13D-E). Taken together, these results indicate that TPRL effectively disrupts melanoma progression by inhibiting the lipid synthesis pathway in vivo.
Spatial lipidomics reveals TPRL-mediated metabolic reprogramming in melanoma
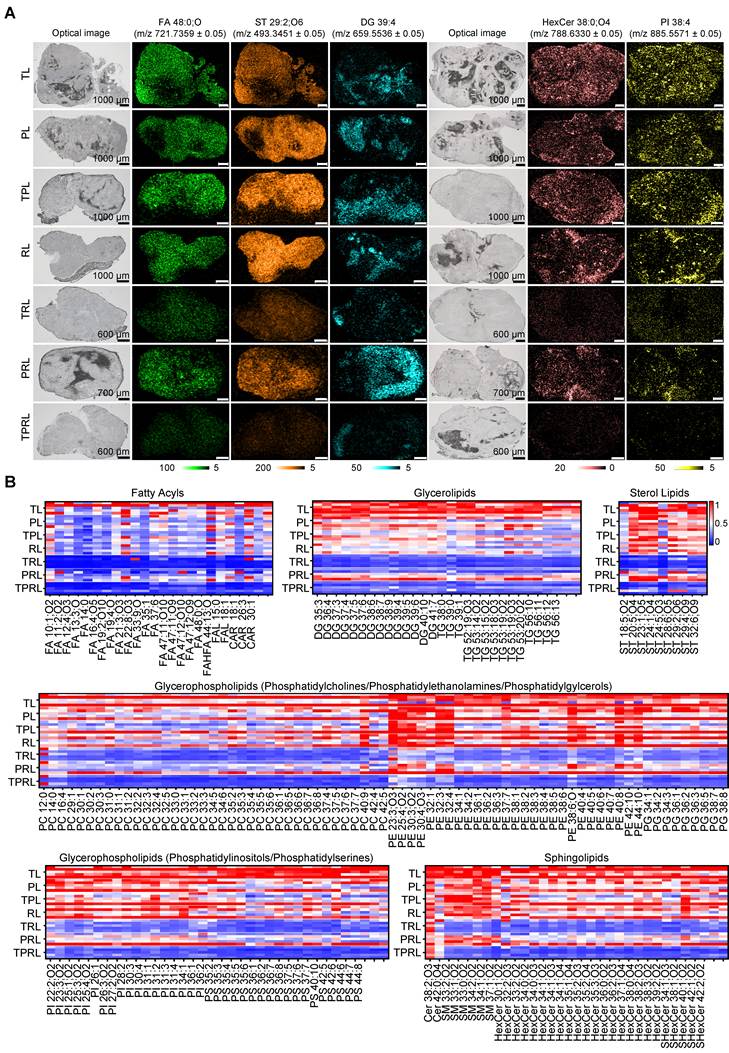
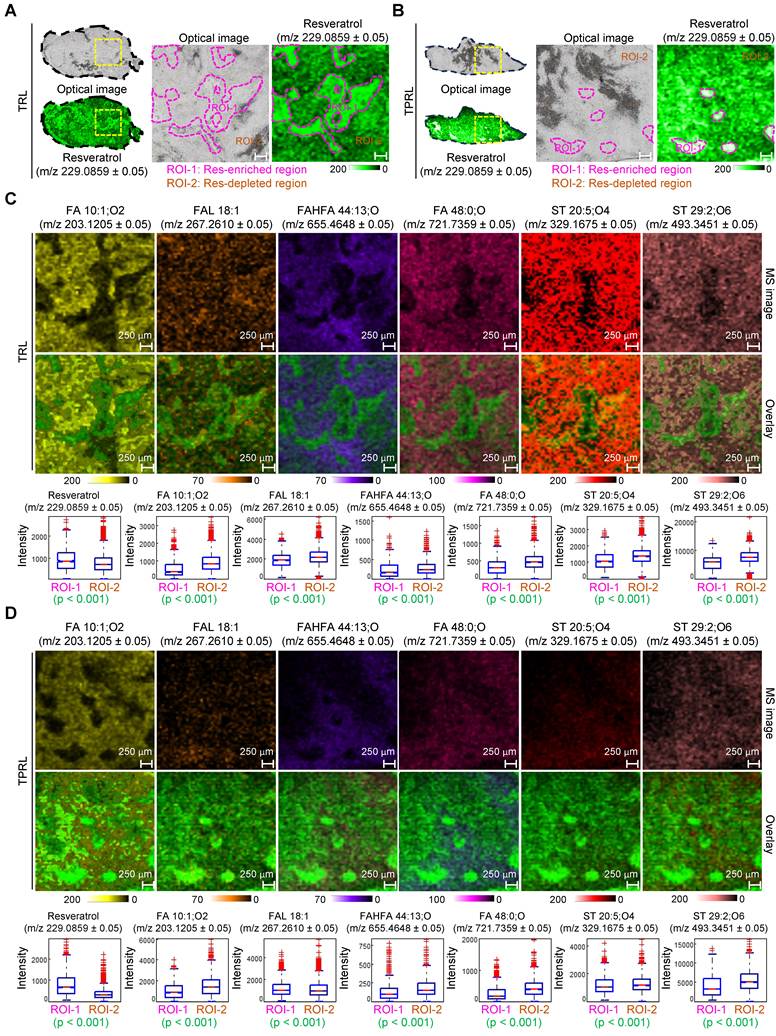
For comprehensively analyzing lipidomic alterations, iMScope was used to map the abundance and spatial distribution of lipids within melanoma tissues, integrating optical imaging with high-resolution MALDI-MSI. We identified a diverse array of lipids (e.g., FAL 18:1, FA 16:4;O5, ST 28:6;O5, Cer 47:1; O2 and Cer 47:0; O2) with distinct distribution patterns. IHC staining revealed that regions with high Ki67 expression—a marker of tumor proliferation—co-localized with these lipids in the same areas (Figure S14). This spatial correlation suggests a direct connection between lipid accumulation and melanoma malignancy. Based on histological features and MALDI-MSI data, the tumor microenvironment was categorized into three distinct zones: parenchyma areas (PA), stroma areas (SA), and hemorrhage areas (HA). iMScope analysis demonstrated spatial heterogeneity; for instance, some fatty acids, sterols, sphingomyelins, hexosylceramides and sulfatides (e.g., FA 10:1; O2, FAL 18:1, FA 16:4; O5, FA 19:2; O10, FAHFA 44:13; O, FA 48:0; O, ST 20:5; O4, ST 28:6; O5, ST 29:2; O6, PS 31:2, HexCer 35:2;O4, SM 37:1;O2, SHexCer 42:2;O2 and SHexCer 42:1;O2) were primarily localized in the PA, whereas some glycerolipids (e.g., DG 39:5, TG 53:20; O2, TG 53:19; O2, TG 56:13, TG 56:12 and TG 56:11) were concentrated in the SA, and some carnitines (e.g., CAR 18:1 and CAR 30:1) were concentrated in the HA (Figure S15-16). These findings establish a robust spatial lipidomics framework for melanoma. Because excessive lipid accumulation fuels rapid tumor growth, we quantified the impact of TPRL on 4,709 detected lipid metabolites (Table S3). TPRL treatment downregulated 366 lipids, which were categorized via the Lipid Maps database into five classes: fatty acyls (FA), glycerolipids (GL), glycerophospholipids (GP), sphingolipids (SP), and sterols (ST) (Table S4). In conclusion, Glycerophospholipids (GP) represented the largest proportion of differential metabolites, which aligned with our in vitro RNA-seq data that highlighted phospholipid metabolic pathways (Figure 5) (Figure S17-18). Lipid metabolism is essential for production of energy and membrane biogenesis in cancer [6]. iMScope analysis suggested that ATP and ADP levels were significantly lower in the TPRL group compared to controls, with the reduction observed in the PA region (Figure S19). Specifically, lipids such as Cer 38:2; O3, HexCer 35:2; O4, PC 33:1, PE 36:3, PE 40:7 and PG 38:8 co-localized with high-energy regions, suggesting their role as substrates for energy production. To functionally validate these observations, we performed Seahorse XF analysis, which showed that TPRL reduced OCR compared to LPs (Figure S20A). TEM suggested mitochondrial swelling, cristae dissolution, and reduced density, which were partially rescued by PE 36:3 supplementation (Figure S20B). ATP production was decreased by TPRL and partially restored by PE 36:3 (Figure S20C). JC-1 staining demonstrated that TPRL reduced MMP, as evidenced by a decreased red/green fluorescence ratio, an effect partially reversed by PE 36:3 (Figure S20D). Moreover, TPRL elevated ROS levels, which were mitigated by PE 36:3 supplementation (Figure S20E). These assays confirm that TPRL induces mitochondrial dysfunction. It is notable that exogenous supplementation with PE 36:3—one of the representative lipids identified by MALDI-MSI and the only commercially available standard among the candidates—partially rescued these phenotypes, but the effect is limited (Figure S21). This suggests that while PE 36:3 depletion contributes to TPRL-induced mitochondrial impairment, the effect is likely synergistic and involves multiple lipid species, consistent with the observed downregulation of 366 lipid metabolites. To deeply explore the relationship between AKT/STAT3 inhibition and mitochondrial lipid remodeling, we performed mitochondrial lipidomics analysis. PCA revealed that TPRL and combined AKT/STAT3 inhibition induced comparable lipid remodeling (Figure S20F) (Table S5), suggesting that the mitochondrial lipid changes induced by TPRL are closely associated with AKT/STAT3 pathway inhibition. In contrast, lipids enriched in the HA (e.g., PI 36:2, PS 42:6 and SM 33:1; O2) showed no correlation with energy markers, indicating that they were likely not involved in tumor bioenergetics. To confirm the targeted effect of Res, we analyzed the correlation between Res distribution and lipid abundance. In both TRL and TPRL groups, MALDI-MSI identified "Res-enriched" and "Res-depleted" regions (Figure 6A-B). ROI analysis revealed an inverse spatial relationship between Res concentration and the abundance of representative lipids (e.g., FA 10:1; O2, FAL 18:1, FAHFA 44:13; O, FA 48:0; O, ST 20:5; O4 and ST 29:2; O6). The TPRL group showed higher Res accumulation and a reduction in lipid levels than the TRL group (Figure 6C-D). In summary, we conclude that TPRL effectively accumulates in tumor tissues, where it disrupts lipid supply chains, impairs mitochondrial energy metabolism, and ultimately retards melanoma progression.
Comparison of the spatial distributions of lipids within the tumor tissues in the indicated groups. (A) Representative images of spatial distribution in FA 48:0;O, ST 29:2;O6, DG 39:4, HexCer 38:0;O4 and PI 38:4. Scale bar: TL = 1000 μm, PL = 1000 μm, TPL = 1000 μm, RL = 1000 μm, TRL = 600 μm, PRL = 700 μm, TPRL = 600 μm. CHCA and 9AA were used as the matrix. (B) According to the average ion peak intensity, the ratio of lipids was shown in the heat map. Red is for high average ion peak intensity ratios, while blue is indicating lower average ion peak intensity ratios (n = 5). The ‘n’ in this context denotes the number of mice in each group. For each individual ion species, the same color scale and intensity range were applied across all treatment groups, whereas intensity ranges differed among different ion species according to their signal abundance.
Differences in Res distribution within melanoma tissues are associated with spatial lipid alterations. (A) Representative images from iMScope of melanoma tissue and Res spatial distribution after TRL treatment. Scale bar: 250 μm (B) Representative images from iMScope of melanoma tissue and Res spatial distribution after TPRL treatment. Scale bar: 250 μm (C) The images from iMScope of representative lipids such as FA 10:1; O2, FAL 18:1, FAHFA 44:13; O, FA 48:0; O, ST 20:5; O4 and ST 29:2; O6 in melanoma tissue after TRL treatment superimposed with the images from iMScope in A. The levels of Res and the above lipids were analyzed by ROI. Scale bar: 250 μm (D) The images from iMScope of representative lipids such as FA 10:1; O2, FAL 18:1, FAHFA 44:13; O, FA 48:0; O, ST 20:5; O4 and ST 29:2; O6 in melanoma tissue after TPRL treatment superimposed with the images from iMScope in B. Scale bar: 250 μm. The box plots show ROI-based ion-intensity distributions of the indicated regions. Statistical comparisons were performed using Imaging MS Solution (version 1.30).
Discussion
Metastatic disease continues to be a major clinical problem because of its aggressive nature [1]. Our research addresses these difficulties by designing a dual-modified nanoplatform (TPRL) that targets the metabolism of melanoma. The key to our findings is the suppression of the AKT and STAT3 signaling pathways. As a crucial link between signaling in cancer and metabolic changes, the PI3K/AKT pathway is often overactive and acts in melanoma, controlling the metabolism of glucose, lipids, and amino acids [25, 26]. Likewise, the JAK/STAT3 pathway functions as a main conductor of cancer metabolism, stimulating the expression of SCAP and SREBP-1 to boost fatty acid production directly [27, 28]. Our data show that TPRL inhibits both AKT and STAT3 phosphorylation, thus disrupting lipid synthesis without any observable cross-regulation. This dual-node blockade not only hinders tumor growth but also removes the metabolic “shield” that protects melanoma cells from apoptosis.
From a therapeutic perspective, focusing on lipid metabolism provides benefits in several ways. By inhibiting key enzymes such as FASN, TPRL simultaneously compromises cell membrane biogenesis and tumor growth [29]. Nevertheless, the spatial variability of lipid metabolism within tumor structures presents challenges to clinical application [30]. In this research, we employed spatial lipidomics (MALDI-MSI) to work this out. Our findings emphasize that the strong effectiveness of TPRL is based on its capacity to infiltrate the diverse tumor microenvironment. We focus on the parenchyma where lipogenic activity and malignant growth are most evident. Compared with existing nanocarriers for melanoma-targeted therapy, TPRL offers several translational advantages. iRGD-modified liposomes enhance tumor penetration through αv integrin and NRP-1 binding [31, 32], and melittin-based formulations provide membrane-disrupting activity. Their synergistic integration on one single platform enables a potent targeting strategy: iRGD mediates initial tumor homing, while Mel facilitates membrane fluidization for cellular internalization. Besides, liposomal drug-delivery platforms have an established history of clinical translation [33]. TPRL exhibited a favorable pharmacokinetic characteristic (t1/2 ≈ 6.03 h) and an excellent performance in biosafety in vivo. This lays a solid foundation for future IND-enabling evaluations. Additionally, tumor cells exhibit an accelerated bioenergetic demand, making ATP/ADP depletion a potent strategy for inhibition of growth [34, 35]. TPRL’s capacity to induce mitochondrial dysfunction and a subsequent energy crisis can cause damage to the tumor. Interestingly, our preliminary MALDI-MSI data also identified significant alterations in amino acid profiles, suggesting that TPRL’s anti-tumor activity involves a broader "metabolic reset". This provides evidence for potential pharmacodynamic biomarkers [36-38].
A significant technical contribution of this work is the deployment of iMScope to directly connect drug distribution with localized metabolic responses, overcoming the limits of spatial resolution of traditional LC-MS [39, 40]. However, we acknowledge certain limitations. The subcutaneous B16-F10 model in BALB/c mice does not fully recapitulate the metastatic cascade of melanoma and immune microenvironment of human melanoma. Secondly, the sensitivity of MALDI-MSI and the limited commercial availability of lipid standards constrained extensive functional rescue experiments. Head-to-head comparisons with standard-of-care agents (e.g., vemurafenib) are necessary for the clinical application. Notably, TPRL downregulated expression of PD-L1 in tumor cells, implying a promising synergy with immune checkpoint inhibitors. It will be the focus of our melanoma studies in the future.
Conclusion
In conclusion, by integrating nanomedicine with spatial lipidomics, this study demonstrates that Mel and iRGD co-modified liposomes trigger a cascade of lipid and energy metabolic disruptions, with preliminary observations of altered amino acid profiles, establishing a robust framework for next-generation targeted cancer therapies.
Abbreviations
Res: resveratrol; Mel: α-melittin; TL: Targeting-Liposome; PL: Permeabilizing-Liposome; TPL: Targeting-Permeabilizing-Liposome; RL: Resveratrol-Liposome; TRL: Targeting-Resveratrol-Liposome; PRL: Permeabilizing-Resveratrol-Liposome; TPRL: Targeting-Permeabilizing-Resveratrol-Liposomes; MALDI: matrix-assisted laser desorption ionization; IT: ion trap; TOF: time of flight; MSI: mass spectrometry imaging; ROI: region of interest; 1,5-DAN: 1,5-diaminonaphthalene; 9AA: 9-aminoacridine; DHB: 2,5-dihydroxybenzoic acid; CHCA: α-cyano-4-hydroxycinnamic acid; FMP-10: 4-(anthracen-9-yl)-2-fluoro-1-methylpyridin-1-ium iodide; CCK8: cell counting kit-8; EdU: 5-ethynyl-2'-deoxyuridine; DAPI: 6-diamidino-2-phenylindole; PBS: phosphate buffered saline; DMSO: dimethyl sulfoxide; H&E: hematoxylin–eosin; SP: sphingolipids; HexCer: hexosylceramides; SHexCer: sulfatides; Cer: ceramides; SM: sphingomyelins; GL: glycerolipids; DG: diacyl/alkylglycerides; TG: triacyl/alkylglycerides; GP: glycerophospholipids; PC: phosphatidylcholines; PE: phosphatidylethanolamines; PG: phosphatidylgylcerols; PI: phosphatidylinositols; PS: phosphatidylserines; ST: sterols; FA: fatty acids; FAHFA: fatty acid estolides; FAL: fatty aldehydes; CAR: acyl carnitines; DEG: differential expressed gene; EDTA: ethylene diamine tetra-acetic acid; PVDF: polyvinylidene difluoride; IHC: immunohistochemistry; FASN: fatty acid synthase; ACC: acetyl-CoA carboxylase; ACSL-1: long-chain-fatty-acid-CoA ligase 1; ACSS-1: acyl-CoA synthetase short-chain family member 1; ACLY: ATP-citrate synthase; PGC1α: peroxisome proliferator-activated receptor gamma coactivator 1-alpha; CPT1A: carnitine O-palmitoyltransferase 1; STAT 3: signal transducer and activator of transcription 3; PIAS3: protein inhibitor of activated STAT protein 3; PI3K: phosphatidylinositol 3-kinase; AKT: protein kinase B; mTOR: mechanistic target of rapamycin; PTEN: phosphatase and tension homolog deleted on chromosome ten.
Supplementary Material
Supplementary methods and figures.

Supplementary table 1.
Supplementary table 2.
Supplementary table 3.
Supplementary table 4.
Supplementary table 5.
Acknowledgements
We would like to thank all the help of members of Key Laboratory of Major Chronic Diseases of Nervous System of Liaoning Province. This work was supported by the National Key Research and Development Program of China 2023YFC3606600 (to W.C.), the Natural Science Foundation of Shenyang (RC220150 to W.C.) and the Public Hospital Research Collaboration Fund of Inner Mongolia (2023GLLH0336 to K.X.). All AI-assisted content was reviewed, rewritten, and verified by the authors against the original data and cited sources. No AI tool was used for experimental design, data generation, statistical analysis, independent scientific interpretation, image generation, or figure preparation. The authors assume full responsibility for the final content.
Credit author statement
Qi Zhang: Resources, Methodology, Writing–original draft. Xue–heng Sun: Resources, Visualization, Writing–review & editing. Liyan Huang: Resources. Lin Guo: Resources, Project administration. Peiyun Liu: Resources, Project administration. Rui Zheng: Resources, Project administration. Qianqian Zhan: Resources, Investigation. Xiaoqing Tan: Resources, Investigation. Ye Yao: Resources, Investigation. Chunyan Li: Resources. Kai Xiong: Funding acquisition. Zhan–You Wang: Funding acquisition, Writing–review & editing, Project administration. Wenqiang Cao: Conceptualization, Funding acquisition, Writing–review & editing, Project administration.
Data availability statement
The raw data supporting the findings of this study are available from the corresponding author upon reasonable request. The MALDI-MSI raw data have been deposited in the Harvard Dataverse (https://doi.org/10.7910/DVN/JJDFXU) and github with links provided in the supplementary materials.
Competing Interests
The authors have declared that no competing interest exists.
References
1. Lo JA, Fisher DE. The melanoma revolution: from UV carcinogenesis to a new era in therapeutics. Science. 2014;346:945-9
2. Schadendorf D, van Akkooi ACJ, Berking C, Griewank KG, Gutzmer R, Hauschild A. et al. Melanoma. Lancet. 2018;392:971-84
3. Kalantri S, Pachika P, Jones T, Kong M, Kloecker G, Chesney J. Survival Outcomes in Stage III to IV Melanoma Before and After the Immunotherapy Era: Persistent Racial and Socioeconomic Disparities. JCO Oncol Pract. 2026;22:1643-53
4. Bian X, Liu R, Meng Y, Xing D, Xu D, Lu Z. Lipid metabolism and cancer. J Exp Med. 2021 218
5. Liu Q, Luo Q, Halim A, Song G. Targeting lipid metabolism of cancer cells: A promising therapeutic strategy for cancer. Cancer lett. 2017;401:39-45
6. Snaebjornsson MT, Janaki-Raman S, Schulze A. Greasing the Wheels of the Cancer Machine: The Role of Lipid Metabolism in Cancer. Cell Metab. 2020;31:62-76
7. Ma X, Botros A, Yun SR, Park EY, Kim O, Park S. et al. Ultrahigh resolution lipid mass spectrometry imaging of high-grade serous ovarian cancer mouse models. Front Chem. 2023;11:1332816
8. Schwaiger-Haber M, Stancliffe E, Anbukumar DS, Sells B, Yi J, Cho K. et al. Using mass spectrometry imaging to map fluxes quantitatively in the tumor ecosystem. Nat Commun. 2023;14:2876
9. Novelle MG, Wahl D, Diéguez C, Bernier M, de Cabo R. Resveratrol supplementation: Where are we now and where should we go? Ageing Res Rev. 2015;21:1-15
10. Rauf A, Imran M, Butt MS, Nadeem M, Peters DG, Mubarak MS. Resveratrol as an anti-cancer agent: A review. Crit Rev Food Sci Nutr. 2018;58:1428-47
11. Yu X, Dai Y, Zhao Y, Qi S, Liu L, Lu L. et al. Melittin-lipid nanoparticles target to lymph nodes and elicit a systemic anti-tumor immune response. Nat Commun. 2020;11:1110
12. Wang K, Zhang X, Liu Y, Liu C, Jiang B, Jiang Y. Tumor penetrability and anti-angiogenesis using iRGD-mediated delivery of doxorubicin-polymer conjugates. Biomaterials. 2014;35:8735-47
13. Paul B, Gaonkar RH, Dutta D, Dasi R, Mukherjee B, Ganguly S. et al. Inhibitory potential of iRGD peptide-conjugated garcinol-loaded biodegradable nanoparticles in rat colorectal carcinoma. Biomaterials Adv. 2022;134:112714
14. Chuckran CA, Liu C, Bruno TC, Workman CJ, Vignali DA. Neuropilin-1: a checkpoint target with unique implications for cancer immunology and immunotherapy. J Immunothe Cancer. 2020 8
15. Zhang Q, Li Y, Sui P, Sun XH, Gao Y, Wang CY. MALDI mass spectrometry imaging discloses the decline of sulfoglycosphingolipid and glycerophosphoinositol species in the brain regions related to cognition in a mouse model of Alzheimer's disease. Talanta. 2024;266:125022
16. Zhang Q, Zhang X, Yang B, Li Y, Sun XH, Li X. et al. Ligustilide-loaded liposome ameliorates mitochondrial impairments and improves cognitive function via the PKA/AKAP1 signaling pathway in a mouse model of Alzheimer's disease. CNS Neurosci Ther. 2024;30:e14460
17. Bariwal J, Ma H, Altenberg GA, Liang H. Nanodiscs: a versatile nanocarrier platform for cancer diagnosis and treatment. Chem Soc Rev. 2022;51:1702-28
18. Louie SM, Roberts LS, Mulvihill MM, Luo K, Nomura DK. Cancer cells incorporate and remodel exogenous palmitate into structural and oncogenic signaling lipids. Biochim Biophys Acta. 2013;1831:1566-72
19. Bitencourt-Ferreira G, Pintro VO, de Azevedo WF Jr. Docking with AutoDock4. Methods Mol Biol. 2019;2053:125-48
20. He DL, Zhang XY, Su JY, Zhang Q, Zhao LX, Wu TY. et al. Identification of AS1842856 as a novel small-molecule GSK3α/β inhibitor against Tauopathy by accelerating GSK3α/β exocytosis. Aging cell. 2025;24:e14336
21. Luo X, Zheng E, Wei L, Zeng H, Qin H, Zhang X. et al. The fatty acid receptor CD36 promotes HCC progression through activating Src/PI3K/AKT axis-dependent aerobic glycolysis. Cell Death Dis. 2021;12:328
22. Liu LZ, Wang B, Zhang R, Wu Z, Huang Y, Zhang X. et al. The activated CD36-Src axis promotes lung adenocarcinoma cell proliferation and actin remodeling-involved metastasis in high-fat environment. Cell Death Dis. 2023;14:548
23. Tan SX, Chong S, Rowe C, Galbraith J, Dight J, Zhou C. et al. Lymphatic expression of the proliferation marker Ki67 is linked to sentinel node positivity, recurrence and mortality in primary cutaneous melanoma. Exp Dermatol. 2024;33:e15041
24. Murar M, Vaidya A. Cancer stem cell markers: premises and prospects. Biomarkers Med. 2015;9:1331-42
25. Su WY, Tian LY, Guo LP, Huang LQ, Gao WY. PI3K signaling-regulated metabolic reprogramming: From mechanism to application. Biochim Biophys Acta Rev Cancer. 2023;1878:188952
26. Davies MA. The role of the PI3K-AKT pathway in melanoma. Cancer J. 2012;18:142-7
27. Li YJ, Zhang C, Martincuks A, Herrmann A, Yu H. STAT proteins in cancer: orchestration of metabolism. Nat Rev Cancer. 2023;23:115-34
28. Fan Y, Zhang R, Wang C, Pan M, Geng F, Zhong Y. et al. STAT3 activation of SCAP-SREBP-1 signaling upregulates fatty acid synthesis to promote tumor growth. J Biol Chem. 2024;300:107351
29. Vanauberg D, Schulz C, Lefebvre T. Involvement of the pro-oncogenic enzyme fatty acid synthase in the hallmarks of cancer: a promising target in anti-cancer therapies. Oncogenesis. 2023;12:16
30. Gong D, Arbesfeld-Qiu JM, Perrault E, Bae JW, Hwang WL. Spatial oncology: Translating contextual biology to the clinic. Cancer Cell. 2024;42:1653-75
31. Deng C, Zhang Q, Fu Y, Sun X, Gong T, Zhang Z. Coadministration of Oligomeric Hyaluronic Acid-Modified Liposomes with Tumor-Penetrating Peptide-iRGD Enhances the Antitumor Efficacy of Doxorubicin against Melanoma. ACS Appl Mater Interfaces. 2017;9:1280-92
32. Dai W, Fan Y, Zhang H, Wang X, Zhang Q, Wang X. A comprehensive study of iRGD-modified liposomes with improved chemotherapeutic efficacy on B16 melanoma. Drug Deliv. 2015;22:10-20
33. Gabizon AA, Gabizon-Peretz S, Modaresahmadi S, La-Beck NM. Thirty years from FDA approval of pegylated liposomal doxorubicin (Doxil/Caelyx): an updated analysis and future perspective. BMJ Oncol. 2025;4:e000573
34. Zheng J. Energy metabolism of cancer: Glycolysis versus oxidative phosphorylation (Review). Oncol Lett. 2012;4:1151-7
35. Rodríguez-Enríquez S, Marín-Hernández A, Gallardo-Pérez JC, Carreño-Fuentes L, Moreno-Sánchez R. Targeting of cancer energy metabolism. Mol Nutr Food Res. 2009;53:29-48
36. Saito Y, Li L, Coyaud E, Luna A, Sander C, Raught B. et al. LLGL2 rescues nutrient stress by promoting leucine uptake in ER(+) breast cancer. Nature. 2019;569:275-9
37. Li H, Bullock K, Gurjao C, Braun D, Shukla SA, Bossé D. et al. Metabolomic adaptations and correlates of survival to immune checkpoint blockade. Nat Commun. 2019;10:4346
38. Engel AL, Lorenz NI, Klann K, Münch C, Depner C, Steinbach JP. et al. Serine-dependent redox homeostasis regulates glioblastoma cell survival. Br J Cancer. 2020;122:1391-8
39. Ma X, Fernández FM. Advances in mass spectrometry imaging for spatial cancer metabolomics. Mass Spectrom Rev. 2024;43:235-68
40. Zhang Q, Wu ZH, Zhao SS, Yang J, Chen L, Wang XY. et al. Identification and Spatial Visualization of Dysregulated Bile Acid Metabolism in High-Fat Diet-Fed Mice by Mass Spectral Imaging. Front Nutr. 2022;9:858603
Author contact
Corresponding authors: Zhan–you Wang, Wenqiang Cao, Kai Xiong, Chunyan Li. wqcaoedu.cn; wangzyedu.cn; nmglyzyyxkcom; chyliedu.cn.