Impact Factor




Theranostics 2027; 17(1):60-82. doi:10.7150/thno.133688 This issue Cite
Research Paper
Spatial multi-omics uncovers distinct transcriptional and metabolic responses to AR-NTD degradation in CRPC
Ashish Tyagi1, Balaji Chandrasekaran1, Vaibhav Shukla1, Devanarayanan T Nair1, Bhawna Tyagi1, Amandeep Singh5, Kim Sunja2, Erin H Seeley3, Arhit Chakrabarti4, Yang Ni4, Arun K Sharma5, Chendil Damodaran1 
1. Irma Lerma Rangel College of Pharmacy, Texas A&M University, College Station, Texas, USA.
2. Texas A&M Institute for Genome Science and Society, Texas A&M University, College Station, Texas, USA.
3. Department of Chemistry, The University of Texas at Austin, Texas, USA.
4. Department of Statistics and Data Science, The University of Texas at Austin, Texas, USA.
5. Department of Molecular and Precision Medicine, Penn State Cancer Institute, Penn State College of Medicine, Hershey, PA, USA.
Received 2026-2-28; Accepted 2026-9-25; Published 2027-1-1
Abstract
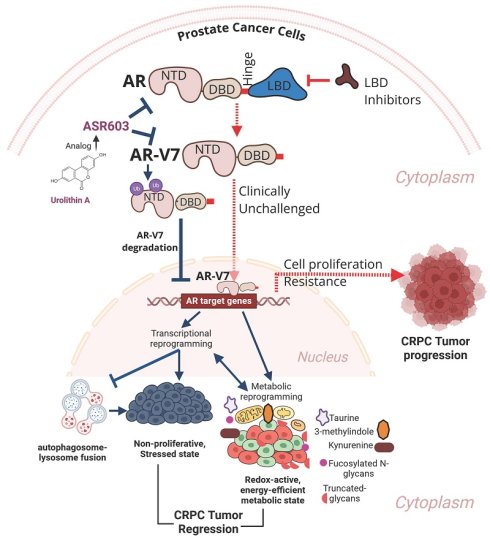
Rationale: Castration-resistant prostate cancer (CRPC) remains incurable with current androgen deprivation therapies. Mutations in the Androgen Receptor (AR), splice variants such as AR-V7 that retain the N-terminal domain (NTD) of AR, along with significant intratumoral heterogeneity sustain AR signaling and drive therapeutic resistance. Consequently, the persistent AR⁺/PSA⁺ subpopulations keep supporting tumor growth and facilitates lineage plasticity. Therefore, therapies capable of degrading both full-length AR and AR variants while reprogramming the broader tumor ecosystem are critically needed.
Methods: A potent UroA analog, ASR603 (3-hydroxy-8-methoxy-6H-dibenzo[b,d]pyran-6-one), was synthesized that bind and degraded the AR-NTD in CRPC cells. In vivo efficacy was evaluated in 22Rv1 xenografts in both castrated and noncastrated mice, as well as in a patient-derived xenograft (PDX) model treated orally with ASR603. Mechanistic investigations employed imaging mass cytometry (CyTOF), Visium-based spatial transcriptomics, mass spectrometry–based ubiquitinomics and spatially resolved mass spectrometry imaging (MSI) based metabolomics, as well as glycomics to characterize AR-dependent subpopulations, ubiquitination sites, and metabolic rewiring.
Results: ASR603 selectively inhibited the viability and anchorage-independent growth of AR⁺ and AR-V7⁺ CRPC cells, including enzalutamide-resistant cells, while sparing nonmalignant RWPE-1 cells. ASR603 reduced the AR, AR-V7, and PSA expression confirming specific inhibition of the AR signaling. In both castrated and noncastrated 22Rv1 xenografts as well as PDX model, oral ASR603 significantly inhibited tumor growth and decreased AR, PSA, and Ki-67 expression, demonstrating potent antitumor activity independent of systemic androgen levels. Single-cell imaging mass cytometry of PDX tumors demonstrated selective depletion of AR⁺/PSA⁺ luminal clusters, with concomitant reduction in HOXB13 expression but retention of E-cadherin. AR-low regions were characterized by high Hsp70, low Ki-67, and morphological disorganization, consistent with a stress-adapted, low-proliferative tumor state. Spatial transcriptomics identified an AR-low cluster with broad loss of AR targets and proliferation genes, as well as enrichment of autophagy, lysosomal, mTOR, and ubiquitin-mediated proteolysis pathways Mechanistic analyses demonstrated that ASR603 promotes ubiquitin–proteasome mediated degradation of AR and AR-V7 via N-terminal ubiquitination sites (K301 and K313). ASR603 treatment was also associated with metabolic rewiring characterized by altered tryptophan and taurine related metabolites that inversely correlated with tumor burden. These findings indicate metabolic dysfunction in AR-depleted tumor regions.
Conclusion: ASR603, an AR degrader, targeted N-terminal ubiquitination sites to eliminate AR⁺/PSA⁺ and AR-V7⁺ subpopulations thereby disrupting the AR-dependent luminal programs. These alterations induce an integrated stress response that reprograms CRPC tumors into a stress-adapted, metabolically dysfunctional, and structurally compromised state. These findings support AR-NTD directed degradation as a promising theranostic strategy for reshaping the CRPC tumor ecosystem and for defining metabolic response signatures in advanced prostate cancer.
Keywords: CRPC, AR, AR-V7, tumor heterogeneity, spatial multiomics, stress-response, defective autophagy, spatial metabolomics
Introduction
Prostate cancer (CaP) incidence continues to increase by 3% and it was estimated 35,770 patients would die of this disease in 2025 [1, 2]. While most CaP patients initially respond to androgen deprivation therapy (ADT) [1, 3, 4], up to 40-50% of patients progress to a more aggressive, treatment-refractory form known as castration-resistant prostate cancer (CRPC) within 2–3 years of treatment [5-10].
A key driver of CRPC is the reactivation of androgen receptor (AR) signaling within the low-androgen setting induced by ADT [11, 12]. This adaptation is often involves increased expression of AR splice variants, particularly AR-V7, which retains exon 1-3 along with a cryptic exon 3 that encompassing the N-terminal transactivation (NTD) and the DNA-binding domain (DBD) but lacks the C-terminal ligand-binding domain (LBD) with exons 4-8 [13, 14]. These structural features allow AR-V7 to be constitutively localized in the nucleus and drive oncogenic transcriptional programs even in the absence of androgen [15, 16]. This activity facilitates tumor growth and confers resistance to standard antiandrogens, such as enzalutamide and abiraterone, which primarily target the AR LBD [13, 14, 17-19].
Beyond AR activity, CRPC tumors comprise diverse cellular subpopulations with varying lineage identities and proliferative potentials [20-22]. Among these cellular subpopulations, AR⁺/AR-V7+/Prostate Specific Antigen (PSA)+ luminal epithelial cells, although representing a minority population of the cells, serve as dominant drivers of AR-mediated oncogenic signaling [20, 23]. These cells maintain proliferative capacity while influencing neighboring cells through paracrine signaling [24-27] and metabolic alterations [28].
Therapies that can simultaneously and effectively target AR and AR-V7-dependent signaling pathways are required in CRPC. One promising approach involves targeting the AR NTD, which is needed for transcriptional activity of full-length AR as well as AR-V7 [29-32]. However, the highly disordered and flexible nature of AR-NTD poses significant challenges in drug development. Among emerging small molecules, Urolithin A (UroA), a natural microbial metabolite derived from ellagic acid by gut microbiota, has shown promise as an AR signaling inhibitor [33-35]. UroA suppresses AR expression and impairs downstream transcriptional targets, resulting in inhibition of CRPC cell proliferation [33, 36]. Despite promising preclinical findings, clinical translation of UroA has been limited by poor plasma bioavailability, high dose requirements, and suboptimal potency [34].
To overcome these limitations, ASR603, a potent UroA-based analog, was developed to simultaneously degrade AR and AR-V7 with improved pharmacologic properties. Its impact on the tumor microenvironment’s transcriptional and metabolic landscape was analyzed. Using integrated single-cell proteomics, spatial transcriptomics, and metabolomic imaging, ASR603 was shown to target and deplete AR⁺/PSA⁺ luminal tumor cells inducing metabolic collapse and spatial reprogramming within the tumor microenvironment. These findings indicate that targeting AR-dependent niches is sufficient to drive significant tumor regression in CRPC, revealing new metabolic vulnerabilities that may be exploited by targeting AR-V7. This approach offers a potential theranostic strategy for overcoming AR-V7-driven proliferation through the multimodal disruption of CRPC tumor architecture.
Methods
ASR603 synthesis
Synthesis of ASR603 (3-hydroxy-8-methoxy-6H-dibenzo[b,d]pyran-6-one): ASR603 was synthesized following a previously reported method [37]. Briefly, 15 mL of water was added to a mixture of 2-hydroxy-5-methoxybenzoic acid (15 mmol), resorcinol (29 mmol), and NaOH (29 mmol), and the mixture was refluxed for 30 min. A 5% CuSO4 solution (6.2 mL) was added, and the reaction mixture was further refluxed for 1 h. The reaction progress was monitored by TLC. After completion reaction mixture was maintained at room temperature followed with filtration and washing with water to obtain the crude material, which was purified with column chromatography (stationary phase: silica gel and mobile phase: 5% MeOH:CH2Cl2). The yield was 80%, and the material was a light orange solid (m.p 263–265 °C, 1H NMR (500 MHz, DMSO-d6) d 10.21 (s, 1H), 8.21 (d, J = 9.0 Hz, 1H), 8.09 (d, J = 9.0 Hz, 1H), 7.61 (s, 1H), 7.59 (d, J = 8.5 Hz, 1H), 6.83 (d, J = 9.0 Hz, 1H), 6.75 (d, J = 2.5 Hz, 1H), 3.89 (s, 3H)).
Cell lines, culture conditions, and reagents
The LNCaP (AR⁺, PSA⁺; androgen-sensitive, localized-like CaP), C4-2B (AR⁺, bone-metastatic CRPC, derived from LNCaP), ENZ-C4-2B (enzalutamide-resistant C4-2B subline), 22Rv1 (AR⁺/AR-V7⁺, androgen-independent CRPC), VCaP (AR⁺/ERG⁺, CRPC derived from vertebral metastasis), DU145 (AR⁻, PSA⁻; androgen-independent, brain metastasis), and RWPE-1 (nonmalignant human prostate epithelial cells) cell lines were used in this study. All cell lines were obtained from American Type Culture Collection (Manassas, VA, USA) or ViroMed Laboratories (Minneapolis, MN, USA) and authenticated using STR profiling. Mycoplasma testing was performed routinely. The cells were cultured in RPMI-1640 medium or DMEM/F12 (depending on the cell line) along with 10% fetal bovine serum (FBS) and 1% penicillin–streptomycin and maintained at 37°C with 5% CO₂. Cycloheximide (CHX), Dihydrotestosterone (DHT), chloroquine (CQ), and MG132 were purchased from Sigma (St. Louis, MO). Working concentrations of DHT (100nM), CHX/CQ (50 µM) and MG132 (10 µM) was used for experiments.
Dose response assays
For screening and dose–response experiments, the 5000 cells were seeded per well and incubated overnight in 96-well plates. The cells were then treated with ASR603 up to 12.5 µM or vehicle (0.1% DMSO) for 24 h. After treatment, MTT assay (Sigma) was performed for cell viability, following the manufacturer’s protocol. The absorbance (at 570 nm) was measured using a SpectraMax i3x plate reader (Molecular Devices), and the data were normalized to those of the vehicle control. Half-maximal inhibitory concentration (IC50) values were calculated using compusyn (ComboSyn, Inc.) and nonlinear regression analysis (four-parameter logistic model) in GraphPad Prism 9.0. Each experiment was performed in triplicate and repeated independently at least twice.
Surface plasmon resonance (SPR) analysis
SPR analysis was performed using a Biacore3000 instrument (Cytiva). AR protein (110 kDa; 0.53 mg/mL) was added to buffer containing 20 mM Tris-HCl, 0.2 M NaCl, 10% glycerol, 10 mM DTT, and 10 μM zinc acetate and then immobilized on a CM5 sensor chip via standard amine coupling chemistry. Prior to analyte injection, the Biacore system was equilibrated and washed with PBS buffer containing 0.5% (v/v) DMSO. ASR603 (molecular weight: 242.23 kDa) was dissolved in ethanol or DMSO, and serial dilutions were prepared to obtain a range of analyte concentrations. The binding experiments were performed under the following conditions: an analyte injection contact time of 120 s, a dissociation phase of 30 s, and a flow rate of 30 μL/min. A separate flow cell without immobilized protein served as a reference to account for nonspecific binding and refractive index changes. Sensorgrams were generated in real time and analyzed using BIAevaluation software (Cytiva) using default parameters, to determine kinetic parameters, including the association rate (ka), dissociation rate (kd), and equilibrium dissociation constant (KD). More details are provided in the supplementary methods.
Western blotting and immunoprecipitation analysis
The above-mentioned cells were plated into 6-well culture dishes at approximately 2×10⁵ cells/well. After overnight incubation, the cells were treated with ASR603 (at the respective IC50) and with DMSO as vehicle, in fresh medium. The cells were then lysed 24, 48 and 72 h after treatment using lysis buffer (RIPA; Thermo Fisher Scientific; Cat# 89900), and complete protease inhibitor cocktail (Thermo Fisher Scientific; Cat# 87786) was added according to the manufacturer’s protocol. The cell lysates were incubated on ice for 30 min and centrifuged for 15 min at 12,000 g. The supernatant was harvested, and the total protein concentration obtained from the lysate was quantified using a Pierce BCA assay kit (Cat# 23225: Thermo Fisher Scientific, CA, USA). Sample buffer (4X) was added to the cell lysates (40 µg), which were subsequently loaded onto 8–14% SDS–PAGE gels (Cat# 4561084; Bio-Rad, CA, USA). The proteins were electrotransferred onto polyvinylidene fluoride (PVDF) membranes (Cat# 1620177, Bio-Rad) and probed with antibodies mentioned in Supplementary Table 5. The blots were developed using an enhanced chemiluminescence (ECL) substrate (Cat# 1705060S, Bio-Rad). For immunoprecipitation experiments, protein samples obtained following protein extraction from ASR603-treated 22Rv1 cells, using radioimmunoprecipitation assay (RIPA) buffer were immunoprecipitated with an anti-AR-V7 antibody (Cat# 196725, Cell Signaling Technology, USA) at 4 °C with agitation overnight; the immunoprecipitated proteins were then pulled down with protein A/G-agarose beads (Cat# 20421, Thermo Fisher Scientific, CA, USA) at 4°C with rotary agitation for 3 h. Following washing of the immunoprecipitates, centrifuged pellets were resuspended in sample buffer and heated for 5 min at 95 °C for SDS–PAGE followed by immunoblot analysis as mentioned in detail above.
Immunofluorescence analysis
Immunofluorescence staining for AR (Androgen Receptor (D6F11) XP® Rabbit mAb #5153) and AR-V7 (EPR15656-290, ab273500) was performed on control or ASR603-treated cells as described previously [38]. Briefly, C4-2B and 22Rv1 cells (5000/well) were seeded in eight-well culture slides (Corning, USA). Cells were grown to ~ 60% confluence and treated with vehicle or ASR603 for 12 hours, followed with washing and incubation with AR and AR-V7 antibodies. For LC3B and lysosomal-associated membrane protein 1 (LAMP1) fusion experiments to evaluate autophagy, ASR603-treated as well as DMSO-treated C4-2B cells, seeded in Falcon eight-well culture slides, were fixed with 4% paraformaldehyde, permeabilized with 0.5% Triton X-100, blocked with 5% goat serum, followed with incubation with LC3B (ab225383 and ab225382) and LAMP1 (ab302684) conjugated antibodies from Abcam at 4 °C overnight and mounted with mounting medium containing DAPI, and Luminosa microscope (PicoQuant; Berlin, Germany), was used to capture images followed with calculation of Pearson coefficients with ImageJ and the JACoP plugin [39].
Real-time quantitative PCR
Qiagen RNeasy Kit (Hilden, Germany) was used for total RNA extraction followed with DNase I treatment (Cat# EN0521; Thermo Fisher, USA) and reverse transcription (iScript Reverse Transcription Supermix: Cat# 1708840; Bio-Rad, USA). qPCR was performed using SsoAdvanced Universal SYBR Green Supermix (Cat# 1725270; Bio-Rad, USA) and primers mentioned in Table S6. The qPCR conditions are mentioned in Supplementary Methods. Normalization was done with β-actin gene expression, the primer sequence of which is included in Table S6 as well.
Detection of apoptosis by flow cytometry
Flow cytometry analysis was performed with Annexin V–fluorescein isothiocyanate (FITC) and propidium iodide (PI) (BD Pharmingen™ FITC Annexin V Apoptosis Detection Kit I, BD Pharmingen, San Diego, CA, USA). Briefly, Cells were grown in 6 well plates and treated for 24 h followed with resuspension in Annexin V binding buffer (1 × 10⁶ cells/ml). These cells were incubated with Annexin V–FITC and PI for 15 min at room temperature in the dark and immediately analyzed by flow cytometry (BD FACSCalibur™). The data were analyzed with FloJoTM v10, and bi-parametric dot plots of Annexin V–FITC against PI were generated. The percentages of apoptotic cells were extracted from the dot plots and are presented in bar graphs.
Cell invasion and migration assays
Boyden chambers equipped with polyethylene terephthalate membranes with 8 μm pores were used to calculate the number of cells that were able to cross the membrane in the control and ASR603(IC50)-treated groups after 24 h of treatment. Approximately 5 × 10⁴ cells per chamber were layered on Matrigel (Corning BioCoat™ Matrigel Invasion Chamber, Bedford, MA, USA) and incubated for 24 h. Cotton swab was used to remove cells that remained in the upper chamber followed with crystal violet staining [40]. Invaded cells were counted using an AMG-EVOS digital inverted microscope. For the wound healing migration assay, 22Rv1 and C4-2B cells were grown to confluency in 6-well plates followed with a linear wound in monolayers using a sterile pipette tip followed by a wash step. Images of each well were recorded immediately and again 24 h after wound generation. The distance that the cells migrated through the wounded area was determined by ImageJ (Version 1.54p).
Plasma stability assay
The in vitro plasma stability of ASR603 was evaluated in both mouse and human plasma, each anticoagulated with heparin sodium (mouse plasma, lot# M-89-160; human plasma, lot# H-038-001). ASR603 stock solutions were prepared at 10 mM in DMSO and diluted to appropriate working concentrations. Reactions were initiated by adding ASR603 to plasma that was preequilibrated at 37 °C. Samples were collected at predefined time points (0, 15, 30, 60, and 120 min), quenched with acetonitrile containing an internal standard (tolbutamide, 100 ng/mL), and centrifuged. The supernatants were mixed with an equal volume of water and analyzed via LC–MS/MS. A positive control, propantheline, was included for quality assurance. The elimination rate constant (k) and half-life (t1/2) were determined using nonlinear regression (Ct = C₀ × e(-kt)) based on the ratio of the analyte peak area to the internal standard peak area. Detailed method is provided in Supplementary Methods.
Soft agar colony formation assay
Colony formation assay with a CytoSelect™ 96-well in vitro tumor sensitivity assay kit (Cell Biolabs, Inc., San Diego, CA) was performed to analyze anchorage-independent growth. C4-2B and 22Rv1 cells (5 × 10³ cells) were harvested, and the assay was performed according to the manufacturer’s instructions followed with crystal violet (0.005%) staining and counting after 10 days.
Animal studies
Six to eight-week-old BALB/c male athymic nude mice (nu/nu), purchased from the Jackson Laboratory (Bar Harbor, ME, USA) were used for xenograft studies. Four-week-old male NOD-SCID mice, implanted with patient derived tumor fragments, were purchased from the Jackson Laboratory (Bar Harbor, ME, USA) for PDX experiment. All the animal studies were approved by the Institutional Animal Care and Use Committee (IACUC) at Texas A&M University and were performed in accordance with institutional and national guidelines. At the end of the experiment, we euthanized the mice under anesthesia using a method approved by the animal ethics committee (IACUC 2024-0020 DM).
Subcutaneous xenografts in noncastrated and castrated mice
Castrated and noncastrated BALB/c male athymic nude mice (nu/nu) mice (6-week-old) purchased from Jackson laboratory, were subcutaneously injected in the flank with 2 × 10⁶ 22Rv1 cells suspended in a 1:1 mixture of Matrigel (purchased from Corning (NY, USA)) and RPMI medium (total volume 100 μl). The mice were randomized into treatment and vehicle groups (Two groups: ASR603 and 1% DMSO: n = 6 per group) once the tumors reached ~ 50 mm³. ASR603 (20 mg/kg) or vehicle (1% DMSO) was administered through oral gavage, and the tumors were measured with digital calipers, after which the tumor volumes were calculated using the following formula: volume = (length × width²)/2. Immunohistochemical staining for Ki-67 (Cat# ab15580, Abcam, Waltham, MA, US), AR (Cat# 5153S, Cell Signaling Technology, USA) and PSA (Cat# 2475S, Cell Signaling Technology, USA) in vehicle control- and ASR603-treated xenograft tumors was performed.
PDX mice study
PDX model of prostate cancer PDX mice (TM00298) purchased from Jackson laboratory, were randomly divided into two groups: the ASR603 (50 mg/kg) group and the vehicle group, when the volume of the tumor was with ASR603 or vehicle by oral gavage. At the end of the experiment, the mice were euthanized, and the tumors were collected, imaged, weighed and analyzed via hematoxylin and eosin (H&E) staining or immunohistochemistry (IHC). Immunohistochemical analyses were performed to assess Ki-67, AR and PSA expression in vehicle control- and ASR603-treated PDX tumors.
Cytometry time of flight (CyTOF) analysis of FFPE tumor sections
Selected monoclonal antibodies against AR, KLK3 (PSA), HOXB13, HSP70, USP14, UBE2J1, MDM2, and TRAF4 were conjugated with lanthanide-loaded polymer chelates using the Maxpar® Antibody Labeling Kit (Standard BioTools) according to the manufacturer’s instructions. Briefly, purified carrier-free antibodies were buffer-exchanged into labeling buffer, partially reduced with TCEP, and conjugated to lanthanide-loaded polymer chelates. The conjugated antibodies were washed to remove unconjugated metal, the concentrations were determined spectrophotometrically (using a NanoDrop spectrophotometer at 280 nm), and the final products were stored at 4 °C. The antibodies were titrated on control formalin-fixed, paraffin-embedded (FFPE) tissue sections to determine the optimal staining concentrations, ensuring signal-to-noise optimization and the preservation of antigen specificity. Details of the antibodies, metal labeling procedure and concentrations used are provided in Table S2.
FFPE sections of PDX tumors (4 μm thickness) were mounted onto poly-L-lysine–coated slides and baked at 60 °C for 1 h. After deparaffinization in xylene, these samples were rehydrated through a graded ethanol series and subjected to antigen retrieval in citrate buffer (pH 6.0) at 95–100 °C for 40 min, following an adapted in-house protocol. After cooling, sections were blocked with 3% BSA in TBS and incubated overnight at 4 °C with a cocktail of metal-conjugated antibodies (details provided in the Supplementary methods). After the slides were washed, they were dipped in ddH₂O and air-dried at room temperature for at least 20 min. The stained sections were ablated using a Hyperion™ Imaging System (Standard BioTools) coupled to a Helios™ mass cytometer. Regions of interest (ROI) were selected based on corresponding hematoxylin and eosin (H&E) and immunohistochemistry (IHC) reference sections to capture representative AR-high and AR-low tumor areas. Laser ablation was performed at 0.2 x 0.2 μm resolution with a frequency of 200 Hz. This study was done at MDACC NORTH Campus Flow Cytometry and Cellular Imaging Core Facility. The raw .mcd files were processed using MCD Viewer. Spatial segmentation and phenotyping were conducted using supervised gating strategies followed by unsupervised clustering. Data visualization included Uniform Manifold Approximation and Projection (UMAP), t-distributed stochastic neighbor embedding (t-SNE), and quantitative intensity mapping of key markers, including AR, KLK3, HOXB13, HSP70, Ki67, TRAF4, and E-Cadherin.
Spatial transcriptomic analysis
PDX tumors from the control and ASR603-treated groups were harvested at the endpoint and subjected to the “Separate Freezing and Embedding” protocol from the Visium spatial protocols-tissue preparation guide. Sections (10 µM thick) were mounted onto Visium Spatial Gene Expression slides (10x Genomics) following the manufacturer’s recommendations. Adjacent sections were subjected to H&E staining to allow histological and molecular cross-validation. The slides were processed according to the Visium Spatial Gene Expression User Guide for fresh frozen samples. Briefly, the sections were fixed in cold methanol, stained with H&E, imaged, and then subjected to permeabilization. The released mRNA was captured by spatially barcoded probes, followed by reverse transcription and second-strand synthesis directly on the slide. The spatially barcoded cDNA was then amplified and converted into sequencing libraries using the Visium Spatial Library Construction Kit. The final libraries were sequenced on an Illumina NovaSeq 6000 platform to achieve a sequencing depth of approximately 50,000–100,000 read pairs per capture spot. Brightfield images of H&E-stained sections were acquired using a Leica Aperio AT2 scanner. Images were aligned to the spatial array fiducial markers for spot registration using 10x Genomics Space Ranger v2.0.0. Spots falling within annotated tissue areas were retained for downstream analysis.
The tumor regions were manually annotated on the basis of their histological features and cross-referenced with the corresponding IHC profiles. The raw sequencing reads were processed using Space Ranger (v2.0.0) with default settings and aligned to the GRCh38 human reference genome.
Gene expression matrices were imported into Seurat v4.1.0 (R package) for normalization, dimensionality reduction, clustering, and visualization. Data were normalized using SCTransform and integrated across samples. Clustering was performed using Louvain clustering at a resolution of 0.5, and dimensionality reduction was visualized using UMAP and tSNE projections. Differential expression analysis between clusters and treatment groups was performed using the Wilcoxon rank-sum test with Bonferroni correction. Dot plots, violin plots, and heatmaps were generated using Seurat functions to visualize the gene expression patterns. Spotwise AR and KLK3 expressions were visualized spatially over H&E images using Seurat’s SpatialFeaturePlot function (details in supplementary methods).
Cluster-specific pathway enrichment was performed by extracting marker genes from AR-high and AR-low clusters and subjecting these genes to KEGG pathway enrichment performed using DAVID tools with cutoff of Bonferroni <0.05. Venn diagrams were generated using the Venn Diagram R package. Publicly available ChIP-seq datasets for androgen receptor (AR) in 22Rv1 CaP cells were obtained from the ChIP-Atlas database [41]. Differentially expressed genes (DEGs) identified from spatial RNA sequencing were compared with AR-ChIP-seq data to identify AR- regulated genes and then subjected to correlation analysis using R Studio to assess their relationship with AR and co-regulation patterns. Pathway enrichment analysis of differentially expressed genes was performed using clusterProfiler (v4.0.2), referencing the KEGG and Gene Ontology databases.
Spatial metabolomics and glycan analysis
Metabolite data was collected in negative ion mode at 20 μm resolution using a Bruker timsTOF fleX QTOF mass spectrometer over the m/z range 50-600. Glycan image data were collected from the same ROIs in positive ion mode on the timsTOF at 20 μm resolution over the m/z range 700-3500 with 200 laser shots summed per pixel. Instrument acquisition parameters and detailed method are included in the supplementary methods.
All small regions of the same regions type for the same tissue were combined to a single region per tissue for analysis. Wilcoxon rank sum tests were performed to compare the same region type between samples.
Ubiquitination analysis
Purified recombinant human AR-NTD (a.a. 1-669) was purchased from Creative Biomart (Product ID: AR-003H), and the AR-LBD was procured from Abcam (Cat# ab235857). Abcam Ubiquitylation Assay Kit (ab139467) was used and TRAF4 was purchased separately (Proteintech: Cat# Ag29685). A total of 25 µg of purified protein was mixed with 100 µM ASR603 solubilized in 1% DMSO in kit buffer and incubated as per manufacturer protocol. Reaction was terminated by adding SDS to 1% (final) and N-ethylmaleimide (NEM, 10–20 mM) and heating 5 min at 95 °C to preserve Ub conjugates. Vehicle (1% DMSO) and reaction without ATP were used as negative control. Anti-AR and anti-ubiquitin antibodies were used to confirm ubiquitination of AR-NTD. SDS-PAGE followed with Coomassie stain was used to excise bands representing monoubiquitinated AR and sent for analysis at a commercial company Creative Proteomics (Shirley, NY 11967, USA).
Briefly, protein samples (purified protein incubated with 1% DMSO or ASR603) were digested with trypsin. The resulting peptides were extracted and analyzed using an Ultimate 3000 nano UHPLC system coupled with a Q Exactive HF mass spectrometer (Thermo Fisher Scientific, USA). Peptides were separated on a PepMap C18 column with a linear gradient of acetonitrile and detected in Top 20 mode. The data were analyzed using PEAKS STUDIO 8.5 with the following parameters: carbamidomethylation, oxidation, and ubiquitin modifications, trypsin specificity, and mass tolerances of 10 ppm for precursors and 0.5 Da for MS/MS (a detailed method is provided in the Supplemental Methods).
Cloning and transfection of mutant plasmids
Synthetic genes with the K301R or K313R mutation (AR NTD-mutant 1 and 2, respectively; (detailed sequences are included in the Supplementary Methods) were cloned and inserted into the pcDNA3.1(-) vector with an N-terminal 8xHis tag with EcoRI/BamHI. The recombinant vectors were eluted in 20 µl of nuclease-free water and used for transfection in HEK-293T cells. HEK-293T cells were transiently transfected with the expression plasmids, using Lipofectamine 2000 (Thermo Fisher Scientific, USA) as transfection reagent according to the manufacturer’s instructions. After 48 hours of transfection, the transfected HEK-293T cells were treated with DMSO or ASR603 (3 µM), and total protein was extracted as described above. Western blot analysis was performed with an anti-His antibody and an anti-AR antibody.
Statistical analysis
GraphPad Prism 6.0a software (GraphPad Software Inc., La Jolla, CA) was used for statistical analysis and results were represented as means ± SEM. Datasets were compared using a two-tailed unpaired Student’s t test with the statistical significance set at P < 0.05. For the KEGG and Pathway analysis in Spatial transcriptomic experiments, statistical significance thresholds were set at adjusted P < 0.05.
Results
ASR603 selectively targets AR and AR-V7 expression and function in CRPC cells
ASR603 was synthesized, along with a series of novel UroA analogs, to identify agents that specifically target AR- and AR-V7–driven oncogenic signaling in CRPC [37] (Figure S1A). These compounds were screened for their ability to inhibit growth of prostate cancer (CaP) cells with distinct metastatic and AR expression profiles (Figure 1A). ASR603 exhibited strong inhibitory activity against all AR+ cells including AR-V7+ 22Rv1 and VCaP cells and AR-FL+ enzalutamide-resistant C4-2B (ENZ-C4-2B) cells (Figure 1B-D, Figure S1B-C) but not against AR- DU145 and immortalized normal human prostate epithelial RWPE-1 cells (Figure 1E-F: IC50 not achieved till 50 µM) supporting an AR-dependent mechanism of action. Sitemap analysis of the predicted AR-NTD identified a high-confidence binding pocket at the NTD–LBD interface (Site Score and D-score > 1.0; Figure 1G, Table S1). Further, interaction analysis revealed a hydrogen bond between the carbonyl group of ASR603 and ASN-25 (2.0 Å; Figure 1H), while the tri-cyclic core engaged hydrophobic residues (Figure S1D). Surface representation confirmed ASR603 is deeply embedded, occupying the entire binding pocket (Figure 1I). While simulation analysis (Figure S1E-H) also showed a diverse and stable interaction profile, surface plasma resonance (SPR) analysis demonstrated a clear, but weak binding of ASR603 to AR (Figure S2A-B, Kd = 2.96mM), likely due to challenges in quantifying physiological binding to intrinsically disordered domains like AR-NTD.
ASR603 binds to AR-NTD and inhibits AR expression. a) The CaP cell lines used in the study i.e. LNCaP, C4-2B, 22Rv1, RWPE1, DU145 were annotated from 0 to 4, 0 being the absence and 4 being the highest display of the indicated characteristics including, AR-FL expression, AR-V7 expression, and metastatic behavior. The heat map was generated in Graphpad Prism. MTT viability assay was performed for b) LNCaP cells that represents localized Androgen Receptor (AR) driven disease and express Wild-Type AR, c) C4-2B cells that represent metastatic AR⁺ Castration Resistant Prostate Cancer (CRPC), d) 22Rv1 cells representing AR-V7+ CRPC e) DU145 cells that are AR negative, Prostate specific Antigen (PSA) negative and f) RWPE cells representing normal prostate epithelial cells. g) Sitemap analysis identified a high-confidence binding pocket within the N-terminal domain (NTD). A site at the interface of the N-terminal domain (green) and the ligand-binding domain (LBD, red) was selected for docking, based on SiteScore and D-score values exceeding 1.0. h) Induced fit docking of ASR603 at the N-terminal domain of AR showing 3D interactions of the ligand with the protein and i) Surface view of the binding pocket with the ligand. Western Blot analysis for expression of AR and PSA in j) LNCaP k) C4-2B l) 22Rv1 and m) Enzalutamide resistant C4-2B (ENZ-C4-2B) cells treated with Vehicle (Veh) or ASR603 with respective IC50 concentrations for 24-, 48- and 72-hours confirming decrease in AR and ARv7 protein levels. n) Immunofluorescence staining followed with Single Photon Counting Confocal Microscopy of C4-2B cells treated with vehicle or ASR603 showed a significant decrease in mean fluorescence intensity of AR. o) Immunofluorescence staining followed with Single Photon Counting Confocal Microscopy of 22Rv1 cells treated with vehicle or ASR603 showed a significant decrease in mean fluorescence intensity of ARv7. p&q) qPCR analysis of AR and PSA transcripts in ASR603 treated C4-2B and 22Rv1 cells for 12- and 24-hours. Mean fluorescence intensity was quantified from at least three independent fields per condition. Statistical analyses were performed using one-way ANOVA followed by Tukey's multiple comparisons test for comparisons involving more than two groups and unpaired two-tailed Student's t-test for comparisons between two groups. All error bars represent means ± SD. Statistical significance: *P < 0.05; **P < 0.01; ***P < 0.001; ****P <0.0001; ns, not significant.
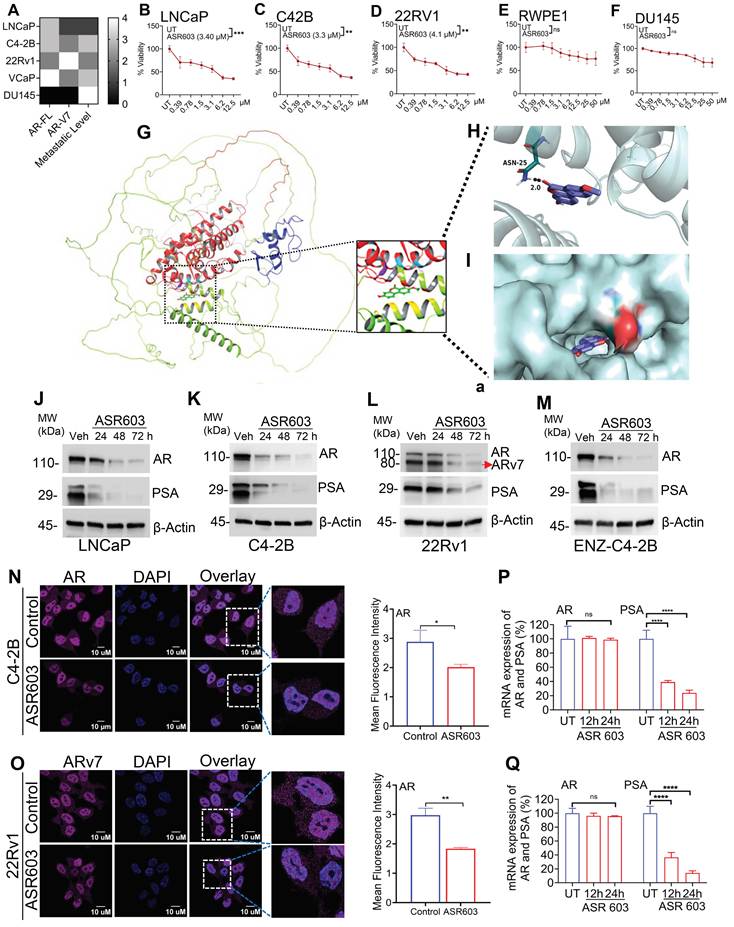
ASR603’s interaction with AR-NTD reduced AR-FL and AR-V7 protein levels in CRPC cells (Figure 1J-M, Figure S3A-B), even as early as 12 hours (Figure S3C-F). This reduction was similar to established AR inhibitors such as EPI-7386 and enzalutamide used as control (Figure S3G-L). In contrast, protein levels of Estrogen Receptor (ER), Progesterone Receptor (PR), or PTEN remain unchanged after ASR603 treatment (Figure S4A), indicating specificity of AR-related pathways. ASR603 strongly inhibited AR and AR-V7 expression under androgen-stimulated (DHT-treatment) conditions (Figure S4B-C) and reduced AR signal intensity (Figure 1N), with significant reduction in nuclear AR-V7 in 22Rv1 cells (p < 0.05; Figure 1O). These effects were accompanied by induction of key proapoptotic markers, induction of apoptosis (Figure S5A-F), suppression of prosurvival signaling (Figure S5G-I) and colony-forming ability of C4-2B and VCaP cells (Figure S5J-K). Interestingly, ASR603 did not affect AR transcript levels (Figure 1P-Q) or promoter activity (Figure S5L), whereas PSA mRNA expression was significantly (p < 0.0001) downregulated after ASR603 treatment (Figure 1P-Q). These findings suggest, ASR603’s selective interaction at the AR-NTD and LBD interface enabled effective inhibition of AR/AR-V7-driven oncogenic signaling in CRPC cells possibly through protein degradation rather than transcriptional repression of AR.
ASR603 demonstrates potent antitumor efficacy in multiple in vivo CRPC models
ASR603 efficacy was evaluated in clinically relevant CRPC xenograft models to assess dependence on systemic androgen levels, given its retained activity under androgen-stimulated conditions.
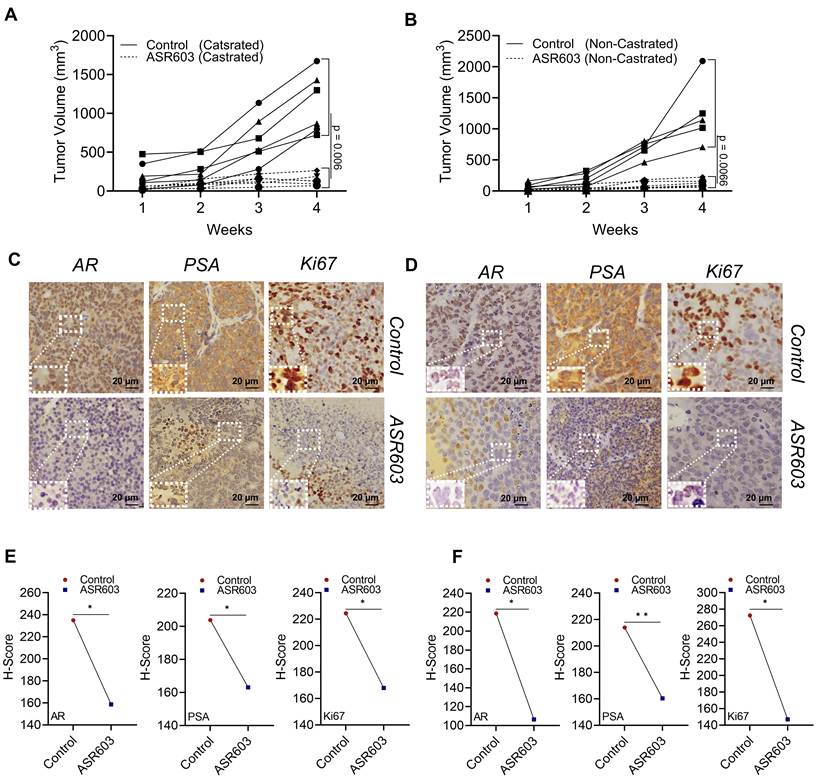
Both castrated (androgen-deprived) and noncastrated mice (hypogonadal state) were used [42]. Oral administration of ASR603 (20 mg/kg) significantly inhibited tumor growth in both castrated (Figure 2A) and noncastrated (Figure 2B) mice compared to vehicle-treated controls. The degree of tumor inhibition observed with ASR603 was comparable to, that achieved with enzalutamide (Figure S6A). ASR603 treated tumors exhibited similar reduction in AR, PSA, and Ki67 expression (Figure 2C-D), as quantified by respective H scores (Figure 2E-F).
AR depletion inhibits tumor growth in castrated and non-castrated mice models. a) 22Rv1 cells were inoculated into castrated nude mice. When the tumors reached ∼50 mm3, the mice were treated with 20 mg/kg ASR603 through oral gavage, and mean tumor volumes were measured in the control and ASR603 treated mice group. b) 22Rv1 cells were inoculated into non-castrated nude mice. When the tumors reached ∼50 mm3, the mice were treated with 20 mg/kg ASR603 through oral gavage and mean tumor volumes were measured in the control and ASR603 treated mice group. c) Representative images of Immunohistochemistry (IHC) analyses of tumor samples were performed to evaluate the expression of AR, PSA and Ki67 in 22Rv1 xenografted tumors in castrated nude mice. Ki67 staining demonstrates that proliferating cells were significantly depleted in ASR603-treated tumors. The magnified inset shows the expression of the indicated marker in cells by 5X digital zoom. d) Representative images of Immunohistochemistry (IHC) analyses of tumor samples were performed to evaluate the expression of AR, PSA and Ki67 in 22Rv1 xenografted tumors in non-castrated nude mice. The Inset shows the expression of the indicated marker in cells by 5X digital zoom. e) Graphical representation of H Score for expression of AR, PSA and Ki67 calculated based on IHC images of castrated mice tumors. f) Graphical representation of H Score for expression of AR, PSA and Ki67 calculated based on IHC show that ASR603 inhibits tumor growth in noncastrated mouse models regardless of systemic androgen levels. Tumor growth curves were analyzed using repeated-measures two-way ANOVA followed by multiple comparisons test using GraphPad. H-scores were calculated from at least five randomly selected tumor fields per sample and H-score comparisons were performed using an unpaired two-tailed Student's t-test. All error bars represent means ± SD. Statistical significance: *P < 0.05; **P < 0.01; ns, not significant
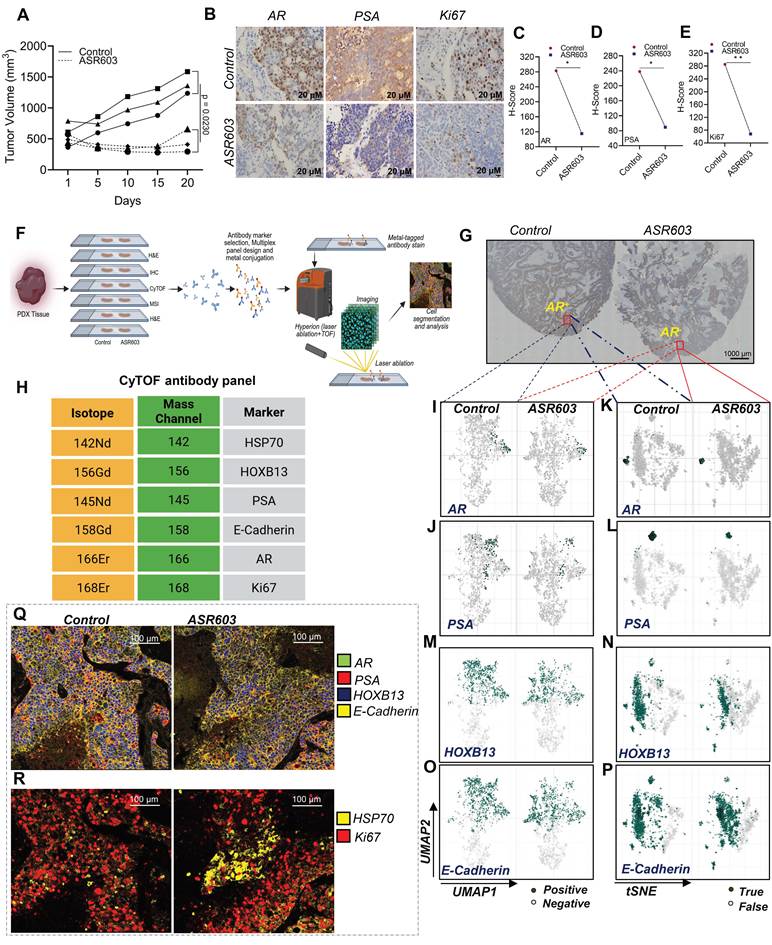
To evaluate ASR603’s potency in a more clinically relevant context, a prostate cancer PDX model, harboring AR+ tumor cells, similar to 22Rv1 xenografts was used. Oral administration of ASR603 to tumor-bearing mice significantly reduced tumor size (p = 0.0230; Figure 3A) and reduced AR, PSA and Ki67 (Figure 3B) expression. These changes were reflected by reductions in H score for AR (p < 0.05; Figure 3C), PSA (p < 0.05, Figure 3D) and Ki67 (p < 0.01, Figure 3E) in the treatment group compared with the control group, indicating strong anti-tumor efficacy.
ASR603-induced AR depletion drives AR-low tumor cells to low-proliferative states. a) PDX Tumor growth curves showing significant reduction in tumor volume in ASR603-treated mice (50mg/kg) compared to control (n = 3 per group). b) Representative immunohistochemistry (IHC) images showing AR, PSA, and Ki67 expression in control and ASR603-treated PDX tumors. H-score analysis showing a significant decline in c) AR, d) PSA and e) Ki67 expression. f) Schematic diagram summarizing the 3D multiplexed multi-omics workflow used to dissect the tumor microenvironment. 5mm serial FPPE sections were cut and deposited on ply-l-lysine-coated slides. The middle (indicated) sections were used for targeted proteomics (using cytometry by time of flight: Hyperion™ Imaging System coupled to a Helios™ mass cytometer) g) IHC staining for AR highlighting AR⁺ and AR⁻ regions in control and treated tumors, respectively, that were selected for downstream spatial profiling. h) CyTOF antibody panel used for the analysis. i) UMAP projections of AR and j) PSA protein expression from CyTOF analysis, comparing control and ASR603-treated tumors. k) tSNE projections of AR and l) PSA expression, confirming loss of AR⁺/PSA⁺ subpopulations in ASR603-treated tumors. m-p) UMAP and tSNE plots showing changes in HOXB13 and E-Cadherin after ASR603 treatment. q) Multiplexed imaging showing co-localization of AR (green), PSA (red), HOXB13 (Blue), and E-cadherin (Yellow) in control (upper panel) and ASR603-treated (lower panel) tissues. r) Multiplexed immunofluorescence imaging highlighting spatial distribution of HSP70 (yellow) and Ki67 (Red) showing depletion of proliferative (Ki67⁺) cells and emergence of HSP70⁺ stress-adapted cells following ASR603 treatment. Tumor growth curves were analyzed using two-way ANOVA followed by multiple comparisons test. H-score comparisons for AR, PSA, and Ki67 expression were performed using an unpaired two-tailed Student's t-test. Representative CyTOF, UMAP, tSNE, and multiplex imaging panels are shown from spatially profiled regions of interest selected from control and ASR603-treated tumors. All error bars represent means ± SD. Statistical significance: *P < 0.05; **P < 0.0; ns, not significant.
Since ASR603 showed strong efficacy in these models, we next analyzed its stability to check its potential for effective systemic delivery and sustained activity. ASR603 demonstrated high stability in commercially obtained pooled mouse and human plasma under standard assay conditions, with more than 93% of the compound remaining intact after extended incubation periods with a half-life surpassing 240 min (Figure S6B-D). This finding indicates that ASR603 is resistant to plasma hydrolysis and degradation, leading to favorable stability in systemic exposure and likely contributing to its strong in vivo efficacy.
Depletion of AR⁺/PSA⁺ subpopulations led to stress-adaptive reprogramming in ASR603-treated prostate cancer PDX tumors
Although our in vitro and in vivo analyses confirmed ASR603-mediated inhibition of AR signaling, the effect on tumor architecture at the single-cell level was not fully characterized. Hence, cytometry by time of flight (CyTOF) was used to assess the impact of ASR603 on tumor cell composition and lineage specific signaling (Figure 3F). Region with high AR expression in control and low AR expression in ASR603-treated PDX tumors, as determined by IHC, was selected as regions of interest (ROI) (Figure 3G, Figure S7A-B). A panel of metal-conjugated antibodies (Figure 3H, Table S2) was employed to evaluate the expression of key markers of AR signaling (AR, PSA), a luminal lineage and AR co-regulator (HOXB13), an epithelial identity marker (E-cadherin), and a stress adaptation marker (HSP70) (Fig. S7C). This analysis revealed a marked loss of AR⁺ and PSA⁺ cellular clusters following ASR603 treatment (Figure 3I-J, Figure S7D-G), consistent with disruption of the AR signaling. However, t-distributed stochastic neighbor embedding (t-SNE) plots showed that AR and PSA were expressed in different cell populations (Figure 3K-L). HOXB13 was markedly reduced (Figure 3M) in the same clusters as AR and PSA (Figure 3N), whereas E-cadherin expression was largely unchanged (Figure 3O-P), suggesting a lineage shift within an epithelial context rather than a complete loss of epithelial identify.
Reduced Ki67 levels (Figure S7H-I) pointed to a transition toward a low-proliferative phenotype in AR-low regions. In contrast, HSP70 expression increased broadly and specifically within AR-low clusters (Figure S7J-K), reflecting activation of stress response pathways in regions where AR expression is inhibited by ASR603. TRAF4, a nonproteolytic AR ubiquitination adaptor that enhances AR transcriptional activity, was also decreased in ASR603-treated PDX tumors (Figure S7L-M), particularly in AR-low regions (Figure S7N), further supporting disruption of AR signaling by ASR603.
Multiplexed imaging and spatial colocalization analysis of the same ROIs, comparing AR-high region in control versus AR-low region in ASR603-treated PDX tumor, revealed strong co-expression of AR, PSA, and HOXB13, with widespread expression of E-cadherin in the control tumor (Figure 3Q). In contrast, ASR603 markedly reduced AR, PSA, and HOXB13, while E-cadherin remained comparable. Control tumor displayed abundant Ki67 (red) and low Hsp70 (yellow), whereas ASR603-treated tumor exhibited reduced Ki67 and elevated Hsp70, indicating reduced proliferation with stress adaptation (Figure 3R). Together, these observations demonstrate that ASR603 selectively depletes AR⁺/PSA⁺ tumor subpopulations, imposing selective pressure on the remaining AR-low population and promoting a stress-adapted, low-proliferative tumor state.
AR inhibition reprograms the tumor microenvironment
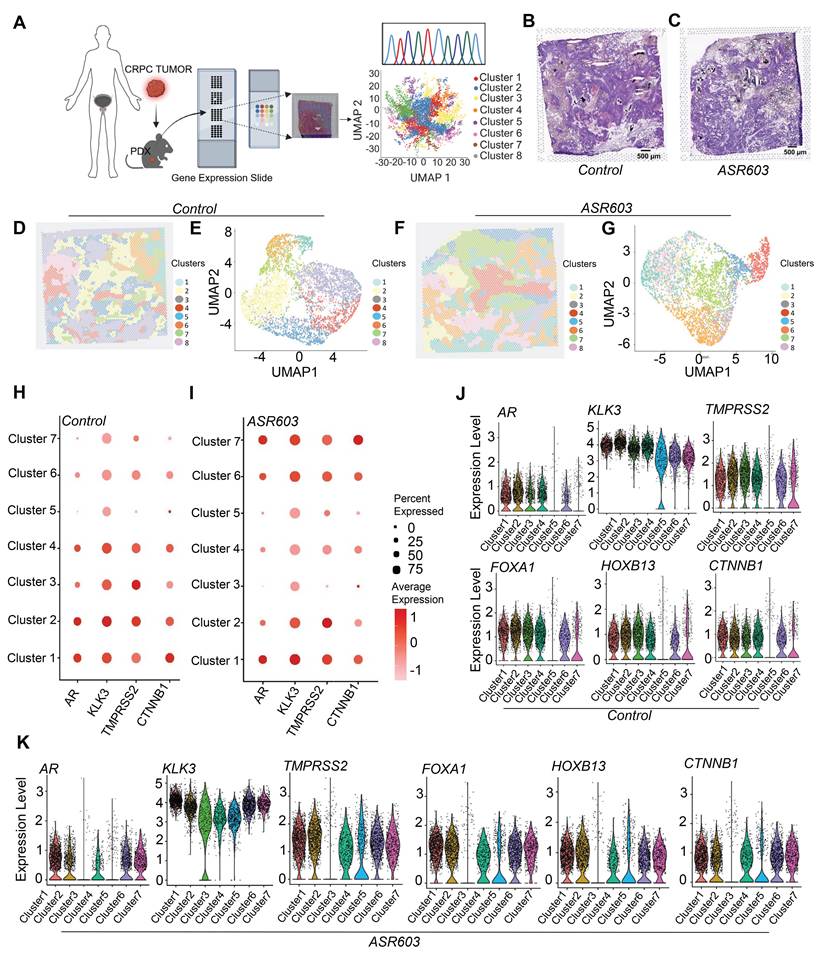
The effects of AR depletion on tumor architecture and gene expression in situ, were assessed using spatial transcriptomic profiling, which enabled direct comparison of the transcriptional landscape in control and ASR603-treated tumors, while preserving the spatial organization of the tissue (Figure 4A). ASR603-treated tumors exhibited disrupted glandular organization and extensive tissue collapse in contrast to well-organized glandular epithelium observed in control tumors (Figure 4B-C). Spatial gene expression profiling revealed eight transcriptionally distinct clusters within the control (Figure 4D-E) and ASR603-treated tumors (Figure 4F-G). AR-regulated genes (KLK3/PSA), TMPRSS2, and CTNNB1) showed broad, high-level expression across multiple clusters particularly in clusters 1–4 (Figure 4H). In contrast, ASR603-treated tumors displayed a substantial reduction in the percentage of KLK3-expressing cells, especially in cluster 3 (Figure 4I). Although AR transcripts were reduced, they were not completely depleted in the ASR603-treated tumor suggesting transcriptional silencing of canonical AR signaling [43]. Both the proportion of PSA expressing cells (as indicated by smaller dot sizes) and PSA expression per spot (as shown by reduced color intensity) were diminished. This finding is consistent with loss of functional AR signaling in our in vitro assays and suggests that AR may be post-transcriptionally regulated in ASR603-treated tumors. The narrowing and downward shift of the violin plots of AR target genes in cluster 3 (Control: Figure 4J and ASR603: Figure 4K), together with reduced expressions of key transcriptional regulators FOXA1, HOXB13, and CTNNB1 (Figure 4J-K), further supports this suppression. Additional analysis of the expression of cell cycle and proliferation markers, including MKI67, PCNA, and E2F1, along with genes associated with prostate adenocarcinoma (e.g., AMACR, EPCAM, ALCAM) (Figure S8A-D), revealed reduced expression in specific clusters, especially the AR-low, cluster 3 of ASR603-treated tumors. A gene-gene correlation matrix of AR target genes (GEO database: SRX11222414; Table S3) demonstrated that AR pathway-related genes, including E2F1, maintained strong correlation with each other in the ASR603-treated tumor (Figure 5A). This finding indicates a homogeneous and coordinated impact of ASR603 leading to emergence of an AR-low/PSA-low transcriptional state. Together with CyTOF findings of reduced HOXB1 and unchanged E-cadherin, these results suggest that tumor cells have lost much of their original identity and have entered a state of growth arrest or apoptosis due to the effective AR degradation by ASR603.
ASR603 driven AR depletion induces different transcriptional programs in AR-high versus AR-low tumor cells. a) Schematic overview of the spatial transcriptomics workflow performed on PDX tumors treated with vehicle or ASR603. b & c) H&E-stained tissue sections of control and ASR603-treated PDX tumor and d) corresponding unsupervised clustering map identifying transcriptionally distinct regions in control. e) UMAP projection of spatial transcriptomic data from control tumor highlighting cluster identity. f) Unsupervised clustering map identifying transcriptionally distinct regions in ASR603-treated PDX tumor. g) UMAP projection of spatial transcriptomic data from ASR603-treated tumor highlighting cluster identity. Dot plot visualization of canonical AR pathway components (AR, KLK3, TMPRSS2, CTNNB1) in h) control and i) ASR603-treated tumors. Dot size indicates the percentage of cells expressing each gene per cluster, and color intensity reflects the average expression level. Cluster 3 of ASR603-treated tumors shows marked inhibition of AR signaling and proliferation pathways. Violin plots comparing expression of AR-pathway genes AR, KLK3, TMPRSS2 and AR pathway regulators FOXA1, HOXB13, and CTNNB1 across clusters in j) control and k) ASR603-treated tumors. Cluster 3 shows reduced expression of KLK3 and TMPRSS2 after treatment. Dot size represents the percentage of spots expressing the indicated gene, whereas color intensity reflects average expression levels. Violin plots depict the distribution of normalized gene expression across spatial clusters. Spatial transcriptomic analyses were performed using Seurat v4.0.
Spatial transcriptomic analysis reveals ASR603-driven transcriptional reprogramming and pathway perturbations in CRPC tumors. a) Correlation heatmap of differentially expressed genes across spatial clusters in control and ASR603-treated PDX tumors compared with AR-ChIP-Seq dataset, highlighting pairwise correlations among AR-regulated luminal, epithelial, and metabolic genes b) Venn diagram showing the overlap of total detected transcripts between control (AR-High:Cluster1) and ASR603-treated (AR-Low:Cluster3) samples, illustrating both shared and unique gene. c) Venn diagram showing the overlap of total detected transcripts between control (All Clusters) and ASR603-treated (All Clusters) samples, illustrating both shared and unique gene. d) Volcano plot comparing cluster 3 (AR-low) vs cluster 1 (AR-high) in ASR603-treated PDX tumors, showing significantly upregulated and downregulated genes. Transcripts (e.g., *KLK3, FKBP5, SORD, HSPA1B, DEFA5) are annotated to highlight loss of AR signaling and activation of stress-adaptive pathways. e & f) Dot plots of enriched pathways in control and ASR603-treated tumors. Dot size represents gene count; color scale denotes significance (–log₁₀ adjusted p-value). Differential gene expression analysis was performed using the Wilcoxon rank-sum test implemented in Seurat v4. P-values were adjusted for multiple testing using the Bonferroni correction. Pathway enrichment analysis was performed using clusterProfiler, and significance was determined using adjusted p-values. Pearson correlation analysis was used for the correlation heatmap. Adjusted p < 0.05 was considered statistically significant.
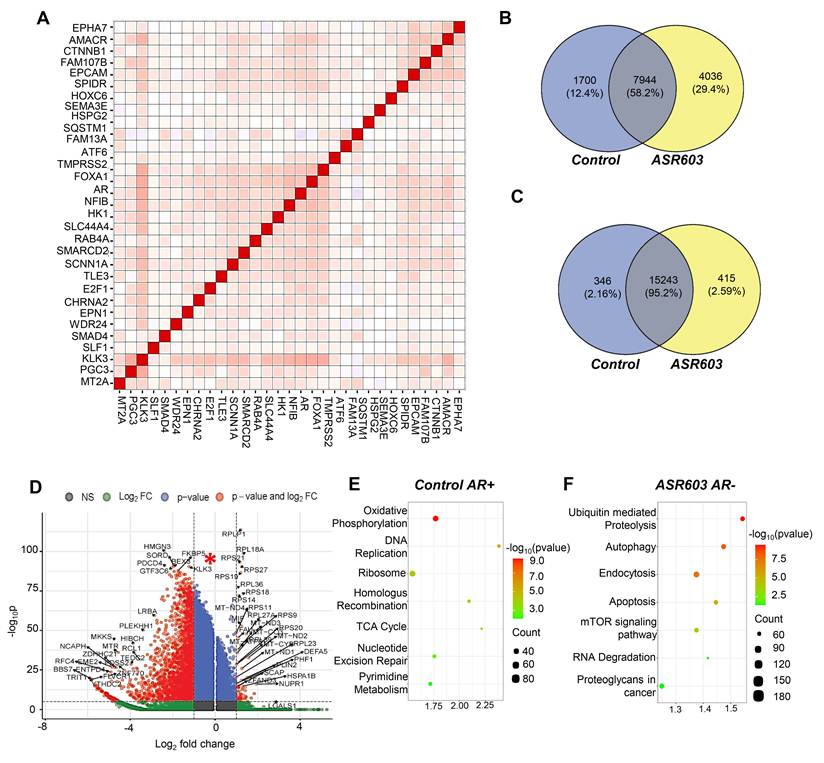
To confirm that ASR603-mediated AR depletion causes the distinct transcriptomic profile of AR-low versus AR-high regions, Venn diagram analysis was conducted comparing cluster-3 (AR-low), from the ASR603-treated tumors, with cluster 1 (AR-high) from control tumors. As seen in figure 5B, cluster 3 from the ASR603-treated tumor showed over 4036 unique genes (29.4%). When the analysis was expanded to include genes across all clusters in control versus ASR603-treated tumor, the proportion of unique genes reduced to 2.59% (Figure 5C), indicating that ASR603-mediated AR depletion specifically contributes to the distinct transcriptomic profile of AR-low regions. A volcano plot comparing the gene expression levels in AR-low (ASR603-treated) versus AR-high (Control) region revealed significant decreases in AR signaling components (KLK3, FKBP5), chromatin modeling and transcriptional regulators (e.g., GTF3C6, HMGN3) along with increased expression stress- and repair-associated genes 9HSPA1B, NUPR1, and PLIN2), ribosomal and mitochondrial genes 9RPS11, RPS21, MT-ND1, MT-ND4, and MT-CYB) (Figure 5D). Interestingly, genes involved in key metabolic pathways (SORD, HIBCH, PLIN2, SCAP) were also altered (Figure 5D). Gene ontology and KEGG pathway analyses demonstrated that pathways enriched in the AR-high region of control tumors, such as oxidative phosphorylation, DNA replication, the TCA cycle, and nucleotide excision repair (Figure 5E), were not enriched in cluster 3 (Figure 5F). In contrast, stress-adaptive programs, including autophagy, lysosome activity, mTOR signaling, and ubiquitin-mediated proteolysis, were selectively enriched in cluster 3 in ASR603-treated tumors (Figure 5F). These findings suggest widespread transcriptional arrest and metabolic reprogramming following AR pathway inhibition.
ASR603 promotes AR and AR-V7 degradation and impairs cell survival pathways
To assess the activation ubiquitin-mediated proteolysis pathway at the cellular level, the ability of ASR603 to directly targets AR for degradation via the ubiquitin–proteasome system was investigated. ASR603 treatment increased overall ubiquitination in total cell lysate (Figure 6A-B) and in immunoprecipitated AR-V7 and this effect was further enhanced by co-treatment with MG132 (Figure 6C). Treatment with cycloheximide (CHX: protein synthesis inhibitor) alone or in combination with ASR603 resulted in a time-dependent decrease in AR expression in 22Rv1 (Figure 6D-E) and C4-2B cells (Figure 6F-G), confirming the involvement of AR degradation signaling in the effects of ASR603.
ASR603 induces AR ubiquitination and proteasomal degradation via specific lysine residues in the AR N-terminal domain (NTD). a & b) Western blot analysis showing a time-dependent ubiquitin protein expression in C4-2B and 22Rv1 cells treated with MG-132 (10µM), ASR603 (respective IC50), vehicle, or combination. c) 22Rv1 cells were treated with ASR603 and MG132 or combination for indicated time and cell lysates were immunoprecipitated with AR-V7 antibody and subjected to WB with ubiquitin antibody. The cell lysates were WB with AR-V7 as input. d & e) Immunoblots of AR and AR-V7 expression in 22Rv1 cells treated with ASR603, CHX (50 µM) or combination at the indicated time points (h). f & g) Immunoblots of AR expression in C42B cells treated with ASR603, CHX (50 µM) or combination at the indicated time points (h). h) Western blot showing that ASR603 treatment reduced overexpressed AR-Mutant (AR-Mut) and i) AR-FL. j) Tandem mass spectrometry (MS/MS) spectra identifying ubiquitinated lysine residues (K301 and K313) within the AR-NTD. Red asterisk (*) indicates diagnostic y and b ions for modified peptides. k) Schematic representation of AR domain structure, indicating the location of K301 and K313 in the N-terminal domain. Two mutant constructs were generated: Mut1 (K301R) and Mut2 (K313R). l) Western blot of His tagged-AR-FL, Mut1 (K301R) and Mut2 (K313R) mutants in transfected 293T cells, probed with anti-His antibody. m) Immunoblotting confirming that ASR603 selectively depletes AR-FL but not the K301R/K313R mutant in transiently transfected 293T cells confirming the involvement of these residues in ASR603-mediated ubiquitination. n) Immunofluorescence staining and colocalization analysis of LC3B (green) and LAMP1(Red) fusion (Yellow) showing significant changes in mean fluorescence intensity of o) LC3B, p) LAMP1. q) LC3B-LAMP1 colocalization was quantified using Pearson's correlation coefficient and showed no significant change following ASR603 treatment. DAPI is used as nuclear stain (Blue). Quantification of LC3B, LAMP1, and LC3B-LAMP1 colocalization was performed from at least three independent microscopic fields per condition. Statistical significance was determined using one-way ANOVA followed by Tukey's multiple comparisons test or an unpaired two-tailed Student's t-test. All error bars represent means ± SD. Statistical significance: *P < 0.05; **P < 0.01; ns, not significant.
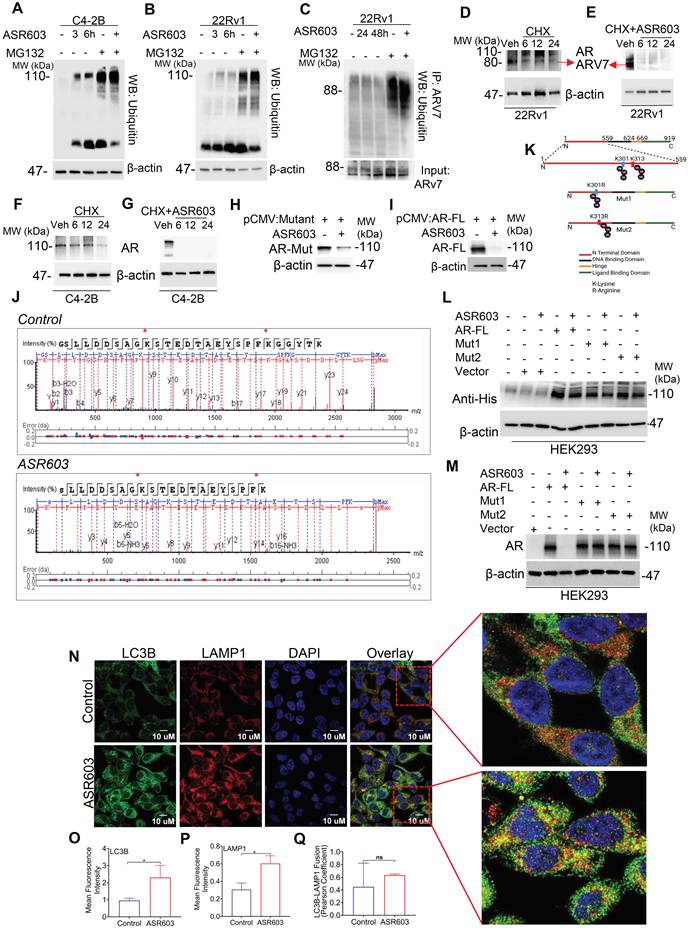
Four distinct ubiquitination sites, K845, K847, and K913 within the LBD [38] and lysine 6, 26 [44], 311 in the NTD [45], were previously identified in AR. Intriguingly, ASR603 continued to inhibit AR expression in AR-mutant carrying substitution at key ubiquitin sites (K311, K845, and K847; AR-Mut) (Figure 6H), and AR-FL (Figure 6I), suggesting that ASR603 induces AR ubiquitination at sites that are different from known ubiquitination sites in AR. Further, analysis revealed two notable ubiquitin acceptor sites within the NTD at lysine residues K301 and K313 (Figure 6J). Mutants of these sites (K301R; Mut1 and K313R; Mut2: Figure 6K) were confirmed by anti-his tag (Figure. 6L) and were resistant to ASR603-induced degradation (Figure 6M), indicating that K301 and 313 serve as critical ubiquitin acceptor sites for ASR603-driven AR degradation in CRPC cells.
Apart from ubiquitin-mediated proteolysis, the autophagy pathway was enriched in AR-low cells (Figure 6N). Key autophagy markers LC3B and LAMP1 were increased in C4-2B (Figure S9A; Figure 6O-P) and 22Rv1 cells (Figure S9B-E). However, there was no significant change in their colocalization, specifically in autophagosome-lysosome fusion, a key feature of active autophagic flux (Figure 6Q, Figure S9F). These results demonstrate that a defective autophagy pathway and loss of its survival function. These findings confirm that ASR603 not only promotes AR degradation via ubiquitin-proteasome system, but also induces a defective autophagy–lysosome signaling, which is consistent with the stress-adaptive phenotype observed in spatially AR-depleted tumor regions.
Targeting AR induces metabolic dysfunction and tumor collapse
Transcriptomic analysis confirmed the induction of stress-adaptive responses including autophagy and UPS pathways as well as differential expression of several genes implicated in metabolic regulation and stress-response in CaP (Figure 5D). Additionally, metabolic regulators such as SLC31A2 (a copper transporter linked to redox homeostasis), SLC45A4 (a solute carrier involved in energy balance), and MT2A (a metallothionein associated with detoxification under stress) overlapped within the same epithelial populations, that expressed AR pathway genes (AR, KLK3, TMPRSS2, FOXA1, and HOXB13) (Figure 7A). This overlap suggests a functional interplay between ASR603-induced attenuation of AR signaling and subsequent metabolic reprogramming.
Spatial metabolomic analysis reveals ASR603-induced metabolic reprogramming in prostate cancer PDX tumors. a) Spearman’s rank correlation analysis was performed to assess pairwise relationships among canonical AR targets (AR, KLK3, TMPRSS2), AR cofactors (FOXA1, HOXB13), Metabolic regulators (MT2A, SLC31A2, SLC45A4) and different cell types. b) Schematic overview of the experimental workflow: tumor regions with high AR expression (AR-High) and low AR expression (AR-Low, post-ASR603 treatment), used for CyTOF analysis, were analyzed using matrix-assisted laser desorption/ionization (MALDI) mass spectrometry imaging (MSI). c) Principal component analysis (PCA) reveals distinct clustering of metabolic profiles between ASR603-treated and control tumors. d) Correlation matrix heatmap showing pairwise associations between top differentially abundant metabolites identified by MSI analysis and tumor weight across samples. The key metabolites have been marked in Red. Standard lipid notation (C15:0, C17:0, C20:2, C22:1) have been used. Abbreviations: ACC: 1-aminocyclopropanecarboxylic acid, cc-MA: cis,cis-Muconic acid, NAG: N-acetylglutamic acid, 3-HAD: 3-Hexenedioic acid, GSA: guanidinosuccinic acid, Ac-SMX: N-Acetyl-sulfamethoxazole. Spearman's rank correlation coefficient was used for correlation analyses. PCA was performed using normalized metabolite abundance values.
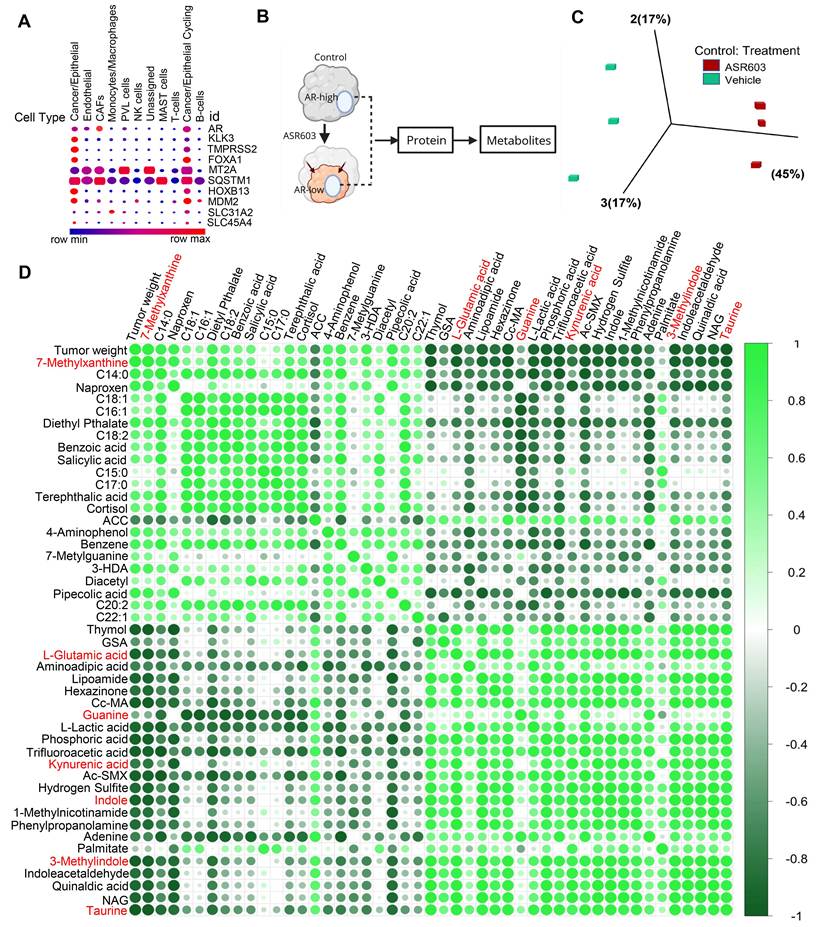
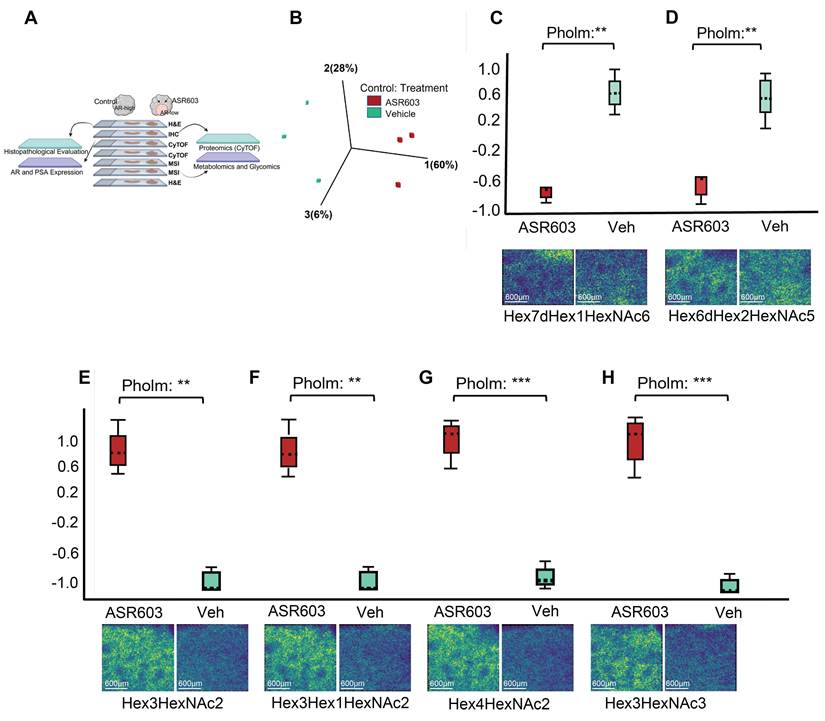
Spatially resolved mass spectrometry imaging (MSI) of ROIs from both control and ASR603-treated tumors, matched to the ROIs analyzed by CyTOF (Figure 7B) revealed a distinct separation between the treated and untreated samples, highlighting extensive metabolomic reprogramming following ASR603 treatment (Figure 7C; Table S4). Metabolites exhibiting the most pronounced changes in the AR-Low region of ASR603- treated PDX tumor compared to the AR-high region of control tumors included Taurine, 3-methylindole (skatole), cis,cis-Muconic acid, and 7-methylxanthine (Figure S10A-C), alongside trifluoroacetic acid, indole, thymine, L-glutamic acid, thymol, and N-acetyl-sulfamethoxazole (Figure S10D-E). Hierarchical clustering based on metabolites abundance in AR -low regions and random forest classification also identified taurine and 7-methylxanthine as key metabolites distinguishing the ASR603-treated tumor from the control tumor (Figure S11A-B).
Taurine, 3-methylindole, and Indole, showed a strong inverse correlation with tumor weight, whereas metabolites such as 7-methylxanthine and myristic acid showed positive correlation with tumor weight (Figure 7D). Indole and 3-methylindole are metabolites of tryptophan, another tryptophan metabolite, kynurenic acid, exhibited a significant inverse correlation with tumor volume (Figure 7D). Pathway enrichment analysis of the differentially abundant metabolites revealed that taurine, hypotaurine metabolism, pyrimidine metabolism, along with tryptophan metabolism, were significantly increased in the AR-low region compared with AR-high region from the control tumor (Figure S11C). Tryptophan metabolism, through kynurenine, may contribute to pyrimidine metabolism, while the purine metabolism pathway was decreased, in association with a reduced 7-methylxanthine, a purine derived metabolite. This pattern indicates a shift from energy-intensive purine metabolism toward a more energy-efficient, pyrimidine metabolism strategy [46], to manage ASR603-induced stress. These findings support a coordinated metabolic crosstalk between enriched and depleted pathways that drive stress-adaptive response, resulting in a metabolic state that is not conducive to proliferation and thereby suppresses overall tumor growth.
MSI-based glycan profiling of the same ROIs (Figure 8A) revealed a coordinated shift in glycosylation patterns in the AR-low region of ASR603-treated PDX tumor (Figure 8B, Figure S12A-B). Specifically, significant downregulation of complex fucosylated N-glycans, including Hex₇dHex₁HexNAc₆ (Figure 8C, Z-score ~ +1 vs. –1, p < 0.01) and Hex₆dHex₂HexNAc₅ was observed (Figure 8D, p < 0.01). Conversely, high-mannose and truncated glycans such as Hex₃HexNAc₂ (Figure 8E, p < 0.01), Hex₃dHex₁HexNAc₂ (Figure 8F, p < 0.001), Hex₄HexNAc₂ (Figure 8G, p < 0.001), and Hex3HexNAc₃ (Figure 8H, p < 0.01) were significantly upregulated, indicating impaired glycan processing in the Golgi apparatus and ER stress [47]. These glycans shifts in parallel may contribute to the metabolic stress identified by MSI-based metabolite analysis, which revealed increased taurine, 3-methylindole, and kynurenine levels, as well as increased autophagy and redox pathway activity in AR-low tumor region Together, these multiomic data define a reprogrammed glucometabolic signature induced by ASR603 that links AR degradation to the loss of proliferative metabolic pathways, altered glycan signatures, and the emergence of a stress-response, including autophagy, which ultimately leads to tumor inhibition in ASR603-treated PDX tumors.
ASR603 impairs glycan processing capability of AR-Low tumor cells. a) Schematic overview of the spatial multi-omics workflow integrating histopathological, immunohistochemical (IHC), single-cell proteomic (CyTOF), metabolomic (MSI), and glycomic analyses in ASR603-treated vs. control PDX tumors. Tissue sections from spatially registered regions of interest (ROIs) were subjected to parallel profiling. b) 3D Principal Component Analysis (PCA) plot showing clear separation between ASR603-treated (red) and vehicle-treated (green) tumor samples based on glycomic profiles, indicating treatment-induced metabolic reprogramming. c-h) Box plots and representative ion maps (bottom panels) displaying the relative abundance and spatial distribution of select differentially accumulated Glycans in ASR603 vs. control tumors, including c) Hex7dHex1HexNAc6 d) Hex₆dHex₂HexNAc₅ e) Hex₃HexNAc2 f) Hex₃dHex₁HexNAc2 g) Hex₄HexNAc2, and h) Hex3HexNAc3. Principal component analysis was performed using normalized glycan abundance values. Comparisons between vehicle-treated and ASR603-treated groups were performed using an unpaired two-tailed Student's t-test. Glycans shown were selected from significantly differentially abundant species identified by MSI-based glycomic profiling. All error bars represent means ± SD. Statistical significance: *P < 0.05; **P < 0.01; ***P < 0.001 ns, not significant.
Discussion
In a previous study, we demonstrated that UroA, a microbial metabolite, has the potential to target AR [33]. In the present study, UroA analogs were rationally designed, leading to the development of a novel small molecule, ASR603, that specifically targets and binds to the AR-NTD. Unique ubiquitin acceptor sites within the AR-NTD were mapped and found to be ubiquitinated in response to ASR603 treatment. This modification led to degradation of both AR-FL and AR-V7, selectively suppressing CRPC cell growth at nanomolar concentrations while sparing normal prostate epithelial cells. ASR603-mediated AR depletion in CRPC tumors resulted in a stress-adapted, low-proliferative state and generated a metabolic shift leading to a coordinated, interlinked metabolic crosstalk that led to tumor regression. These findings advance the understanding of how AR-NTD therapies can reshape the CRPC tumor microenvironment and pave the way for potential breakthroughs in CRPC treatment.
Mechanistically, ASR603 showed approximately 11.6-fold greater efficacy than UroA [33] by binding to AR-NTD, potentially at FXXLF motif (residues 23-27) and Tau-1 region of AF-1 domain (residues 100-370). While FXXLF motif mediates androgen-dependent interaction between the NTD and the LBD [48], while the Tau-1 region is essential for ligand-dependent transcriptional activity [49]. Dual engagement may account for a lower IC50 values of ASR603 than its parent compound UroA, or ralaniten [50]. Few other compounds, including niphatenones [51], sintokamides [52], and EPI-001 analogs, have shown direct binding to the AF-1 domain in the AR-NTD by cell-free assay and then later using Click-chemistry probes [53, 54]. However, these analogs such as EPI-506, did not fare well in clinical trial (NCT02606123) [55]. Hence there is an urgent need for characterizing compounds such as ASR603 that can have potential for favorable clinical development.
Resistance to ADT is a key characteristic of AR-V7-driven CRPC [56]. We used castrated mice to model ADT or abiraterone treatment, minimizing ligand-dependent AR signaling, while noncastrated mice represented a hypogonadal state with partial androgen signaling [42]. ASR603 abrogated tumor burden in both models indicating that the effect of ASR603 does not dependent on ligand competition and may involve direct inhibition of AR, including its ligand-independent isoform AR-V7. Similarly, ASR603 also inhibited tumor growth in a PDX model, containing both AR-FL and AR-V7+ tumor cells and IHC analysis showed a decline in AR as well as PSA expression. These results are consistent with previous studies demonstrating that targeting AR [57] and AR-V7 [53, 58] can suppress tumor growth in CRPC mice models.
The observed pattern of HOXB13 loss with retained E-cadherin [59] in CyTOF analysis indicated a partial luminal-to-basal lineage shift, consistent with emerging lineage plasticity without complete transdifferentiation [60, 61]. Alongside the positive correlation between E2F1 and KLK3 loss, this pattern suggests that tumor cells have lost their original luminal identity and have transitioned into state of growth arrest or apoptosis due to the effective AR degradation by ASR603. Upregulation of HSP70, a stress-protective chaperone [62], further highlights a stress-adapted AR-low phenotype, which is associated with early adaptation downstream of AR degradation [62].
Similar to CyTOF and immunoblot-based evidence demonstrating marked depletion of both full-length AR and AR-V7 protein levels following ASR603 treatment, spatial transcriptomic analysis showed that expression of AR target genes such as KLK3 (PSA), TMPRSS2, and FOXA1 was also markedly reduced in AR-low cluster. HOXB13 expression was similarly downregulated, while Hsp70 expression was upregulated in the same AR-low cluster. As observed in CyTOF data, HSP70 upregulation likely represents a compensatory, cellular stress-mediated response to AR inhibition. In addition to ubiquitin-mediated proteolysis, stress response and autophagic pathways, were enriched in the AR-low cluster in ASR603-treated tumors. Autophagy is a context-dependent phenomenon [63-68]. It has been shown as a protective stress response [63-65] or promote cancer cell death [66] in response to agents such as resveratrol [67] or arsenic trioxide [68]. Autophagy also plays a key role in sequestering ubiquitin-tagged protein aggregates when the proteasome is overloaded [69, 70], functioning as a secondary degradation route under stress [71], mediated through autophagy receptor p62 [72]. Kristine et al. showed that riluzole-induced direct interaction between AR and selective autophagy receptor p62 led to degradation of AR-FL as well as AR-V7 [73]. In our correlation analysis AR and KLK3 expression inversely correlated with P62 expression suggesting a possible involvement of autophagy in AR degradation. However, further studies are required to confirm this observation. Additionally, the spatial transcriptomic analysis revealed that autophagy was enriched predominantly in cluster 3, the AR-low cluster in ASR603-treated PDX tumors, whereas immunoblot analysis and immunofluorescence staining of ASR603-treated CRPC cell lines revealed more generalized activation of autophagy–lysosomal signaling. This apparent discrepancy may reflect the absence of spatial and microenvironmental heterogeneity in vitro, where uniform AR degradation and drug exposure are more likely to elicit a generalized stress response [74, 75]. Overall, both CyTOF and spatial transcriptomic analysis indicated the emergence of a transcriptionally repressed tumor state with spatially restricted luminal disruption supporting ASR603 as an androgen-independent AR degrader, with potential utility across multiple CRPC settings.
Our findings also contribute to the growing recognition of metabolic adaptation of AR+ tumors in response to therapies [76, 77]. ADT-associated metabolic alterations, such as impaired glucose tolerance, disrupted steroid and lipid metabolism are well documented in CAPS1, CAPS2, and other clinical trials [78, 79] and EPI-001 has been shown to alkylate thiols [80]. However, the metabolic consequences of AR-NTD inhibition remained unexplored.
We found that metabolically responsive genes such as MT2A, SLC31A2, and SLC45A4 [81-84] colocalized with cells in which ASR603-suppressed AR signaling. This colocalization provides a molecular basis for observed increase in metabolic pathways linked to taurine and glutamic acid metabolism, previously associated with CaP progression [85, 86]. The coordinated enrichment of metabolic pathways associated with arginine, histidine, and lysine metabolism, as well as a shift towards an energy-efficient pyrimidine metabolism pathway from an energy-intensive purine metabolism pathway [46], suggests the disruption of biosynthetic and nitrogen metabolic routes essential for sustained proliferation. Metabolite abundance and tumor weight were correlated providing exploratory evidence for a link between metabolic changes and tumor regression. Although future studies in independent cohorts and circulating metabolite measurements will be required to validate their biomarker potential, this data could serve as a potential metabolic signature of AR NTD degrader activity that could, in principle, be monitored through tumor biopsies or through blood or urine tests to evaluate treatment response.
Although the CyTOF and MSI-based metabolomic analyses revealed ASR603-induced remodeling of tumor cell states and metabolic stress responses; these data alone could not fully account for the alterations in cell surface architecture, receptor signaling, or cellular matrix interactions. All of these features are known to influence therapy response and tumor regression. Protein glycosylation, such as N-glycan branching and fucosylation, profoundly shapes tumor cell behavior by regulating receptor stability, ligand binding, immune evasion, and extracellular matrix remodeling [87-89] yet it is not captured by transcriptomic and standard proteomic assays. To address this, we performed the spatial multiomic framework to include glycan imaging using MSI of the same ROIs. Our analysis revealed distinct loss of complex fucosylated glycans, which have been associated with aggressive and invasive CaP phenotypes [90, 91]. There was also concomitant increase in high-mannose glycan forms indicative of ER stress, impaired glycan maturation [92], and proteostasis disruption [47]. These patterns strongly influence tumor cell behavior through effects on receptor stability, ligand binding, immune evasion, and extracellular matrix remodeling [39, 87-89]. However, they are not detectable in transcriptomic and proteomic assays. The enrichment of complex, fucosylated, multi antennary glycans within AR⁺/PSA⁺ regions could serve as a predictive tissue marker to identify CRPC subpopulations that are highly dependent on AR driven glycoprotein programs and therefore most likely to benefit from AR NTD degraders such as ASR603. Conversely, the emergence of high mannose/truncated glycans in AR low, non-proliferative regions, after treatment, may provide a tissue-based readout of target engagement and stress induced remodeling. Prior studies have shown that identification of glycoproteins bearing a GalNAc glycotope can have prognostic and therapeutic utility in cancer [90, 93, 94]. Thus, glycan profiling results not only provided additional evidence of the ASR603-induced loss of the AR-NTD-driven cell state but also highlight a potential therapeutic vulnerability.
Together, these findings indicate that targeted degradation of AR via the NTD induces an integrated stress response at single-cell proteomic, transcriptomic, and metabolic level, which is sufficient to drive global tumor inhibition. This work defines a new paradigm for AR-targeted therapy and establishes metabolic collapse as a hallmark of response to AR-NTD degradation.
Limitations of the study
ASR603 is used here as a first-in-class, mechanistic proof-of-concept compound rather than a development-stage candidate. Comprehensive in vivo PK/PD profiling were not performed. Spatial transcriptomics were performed in a larger region (6x6mm) from the ASR603-treated PDX tumor and control PDX tumor, CyTOF and MSI analysis were performed on a smaller, albeit shared ROI. Technical constraints limit analysis to areas no large than 0.2x0.2µm. Nevertheless, the ROI was carefully selected based on the AR expression patterns. While our analysis compares ASR603-mediated AR expression changes with low AR regions in control tumors, the inherent heterogeneity of CRPC will require additional tumor and multiple ROIs. This approach will provide a comprehensive understanding of the effect of AR-NTD degradation on multiomic remodeling. It is also necessary to fully determine whether ASR603 exerts any AR-independent effects or engage additional targets. Finally, although AR-NTD is shown to be enriched in ubiquitin acceptor sites in ASR603 treatment, it remains to be defined whether these sites contribute to partial AR through proteasome and autophagy pathways, which are activated in ASR603-treated cells. These mechanistic aspects will be addressed in future studies.
Abbreviations
AR: Androgen receptors; AR-Vs: AR splice variants; CRPC: Castration-resistant prostate cancer; ADT: Androgen deprivation therapy; LBD: Terminal ligand-binding domain; DBD: DNA-binding domain; NTD: N-terminal domain; AR-FL: Androgen receptor full length; PSA: Prostate Specific Antigen; AR-V7: Androgen receptor variant 7; HoxB13: Home box 13 gene; CaP: Prostate cancer; AR-NTD: Androgen receptor N terminal domain; MOA: Mechanism of action; Hsp90: Heat-shock protein 90; CyTOF: Cytometry by Time-Of-Flight; UroA: Urolithin A; ENZ-C4-2B: enzalutamide-resistant C4-2B; SPR: Surface Plasma Resonance; ROI: regions of interest; t-SNE: , t-distributed stochastic neighbor embedding; UMAP: Uniform Manifold Approximation and Projection; TRAF4: Tumor necrosis factor receptor-associated factor 4; Hsp70: Heat-shock protein 70; TMPRSS2: Transmembrane Protease, Serine 2; CTNBB1: Catenin beta-1; FOXA1: Forkhead Box A1; PCNA: Proliferating cell nuclear antigen; E2F1: Transcription factor E2F1; AMACR: Alpha-methylacyl-CoA racemase; EPCAM: Epithelial Cell Adhesion Molecule; ALCAM: Activated Leukocyte Cell Adhesion Molecule; FKBP5: FK506-binding protein 5; GTF3C6: General Transcription Factor IIIC Subunit 6; HMGN3: High Mobility Group Nucleosome-Binding Domain 3; HSPA1B: Heat Shock Protein Family A Member 1B; NUPR1: Nuclear Protein 1; SORD: Sorbitol dehydrogenase; HIBCH: 3-Hydroxyisobutyryl-CoA hydrolase; PLIN2: Perilipin-2; SCAP: SREBP cleavage-activating protein; Lc3B: Microtubule-associated protein 1 light chain 3 beta; LAMP1: Lysosome-associated membrane protein 1.
Supplementary Material
Supplementary Figure 1–12, Supplementary Table 1-6, Supplementary Methods.

Acknowledgements
We acknowledge the assistance of the Joint Microscopy Laboratory (Luminosa confocal microscope) in the Texas A&M University School of Medicine and the National Institutes of Health (NIH) funding for the Luminosa confocal microscope (S10 OD032208) and Cancer Prevention and Research Institute of Texas awards RP190617 and RP240559.
Data were generated in part through the use of the Flow Cytometry & Cellular Imaging Facility shared resource, which receives partial support from the National Cancer Institute under grant P30 CA016672 to MD Anderson Cancer Center, the NCI’s Research Specialist 1 R50 CA243707-01A1. The research reported in this publication did not directly arise from grant P30 CA016672 to MD Anderson Cancer Center and is not within the scope of such grant.
Funding
This research was supported by grants from the National Cancer Institute (NCI), specifically R01CA257370, awarded to C.D.
Author contributions
Conceptualization: C.D., M.K.A., and A.K.S. Methodology: C.D., A.T., and B.C. Investigation: A.T., V.S., B.C., D.N., B.T., K.S., A.S., E.H.S., A.C., Y.N., and A.K.S. Validation: A.T., V.S., and B.C. Formal analysis: A.T., V.S., A.C., E.H.S. and B.C. Supervision: C.D. and A.K.T Data curation: A.T., V.S., D.N., BT., and B.C. Writing original draft: A.T., and A.S., Writing review and editing: C.D., A.T., and A.K.S Resources: C.D. and A.K.S. Funding acquisition: C.D. Project administration: C.D. and A.K.S.
Data availability
The Spatial RNASeq data is submitted as SRA accession: SRR37144029 and SRR37144030 and is available on following link: https://dataview.ncbi.nlm.nih.gov/object/PRJNA1418612?reviewer=1ibpan3m625t5hmtllmdcek4am, The CyTOF data is available on the following link: https://data.mendeley.com/preview/5jb34j4wpd?a=8fbc6644-2b11-4e69-a5d6-fad66d22bb52.
All data pertaining to metabolomic analysis is available in Supplementary tables and figures.
Competing Interests
The authors have declared that no competing interest exists.
References
1. Siegel RL, Giaquinto AN, Jemal A. Cancer statistics, 2024. CA Cancer J Clin. 2024;74(1):12-49
2. Rawat C, Heemers HV. Alternative splicing in prostate cancer progression and therapeutic resistance. Oncogene. 2024;43(22):1655-68
3. Yu EM, Aragon-Ching JB. Advances with androgen deprivation therapy for prostate cancer. Expert Opin Pharmacother. 2022;23(9):1015-33
4. Isbarn H, Boccon-Gibod L, Carroll PR, Montorsi F, Schulman C, Smith MR. et al. Androgen deprivation therapy for the treatment of prostate cancer: consider both benefits and risks. Eur Urol. 2009;55(1):62-75
5. Morote J, Aguilar A, Planas J, Trilla E. Definition of Castrate Resistant Prostate Cancer: New Insights. Biomedicines. 2022;10(3):689
6. Orum K, Stormoen DR, Lauritsen J, Rohde M, Jaattela M, Pappot H. An example of drug repurposing: ebastine in combination with docetaxel as a treatment for metastatic castration-resistant prostate cancer-the EXUROC prostate study, a clinical trial protocol. BMC Urol. 2025;25(1):154
7. Freedland SJ, Davis M, Epstein AJ, Arondekar B, Ivanova JI. Real-world treatment patterns and overall survival among men with Metastatic Castration-Resistant Prostate Cancer (mCRPC) in the US Medicare population. Prostate Cancer Prostatic Dis. 2024;27(2):327-33
8. Miller ET, Chamie K, Kwan L, Lewis MS, Knudsen BS, Garraway IP. Impact of treatment on progression to castration-resistance, metastases, and death in men with localized high-grade prostate cancer. Cancer Med. 2017;6(1):163-72
9. Fallowfield L, Payne H, Jenkins V. Patient-reported outcomes in metastatic castration-resistant prostate cancer. Nat Rev Clin Oncol. 2016;13(10):643-50
10. Vellky JE, Ricke WA. Development and prevalence of castration-resistant prostate cancer subtypes. Neoplasia. 2020;22(11):566-75
11. Zhu Y, Luo J. Regulation of androgen receptor variants in prostate cancer. Asian J Urol. 2020;7(3):251-7
12. Antonarakis ES, Armstrong AJ, Dehm SM, Luo J. Androgen receptor variant-driven prostate cancer: clinical implications and therapeutic targeting. Prostate Cancer Prostatic Dis. 2016;19(3):231-41
13. Dehm SM, Schmidt LJ, Heemers HV, Vessella RL, Tindall DJ. Splicing of a novel androgen receptor exon generates a constitutively active androgen receptor that mediates prostate cancer therapy resistance. Cancer Res. 2008;68(13):5469-77
14. Antonarakis ES, Lu C, Wang H, Luber B, Nakazawa M, Roeser JC. et al. AR-V7 and resistance to enzalutamide and abiraterone in prostate cancer. N Engl J Med. 2014;371(11):1028-38
15. Kim S, Au CC, Jamalruddin MAB, Abou-Ghali NE, Mukhtar E, Portella L. et al. AR-V7 exhibits non-canonical mechanisms of nuclear import and chromatin engagement in castrate-resistant prostate cancer. Elife. 2022;11:e73396
16. Sobhani N, Neeli PK, D'Angelo A, Pittacolo M, Sirico M, Galli IC. et al. AR-V7 in Metastatic Prostate Cancer: A Strategy beyond Redemption. Int J Mol Sci. 2021;22(11):5515
17. Lu C, Luo J. Decoding the androgen receptor splice variants. Transl Androl Urol. 2013;2(3):178-86
18. Zhan Y, Cao B, Qi Y, Liu S, Zhang Q, Zhou W. et al. Methylselenol prodrug enhances MDV3100 efficacy for treatment of castration-resistant prostate cancer. Int J Cancer. 2013;133(9):2225-33
19. Shafi AA, Cox MB, Weigel NL. Androgen receptor splice variants are resistant to inhibitors of Hsp90 and FKBP52, which alter androgen receptor activity and expression. Steroids. 2013;78(6):548-54
20. Jamroze A, Chatta G, Tang DG. Androgen receptor (AR) heterogeneity in prostate cancer and therapy resistance. Cancer Lett. 2021;518:1-9
21. Bluemn EG, Coleman IM, Lucas JM, Coleman RT, Hernandez-Lopez S, Tharakan R. et al. Androgen Receptor Pathway-Independent Prostate Cancer Is Sustained through FGF Signaling. Cancer Cell. 2017;32(4):474-89.e6
22. Xu Y, Mu J, Zhou Z, Leng Y, Yu Y, Song X. et al. Correction: Expansion of mouse castration-resistant intermediate prostate stem cells in vitro. Stem Cell Res Ther. 2022;13(1):522
23. Reyes EE, VanderWeele DJ, Isikbay M, Duggan R, Campanile A, Stadler WM. et al. Quantitative characterization of androgen receptor protein expression and cellular localization in circulating tumor cells from patients with metastatic castration-resistant prostate cancer. J Transl Med. 2014;12:313
24. Rhee JW, Adzavon YM, Sun Z. Stromal androgen signaling governs essential niches in supporting prostate development and tumorigenesis. Oncogene. 2024;43(47):3419-25
25. Ishii K, Takahashi S, Sugimura Y, Watanabe M. Role of Stromal Paracrine Signals in Proliferative Diseases of the Aging Human Prostate. J Clin Med. 2018;7(4):68
26. Kurita T, Wang YZ, Donjacour AA, Zhao C, Lydon JP, O'Malley BW. et al. Paracrine regulation of apoptosis by steroid hormones in the male and female reproductive system. Cell Death Differ. 2001;8(2):192-200
27. Hayward SW, Haughney PC, Rosen MA, Greulich KM, Weier HU, Dahiya R. et al. Interactions between adult human prostatic epithelium and rat urogenital sinus mesenchyme in a tissue recombination model. Differentiation. 1998;63(3):131-40
28. Wei G, Zhu H, Zhou Y, Pan Y, Yi B, Bai Y. Single-cell sequencing revealed metabolic reprogramming and its transcription factor regulatory network in prostate cancer. Transl Oncol. 2024;44:101925
29. Ji Y, Zhang R, Han X, Zhou J. Targeting the N-terminal domain of the androgen receptor: The effective approach in therapy of CRPC. Eur J Med Chem. 2023;247:115077
30. Han D, Labaf M, Zhao Y, Owiredu J, Zhang S, Patel K. et al. Androgen receptor splice variants drive castration-resistant prostate cancer metastasis by activating distinct transcriptional programs. J Clin Invest. 2024;134(11):e168649
31. Zhu Y, Dalrymple SL, Coleman I, Zheng SL, Xu J, Hooper JE. et al. Role of androgen receptor splice variant-7 (AR-V7) in prostate cancer resistance to 2nd-generation androgen receptor signaling inhibitors. Oncogene. 2020;39(45):6935-49
32. Yi Q, Liu W, Seo JH, Su J, Alaoui-Jamali MA, Luo J. et al. Discovery of a Small-Molecule Inhibitor Targeting the Androgen Receptor N-Terminal Domain for Castration-Resistant Prostate Cancer. Mol Cancer Ther. 2023;22(5):570-82
33. Dahiya NR, Chandrasekaran B, Kolluru V, Ankem M, Damodaran C, Vadhanam MV. A natural molecule, urolithin A, downregulates androgen receptor activation and suppresses growth of prostate cancer. Mol Carcinog. 2018;57(10):1332-41
34. Navin AK, Rejani CT, Chandrasekaran B, Tyagi A. Urolithins: Emerging natural compound targeting castration-resistant prostate cancer (CRPC). Biomed Pharmacother. 2025;187:118058
35. Stanislawska IJ, Piwowarski JP, Granica S, Kiss AK. The effects of urolithins on the response of prostate cancer cells to non-steroidal antiandrogen bicalutamide. Phytomedicine. 2018;46:176-83
36. Garcia-Villalba R, Gimenez-Bastida JA, Cortes-Martin A, Avila-Galvez MA, Tomas-Barberan FA, Selma MV. et al. Urolithins: a Comprehensive Update on their Metabolism, Bioactivity, and Associated Gut Microbiota. Mol Nutr Food Res. 2022;66(21):e2101019
37. Tang L, Chen X, Kong XM, Liu TW, Feng XQ, Chen FE, Zhuang ZH. Anti-aging effect of methylurolithin A and its amide derivatives on nematode Caenorhabditis elegans. Tetrahedron Lett. 2023;118:154389
38. Chandrasekaran B, Tyagi A, Saran U, Kolluru V, Baby BV, Chirasani VR. et al. Urolithin A analog inhibits castration-resistant prostate cancer by targeting the androgen receptor and its variant, androgen receptor-variant 7. Front Pharmacol. 2023;14:1137783
39. Bolte S, Cordelieres FP. A guided tour into subcellular colocalization analysis in light microscopy. J Microsc. 2006;224(3):213-32
40. Tyagi A, Chandrasekaran B, Kolluru V, Baby BV, Sripathi CA, Ankem MK. et al. ASR490, a Small Molecule, Overrides Aberrant Expression of Notch1 in Colorectal Cancer. Mol Cancer Ther. 2020;19(12):2422-31
41. Zou Z, Ohta T, Oki S. ChIP-Atlas 3.0: a data-mining suite to explore chromosome architecture together with large-scale regulome data. Nucleic Acids Res. 2024;52(W1):W45-W53
42. Michiel Sedelaar JP, Dalrymple SS, Isaacs JT. Of mice and men-warning: intact versus castrated adult male mice as xenograft hosts are equivalent to hypogonadal versus abiraterone treated aging human males, respectively. Prostate. 2013;73(12):1316-25
43. He Y, Wei T, Ye Z, Orme JJ, Lin D, Sheng H. et al. A noncanonical AR addiction drives enzalutamide resistance in prostate cancer. Nat Commun. 2021;12(1):1521
44. Xu K, Shimelis H, Linn DE, Jiang R, Yang X, Sun F. et al. Regulation of androgen receptor transcriptional activity and specificity by RNF6-induced ubiquitination. Cancer Cell. 2009;15(4):270-82
45. McClurg UL, Cork DMW, Darby S, Ryan-Munden CA, Nakjang S, Mendes Cortes L. et al. Identification of a novel K311 ubiquitination site critical for androgen receptor transcriptional activity. Nucleic Acids Res. 2017;45(4):1793-804
46. Moffatt BA, Ashihara H. Purine and pyrimidine nucleotide synthesis and metabolism. Arabidopsis Book. 2002;1:e0018
47. Cherepanova N, Shrimal S, Gilmore R. N-linked glycosylation and homeostasis of the endoplasmic reticulum. Curr Opin Cell Biol. 2016;41:57-65
48. He B, Kemppainen JA, Wilson EM. FXXLF and WXXLF sequences mediate the NH2-terminal interaction with the ligand binding domain of the androgen receptor. J Biol Chem. 2000;275(30):22986-94
49. Ferraldeschi R, Welti J, Luo J, Attard G, de Bono JS. Targeting the androgen receptor pathway in castration-resistant prostate cancer: progresses and prospects. Oncogene. 2015;34(14):1745-57
50. Banuelos CA, Ito Y, Obst JK, Mawji NR, Wang J, Hirayama Y. et al. Ralaniten Sensitizes Enzalutamide-Resistant Prostate Cancer to Ionizing Radiation in Prostate Cancer Cells that Express Androgen Receptor Splice Variants. Cancers (Basel). 2020;12(7):1991
51. Banuelos CA, Lal A, Tien AH, Shah N, Yang YC, Mawji NR. et al. Characterization of niphatenones that inhibit androgen receptor N-terminal domain. PLoS One. 2014;9(9):e107991
52. Banuelos CA, Tavakoli I, Tien AH, Caley DP, Mawji NR, Li Z. et al. Sintokamide A Is a Novel Antagonist of Androgen Receptor That Uniquely Binds Activation Function-1 in Its Amino-terminal Domain. J Biol Chem. 2016;291(42):22231-43
53. Sadar MD. Small molecule inhibitors targeting the "achilles' heel" of androgen receptor activity. Cancer Res. 2011;71(4):1208-13
54. Myung JK, Banuelos CA, Fernandez JG, Mawji NR, Wang J, Tien AH. et al. An androgen receptor N-terminal domain antagonist for treating prostate cancer. J Clin Invest. 2013;123(7):2948-60
55. Obst JK, Wang J, Jian K, Williams DE, Tien AH, Mawji N. et al. Revealing Metabolic Liabilities of Ralaniten To Enhance Novel Androgen Receptor Targeted Therapies. ACS Pharmacol Transl Sci. 2019;2(6):453-67
56. Sadar MD. Discovery of drugs that directly target the intrinsically disordered region of the androgen receptor. Expert Opin Drug Discov. 2020;15(5):551-60
57. Masoodi KZ, Xu Y, Dar JA, Eisermann K, Pascal LE, Parrinello E. et al. Inhibition of Androgen Receptor Nuclear Localization and Castration-Resistant Prostate Tumor Growth by Pyrroloimidazole-based Small Molecules. Mol Cancer Ther. 2017;16(10):2120-9
58. Yang Z, Wang D, Johnson JK, Pascal LE, Takubo K, Avula R. et al. A Novel Small Molecule Targets Androgen Receptor and Its Splice Variants in Castration-Resistant Prostate Cancer. Mol Cancer Ther. 2020;19(1):75-88
59. Niknami Z, Muhammadnejad A, Ebrahimi A, Harsani Z, Shirkoohi R. Significance of E-cadherin and Vimentin as epithelial-mesenchymal transition markers in colorectal carcinoma prognosis. EXCLI J. 2020;19:917-26
60. Chan JM, Zaidi S, Love JR, Zhao JL, Setty M, Wadosky KM. et al. Lineage plasticity in prostate cancer depends on JAK/STAT inflammatory signaling. Science. 2022;377(6611):1180-91
61. Olson A, Le V, Aldahl J, Yu EJ, Hooker E, He Y. et al. The comprehensive role of E-cadherin in maintaining prostatic epithelial integrity during oncogenic transformation and tumor progression. PLoS Genet. 2019;15(10):e1008451
62. Liu C, Lou W, Yang JC, Liu L, Armstrong CM, Lombard AP. et al. Proteostasis by STUB1/HSP70 complex controls sensitivity to androgen receptor targeted therapy in advanced prostate cancer. Nat Commun. 2018;9(1):4700
63. Chandrasekar T, Yang JC, Gao AC, Evans CP. Mechanisms of resistance in castration-resistant prostate cancer (CRPC). Transl Androl Urol. 2015;4(3):365-80
64. Loizzo D, Pandolfo SD, Rogers D, Cerrato C, di Meo NA, Autorino R. et al. Novel Insights into Autophagy and Prostate Cancer: A Comprehensive Review. Int J Mol Sci. 2022;23(7):3826
65. Nguyen HG, Yang JC, Kung HJ, Shi XB, Tilki D, Lara PN Jr. et al. Targeting autophagy overcomes Enzalutamide resistance in castration-resistant prostate cancer cells and improves therapeutic response in a xenograft model. Oncogene. 2014;33(36):4521-30
66. Linder B, Kogel D. Autophagy in Cancer Cell Death. Biology (Basel). 2019 8(4)
67. Selvaraj S, Sun Y, Sukumaran P, Singh BB. Resveratrol activates autophagic cell death in prostate cancer cells via downregulation of STIM1 and the mTOR pathway. Mol Carcinog. 2016;55(5):818-31
68. Li CL, Wei HL, Chen J, Wang B, Xie B, Fan LL. et al. Arsenic trioxide induces autophagy and antitumor effects in Burkitt's lymphoma Raji cells. Oncol Rep. 2014;32(4):1557-63
69. Chen RH, Chen YH, Huang TY. Ubiquitin-mediated regulation of autophagy. J Biomed Sci. 2019;26(1):80
70. Kocaturk NM, Gozuacik D. Crosstalk Between Mammalian Autophagy and the Ubiquitin-Proteasome System. Front Cell Dev Biol. 2018;6:128
71. Korolchuk VI, Menzies FM, Rubinsztein DC. Mechanisms of cross-talk between the ubiquitin-proteasome and autophagy-lysosome systems. FEBS Lett. 2010;584(7):1393-8
72. Kirkin V, McEwan DG, Novak I, Dikic I. A role for ubiquitin in selective autophagy. Mol Cell. 2009;34(3):259-69
73. Wadosky KM, Shourideh M, Goodrich DW, Koochekpour S. Riluzole induces AR degradation via endoplasmic reticulum stress pathway in androgen-dependent and castration-resistant prostate cancer cells. Prostate. 2019;79(2):140-50
74. Hesselink G, Johnson J, Batalden P, Carlson M, Geense W, Groenewoud S. et al. 'Reframing Healthcare Services through the Lens of Co-Production' (RheLaunCh): a study protocol for a mixed methods evaluation of mechanisms by which healthcare and social services impact the health and well-being of patients with COPD and CHF in the USA and The Netherlands. BMJ Open. 2017;7(9):e017292
75. Aksu-Menges E, Eylem CC, Nemutlu E, Gizer M, Korkusuz P, Topaloglu H. et al. Reduced mitochondrial fission and impaired energy metabolism in human primary skeletal muscle cells of Megaconial Congenital Muscular Dystrophy. Sci Rep. 2021;11(1):18161
76. Uo T, Sprenger CC, Plymate SR. Androgen Receptor Signaling and Metabolic and Cellular Plasticity During Progression to Castration Resistant Prostate Cancer. Front Oncol. 2020;10:580617
77. Gonthier K, Poluri RTK, Audet-Walsh E. Functional genomic studies reveal the androgen receptor as a master regulator of cellular energy metabolism in prostate cancer. J Steroid Biochem Mol Biol. 2019;191:105367
78. Chen Y, Lin PH, Freedland SJ, Chi JT. Metabolic Response to Androgen Deprivation Therapy of Prostate Cancer. Cancers (Basel). 2024;16(11):1991
79. Chi JT, Lin PH, Tolstikov V, Oyekunle T, Chen EY, Bussberg V. et al. Metabolomic effects of androgen deprivation therapy treatment for prostate cancer. Cancer Med. 2020;9(11):3691-702
80. Brand LJ, Olson ME, Ravindranathan P, Guo H, Kempema AM, Andrews TE. et al. EPI-001 is a selective peroxisome proliferator-activated receptor-gamma modulator with inhibitory effects on androgen receptor expression and activity in prostate cancer. Oncotarget. 2015;6(6):3811-24
81. Tekur S, Ho SM. Ribozyme-mediated downregulation of human metallothionein II(a) induces apoptosis in human prostate and ovarian cancer cell lines. Mol Carcinog. 2002;33(1):44-55
82. Xu Y, Han X, You S, Zhu W, Zhang M, Lu C. et al. SLC45A4 is involved in malignant progression of ovarian cancer through glycolytic metabolic reprogramming. Sci Rep. 2024;14(1):23031
83. Si M, Lang J. The roles of metallothioneins in carcinogenesis. J Hematol Oncol. 2018;11(1):107
84. Chen W, Huang F, Huang J, Li Y, Peng J, Zhuang Y. et al. SLC45A4 promotes glycolysis and prevents AMPK/ULK1-induced autophagy in TP53 mutant pancreatic ductal adenocarcinoma. J Gene Med. 2021;23(9):e3364
85. Thysell E, Surowiec I, Hornberg E, Crnalic S, Widmark A, Johansson AI. et al. Metabolomic characterization of human prostate cancer bone metastases reveals increased levels of cholesterol. PLoS One. 2010;5(12):e14175
86. Sreekumar A, Poisson LM, Rajendiran TM, Khan AP, Cao Q, Yu J. et al. Metabolomic profiles delineate potential role for sarcosine in prostate cancer progression. Nature. 2009;457(7231):910-4
87. He M, Zhou X, Wang X. Glycosylation: mechanisms, biological functions and clinical implications. Signal Transduct Target Ther. 2024;9(1):194
88. Lin Y, Lubman DM. The role of N-glycosylation in cancer. Acta Pharm Sin B. 2024;14(3):1098-110
89. Peixoto A, Relvas-Santos M, Azevedo R, Santos LL, Ferreira JA. Protein Glycosylation and Tumor Microenvironment Alterations Driving Cancer Hallmarks. Front Oncol. 2019;9:380
90. Khosrowabadi E, Wenta T, Keskitalo S, Manninen A, Kellokumpu S. Altered glycosylation of several metastasis-associated glycoproteins with terminal GalNAc defines the highly invasive cancer cell phenotype. Oncotarget. 2022;13:73-89
91. Breiman A, Lopez Robles MD, de Carne Trecesson S, Echasserieau K, Bernardeau K, Drickamer K. et al. Carcinoma-associated fucosylated antigens are markers of the epithelial state and can contribute to cell adhesion through CLEC17A (Prolectin). Oncotarget. 2016;7(12):14064-82
92. Ippolito JE, Hartig JP, Bejar K, Nakhoul H, Sehn JK, Weimholt C. et al. N-Linked Fucosylated Glycans Are Biomarkers for Prostate Cancer with a Neuroendocrine and Metastatic Phenotype. Mol Cancer Res. 2025;23(1):59-70
93. Chia J, Goh G, Bard F. Short O-GalNAc glycans: regulation and role in tumor development and clinical perspectives. Biochim Biophys Acta. 2016;1860(8):1623-39
94. Xu S, Zheng J, Xiao H, Wu R. Simultaneously Identifying and Distinguishing Glycoproteins with O-GlcNAc and O-GalNAc (the Tn Antigen) in Human Cancer Cells. Anal Chem. 2022;94(7):3343-51
Author contact
Corresponding author: Chendil Damodaran, Texas A&M Rangel College of Pharmacy, 159 Reynolds Medical Bldg., MS 1114, College Station, Texas 77843; Phone: 979.436.0495; chendamodaredu.