Impact Factor
- Issue 14; 2026
- Issue 13; 2026
- Issue 12; 2026
- Issue 11; 2026
- Issue 10; 2026
- Volume 16; 2026
- Advance Articles
- Past Issues
- Cover Images
- Cover Suggestion
- Index & Coverage
- Special Issues
Introduction
Materials and Methods
Results
Discussion
Abbreviations
Supplementary Material
Acknowledgements
References
International Journal of Biological Sciences
International Journal of Medical Sciences
 Global reach, higher impact

Theranostics 2026; 16(7):3263-3285. doi:10.7150/thno.122688 This issue Cite
Research Paper
Hilnc-mediated UCP1 translation repression contributes to thermogenesis and energy expenditure
Man Jiang1,2,#, Yu Li1,#, ![]() , Yiao Jiang3,4,#, Runze Wang1, Jiayin Peng1, Yuang Wang1, Zhen Qu1, Yi Chang5,
, Yiao Jiang3,4,#, Runze Wang1, Jiayin Peng1, Yuang Wang1, Zhen Qu1, Yi Chang5, ![]() , Zhao Zhang3,4,
, Zhao Zhang3,4, ![]() , Yun Zhao1,2,6,*,
, Yun Zhao1,2,6,*, ![]()
1. Key Laboratory of Multi-Cell Systems, Shanghai Institute of Biochemistry and Cell Biology, Center for Excellence in Molecular Cell Science, Chinese Academy of Sciences, University of Chinese Academy of Sciences, Shanghai, China.
2. School of Life Science and Technology, ShanghaiTech University, Shanghai, China.
3. Center for the Genetics of Host Defense, University of Texas Southwestern Medical Center, Dallas, TX, USA.
4. Division of Endocrinology, Department of Internal Medicine, University of Texas Southwestern Medical Center, Dallas, TX, USA.
5. Department of Medical Aesthetic, Yangpu Hospital, Tongji University School of Medicine, Shanghai, China.
6. School of Life Science, Hangzhou Institute for Advanced Study, University of Chinese Academy of Sciences, Hangzhou, China.
*Lead contact.
#These authors contributed equally.
Received 2025-7-29; Accepted 2025-11-27; Published 2026-1-1
Abstract

Background: Beige adipocytes play a critical role in thermoregulation by upregulating uncoupling protein 1 (UCP1) upon stimulation. While the transcriptional regulation of UCP1 in adipose tissue has been extensively investigated, the mechanisms governing its translational control remain largely elusive.
Methods: A cold exposure protocol was employed to induce beige adipocyte biogenesis in mouse subcutaneous fat. The overall metabolic rate of mice was monitored by metabolic cage. Primary adipocyte precursors were isolated from the stromal vascular fraction (SVF) of inguinal white adipose tissue (iWAT) and differentiated into beige adipocytes using a standard adipogenic induction cocktail. Transmission electron microscopy (TEM) was utilized to examine mitochondrial morphology. Functional rescue experiments were performed via adenovirus-mediated gene overexpression. Potential binding partners were screened by LC-MS/MS, while RNA immunoprecipitation (RIP) and RNase protection assay (RPA) were applied to evaluate RNA-protein and RNA-RNA interactions, respectively. Additional mechanistic insights were obtained through qPCR, Western blotting, Immunohistochemistry and bioinformatics analyses.
Results: In this study, we discovered that Hilnc, a long non-coding RNA (lncRNA), functions in beige adipocytes by suppressing UCP1 translation. Adipocyte-specific Hilnc-deficient mice display increased energy expenditure, elevated body temperature, smaller inguinal white adipose tissue volume and coupling efficiency, and elevated UCP1 protein level. Hilnc binds to the 3' untranslated region of Ucp1 mRNA and recruits insulin-like growth factor 2 binding protein 2 for translational suppression. The previously characterized human Hilnc functional homolog negatively correlates with UCP1 protein levels in human adipose tissues and suppresses UCP1 translation via similar mechanisms.
Conclusion: Our findings highlight Hilnc's post-transcriptional role in thermoregulation in beige adipocytes and offer new insights into the variability of thermogenesis among individuals.
Keywords: beige adipocytes, UCP1, long non-coding RNA, translational regulation, thermogenesis
Introduction
Adipose tissues are recognized as important players in the maintenance of energy homeostasis of various organisms, with recent studies highlighting their diverse roles including body temperature regulation, hormone production, and immune response modulation [1-5]. Beige adipocytes represent a lineage of adipocytes that undergo reprogramming in response to external stimuli such as low temperatures and hormones, and express thermogenic genes similar to those observed in brown adipose tissues (BATs), thereby acquiring thermogenic capabilities [6-8]. The thermogenic abilities of BATs and beige adipocytes are largely attributed to their cellular mitochondria [9]. Brown and beige adipocytes contain more mitochondria than their white adipocyte counterparts, and these mitochondria have a higher concentration of the uncoupling protein UCP1 in their inner membranes. UCP1 functions as a thermogenic protein by uncoupling the mitochondrial electron transport chain from ATP production, allowing protons to flow freely into the mitochondrial matrix, thereby dissipating energy as heat. UCP1 is central to non-shivering thermogenesis in mammals, and its expression level directly correlates with thermogenic activity under varying physiological conditions [10-13]. The expression of UCP1 in adipose tissues is regulated through complex mechanisms, with existing research predominantly focusing on transcription factor-mediated regulation [14-25]. However, the post-transcriptional regulation of UCP1, including mechanisms controlling mRNA stability and translation, remains less well understood [26-28]. A deeper understanding of these post-transcriptional processes is essential to fully elucidate how UCP1 levels are regulated and how thermogenic capacity is controlled.
Long non-coding RNAs (lncRNAs) are a group of RNA molecules longer than 200 nt that possess no protein potential or only contain small open reading frames [29]. LncRNAs were found to modulate cellular gene expression at multiple levels, including transcription, translation, and post-translational control [30, 31]. In recent years, lncRNAs have been identified as key regulators of metabolic processes and contributors to the development of metabolic disorders. They modulate lipid absorption, metabolism, adipocyte differentiation, and adjust body energy balance and thermogenesis [32-37]. Although several lncRNAs have implicated in the transcriptional regulation of UCP1 [36], their potential role in post-transcriptional control has remained unexplored and unanticipated.
Our laboratory previously identified Hilnc, a Hedgehog signaling pathway-induced lncRNA, and demonstrated its role in regulating lipid metabolism in the liver. The Hilnc gene is located on chromosome 10 (chr10: 39,432,067-39,489,678). According to the latest NCBI records, the mature Hilnc transcript is 801 nucleotides in length, which includes a polyA tail. Functionally, we observed that both HilncBM/BM mice (carrying a Gli-binding site mutation in the Hilnc promoter) and Hilnc knockout mice are protected from high-fat diet-induced obesity and the development of hepatic steatosis [34]. We subsequently found that Hilnc also affects various adipose tissues, promoting further investigation into its potential role in adipocyte biology. In this study, we show that adipocyte-specific Hilnc-deficient mice display altered inguinal white adipose tissue (iWAT) morphology and increased overall energy expenditure, which is linked to increased adipocyte beiging in iWATs. Mechanistically, Hilnc suppresses UCP1 protein levels in beige adipocytes by inhibiting Ucp1 mRNA translation. The human homolog of Hilnc (h-Hilnc), previously discovered by our group, is expressed in human adipose tissues and suppresses UCP1 mRNA translation via a similar mechanism. These findings reveal a previously unrecognized, evolutionarily functionally conserved role for lncRNAs in regulating thermogenesis through post-transcriptional mechanisms, and highlight the therapeutic potential of targeting lncRNAs to modulate systemic energy homeostasis.
Materials and Methods
Human sample acquisition and Ethics Statement
All human adipose tissue samples were obtained from the Yangpu District Central Hospital of Shanghai, China, with sampling conducted after informed consent was obtained. Sex was not considered as a biological variable. The study was approved by the Institutional Review Board of the Center for Excellence in Molecular Cell Science (CEMCS), Chinese Academy of Sciences (approval no. 2024-164).
Animals
All mice used in this study have a C57BL/6 background. Sex was not considered as a biological variable. The Hilncf/f mice were generated using CRISPR-Cas9 technology (provided by Cyagen Biosciences). The loxP sites were inserted upstream of exon 2 and downstream of exon 3 of the Hilnc genomic locus. Hilncf/f mice were crossed with AdipoQ-Cre mice (Jackson Laboratory, 028020) or UCP1-Cre mice (a thankful gift from Prof. Hao Ying at Shanghai Institute of Nutrition and Health, Shanghai, China) as indicated in the previous reports [38, 39].
For room temperature experiments, mice were housed in an environment maintained at a temperature of 22-25 °C and a humidity of 40-60%, with a 12/12 h light-dark cycle. To completely eliminate the confounding effects of cold stress, a subset of mice was maintained at a thermoneutral temperature of 30 °C and a humidity of 40-60%, with a 12/12 h light-dark cycle. For 4 °C cold acclimation model, mice were housed for 1-3 weeks in an environmental chamber (Forma™, Thermo Scientific) maintained at temperature of 4 °C and humidity of 40-60%, with a 12/12 h light-dark cycle. For cold re-exposure experiments, mice that have undergone cold acclimation for 3 weeks were returned to room temperature for 1 h, then returned to the cold environmental chamber for 12 h. Rectal temperatures of mice were measured using BAT-12 Microprobe Thermometer with RET-3 Rectal Probe for Mice (Physitemp). Mice were fed either a high-fat diet (HFD; 60% fat; Research Diets) or a normal chow diet (NCD) and had free access to water. Body composition (fat and lean mass) was determined by NMRI (NIUMAG analytical instrument, NM42-060H-I). During experiments, mice were processed between 12:00 and 18:00. All mouse experiments were conducted in accordance with the guidelines of the Institutional Animal Care and Use Committee of the Institute of Biochemistry and Cell Biology, Shanghai Institutes for Biological Sciences, Chinese Academy of Sciences (SIBCB-S313-2305-14).
Cell Culture and Transfection
3T3-L1, NIH 3T3, and HEK293T cell lines were cultured in high-glucose Dulbecco's Modified Eagle Medium (MeilunBio, MA0212) supplemented with 10% fetal bovine serum (Gibco, A5256701) and 1% penicillin-streptomycin (MeilunBio, MA0110-1). Cells were maintained in a humidified incubator at 37 °C with 5% CO₂ and passaged every 2-3 days at a 1:4 split ratio.
For the cell transfection experiments, the Lipofectamine™ 3000 reagent (Invitrogen, L3000015) was used to transfect the plasmids according to manufacturer's recommendations. Samples were collected 48 h post-transfection for further analysis.
Plasmids
Fragments required for overexpression was cloned into the pcDNA3.1(+) vector using standard cloning techniques. These fragments including full-length Hilnc cDNA, HilncΔ450-600, Ucp1 mRNA, Igf2bp2 CDS, UCP1 CDS, UCP1 CDS + 3'UTR. Empty pcDNA3.1(+) vectors were used as negative controls. pCDH (GFP-tag) were used as a transfection efficiency reference.
The construction of the PsiCHECK-2 plasmid system involved inserting the 3'UTR regions of Ucp1 mRNA and UCP1 mRNA downstream of the Renilla luciferase CDS in the PsiCHECK-2 plasmid. This setup was used to assess the impact of the Ucp1 and UCP1 3'UTRs on protein translation efficiency, respectively. Firefly luciferase served as the internal control in this dual-luciferase system.
These sequences were verified by Sanger sequencing.
Metabolic Phenotyping
Metabolic characteristics of the mice were assessed using a custom indirect calorimetry system (Columbus × Oxymax/CLAMS). Mice were housed individually in metabolic cages for 72 h to measure oxygen consumption (VO₂), carbon dioxide production (VCO₂), respiratory exchange ratio (RER), energy expenditure (EE), locomotor activity, and food intake.
For the Norepinephrine Bitartrate Monohydrate (NA) injection experiment, 2 mg/kg NA (MCE, HY-13715B) dissolved in PBS was administered via intraperitoneal injection to the mice. Metabolic parameters were monitored for 1 h post-injection. The mice resumed normal activities within 1 h after NA injection and showed no adverse effects.
Data were collected and analyzed using the Oxymax software.
Histology, Immunohistochemistry & Oil red O stain
Freshly dissected mouse brown adipose tissues (BATs), epidydimal white adipose tissues (eWATs), and inguinal white adipose tissues (iWATs) (all from 8 weeks old mice) were fixed in 4% paraformaldehyde and embedded in paraffin. Paraffin-embedded sections (4μm) were stained using Histostain™-SP Kit (ZSGB-bio, SPN-9002), with the specific steps carried out according to the instructions provided in the kit. Briefly, for permeabilization before staining, sections were treated with PBS containing 0.1% Triton X-100. Antigen retrieval was performed using sodium citrate antigen retrieval solution (Solarbio, C1032-100). The retrieval process involved immersing the sections in the antigen retrieval solution and heating them in a pressure cooker to full pressure, followed by continued heating for 10 min. The sections were allowed to cool to room temperature, then stained with anti-UCP1 (Abcam, ab10983-50µL) or anti-TOM20 (Proteintech, 11802-1-AP) antibodies, respectively. The hematoxylin and eosin (H&E) staining was performed according to the standard protocol (Beyotime, C0105M).
For Oil red O stains to assess lipid content within cells, differentiated cells were washed once with PBS. Cells were fixed with 10% formaldehyde solution for 30 min at room temperature. After two washes with distilled water, cells were permeabilized with 60% isopropanol for 5 min. Freshly prepared Oil Red O (Sigma, O0625) working solution was added to cover the cells and incubated on a rocker at room temperature for 10-20 min. Cells were gently washed with distilled water to remove excess stain. Lipid droplets were visualized under a microscope as red droplets. Quantification of lipid droplet size from Oil Red O-stained images was performed using ImageJ.
Western Blotting
Cells were lysed in cell lysis buffer (Cell Signaling Technology, 9803S) supplemented with protease inhibitor cocktail (Targetmol, C0001). The lysates were sonicated and centrifuged until the cell lysate was clear. Tissues were homogenized in ice-cold cell lysis buffer containing protease inhibitor cocktail with tissue homogenizer (Bead Ruptor 24 Elite, OMNI International). The tissue or cell lysates were resolved on 10% SDS-PAGE gels and then electrotransferred onto PVDF membranes. Proteins were stained with anti-ACTIN (ABclonal, AC038), anti-GFP (Proteintech, 66002-1-IG), anti-UCP1 (Abcam, ab10983-50μL), anti-TOM20 (Proteintech, 11802-1-AP), or anti-IGF2BP2 (Proteintech, 82757-2-RR) overnight at 4 °C, then with HRP-conjugated antibodies of the corresponding species specificities, respectively (anti-rabbit: Invitrogen, 31460; anti-mouse: Invitrogen, 31430). Stained membranes were visualized using Enhanced ECL Chemiluminescent Detection Kit (Vazyme, E411-05) with Tanon 5200 Chemiluminescence Imaging System. Band intensity was quantified using ImageJ.
Tissue Respiration by Seahorse Analyzer
iWAT blocks (2 mg - 5 mg) were immobilized at the bottom of XF24 Islet Capture Microplates (Agilent Seahorse, 101122-100). Each well was filled with 525 μL of XF DMEM Base Medium (pH 7.4; Agilent Seahorse, 103575-100). During the measurement, the following inhibitors were dissolved in XF DMEM Base Medium and injected sequentially: 75 μL Oligomycin A (final concentration = 15μM) (Selleck, S1478); 75μL of FCCP (final concentration = 20μM) (Sigma, C2920); 75μL of Rotenone (final concentration = 10 μM) (Sigma, R8875-1G) and Antimycin A (final concentration = 10μM) (BioVision, 2247-50MG). Experimental parameters were set up according to the Agilent Seahorse XFe24 Analyzer user manual. GraphPad Prism was used to generate OCR time course plots and bar charts to illustrate the differences between different treatment groups.
Mitochondrial Isolation and ATP Assay
Mouse iWATs were dissected to remove lymph nodes, and mitochondria were isolated and purified using a mitochondrial isolation kit (Proteintech, PK10016). The purified mitochondria were counted under a microscope with Janus Green B staining. All mitochondrial samples were adjusted to the same uniform density. Subsequently, an equal number of mitochondria from tissues of different genotypes were boiled for 2 min to release ATP, which was immediately measured following the manufacturer's instructions of the ATP assay kit (HY-K0314, MCE) [40]. The ATP concentration in the mitochondria was calculated based on the standard curve generated by the kit.
Stromal Vascular Fraction (SVF) Isolation and Differentiation
SVF isolation was performed according to previous protocols with minor modifications [41, 42]. Briefly, iWATs were carefully dissected using ophthalmic scissors and forceps, and lymph nodes were removed. The adipose tissues were placed in sterile Eppendorf tubes and cut into small pieces. The tissues were then transferred to 15 mL centrifuge tubes and digested with approximately 5 times tissue volume of Krebs-Ringer bicarbonate (KRB) buffer (118 mM NaCl, 5 mM KCl, 2.5 mM CaCl2, 2 mM KH2PO4, 2mM MgSO4, 25 mM NaHCO3, 5 mM glucose, pH 7.4. With 1.5 μg/mL collagenase I (Thermofisher-Invitrogen, 17018029) and 3% BSA) at 37 °C with shaking at 140 rpm for 40 min to help break down the extracellular matrix. After terminating the digestion by adding 1/3 total volume of FBS, the suspensions were centrifuged at 500 × g to remove the upper layer of floating adipocytes and the supernatant. The pellets were washed three times with PBS, and the pelleted SVFs was filtered through a 70 μm cell strainer to obtain single-cell suspensions. The cells were then resuspended in complete culture medium (DMEM/F12 with 14% FBS, 1% Penicillin-Streptomycin, 1% GlutaMAX (Gibco)) and cultured. When the cells reached 120% confluence, they were treated with induction differentiation medium (0.5 mM 3-Isobutyl-1-methylxanthine (IBMX) (Sigma, I5879), 1 μM dexamethasone (Sigma, D4902), 1 μg/mL insulin (Solarbio, I8040), 1 μM rosiglitazone (Targetmol, T0334), 1 nM 3,3',5-Triiodo-l-thyronine (T3) (Sigma, T2877) in complete culture medium) for 2 days. Subsequently, the medium was replaced with maintenance medium (1 μg/mL Insulin and 1 nM T3 in complete culture medium) for 4-6 days until visible lipid droplet accumulation was observed within the cells.
For evaluation of UCP1 protein stability in cells, 50μM cycloheximide (CHX in DMSO solution, MCE, HY-12320) was added to the culture medium after SVF differentiation was completed. Samples were collected at 0 h, 3 h, 6 h, 9 h, 12 h, and 15 h post-treatment for protein lysis and subsequent western blotting analysis.
Flow Cytometry Analysis of SVF Cells
The digested iWATs were filtered through a cell strainer, washed with FACS buffer (PBS + 2% heat-inactivated FBS), and centrifuged at 500 × g for 10 min at 4 °C. The supernatant was removed, and the pelleted SVF was resuspended in 1mL red blood cell lysis buffer (containing sodium bicarbonate, ammonium chloride, and 0.5 M EDTA; pH 7.4) and incubated at room temperature for 1 min. 10mL cold PBS were added to stop the lysis, and the cells were then filtered through a 70 μm sterile cell strainer and centrifuged at 500 × g for 10 min at 4 °C.
Single cells were stained with anti-CD45 (Biolegend, S18009F, 157203), anti-CD31 (Biolegend, W18222B, 160211), anti-SCA1 (Biolegend, D7, 108107) in FACS buffer for 30 min, followed by viability staining with 1 μg/mL DAPI in FACS buffer for 5 min. Cells were washed twice with PBS and resuspended in PBS for analysis.
RNA-Seq and Analysis
The workflow comprised the following steps: library preparation & sequencing: total RNA was extracted, and mRNA was enriched using poly-T magnetic beads. After fragmentation and cDNA synthesis, libraries were constructed and sequenced on an Illumina platform following quality control (Bioanalyzer 2100, Qubit, real-time PCR). Data processing: raw reads were processed with fastp for quality control and adapter removal. Clean reads were aligned to the reference genome using Hisat2 v2.0.5. Expression quantification: gene counts were obtained with FeatureCounts v1.5.0-p3 and FPKM values were calculated. Differential analysis: DESeq2 was used to identify differentially expressed genes (threshold: adjusted P-value ≤ 0.05 and |log2(foldchange)| ≥ 0.5). Pathway analysis: KEGG pathway enrichment was tested using clusterProfiler.
RNA Extraction, Reverse Transcription-Polymerase Chain Reaction (RT-PCR) and Quantitative PCR (RT-qPCR)
Total RNA was extracted from cells by directly adding Trizol (Invitrogen) and homogenizing, and from tissues by adding Trizol and using a tissue homogenizer to assist in tissue lysis. RNA extraction was performed using the standard method involving chloroform extraction and isopropanol precipitation. For reverse transcription of RNAs into cDNAs, 0.5-1μg of RNA was reverse-transcribed using HiScript III RT SuperMix for qPCR (+ gDNA wiper) (Vazyme, R312-02). For PCR of reverse transcribed products, the reactions were set up with 2 × Phanta Max Master Mix (Vazyme, P515) with the cDNA as template, and the product was resolved on agarose gels. Quantitative PCR (qPCR) was performed using AceQ Universal SYBR qPCR Master Mix (Vazyme, Q511-02) with cDNA as template. Quantification was performed using the 2 ^ (-ΔΔCt) method. Primers used are listed in the Table S4.
Transmission Electron Microscopy (TEM) Imaging
TEM samples of iWATs were prepared, sectioned, and stained according to the standard protocols provided by the Electron Microscopy Platform of the Institute of Biochemistry and Cell Biology, Shanghai Institutes for Biological Sciences, Chinese Academy of Sciences. The following is a brief description of the sample preparation method: On the first day, excise samples to a size of approximately 1 mm³ and place them in Eppendorf tubes containing 2.5% glutaraldehyde, fully immersing them, and fix overnight at 4 °C. On the second day, aspirate the fixative solution and wash the samples three times with PBS by gentle shaking for 10 min each time. After washing with PBS, rinse the samples with deionized water by gentle shaking. Fix the samples with 1% osmium tetroxide at room temperature for 1.5 h. Aspirate the osmium tetroxide and wash the samples three times with deionized water, each for 10 min. Dehydrate the samples gradually using ethanol solutions of increasing concentrations (30%, 50%, 70%, 80%, 95%, and 100%) for 10 min each, with gentle shaking. Repeat the 100% ethanol dehydration step once. Replace ethanol with 100% acetone twice, each for 15 min with gentle shaking. Infiltrate the samples in a 1:1 mixture of Epon812 resin and acetone by gentle shaking for 2 h, then infiltrate overnight in pure Epon812 resin. On the third day, transfer the samples to embedding molds, add an appropriate amount of Epon812 resin, adjust the sample position as needed, and place the molds in a 60 °C oven for polymerization for 48 h. Prepare ultrathin sections (~ 70 nm) from the embedded samples and stain them with a 2% aqueous uranyl acetate solution at room temperature for 10-20 min, avoiding light exposure during staining. Stain the sections with lead citrate for 5-10 min, taking care to prevent CO₂ contamination during staining. After completing the staining process, the samples are ready for observation and imaging under the transmission electron microscope.
Dual Luciferase Assay
For cell transfection followed by dual luciferase reporter assays, HEK293T cells or NIH 3T3 cells were co-transfected with PsiCHECK-2 plasmid constructs and OE-Hilnc/OE-h-Hilnc/pcDNA3.1(+) plasmids. 48 h post-transfection, cell lysates were harvested, and dual luciferase activity was measured with Dual-Luciferase® Reporter Assay System (Promega, E1910) according to the manufacturer's instructions, using a GloMax 20/20 Luminometer (Promega).
For in vitro translation followed by dual luciferase reporter assays, in vitro protein synthesis was performed using the TnT® Quick Coupled Transcription/Translation System (Promega, L1170), according to the standard protocol provided by Promega. The reaction mixture was supplied with in vitro synthesized Hilnc RNA. After protein synthesis, the reaction mixtures were directly subjected to the same luminescence detection procedures as those used for cell lysates.
In vitro RNA Synthesis
To synthesize biotin-labeled RNA molecules in vitro, we used the RNAmax-T7 Biotin Labeling Transcription Kit (RiboBio, C11002-1). The synthesized RNA was purified and subsequently used for RNA pull-down and other experiments. The procedure followed the standard methods provided by Ribobio. The DNA linear template for the target fragment was designed to include the T7 promoter sequence at the 5' end (5' TAATACGACTCACTATAGGG 3'). Transcription initiated from the bold “G”, ensuring that the synthesized RNA did not contain any unintended sequences. For unbiotinylated RNA synthesis, the Biotin labelling mix in the recipe was substituted with normal rNTPs (Promega, E601D, E602D, E603D, E604D).
RNA Pull-down Assays
For RNA-RNA pull-down, 500ng each of synthesized biotinylated bait and unbiotinylated prey were mixed in 200μL pull-down lysis buffer (20 mM Tris-HCl, pH 7.5, 100 mM KCl, 5 mM MgCl2, 0.3% NP-40) supplemented with 1U/μL RNase inhibitor (MCE, HY-K1033) and incubated on orbital shaker at 60 rpm at room temperature for 1 h. For RNase treatment, 2μg/μL RNase A (NEB, T3018L), 0.1U/μL RNase III (NEB, M0245S), or 0.2U/μL RNase H (NEB, M0297S), together with the corresponding RNase buffer, was added to the RNA mix, respectively. The mix were then incubated at 37 °C for 1 h. 20μL streptavidin magnetic beads (MCE, HY-K0208) were washed three times in the pull-down lysis buffer, then added to the RNA-RNA mix and pulled down by magnetic enrichment, followed by RT-qPCR for detection of the prey RNAs.
For RNA pull down of proteins from cell lysates, 1μg of biotin-labeled RNA was heated to 90 °C for 2 min to disrupt secondary structures and then placed on ice for 2 min to allow proper secondary structure formation. Cells (2 × 10 ^ 7) were lysed in pull-down lysis buffer (20 mM Tris-HCl (pH 7.5), 100 mM KCl, 5 mM MgCl2, 0.3% NP-40) supplemented with complete protease inhibitor cocktail and 1 U/µL RNase inhibitor, then sonicated and centrifuged until the cell lysate was clear. 5% of the lysate were prepared for input sample, and the rest of the lysate was pre-treated with 10 µg/mL yeast tRNA (Invitrogen, AM7119) and 50 µL of streptavidin-conjugated beads (MCE, HY-K0208) by rotating at 4 °C for 30 min. Folded RNA was then added to the pre-cleared cell lysate and rotated at 4 °C for 1 h. Next, 50 µL of washed streptavidin-conjugated beads were added to the reaction and incubated at 4 °C for 4 h. Then the beads were washed four times with pull-down lysis buffer (20 mM Tris-HCl (pH 7.5), 100 mM KCl, 5 mM MgCl2, 0.3% NP-40) supplemented with complete protease inhibitor cocktail and 1 U/µL RNase inhibitor. Proteins bound to the beads were separated by SDS-PAGE and subjected to Western blotting (WB) or mass spectrometry analysis.
RNA Fluorescence In Situ Hybridization (FISH)
Fluorescently labeled single-stranded nucleic acids were used as probes to specifically hybridize with the target RNA based on base pairing principles. After denaturation, annealing, and renaturation, the hybridization complex of the target RNA and the nucleic acid probe was formed. The target RNA was then subjected to localization analysis using a fluorescence microscope. The probe synthesis was performed by GenePharma. The positive control probe was mouse 18S rRNA (5' CY3), provided by GenePharma.
Hilnc Probes (5' FAM-conjugated):
Probe 1: GTCTCCAGGCGAGGTGATTG
Probe 2: ATCAAGAAATCAAAGTACGCAGT
Probe 3: AAGAATCCAAGAATAAGGTGACAGT
Ucp1-3'UTR Probes (5' CY3-conjugated):
Probe 1: ATGTTCAGTATCTCTTCCTCCAAGT
Probe 2: CTGGAAATGATCTTGTAATGTAAAT
Probe 3: CCAAAGACCAGTTAAATACAGGACT
For FISH on tissue sections, the RNA FISH kit (GenePharma) was used, and the experiment was conducted according to the standard protocol provided by GenePharma. For FISH on cells, SVF cells were plated in multi-well chamber slides (BD Falcon) and allowed to differentiate. After the cells have completed differentiation, the cells were fixed and processed using the same procedure as for tissue sections. Images were acquired using Leica TCS SP8 confocal microscope.
Mass Spectrometry of RNA Pull-Down Proteins
RNA pull-down beads were resuspended in 50 µL of lysis buffer (2% SDS, 100 mM Tris, 100 mM DTT, pH 7.6), heated at 95 °C for 10 min, and then centrifuged to collect the supernatant. For protein digestion using the SP4 method, 50 µL of sample and 20 µL of glass beads (1000 µg) were resuspended in 100 µL of re-suspension buffer (2 M urea acid (UA), 5 mM Tris, pH 7.6). 400 µL of acetonitrile was added and mixed, followed by centrifugation at 16,000 × g for 5 min at 4 °C to remove the supernatant. The pellet was washed four times with 1 mL of 80% ethanol, removing the supernatant each time. 100 µL of trypsin solution (10 ng/µL) was added, and the samples were incubated at 37 °C for 17 h for enzymatic digestion. The next day, samples were centrifuged at 15,000 × g for 5 min, and the supernatant was collected, lyophilized, desalted, and lyophilized again. Peptides were resuspended in 15 µL of 0.1% formic acid solution, centrifuged at 12,000 × g for 5 min, and the supernatant was transferred to vials for mass spectrometry analysis using a Q Exactive HF mass spectrometer (Thermo Scientific). Data were searched against a protein database using MaxQuant (version 1.6.17.0), with a false discovery rate (FDR) for protein identification controlled to be less than 1%.
RNA Immunoprecipitation (RIP)
Cells were harvested and lysed in NT2 buffer (50 mM Tris-HCl pH 7.4, 150 mM NaCl, 1 mM MgCl₂, 0.05% NP-40) supplemented with RNase inhibitor (1 U/µL) (MCE, HY-K1033) and 1X protease inhibitor cocktail (Targetmol, C0001). Mouse iWATs were collected post-euthanasia and homogenized in ice-cold NT2 buffer containing 1U/µL RNase inhibitor and protease inhibitor cocktail using a tissue lyser (Bead Ruptor 24 Elite, OMNI international) for 20 seconds. Lysates were centrifuged at 4 °C, 14,000 × g for 10 min, and the supernatant was transferred to fresh 2 mL tubes. Total protein was quantified using the Pierce BCA Protein Assay Kit (Thermo Scientific), and 3 mg of cytoplasmic lysate protein was used for immunoprecipitation.
Anti-IGF2BP2 antibody (Proteintech, 82757-2-RR) and normal rabbit IgG (Proteintech, B900610) were added to the clarified lysate and incubated at 4 °C for 1 h. Then, 30 µL of Protein A/G magnetic beads (MCE, HY-K0202) were washed in NT2 buffer twice and added to the samples, incubated at 4 °C overnight. Beads were washed three times with RIP wash buffer (50 mM Tris-HCl pH 7.4, 455 mM NaCl, 1 mM MgCl2, 0.09% NP-40, 0.5% Sodium Deoxycholate, 1X protease inhibitor cocktail, RNase inhibitor (1 U/µL)). Bound RNAs were isolated from the beads using Trizol (Invitrogen) according to the manufacturer's instructions. The RNA component was analyzed by RT-qPCR.
Adenovirus Infection of SVF Cells
The adenoviral vector used was Adeasy015-pAdEasy-EF1-MCS-CMV-mCherry. The expression plasmids were constructed by inserting the sequences of Full-length Hilnc, HilncΔ450-600, and Hilnc450-600nt into the adenoviral vector. The construction of adenoviral plasmids, viral amplification and concentration, as well as titer determination, were performed by Hanbio. Infection procedures followed the standard methods provided by Hanbio, with a multiplicity of infection (MOI) of 100. Infection efficiency was assessed using mCherry fluorescence and confirmed by qPCR detection of the overexpressed fragments.
Molecular Docking
The binding mode between the protein and RNA was predicted through an integrated computational approach. The process began with the prediction of the RNA's secondary structure (http://rna.tbi.univie.ac.at/cgi-bin/RNAWebSuite/RNAfold.cgi). The predicted secondary structure was used as input to generate a three-dimensional model of the RNA (http://biophy.hust.edu.cn/new/3dRNA/create) [43]. The generated 3D model of the RNA was then used alongside the protein structure (UniProt) in a molecular docking simulation to determine the optimal complex formation and assess binding affinity (HDOCK Server) [44].
Statistical Analyses
Statistical analyses were performed using GraphPad Prism (v10.0) and R (3.4.0). Data are presented as Mean ± SEM unless otherwise specified. Statistical significance was determined using the following tests: Unpaired t-test: Used for comparisons between two groups. One-way ANOVA: Used for comparisons among multiple groups, followed by Tukey's multiple comparisons test. Two-way ANOVA: Used for experiments with two independent variables, followed by Bonferroni's multiple comparisons test. Pearson Correlation Coefficient: Used to assess the correlation between two continuous variables. ANCOVA [45]: used for assessing the effect of genotype on body weight, with initial body weight included as a covariate. Preceded by a test for homogeneity of variances, with partial eta-squared (η²p) calculated to quantify the effect size, respectively.
P-values < 0.05 were considered statistically significant. Specific statistical tests and sample sizes are indicated in the figure legends and tables.
Results
Adipose-tissue-specific Hilnc knockout leads to altered iWAT morphology and energy metabolism in mice
Hilnc has previously been shown to play an important role in regulating lipid metabolism in the liver [34]. We observed that the body size of high-fat-diet (HFD)-fed Hilnc-/- mice were smaller compared to that of the wild-type (WT) mice (Figure S1A), and the volumes of various adipose tissues, including epididymal white adipose tissue (eWAT), inguinal white adipose tissue (iWAT), and brown adipose tissue (BAT), were reduced in HFD-fed Hilnc-/- mice (Figure S1B-D), with no discernible difference in food intake (Figure S1E). This prompted the question of whether Hilnc has a physiological role in adipose tissues. To explore this, we first assessed the expression of Hilnc in adipocytes using reverse transcription quantitative polymerase chain reaction (RT-qPCR). RT-qPCR results demonstrated that Hilnc was predominantly expressed in eWAT and iWAT adipocytes, with expression levels comparable to that of the liver, but not in BAT adipocytes (Figure S1F). To specifically knockout Hilnc in adipocytes, we generated Hilncf/f mice by inserting loxP sequences flanking exons 2 and 3 of the Hilnc locus (Figure 1A). These Hilncf/f mice were subsequently crossed with Adipoq-Cre mice to generate adipocyte-specific Hilnc knockout mice (Adipoq-Cre; Hilncf/f mice, hereafter referred to as HilncAKO mice) (Figure 1A, Figure S1G). The successful knockout of Hilnc in eWAT and iWAT was validated by RT-qPCR (Figure 1B).
Adipose-tissue-specific Hilnc knockout leads to altered iWAT morphology and energy metabolism. A) Strategy of construction of Hilncf/f mice and generation of Adipoq-Cre; Hilncf/f (HilncAKO) mice. B) RT-qPCR results of Hilnc knock-out efficiency in liver and adipocytes of Hilncf/f and HilncAKO mice (N = 3 technical replicates of 2-3 mice from each strain). C) Comparison of food intake between NCD-fed Hilncf/f and HilncAKO mice (N = 6 mice for Hilncf/f and N = 5 mice for HilncAKO). D) Whole-body size of HFD-fed Hilncf/f and HilncAKO mice. E-F) Size of iWAT (E) and iWAT weights as percentage of whole-body weights (F) of HFD-fed Hilncf/f and HilncAKO mice (N = 8 mice for each strain). G) Whole-body size of NCD-fed Hilncf/f and HilncAKO mice. H-I) Size of iWAT (H) and iWAT weights as percentage of whole-body weights (I) of NCD-fed Hilncf/f and HilncAKO mice (N = 11 mice for each strain). J) RER per hour (left) and day-vs-night breakdown (right) between RT NCD-fed Hilncf/f and HilncAKO mice (N = 16 mice for each strain). K) 24h overall energy expenditure (EE) between RT NCD-fed Hilncf/f and HilncAKO mice (N = 16 mice for each strain). L) RER per hour (left) and day-vs-night breakdown (right) between 30 °C NCD-fed Hilncf/f and HilncAKO mice (N = 16 mice for each strain). M) 24h overall energy expenditure (EE) between 30 °C NCD-fed Hilncf/f and HilncAKO mice (N = 16 mice for each strain). N) Overall energy expenditure over time (left) and comparison of maximal energy expenditure (right) of norepinephrine (NA)-injected RT NCD-fed Hilncf/f and HilncAKO mice (N = 16 mice for Hilncf/f and N = 17 mice for HilncAKO). Data are presented as mean ± SEM. Student's t-tests were used for statistical analysis (For B, C, F, I). ANCOVA were used for statistical analysis (for J, K, L, M, N), adjusted for body weight, genotype effect is independent of body weight. (ns: not significant, *: p < 0.05, **: p < 0.01, ***: p < 0.001, ****: p < 0.0001). See also Figure S1.
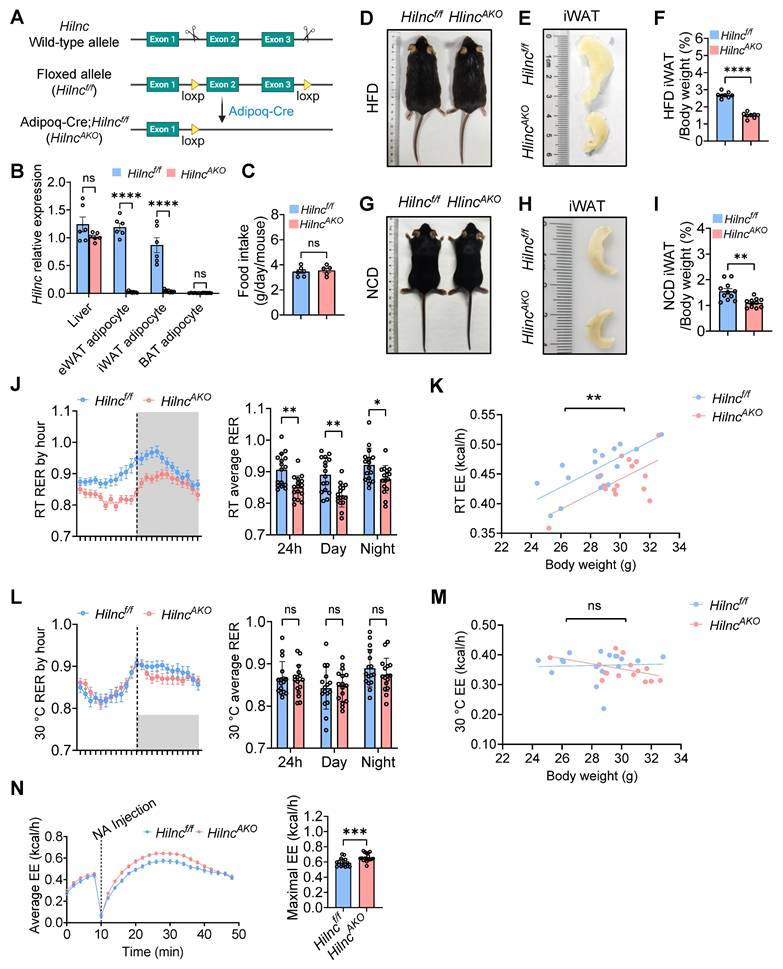
Next, we investigated whether the specific knockout of Hilnc in adipocytes affected adipose tissue characteristics. Again, we observed that there were no significant differences in food intake between the two groups (Figure 1C). No significant differences in body size (Figure 1D), gross body weight, or fat content (Figure S1H) were observed between HFD-fed HilncAKO mice and Hilncf/f mice, nor were there any notable changes in eWAT and BAT morphology and their weight proportions between the two mouse strains (Figure S1I-J). However, the volume and weight of iWAT in HilncAKO mice were significantly smaller compared to Hilncf/f mice (Figure 1E-F), indicating that iWAT was particularly affected by the loss of Hilnc in adipocytes. In mice fed a normal chow diet (NCD), similar to HFD-fed mice, no significant changes in body weight, fat content, or eWAT and BAT morphology and their weight proportions (Figure 1G, Figure S1K-M) were observed. However, the volume and weight of iWAT were significantly decreased in HilncAKO mice (Figure 1H-I), indicating that these changes in iWAT are specifically attributed to the adipocyte-specific loss of Hilnc.
To examine whether the knockout of Hilnc in adipocytes impacts overall mouse metabolism, we analyzed the energy metabolism profiles of NCD-fed Hilncf/f and HilncAKO mice using metabolic cages. While no notable differences were detected in overall movement characteristics between the two groups (Figure S1N), HilncAKO mice exhibited a significantly lower respiratory exchange ratio (RER) (Figure 1J) alongside reduced energy expenditure (EE) (Figure 1K) when housed at room temperature (RT). This decrease in RER indicates a systemic shift in energy substrate preference, with HilncAKO mice favoring lipid oxidation, whereas Hilncf/f controls maintained a metabolic profile characteristic of predominant carbohydrate utilization.
The observed difference in EE under these conditions prompted further investigation. Since standard room temperature (22 °C) imposes a chronic cold stress on mice, which can elevate basal energy consumption, we sought to determine whether the metabolic disparity was stress-dependent. To test this, we acclimated mice to thermoneutral conditions (30 °C) for two weeks prior to metabolic assessment. At thermoneutrality, the difference in EE between HilncAKO and Hilncf/f mice was abolished (Figure 1M). Furthermore, although HilncAKO mice still displayed a trend toward lower RER during the dark phase, this difference was markedly attenuated and lost statistical significance (Figure 1L).
The emergence of the EE phenotype specifically at room temperature, coupled with the persistent shift in RER and observed morphological changes in iWAT, led us to hypothesize that HilncAKO mice might possess an enhanced metabolic capacity. To test this, we maximally activated non-shivering thermogenesis via norepinephrine (NA) injection in RT-housed mice. In contrast to the unstimulated state, this challenge revealed a significantly higher peak energy expenditure in HilncAKO mice compared to controls (Figure 1N), demonstrating their superior maximal thermogenic capacity.
In summary, the loss of Hilnc in adipocytes specifically leads to changes in iWAT morphology, which is associated with altered energy metabolism and a shift in preferred energy substrates.
The loss of Hilnc in adipose tissues promotes iWAT beiging and thermogenesis
To further characterize the effects of Hilnc on iWAT, we examined tissue histology in NCD-fed mice under room temperature (RT). Hematoxylin and eosin (H&E) staining revealed a marked reduction in adipocyte size and an increased presence of smaller, multilocular adipocytes in the iWAT of HilncAKO mice compared to Hilncf/f controls. The emergence of these multilocular adipocytes was especially prominent within the apex region of the iWAT (Figure 2A, Figure S2A). Notably, iWAT can undergo beiging under low temperatures, a process during which mitochondrial UCP1 is upregulated in adipocytes, contributing to increased intracellular metabolic rate and thermogenesis to counteract heat loss [46, 47]. We next assessed the expression of UCP1 to further evaluate the extent of adipocyte beiging. UCP1 immunohistochemistry and Western blot analysis demonstrated that, compared to Hilncf/f controls, HilncAKO mice exhibited spontaneous upregulation of UCP1 protein and enhanced beiging of iWAT, even under RT conditions (Figure 2A-C, Figure S2B). However, Ucp1 mRNA levels remained unchanged between the two groups (Figure 2D), suggesting that Hilnc does not regulate Ucp1 transcription but may instead influence UCP1 protein stability or translation process. Given that UCP1 upregulation and iWAT beiging are closely linked to thermogenesis, we next examined the impact of Hilnc deletion on thermogenic function. HilncAKO mice exhibited significantly higher rectal temperatures compared to Hilncf/f controls (Figure 2E), indicating enhanced thermogenic activity in the regular state.
The loss of Hilnc in adipose tissues promotes iWAT beiging and thermogenesis. A) H&E stain and UCP1 immunohistochemistry (IHC) of RT Hilncf/f and HilncAKO iWATs. Scale bar = 50 μm. B) Representative UCP1 Western blots of RT Hilncf/f and HilncAKO iWAT homogenates. C) Western blots quantifications of RT Hilncf/f and HilncAKO iWAT homogenates (N = 6 mice for each strain). D) RT-qPCR analysis of Ucp1 mRNA expression in iWAT from RT-maintained Hilncf/f and HilncAKO mice (n = 9 mice for Hilncf/f and n = 6 mice for HilncAKO). E) Rectal temperatures of RT Hilncf/f and HilncAKO mice (N = 9 mice for each strain). F) Size comparison of iWATs between cold-acclimated RT Hilncf/f and HilncAKO mice. G) H&E stain and UCP1 immunohistochemistry (IHC) of cold-acclimated Hilncf/f and HilncAKO iWATs. Scale bar = 50 μm. H) Representative UCP1 Western blots of cold-acclimated Hilncf/f and HilncAKO iWAT homogenates. I) Western blots quantifications of cold-acclimated Hilncf/f and HilncAKO iWAT homogenates (N = 6 mice for each strain). J) RT-qPCR analysis of Ucp1 mRNA expression in iWAT from cold-acclimated Hilncf/f and HilncAKO mice (n = 8 mice for Hilncf/f and n = 7 mice for HilncAKO). K) Average changes in rectal temperature of cold-acclimated Hilncf/f and HilncAKO mice upon re-exposure to cold (N = 4 mice for Hilncf/f and N = 5 mice for HilncAKO). L) Diagram of iWAT isolation for OCR analysis by Seahorse analyzer. M) Compiled relative changes of iWAT OCRs during the Seahorse program (left), and coupling efficiencies, calculated as ((OCRATP production / OCRBasal respiration) × 100%) (right) between cold-acclimated Hilncf/f and HilncAKO iWATs (N = 6 biological replicates). N) Quantification of total ATP released from an equal number of isolated mitochondria from intact iWAT of Hilncf/f and HilncAKO mice (N = 5 biological replicates). Data are presented as mean ± SEM. Student's t-tests were used for statistical analysis (C, D, E, I, J, K, M and N). (ns: not significant, *: p < 0.05, **: p < 0.01, ***: p < 0.001, ****: p < 0.0001). See also Figure S2 and Figure S3.
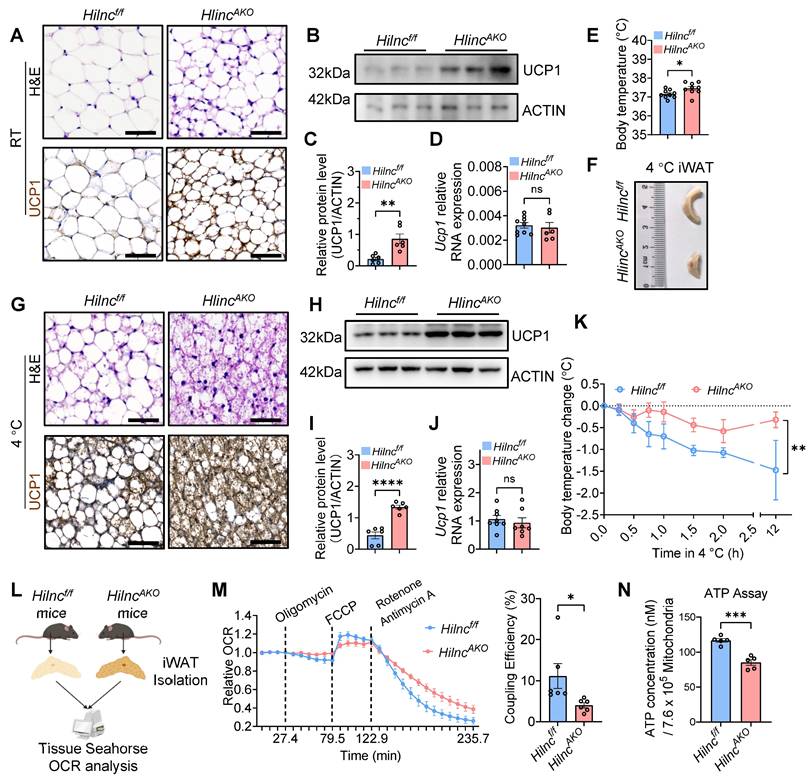
To further investigate the role of Hilnc in iWAT beiging, we exposed Hilncf/f and HilncAKO mice to cold conditions. Both groups exhibited significant iWAT beiging during cold acclimation compared to mice maintained at RT. iWATs from HilncAKO mice were smaller (Figure 2F), displayed a denser histological architecture, and showed higher UCP1 protein levels (Figure 2G-I, Figure S2C-D) compared to Hilncf/f controls. Consistent with observations under RT conditions, Ucp1 mRNA levels remained unchanged between the two groups after cold exposure (Figure 2J), further suggesting that Hilnc regulates UCP1 expression at a post-transcriptional level. To assess cold adaptation, mice were returned to RT before re-exposure to low temperature. HilncAKO mice maintained significantly higher core body temperatures than Hilncf/f mice under cold stress (Figure 2K).
Given the clear differences in iWAT, we sought to determine whether the increased thermogenesis was solely attributable to iWAT. Contacting the result mentioned above, NA injection can stimulate lipolysis and activation of beige and brown adipocytes, although iWAT was the primary site of interest in this study, BAT is also known to play a pivotal role in thermogenic regulation and overall energy metabolism. We therefore first examined the potential contribution of BAT, the primary adipose tissue responsible for thermogenesis. The size, histological architecture, and UCP1 protein levels of BAT were comparable between WT and Hilnc-/- mice under RT or cold-acclimated conditions (Figure S3A-H). Similarly, no significant differences were observed in eWAT between the two groups (Figure S3I). Since our conditional knockout model utilizes Adiponectin-promoter-driven Cre expression, Hilnc is also deleted in mature adipocytes of eWAT. We therefore investigated whether Hilnc ablation affects the metabolic characteristics of eWAT mature adipocytes in HilncAKO mice compared to Hilncf/f controls. We analyzed the expression of key genes involved in lipid synthesis, transport, breakdown, and fatty acid uptake. The results indicated that Hilnc knockout did not induce significant alterations in lipid metabolism pathways in eWAT (Figure S3J). These results suggest that the impact of Hilnc knockout is not prominently manifested in white adipocytes, which further prompts us to reconsider the physiological distinctions between iWAT and eWAT and underscores the heterogeneity of Hilnc's physiological functions in these two adipose depots. To further assess the specific contribution of BAT, we generated BAT-specific Hilnc knockout mice (Ucp1-Cre; Hilncf/f, hereafter referred to as HilncUKO) by crossing Hilncf/f mice with Ucp1-Cre mice (Figure S3K). No significant differences were found in BAT morphology, UCP1 protein levels, or cold tolerance between Hilncf/f and HilncUKO mice under either RT or cold-acclimated conditions (Figure S3L-T). These results suggest that Hilnc plays a minimal role in regulating BAT function under both basal and cold-induced conditions, and that the enhanced thermogenic phenotype observed in Hilnc-deficient mice is primarily attributable to changes in iWAT.
To further investigate the direct contribution of iWAT to thermogenesis, we isolated iWAT from cold-acclimated Hilncf/f and HilncAKO mice and analyzed tissue respiration levels using a Seahorse analyzer (Figure 2L). Although no significant differences in basal respiration rate and maximum respiration rate were observed under stress conditions (Figure S2U-V), HilncAKO iWAT exhibited a strong trend of decreased ATP production rate (Figure S2W), leading to a significant decrease in coupling efficiency (Figure 2M). To further confirm that the differences in coupling efficiency and ATP production were linked to the elevated UCP1 expression on mitochondria, we isolated mitochondria from iWAT of mice subjected to the 4 °C acclimation and measured the ATP content normalized to an equal number of mitochondria. The results showed that mitochondria isolated from the iWAT of HilncAKO mice contained significantly lower ATP levels than those from Hilncf/f mice (Figure 2N). This finding aligns with the energy metabolic profile observed at the tissue level in Seahorse assays, and the use of purified mitochondria served to accentuate the disparity in ATP generation. Since UCP1 is located in the mitochondrial inner membrane, its activity causes proton leakage, which significantly diminishes ATP synthesis efficiency.
In summary, the loss of Hilnc in adipose tissue results in increased UCP1 protein levels in iWAT, which directly contributes to enhanced thermogenesis and improved body temperature maintenance in HilncAKO mice.
Loss of Hilnc in Mature Adipocytes Enhances Mitochondrial Function
Given the considerable heterogeneity of iWAT tissue, we sought to identify the specific cell compartment responsible for the increased thermogenesis observed in HilncAKO mice. To determine whether Hilnc-associated UCP1 upregulation occurred during the differentiation of new adipocytes, we used flow cytometry to examine the stromovascular fraction (SVF), which contains SCA-1+ preadipocytes [48, 49]. The frequency of SCA-1+ preadipocytes did not differ significantly between WT and Hilnc-/- mice, nor between Hilncf/f and HilncAKO mice (Figure S4A-D). Additionally, RT-qPCR analysis revealed no significant differences in the expression levels of key transcription factors associated with adipocyte differentiation and beiging, including Prdm16, Pgc1a, Cebpa, and Cidea (Figure S4E). These findings suggested that Hilnc does not affect the frequency or differentiation program of the iWAT SVF. The qPCR analysis also confirmed that Hilnc expression was completely unaffected in the SVF of HilncAKO mice (Figure S4F) whereas Hilnc expression was significantly reduced in differentiated HilncAKO adipocytes (Figure S4G). Therefore, the HilncAKO phenotype firmly indicates that Hilnc does not function within the SVF, but rather exerts its role specifically in mature adipocytes.
Next, we investigated whether the loss of Hilnc in mature adipocytes directly contributes to the increase in UCP1 protein levels and respiration. Given the relatively short duration of the cell differentiation cycle, we isolated SVF from WT and Hilnc-/- mice to ensure a sustained and significant difference in Hilnc expression levels between the two groups established as controls throughout the experiment. The adherent fraction was then subjected to in vitro differentiation into mature adipocytes (Figure 3A). Consistently, no differences in SVF fraction frequency among adherent fractions were observed between plated WT and Hilnc-/- SVF at the onset of differentiation (Figure S4H). Differentiated mature adipocytes from Hilnc-/- SVF exhibited smaller lipid droplets (Figure 3B) and higher UCP1 protein levels (Figure 3C), suggesting that the loss of Hilnc in mature adipocytes is responsible for the increase of UCP1 protein levels in tissue and the decrease in lipid accumulation.
The loss of Hilnc in mature adipocytes results in increased mitochondrial function. A) Protocol of in vitro SVF isolation and differentiation into mature adipocytes. B) Representative bright field images (left-top), Oil-red O stain images (left-bottom) and quantification of lipid droplet area from Oil Red O Staining (right) of differentiated adipocytes from SVFs of WT or Hilnc-/- iWATs (Scale bar = 100 μm). C) UCP1 western blots (top) and quantification (bottom) of differentiated adipocytes from SVFs of WT or Hilnc-/- iWATs (N = 6 biological replicates for each strain). D) Volcano plot showing differentially expressed genes between cold-acclimated Hilncf/f and HilncAKO iWAT mature adipocytes. E) KEGG enrichment analysis of differentially regulated gene sets in cold-acclimated Hilncf/f vs HilncAKO iWAT mature adipocytes. F-G) Expression levels of mitochondrial function-related genes in cold-acclimated Hilncf/f vs HilncAKO iWAT mature adipocytes, analyzed by RNA-seq (F, N = 5 mice for each strain) and RT-qPCR (G, N = 3 technical replicates from 3 mice for each strain). H-I) TOM20 Western blots (H, N = 3 mice for each strain) and IHC (I) of cold-acclimated iWATs from Hilncf/f and HilncAKO mice. Scale bar = 50 μm for I). J) Representative TEM images of the groin and apex ends of iWATs from cold-acclimated Hilncf/f and HilncAKO mice, showing individual mitochondria morphology. Scale bar = 0.2 μm. Data are presented as mean ± SEM. Student's t-tests with Holm-Šídák's multiple comparison correction were used for statistical analysis (H). (*: p < 0.05, **: p < 0.01, ***: p < 0.001, ****: p < 0.0001). See also Figure S4.
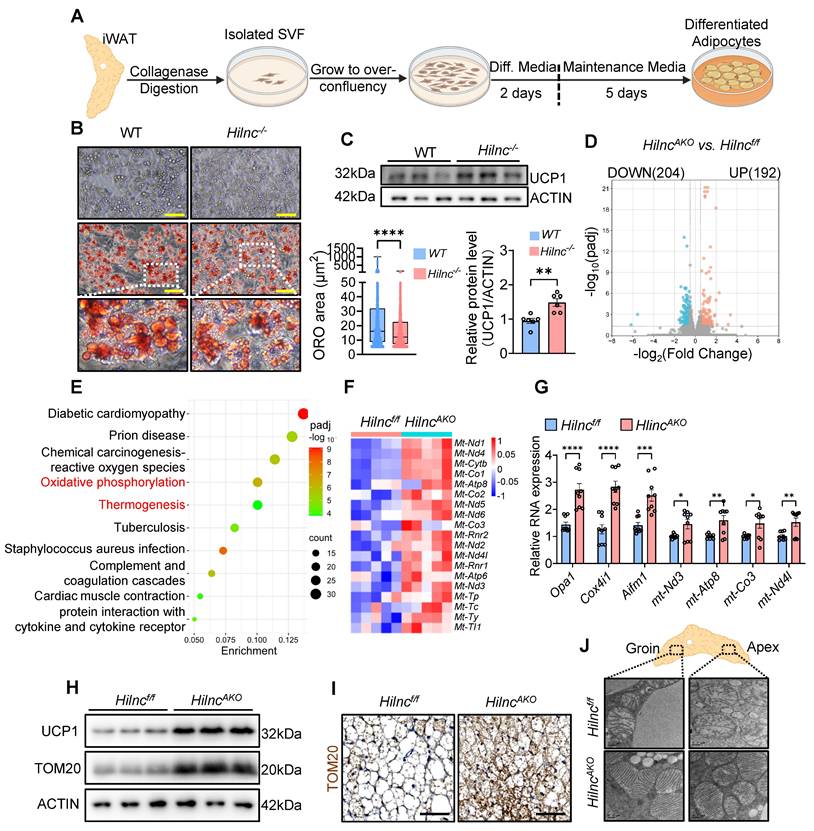
To further investigate the cellular phenotypic changes associated with the loss of Hilnc in mature adipocytes, we performed RNA sequencing on mature adipocytes isolated from iWAT of cold-acclimated Hilncf/f and HilncAKO mice. In HilncAKO iWAT adipocytes, 192 genes were upregulated, and 204 genes were downregulated compared to Hilncf/f iWAT adipocytes (Figure 3D). Kyoto Encyclopedia of Genes and Genomes (KEGG) enrichment analysis of the differentially expressed gene sets revealed predominant associations with oxidative phosphorylation and thermogenesis (Figure 3E), strongly suggesting that mitochondrial function is altered in HilncAKO iWAT adipocytes. Notably, several genes of mitochondrial genome origin were significantly upregulated (Figure 3F). The increases in mitochondrial function-related genes in the iWATs of cold-acclimated mice were confirmed by RT-qPCR (Figure 3G), as well as TOM20 (an outer mitochondrial membrane protein) western blotting and IHC of iWAT sections (Figure 3H-I).
To directly examine mitochondrial morphology in iWAT, we prepared iWAT from cold-acclimated Hilncf/f and HilncAKO mice for transmission electron microscopy (TEM). Mitochondria biogenesis occurs more intensively in the cytoplasmic part of HilncAKO adipocytes at both the groin and the apex (Figure S4I). High-magnification imaging revealed that mitochondria in adipocytes at both the groin and apex regions of iWAT displayed morphological differences between genotypes, with mitochondria from Hilncf/f mice showing more disorganized structure and fewer cristae compared to those from HilncAKO mice (Figure 3J), indicative of higher mitochondria activity and consistent with the observation of higher basal respiration rate in HilncAKO iWATs.
Collectively, these results suggested that the loss of Hilnc in mature adipocytes specifically leads to a global increase in mitochondrial function, which explains the observed increase in respiration and thermogenesis [50]
Binding between Hilnc, IGF2BP2 and the 3'UTR of Ucp1 mRNA
After identifying the role of Hilnc in mature adipocytes, we focused on investigating the mechanism by which Hilnc regulates UCP1 protein levels. Interestingly, Ucp1 mRNA levels did not differ significantly between Hilncf/f and HilncAKO iWAT under either RT or cold-acclimated conditions (Figure 2D, 2J), implying that Hilnc modulates UCP1 protein levels via a post-transcriptional mechanism. To explore this further, we used an in vitro adipocyte differentiation assay to assess UCP1 protein stability by adding cycloheximide (CHX) at the end of differentiation to halt de novo synthesis of UCP1. No significant difference in the half-life of UCP1 protein was observed between WT and Hilnc-/- differentiated adipocytes (Figure S5A), ruling out the possibility that Hilnc modulates UCP1 protein levels through a post-translational mechanism. The PPAR pathway is known to play an important role in adipogenesis and iWAT beiging, and Hilnc has been shown to regulate the PPARγ signaling pathway in the liver [34]. However, no significant differences in Pparg or its downstream genes were observed in iWAT adipocytes (Figure S5B), suggesting that, unlike in the liver, Hilnc does not function through the PPARγ signaling pathway in adipocytes. Based on all the above findings, we shifted our focus to how Hilnc directly controls Ucp1 mRNA translation.
LncRNAs modulate cellular gene expression through various mechanisms, often requiring direct binding to target mRNA molecules [31]. To investigate whether Hilnc binds directly to Ucp1 mRNA, we used synthesized biotin-conjugated Ucp1 mRNA as bait to pull down synthesized Hilnc RNA. The resulting complex was subjected to digestion with RNases of varying specificity, followed by RT-qPCR to confirm the formation of RNA-RNA duplexes (Figure 4A). The pull-down product was readily digested by RNase A and RNase III, which digest total RNA and double-stranded RNA, respectively. However, RNase H, which specifically degrades RNA in an RNA-DNA duplex, failed to digest the enriched Hilnc, suggesting successful binding between Ucp1 mRNA and Hilnc RNA (Figure 4B). These results indicated that Hilnc forms an RNA-RNA duplex with Ucp1 mRNA. To determine the specific binding site between Hilnc RNA and Ucp1 mRNA, we conducted parallel RNA pull-down experiments with synthesized biotin-conjugated fragments of Ucp1 mRNA and unconjugated Hilnc RNA fragments (Figure 4C). The 450-600nt region of Hilnc bound to the 3'UTR of Ucp1 mRNA with similar efficiency as full-length (FL) Hilnc RNA binding to FL Ucp1 mRNA (Figure 4D), revealing the primary binding site between the two RNA molecules. Additionally, we performed fluorescence in situ hybridization (FISH) with Hilnc and Ucp1 mRNA 3'UTR probes in WT mouse iWAT sections. In contrast to 18s rRNAs, which did not co-localize with Hilnc RNA, Ucp1 mRNA 3'UTR and Hilnc RNA co-localized in adipocytes (Figure 4E).
Binding between Hilnc, IGF2BP2 and the 3'UTR of Ucp1 mRNA. A) Diagram of RNA-RNA binding experiment, followed by various RNase digestion to identify the RNA-RNA duplexes between Hilnc (Red) and Ucp1 mRNA (Blue). B) RT-qPCR of Hilnc RNA abundance following RNase A, H or, III digestion of in vitro Ucp1 mRNA pull-down products (N = 4 biological replicates). C) Diagram showing Hilnc segments used to identify the binding site between Hilnc and Ucp1 mRNA. D) qRT-PCR analysis of parallel RNA-RNA binding experiments showing binding efficiencies between Hilnc segments and Ucp1 mRNA segments (N = 3 technical replicates from 2-3 biological replicates). E) Fluorescent in situ hybridization (FISH) of 18S rRNA, Ucp1 mRNA 3'UTR and Hilnc RNA in WT paraffin-embedded iWAT sections. Arrows indicate co-localization of fluorescent probes. Scale bar = 10 μm. F) Diagram of the biotinylated Hilnc and Ucp1 mRNA pull-down experiments. G) Venn diagram showing the candidate proteins that binds strongly to Hilnc or Ucp1 mRNA, and are enriched by both Hilnc and Ucp1 mRNA. H) Western blot of IGF2BP2 (top) from the RNA pull-down experiment using biotinylated fragments of Ucp1 mRNA as bait (bottom). I) In silico prediction of RNA-RNA interaction between Hilnc and Ucp1 mRNA 3'UTR (https://rna.informatik.uni-freiburg.de/IntaRNA/Result.jsp). J) Molecular docking of IGF2BP2 & Hilnc (http://hdock.phys.hust.edu.cn/). The green highlight indicates the segment on Hilnc RNA with the most favorable (lowest) binding free energy to the Ucp1 mRNA 3'UTR region. Data are presented as mean ± SEM. One-way ANOVA with Tucky's multiple comparison correction (B) and 2-way ANOVA with Dunnett's multiple comparison correction (D) was used for statistical analysis. (ns: not significant, *: p < 0.05, **: p < 0.01, ***: p < 0.001, ****: p < 0.0001). See also Figure S5 and Tables S1-2.
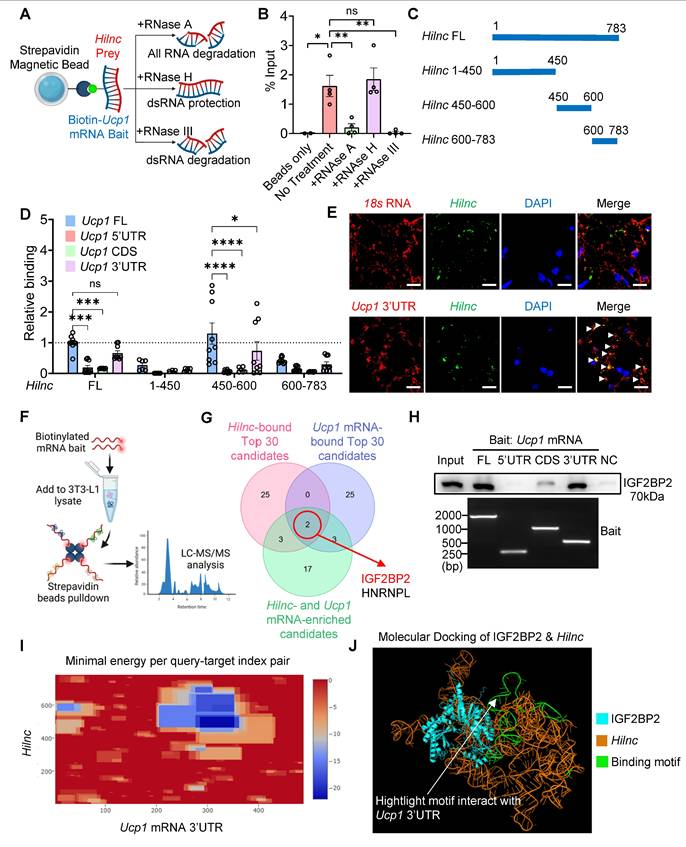
To determine whether Hilnc directly affected Ucp1 mRNA translation, we used a dual-luciferase reporting system: utilizing the psiCHECK-2 plasmid with simultaneous expression of firefly luciferase (Fluc) and renilla luciferase (Rluc), the 3'UTR sequence of Ucp1 mRNA was cloned after Rluc (psiCHECK2-Rluc-Ucp1-3'UTR; Figure S5C), and the plasmid was subjected to in vitro transcription and translation by rabbit reticulocyte lysate, with or without addition of synthesized Hilnc RNA. We hypothesized that the ratio between Rluc and Fluc luminescence should decrease if Hilnc directly suppresses translation via binding to the 3'UTR of Ucp1 mRNA. However, we detected no significant difference in Rluc in vitro translation efficiency (Figure S5D), suggesting that Hilnc does not directly suppress Ucp1 mRNA translation. One of the mechanisms by which lncRNAs modulate protein translation is by guiding translation-suppressing protein to mRNAs through RNA-RNA binding [31, 51]. Therefore, we attempted to identify protein modulators of Ucp1 mRNA translation that may be associated with Hilnc. We used biotin-conjugated Ucp1 mRNA or Hilnc RNA as bait to pull down interacting proteins from 3T3-L1 lysates, followed by analysis using liquid chromatography with tandem mass spectrometry (LC-MS/MS) (Figure 4F). The enriched proteins were then overlapped between the two bait RNAs, allowing us to discover potential candidates that might facilitate Hilnc-mediated translational blockade of Ucp1 mRNA. Among the proteins that are highly bound to either RNA and enriched by both RNAs (Figure 4G, Table S1-3), insulin-like growth factor 2 mRNA-binding protein 2 (IGF2BP2) emerged as one of the two promising candidates. The other candidate, heterogeneous nuclear ribonucleoprotein L (HNRNPL), is known to play pivotal roles in mRNA splicing and stability [52], but little is known about whether it directly affects mRNA translation efficiency. On the other hand, others have shown that IGF2BP2 regulates UCP1 translation through the UTRs of Ucp1 mRNA [28], and our previous research has indicated that IGF2BP2 binds to Hilnc and is involved in lipid metabolism in the liver [34]. Therefore, IGF2BP2 is likely involved in Hilnc-mediated attenuation of Ucp1 mRNA translation, and was warranted for further investigation. The interaction between IGF2BP2 and Hilnc was validated by RNA immunoprecipitation (RIP) of IGF2BP2 followed by RT-qPCR of Hilnc (Figure S5E). To identify the specific interaction site on Ucp1 mRNA, synthesized biotin-conjugated Ucp1 mRNA fragments were used in an RNA pull-down assay. The results indicated that IGF2BP2 also binds to the 3'UTR of Ucp1 mRNA (Figure 4H). The RNA-RNA interaction prediction also indicated that the most probable binding site between Hilnc and the Ucp1 mRNA 3'UTR lies within the Hilnc 450-600 segment (Figure 4I), which aligns with our experimental findings. Furthermore, we performed molecular docking simulations between the IGF2BP2 structure, as provided by AlphaFold, and the three-dimensional structure of Hilnc. The green segment of the Hilnc molecule represents the region predicted to bind the Ucp1 mRNA 3'UTR. Notably, this binding site is positioned in proximity to the IGF2BP2-binding region (Figure 4J), suggesting potential interactions among all three molecules.
The above results suggested that Hilnc may suppress Ucp1 mRNA translation by facilitating IGF2BP2 binding to the 3'UTR of Ucp1 mRNA.
Hilnc Facilitates IGF2BP2-Mediated Suppression of Ucp1 mRNA Translation
Having identified the binding between Hilnc, IGF2BP2, and Ucp1 mRNA, we sought to determine whether this interaction is responsible for the repression of Ucp1 mRNA translation. RIP of IGF2BP2 from WT and Hilnc-/- iWAT revealed diminished binding between IGF2BP2 and Ucp1 mRNA in the absence of Hilnc (Figure 5A). Furthermore, RNA pull-down experiments showed enhanced binding between IGF2BP2 and Ucp1 mRNA with increasing concentrations of Hilnc (Figure 5B), demonstrating that Hilnc is essential for guiding IGF2BP2 to the 3'UTR of Ucp1 mRNA.
Hilnc facilitates IGF2BP2-mediated suppression of Ucp1 mRNA. A) IGF2BP2 RNA immunoprecipitation of Ucp1 mRNA in WT and Hilnc-/- iWAT homogenates (N = 3 biological replicates). B) Left: Diagram of Ucp1 mRNA 3'UTR pull down with addition of Hilnc RNA, and detection of IGF2BP2 by Western blot. Right: IGF2BP2 Western blot of Ucp1 mRNA 3'UTR RNA pull-down with increasing concentrations of synthesized Hilnc RNA added. C) Western blot showing UCP1 expression in 3T3-L1 cells transfected with/without Hilnc FL or Hilnc Δ450-600. D) The Rluc-to-Fluc ratio (DLR) transfected psiCHECK2-Rluc-Ucp1-3'UTR into 3T3 cells, with an empty vector, FL Hilnc, HilncΔ450-600 or Hilnc450-600 co-transfection (N = 9 biological replicates). E) Diagram of SVF adenovirus (AdV) transfection and in vitro differentiation. F) Representative bright field images (left), oil-red O stain (middle) of infected and differentiated adipocytes, and quantification of lipid droplet area from Oil Red O Staining (right), showing lipid droplet sizes and lipid contents. Scale bar = 100 μm. G) Western blots of UCP1 expression in differentiated adipocytes infected with adenoviruses encoding Hilnc FL, Hilnc Δ450-600, or Hilnc 450-600. Bottom numbers indicate the grey scale ratio between UCP1 and ACTIN. Data are presented as mean ± SEM. One-way ANOVA with Tucky's multiple comparison correction (A, F) and Student's t-test (D) were used for statistical analysis. (ns: not significant, **: p < 0.01, ****: p < 0.0001). See also Figure S6.
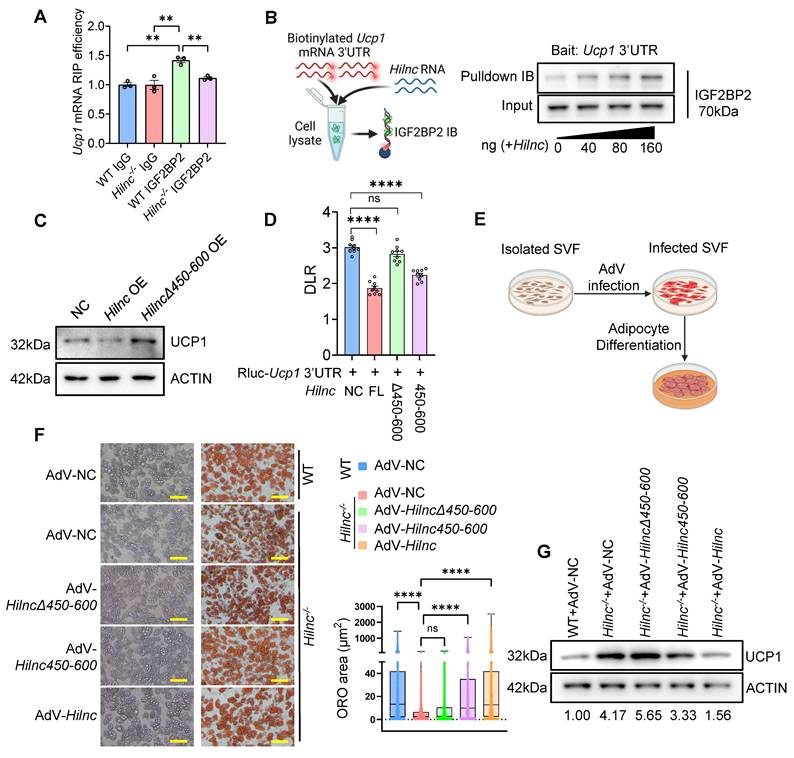
After establishing the importance of Hilnc for the binding of IGF2BP2 to the 3'UTR of Ucp1 mRNA, we next investigated whether Hilnc is necessary for translational suppression of Ucp1 mRNA in the cellular context. To address this, we transfected 3T3-L1 cells, which express both IGF2BP2 and UCP1, with either FL Hilnc or a Hilnc variant lacking the 450-600nt region (HilncΔ450-600). The results showed that FL Hilnc strongly suppressed UCP1 translation, but HilncΔ450-600, which lacks the Ucp1 mRNA-binding region, failed to repress Ucp1 mRNA translation, confirming that binding to Ucp1 mRNA is necessary for Hilnc to efficiently repress UCP1 translation (Figure 5C). To determine whether Hilnc repress Ucp1 mRNA through its 3'UTR, we transfected psiCHECK2-Rluc-Ucp1-3'UTR (Figure S5C) into Hilnc-/- 3T3 cells, with co-transfecting of an empty vector, FL Hilnc, HilncΔ450-600 or Hilnc450-600. The result showed that FL Hilnc strongly suppressed Rluc expression, while HilncΔ450-600 had no significant effect. Notably, Hilnc450-600 produced an intermediate but significant repression compared to the FL Hilnc transcript (Figure 5D). These findings suggest that Hilnc mediates Ucp1 mRNA translational suppression through its 3'UTR, with the 400-600 region plays a critical role in this regulatory mechanism. To further investigate the impact of Hilnc on UCP1 translation in adipocytes, we employed the in vitro adipocyte differentiation system. SVF was isolated from Hilnc-/- mice and infected with adenoviruses (AdVs) encoding FL Hilnc, HilncΔ450-600, or Hilnc450-600, or negative control AdV (AdV-NC) prior to differentiation (Figure 5E, Figure S6A) to evaluate the specific effects of each Hilnc construct on adipocytes. Introduction of FL Hilnc into Hilnc-/- SVF did not significantly alter Ucp1 mRNA levels (Figure S6B-C) but resulted in the formation of larger lipid droplets in differentiated adipocytes and decreased UCP1 protein levels, resembling those in WT differentiated adipocytes. SVF from Hilnc-/- mice infected with AdV-HilncΔ450-600 formed smaller lipid droplets and failed to suppress UCP1 expression, similar to AdV-NC-infected Hilnc-/- SVF. In contrast, infection with AdV-Hilnc450-600 in Hilnc-/- SVF resulted in smaller lipid droplets in differentiated adipocytes and a slight reduction in UCP1 levels compared to AdV-NC infected Hilnc-/- SVF (Figure 5F-G). These findings suggest that the 450-600nt of Hilnc is critical for the repression of UCP1 translation.
In conclusion, our results demonstrate that Hilnc facilitates IGF2BP2-mediated translational suppression of Ucp1 mRNA through interaction with its 3'UTR.
h-Hilnc, the Human Functional Homolog of Mouse Hilnc, Operates through a Similar Mechanism in Human Adipose Tissues
Building on our findings in mice, we next investigated whether a similar mechanism might regulate UCP1 expression in humans. Specifically, we focused on h-Hilnc, the human functional homolog of mouse Hilnc identified in previous research [34]. Using publicly available RNA-seq data, we identified h-Hilnc expression in human adipose tissue (Figure S7A), which was further confirmed by RT-PCR of human subcutaneous adipose tissue biopsy samples of various anatomical locations (Figure S7B). In addition, RT-qPCR of h-Hilnc showed that h-Hilnc levels vary among individual samples (Figure S7C), prompting us to examine whether such variation could correlate with the UCP1 protein level in human adipose tissues. Western blots showed that UCP1 protein level also varied among all samples (Figure S7D). We found that h-Hilnc level did not significantly correlate with UCP1 mRNA level (Figure S7E), but negatively correlated with UCP1 protein levels significantly (Figure 6A), indicating that h-Hilnc could post-transcriptionally influence UCP1 protein level in human adipose tissues, similar to the function of Hilnc in mouse iWATs. We were then interested in whether the molecular interactions among h-Hilnc, IGF2BP2, and UCP1 mRNA 3'UTR also existed. In vitro RNA binding assay confirmed the interaction between h-Hilnc and the 3'UTR of UCP1 mRNA (Figure 6B). Additionally, both h-Hilnc and the 3'UTR of UCP1 mRNA were able to bind to human IGF2BP2 (Figure 6C-D). Thus, the interactions among h-Hilnc, IGF2BP2, and UCP1 mRNA in humans mirror those observed between their homologs in mice.
h-Hilnc, the human functional homolog of mouse Hilnc, may operate through a similar mechanism in human adipose tissues. A) Correlation between each human adipose tissue biopsy's h-Hilnc RNA level and UCP1 protein level relative to ACTIN. (p = 0.0355, R2 = 0.2788, N = 16 samples). B) RT-qPCR of in vitro RNA-RNA binding assay between synthesized h-Hilnc RNA and biotin-conjugated fragments of UCP1 mRNA (N = 3 technical replicates from 2 repeats). C-D) Western blots (top) showing RNA pull-down assays of IGF2BP2 from HEK293T cell lysate, using biotin-h-Hilnc (C) or UCP1 mRNA segments (D) as baits (bottom), respectively. E) RT-qPCR of UCP1 mRNA enriched by IGF2BP2 RIP from UCP1-transfected HEK293T cells, co-transfected with blank or h-Hilnc plasmid (N = 3 biological replicates). F) Detection of IGF2BP2 by Western blot of RNA pull-down assays using UCP1 mRNA 3'UTR as bait, with increasing concentrations of synthesized h-Hilnc RNA added. G) In silico prediction of RNA-RNA interaction between h-Hilnc and UCP1 mRNA 3'UTR (https://rna.informatik.uni-freiburg.de/IntaRNA/Result.jsp). H) Molecular docking of hIGF2BP2 & h-Hilnc. The green highlight indicates the segment on h-Hilnc RNA with the most favorable (lowest) binding free energy to the UCP1 mRNA 3'UTR region. I) Construction strategy of PsiCHECK-2-UCP1 3'UTR. J) DLR of cells transfected with PsiCHECK-2 or PsiCHECK-2-UCP1 3'UTR, with or without co-transfection of h-Hilnc (N = 3 biological replicates). K) Construction strategy of pcDNA3.1(+)-UCP1 plasmid, with or without the endogenous 3'UTR. L) Western blots analysis and quantification of UCP1 and co-transfected GFP protein levels in HEK293T cells transfected with pcDNA3.1(+)-UCP1 CDS plasmid and with or without h-Hilnc (N = 3 technical replicates). M) Western blots analysis and quantification of UCP1 and co-transfected GFP protein levels in HEK293T cells transfected with pcDNA3.1(+)-UCP1 CDS-UCP1 3'UTR plasmid and with or without h-Hilnc (N = 3 technical replicates). Data are presented as mean ± SEM. One-way ANOVA with Tucky's multiple comparison correction (D, G and J) was used for statistical analysis. (ns: not significant, *: p < 0.05, **: p < 0.01, ***: p < 0.001, ****: p < 0.0001). See also Figure S7.
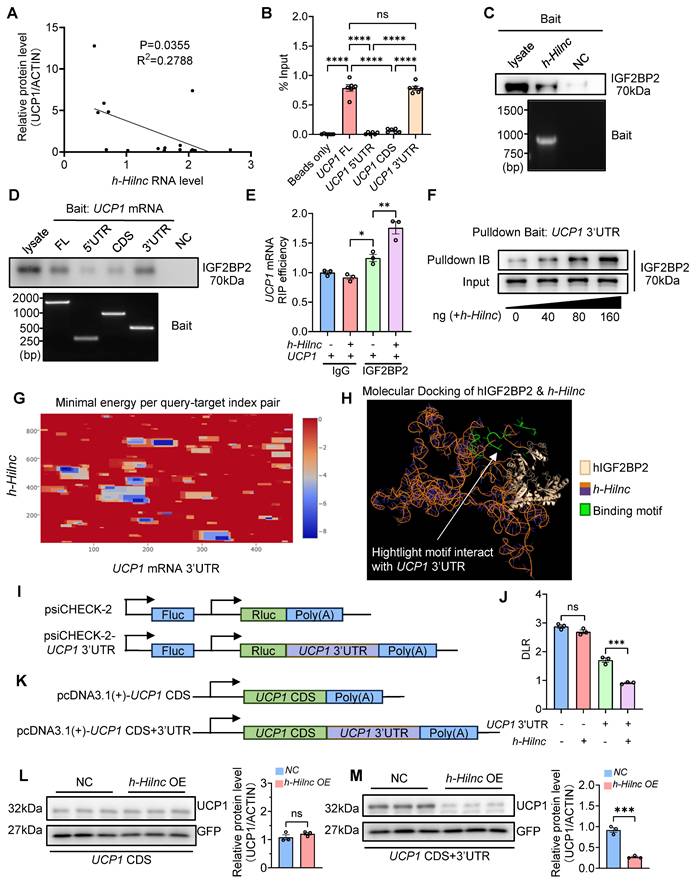
We next sought to determine whether these interactions could also suppress UCP1 translation. In IGF2BP2 RIP experiments, we observed that UCP1 mRNA was more efficiently enriched when h-Hilnc was present (Figure 6E), suggesting that similar to Hilnc in mice, h-Hilnc facilitates the binding of IGF2BP2 to the UCP1 mRNA. Furthermore, RNA pull-down experiments showed that h-Hilnc facilitated binding between IGF2BP2 and the UCP1 3'UTR in a dose-dependent manner (Figure 6F). Based on the consistent mode of action revealed by the experimental results, we predicted the specific binding region between h-Hilnc and the UCP1 mRNA 3'UTR. The prediction indicated a strong binding propensity between the 600-800 segment of h-Hilnc and the UCP1 mRNA 3'UTR (Figure 6G). Molecular docking simulations between the IGF2BP2 structure (provided by AlphaFold) and the predicted three-dimensional structure of h-Hilnc showed that the predicted h-Hilnc region interacting with the UCP1 mRNA 3'UTR is also positioned adjacent to the protein-binding site (Figure 6H), revealing a pattern similar to that observed in the mouse molecules. To confirm whether translational suppression of h-Hilnc and IGF2BP2 depends on the UCP1 mRNA 3'UTR, we cloned the UCP1 mRNA 3'UTR downstream of the Rluc CDS for dual-luciferase reporter assay (Figure 6I) and transfected the construct into HEK293T cells, with or without h-Hilnc. The results demonstrated that h-Hilnc suppressed Rluc translation exclusively when the UCP1 mRNA 3'UTR was present (Figure 6J). To assess the impact of h-Hilnc on UCP1 protein levels, the 3'UTR of UCP1 mRNA was cloned downstream of the UCP1 coding sequence (CDS) in a mammalian expression plasmid (Figure 6K). HEK293T cells were co-transfected with plasmids encoding h-Hilnc and UCP1 with or without the 3'UTR, and a GFP-encoding plasmid for control of transfection efficiency. We found that h-Hilnc effectively suppressed UCP1 expression only when the 3'UTR was present (Figure 6L-M), confirming that h-Hilnc is able to suppress UCP1 mRNA translation via its 3'UTR.
In conclusion, our findings suggest that h-Hilnc suppressed UCP1 translation in human adipocytes through mechanisms similar to those observed in mouse adipocytes.
Discussion
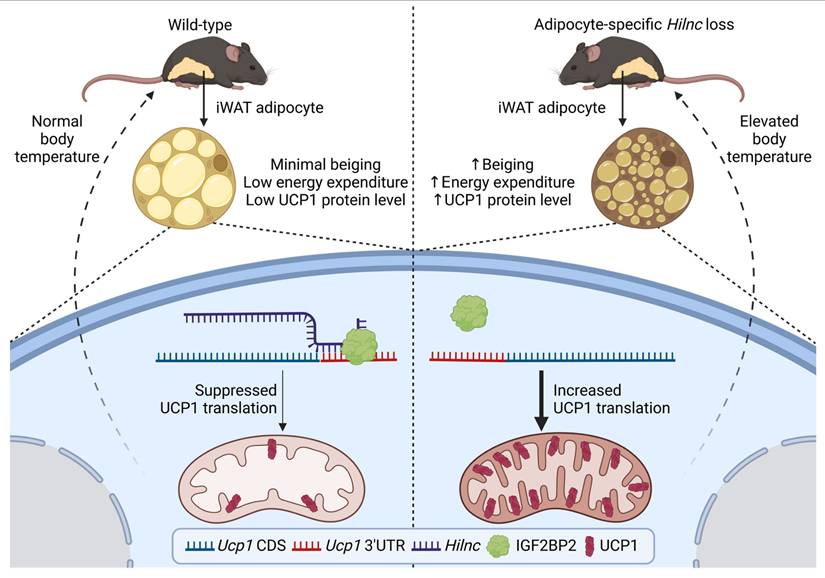
The beiging of white adipose tissue has been proposed as an important mechanism for mammalian cold adaptation [7, 53, 54]. This process is marked by increased thermogenesis and upregulation of the uncoupling protein UCP1 in white adipose tissue from certain depots in mice and humans [8, 10, 55, 56]. The function of long non-coding RNAs (lncRNAs) in the beiging of adipocytes remains poorly understood. In this study, we demonstrate that Hilnc, a previously identified lipid metabolism-related lncRNA, plays a pivotal role in regulating UCP1 expression in beige adipocytes from iWATs. Hilnc-deficient iWATs underwent spontaneous UCP1 expression and increased thermogenesis, thereby contributing to the maintenance of homeostatic body temperature and cold adaptation in mice. The mechanism by which Hilnc exerts its effects was found to involve binding to the 3'UTR of Ucp1 mRNA, while both RNA molecules bind to IGF2BP2. Hilnc facilitates the repression of Ucp1 mRNA translation through the recruitment of IGF2BP2 to the Ucp1 mRNA 3'UTR. The previously identified Hilnc functional homolog in humans, h-Hilnc, was found to regulate Ucp1 mRNA translation in human adipocytes via a similar mechanism. In conclusion, the research proposed a model of how Hilnc contributes to homeostatic thermogenesis through IGF2BP2-mediated translational repression of UCP1 (Figure 7), providing additional insights into the gene regulation and function of adipocytes by lncRNA and highlighting the therapeutic potential of targeting lncRNAs for the regulation of body energy homeostasis.
Summary of the role of Hilnc in homeostatic thermogenesis through IGF2BP2-mediated translational repression of UCP1. In the current study, we discovered that Hilnc plays an important role in regulation of UCP1 protein level in the beige adipocytes from iWATs of mice. Compared to the WT iWAT, iWATs from adipose-specific Hilnc-deficient mice exhibited elevated body temperature, increased beiging, elevated energy expenditure and increased UCP1 protein level. Hilnc was found to bind to the 3'UTR of Ucp1 mRNA and facilitate recruitment of IGF2BP2 for the translational suppression of Ucp1 mRNA.
The mitochondrial uncoupling protein UCP1 plays a central role in thermogenesis, enabling mammals to maintain body temperature in response to cold environments [57]. UCP1 expression in thermogenic adipocytes, such as brown and beige adipocytes, is triggered by stimuli like cold exposure, β-adrenergic signaling, oxidative stress, and HFD [55, 58, 59]. Expression of UCP1 is regulated at multiple levels. Recent studies have uncovered variable forms of the 3'UTR of Ucp1 mRNA, suggesting its critical role as a regulatory target [60]. However, the potential for lncRNAs to regulate UCP1 translation remains largely unexplored. Our discovery that Hilnc binds to the 3'UTR of Ucp1 mRNA and recruits IGF2BP2 to suppress translation represents a significant advancement in understanding lncRNA-mediated post-transcriptional regulation. These findings also emphasize the importance of RNA-guided riboprotein complexes in directing and exerting regulatory functions on target mRNAs.
The interactions between different RNA species, such as mRNAs and non-coding RNAs, have garnered significant research interest due to their critical role in gene expression regulation. To date, four main archetypes of lncRNA-mediated gene regulation have been identified, involving interactions with macromolecules like DNA, RNA, and proteins [31, 61]. Among these, the role of lncRNAs in regulating gene expression via DNA or chromatin interactions has been the most extensively studied [51, 62]. Much of the existing research focuses on antisense mediated in cis regulation, which affects parent genes located on the opposite DNA strand [63]. However, their interactions with mRNA, particularly in trans, remain less understood. Our discovery that Hilnc mediates Ucp1 mRNA translation by recruiting IGF2BP2 highlights the underappreciated significance of lncRNA-mRNA interactions in trans. When the Ucp1 mRNA-binding segment of Hilnc was abolished, IGF2BP2 failed to bind effectively to Ucp1 mRNA, emphasizing the importance of RNA guidance in facilitating this interaction. Notably, this suppression mechanism did not involve Ucp1 mRNA degradation (Figure 2D, J), which resembles miRNA-mediated translational suppression. miRNAs often target multiple genes simultaneously, raising the question of whether Hilnc or other lncRNAs may similarly regulate multiple genes in trans. If true, this could represent a broader and more systematic layer of gene expression control. Understanding these mechanisms may illuminate how lncRNAs like Hilnc orchestrate cellular functions and contribute to gene regulatory networks.
Despite their functional and marker similarities, beige and brown adipocytes are proposed to be distinct cell types originating from different lineages [7, 54]. Brown adipocytes exhibit a partially myogenic transcriptional signature and are thought to have a closer relationship to the muscle lineage [64]. In contrast, beige adipocytes have been proposed to arise either from beige-specific preadipocytes or through the trans-differentiation of white adipocytes [65-67]. This suggests that the differential regulation of thermogenesis in brown and beige adipocytes may contribute to the complex thermogenic regulation observed at the whole-body level. Most existing studies that investigated the role of lncRNAs in the beiging of white adipocytes focused on the transcriptional regulation of thermogenic genes, and few studies, if any, explored the potential post-transcriptional regulation by lncRNAs. Our findings provide new insights from such perspective, revealing that as a lncRNA that is regulating UCP1 level post-transcriptionally, Hilnc is expressed in both eWAT and iWAT, but not in BAT. Furthermore, Hilnc was uniquely associated with UCP1 translation in beige adipocytes from iWAT, but not in eWAT or BAT. These results highlight the molecular differences between brown, beige, and white adipocytes, and suggest that distinct regulatory mechanisms govern UCP1 expression in brown and beige adipocytes despite their functional similarity. Considering that brown adipocytes were developmentally closer to the muscle lineage, and Hilnc was expressed in muscles [34] but not in brown adipocytes (Figure S1F), it raises an interesting speculation that the absence of Hilnc may be required for efficient expression of UCP1 in brown adipocytes during their differentiation.
In the investigation of the whole-body metabolism characteristics of mice by metabolic cages, we observed a shift in the energy metabolite preference of HilncAKO mice, but no significant differences in energy expenditure between Hilncf/f and HilncAKO mice were observed. We reasoned that under homeostatic conditions, the mice were not experiencing significant metabolic stress, and the higher UCP1 protein level in the beige adipocytes of HilncAKO mice was unable to drive a significant difference in overall energy expenditure, and only manifested as a shift in relatively higher lipid consumption. The effect of Hilnc on overall energy expenditure was further illustrated when we subjected the mice to energy-demanding stress (NA injection; Figure 1L), showing that HilncAKO mice experience higher energy expenditure under stress, which is consistent with our hypothesis that Hilnc expression would affect overall energy expenditure of mice.
As our understanding of the functions of non-coding RNA has advanced in recent years, an increasing number of these molecules have been recognized as viable therapeutic targets for a variety of diseases, with many potential targeting strategies currently in clinical trials or under development [68]. Metabolic disorders such as obesity have become increasingly prevalent worldwide and are closely linked to the incidence of other diseases, including diabetes, cardiovascular diseases, and musculoskeletal disorders, posing significant threats to overall human health and life expectancy [69-71]. Given its role in energy dissipation, UCP1 has emerged as a promising therapeutic target for treating obesity and related metabolic disorders [56, 72-74]. Previous studies have indicated that human visceral adipose tissues do not express UCP1 [9, 75], rendering investigations of UCP1 expression in human adipose tissues difficult. Our study, which sampled subcutaneous adipose tissues, was able to detect UCP1 protein in the sampled tissues, and demonstrated that h-Hilnc levels negatively correlated with UCP1 protein levels in human adipose tissues, implying that h-Hilnc may be an intrinsic factor that regulates the function of differentiated human beige adipocytes, and overall homeostatic thermoregulation and energy expenditure of the human body. Specifically, by targeting and disrupting the UCP1 mRNA-binding region, it may be possible to relieve the translational suppression of UCP1 by IGF2BP2, leading to increased UCP1 expression and enhanced energy expenditure in human beige adipocytes, which could promote higher homeostatic body energy expenditure, potentially contributing to the fight against obesity.
In summary, our findings reveal the role of Hilnc in regulating beige adipocyte activity through the post-transcriptional regulation of UCP1 translation. This work highlights the complex regulation of adipocyte function and thermogenesis by lncRNAs at the post-transcriptional level, and provides insights into the potential therapeutic applications of modulating lncRNA function to target adipocyte activity.
Abbreviations
LncRNA: long non-coding RNA; UCP1: Uncoupling protein 1; SVF: stromal vascular fraction; iWAT: inguinal white adipose tissue; BAT: brown adipose tissue; eWAT: epidydimal white adipose tissues; TEM: Transmission electron microscopy; LC-MS/MS: Liquid Chromatography-Tandem Mass Spectrometry; RIP: RNA immunoprecipitation; RPA: RNase protection assay; 3'UTR: 3' untranslated region; IGF2BP2: insulin-like growth factor 2 binding protein 2; HNRNPL: heterogeneous nuclear ribonucleoprotein L; AdV: adenovirus; h-Hilnc: human homolog of Hilnc; VO₂: oxygen consumption; VCO₂: carbon dioxide production; RER: respiratory exchange ratio; EE: energy expenditure; NA: Norepinephrine Bitartrate Monohydrate; SVF: Stromal Vascular Fraction; IBMX: Isobutyl-1-methylxanthine; T3: Triiodo-l-thyronine; MOI: multiplicity of infection; Fluc: firefly luciferase; Rluc: renilla luciferase.
Supplementary Material
Supplementary figures and tables.
Acknowledgements
We thank the Facility for Animal Husbandry, and technical supports from Core Facility for Cell Biology and Core Facility for Molecular Biology at CEMCS. We thank Prof. Hu Zhou at the Shanghai Institute of Materia Medica, Chinese Academy of Sciences for technical assistance with the mass spectrometry and analysis. We thank Prof. Hao Ying at Shanghai Institute of Nutrition and Health, Chinese Academy of Sciences for providing mouse resource and helpful discussions. We thank BioRender (https://www.biorender.com/) for providing the platform to create the cartoons used in this manuscript.
Funding
This study was supported by grants from the Strategic Priority Research Program of the National Key Research and Development Program of China (2020YFA0509003 to Y.Z.), the National Natural Science Foundation of China (32130025, 32521007, 32293232, 32450274 to Z.Y., 32270787 and 32470914 to J.Y.P.) and the Project supported by Shanghai Municipal Science and Technology Major Project.
Author contributions
Conceptualization: Z.Z., Z.Y.
Methodology: Y.L., Z.Z., Z.Y.
Formal Analysis: J.M., Y.L., Y.A.W., Y.C., Z.Q.
Investigation: J.M., Y.L., Y.A.J., R.Z.W.
Data Curation: J.M., Y.L., Y.C.
Resources: Y.C.
Writing - Original Draft: J.M., Y.L.
Writing - Review & Editing: Y.L., Z.Z., J.Y.P., Y.C., Z.Y.
Supervision: Z.Z., Z.Y.
Funding Acquisition: Z.Y., J.Y.P.
Data availability
All data are available in the main text or the supplementary materials. RNA-seq data have been deposited in GSA under accession number CRA033269, and are publicly available as of the date of publication.
Lead contact
Further information and requests for resources and reagents should be directed to and will be fulfilled by the lead contact, Yun Zhao (yunzhao@sibcb.ac.cn).
Competing Interests
The authors have declared that no competing interest exists.
References
1. Zwick R K, Guerrero-Juarez C F, Horsley V, Plikus M V. Anatomical, physiological, and functional diversity of adipose tissue. Cell Metab. 2018;27(1):68-83
2. Rosen E D, Spiegelman B M. What we talk about when we talk about fat. Cell. 2014;156(1-2):20-44
3. Tang Y, Yang L J, Liu H, Song Y J, Yang Q Q, Liu Y. et al. Exosomal mir-27b-3p secreted by visceral adipocytes contributes to endothelial inflammation and atherogenesis. Cell Rep. 2023;42(1):111948
4. Wang Q, Li D, Cao G, Shi Q, Zhu J, Zhang M. et al. Il-27 signalling promotes adipocyte thermogenesis and energy expenditure. Nature. 2021;600(7888):314-8
5. Wang Y N, Tang Y, He Z, Ma H, Wang L, Liu Y. et al. Slit3 secreted from m2-like macrophages increases sympathetic activity and thermogenesis in adipose tissue. Nat Metab. 2021;3(11):1536-51
6. Chouchani E T, Kajimura S. Metabolic adaptation and maladaptation in adipose tissue. Nat Metab. 2019;1(2):189-200
7. Wu J, Bostrom P, Sparks L M, Ye L, Choi J H, Giang A H. et al. Beige adipocytes are a distinct type of thermogenic fat cell in mouse and human. Cell. 2012;150(2):366-76
8. Shabalina I G, Petrovic N, de Jong J M, Kalinovich A V, Cannon B, Nedergaard J. Ucp1 in brite/beige adipose tissue mitochondria is functionally thermogenic. Cell Rep. 2013;5(5):1196-203
9. Ricquier D. Ucp1, the mitochondrial uncoupling protein of brown adipocyte: A personal contribution and a historical perspective. Biochimie. 2017;134:3-8
10. Nedergaard J, Golozoubova V, Matthias A, Asadi A, Jacobsson A, Cannon B. Ucp1: The only protein able to mediate adaptive non-shivering thermogenesis and metabolic inefficiency. Biochim Biophys Acta. 2001;1504(1):82-106
11. Bachman E S, Dhillon H, Zhang C Y, Cinti S, Bianco A C, Kobilka B K. et al. Betaar signaling required for diet-induced thermogenesis and obesity resistance. Science. 2002;297(5582):843-5
12. Villarroya F, Peyrou M, Giralt M. Transcriptional regulation of the uncoupling protein-1 gene. Biochimie. 2017;134:86-92
13. Wang W, Seale P. Control of brown and beige fat development. Nat Rev Mol Cell Biol. 2016;17(11):691-702
14. Wang W, Ishibashi J, Trefely S, Shao M, Cowan A J, Sakers A. et al. A prdm16-driven metabolic signal from adipocytes regulates precursor cell fate. Cell Metab. 2019;30(1):174-89 e5
15. Seale P, Conroe H M, Estall J, Kajimura S, Frontini A, Ishibashi J. et al. Prdm16 determines the thermogenic program of subcutaneous white adipose tissue in mice. J Clin Invest. 2011;121(1):96-105
16. Ohno H, Shinoda K, Ohyama K, Sharp L Z, Kajimura S. Ehmt1 controls brown adipose cell fate and thermogenesis through the prdm16 complex. Nature. 2013;504(7478):163-7
17. Scarpulla R C. Transcriptional paradigms in mammalian mitochondrial biogenesis and function. Physiol Rev. 2008;88(2):611-38
18. Jankovic A, Golic I, Markelic M, Stancic A, Otasevic V, Buzadzic B. et al. Two key temporally distinguishable molecular and cellular components of white adipose tissue browning during cold acclimation. J Physiol. 2015;593(15):3267-80
19. Bostrom P, Wu J, Jedrychowski M P, Korde A, Ye L, Lo J C. et al. A pgc1-alpha-dependent myokine that drives brown-fat-like development of white fat and thermogenesis. Nature. 2012;481(7382):463-8
20. Guo Y Y, Li B Y, Peng W Q, Guo L, Tang Q Q. Taurine-mediated browning of white adipose tissue is involved in its anti-obesity effect in mice. J Biol Chem. 2019;294(41):15014-24
21. Ding M, Xu H Y, Zhou W Y, Xia Y F, Li B Y, Shi Y J. et al. Clcf1 signaling restrains thermogenesis and disrupts metabolic homeostasis by inhibiting mitochondrial biogenesis in brown adipocytes. Proc Natl Acad Sci U S A. 2023;120(33):e2305717120
22. Collins S, Yehuda-Shnaidman E, Wang H. Positive and negative control of ucp1 gene transcription and the role of beta-adrenergic signaling networks. Int J Obes (Lond). 2010;34(Suppl 1):S28-33
23. Dempersmier J, Sambeat A, Gulyaeva O, Paul S M, Hudak C S, Raposo H F. et al. Cold-inducible zfp516 activates ucp1 transcription to promote browning of white fat and development of brown fat. Mol Cell. 2015;57(2):235-46
24. Fan H, Zhang Y, Zhang J, Yao Q, Song Y, Shen Q. et al. Cold-inducible klf9 regulates thermogenesis of brown and beige fat. Diabetes. 2020;69(12):2603-18
25. Yao L, Cui X, Chen Q, Yang X, Fang F, Zhang J. et al. Cold-inducible sirt6 regulates thermogenesis of brown and beige fat. Cell Rep. 2017;20(3):641-54
26. Takahashi A, Adachi S, Morita M, Tokumasu M, Natsume T, Suzuki T. et al. Post-transcriptional stabilization of ucp1 mrna protects mice from diet-induced obesity. Cell Rep. 2015;13(12):2756-67
27. Wang Y, Gao M, Zhu F, Li X, Yang Y, Yan Q. et al. Mettl3 is essential for postnatal development of brown adipose tissue and energy expenditure in mice. Nat Commun. 2020;11(1):1648
28. Dai N, Zhao L, Wrighting D, Kramer D, Majithia A, Wang Y. et al. Igf2bp2/imp2-deficient mice resist obesity through enhanced translation of ucp1 mrna and other mrnas encoding mitochondrial proteins. Cell Metab. 2015;21(4):609-21
29. Ransohoff J D, Wei Y, Khavari P A. The functions and unique features of long intergenic non-coding rna. Nat Rev Mol Cell Biol. 2018;19(3):143-57
30. Jia Z, An J, Liu Z, Zhang F. Non-coding rnas in colorectal cancer: Their functions and mechanisms. Front Oncol. 2022;12:783079
31. Wang K C, Chang H Y. Molecular mechanisms of long noncoding rnas. Mol Cell. 2011;43(6):904-14
32. Li M, Sun X, Cai H, Sun Y, Plath M, Li C. et al. Long non-coding rna adncr suppresses adipogenic differentiation by targeting mir-204. Biochim Biophys Acta. 2016;1859(7):871-82
33. Liu W, Ma C, Yang B, Yin C, Zhang B, Xiao Y. Lncrna gm15290 sponges mir-27b to promote ppargamma-induced fat deposition and contribute to body weight gain in mice. Biochem Biophys Res Commun. 2017;493(3):1168-75
34. Jiang Y, Peng J, Song J, He J, Jiang M, Wang J. et al. Loss of hilnc prevents diet-induced hepatic steatosis through binding of igf2bp2. Nat Metab. 2021;3(11):1569-84
35. Han L, Huang D, Wu S, Liu S, Wang C, Sheng Y. et al. Lipid droplet-associated lncrna lipter preserves cardiac lipid metabolism. Nat Cell Biol. 2023;25(7):1033-46
36. Zhang Z, Cui Y, Su V, Wang D, Tol M J, Cheng L. et al. A ppargamma/long noncoding rna axis regulates adipose thermoneutral remodeling in mice. J Clin Invest. 2023 133(21)
37. Wang Y, Wang M, Chen J, Li Y, Kuang Z, Dende C. et al. The gut microbiota reprograms intestinal lipid metabolism through long noncoding rna snhg9. Science. 2023;381(6660):851-7
38. Liu S, Shen S, Yan Y, Sun C, Lu Z, Feng H. et al. Triiodothyronine (t3) promotes brown fat hyperplasia via thyroid hormone receptor alpha mediated adipocyte progenitor cell proliferation. Nat Commun. 2022;13(1):3394
39. Chen Y, Chen L, Wu X, Zhao Y, Wang Y, Jiang D. et al. Acute liver steatosis translationally controls the epigenetic regulator mier1 to promote liver regeneration in a study with male mice. Nat Commun. 2023;14(1):1521
40. Drew B, Leeuwenburgh C. Method for measuring atp production in isolated mitochondria: Atp production in brain and liver mitochondria of fischer-344 rats with age and caloric restriction. American Journal of Physiology Regulatory, Integrative and Comparative Physiology. 2003;285(5):R1259-R67
41. Gao W, Kong X, Yang Q. Isolation, primary culture, and differentiation of preadipocytes from mouse brown adipose tissue. Thermogenic fat. Methods in molecular biology2017. p. 3-8.
42. Liu L, Zheng L D, Donnelly S R, Emont M P, Wu J, Cheng Z. Isolation of mouse stromal vascular cells for monolayer culture. Thermogenic fat. Methods in molecular biology2017. p. 9-16.
43. Zhang Y, Wang J, Xiao Y. 3drna: 3d structure prediction from linear to circular rnas. J Mol Biol. 2022;434(11):167452
44. Yan Y, Zhang D, Zhou P, Li B, Huang S-Y. Hdock: A web server for protein-protein and protein-DNA/rna docking based on a hybrid strategy. Nucleic Acids Research. 2017;45(W1):W365-W73
45. Tschöp M H, Speakman J R, Arch J R S, Auwerx J, Brüning J C, Chan L. et al. A guide to analysis of mouse energy metabolism. Nature Methods. 2011;9(1):57-63
46. Xiong W, Xiong Z, Song A, Lei C, Ye C, Zhang C. Relieving lipid accumulation through ucp1 suppresses the progression of acute kidney injury by promoting the ampk/ulk1/autophagy pathway. Theranostics. 2021;11(10):4637-54
47. Okamatsu-Ogura Y, Kuroda M, Tsutsumi R, Tsubota A, Saito M, Kimura K. et al. Ucp1-dependent and ucp1-independent metabolic changes induced by acute cold exposure in brown adipose tissue of mice. Metabolism. 2020;113:154396
48. Steinbring J, Graja A, Jank A-M, Schulz T J. Flow cytometric isolation and differentiation of adipogenic progenitor cells into brown and brite/beige adipocytes. Springer New York. 2017 p. 25-36
49. Schulz T J, Huang T L, Tran T T, Zhang H, Townsend K L, Shadrach J L. et al. Identification of inducible brown adipocyte progenitors residing in skeletal muscle and white fat. Proc Natl Acad Sci U S A. 2011;108(1):143-8
50. Ibayashi Y, Hasuzawa N, Nomura S, Kabashima M, Nagayama A, Iwata S. et al. Mitochondrial fission is required for thermogenesis in brown adipose tissue. PloS One. 2024;19(12):e0312352
51. Kopp F, Mendell J T. Functional classification and experimental dissection of long noncoding rnas. Cell. 2018;172(3):393-407
52. Geuens T, Bouhy D, Timmerman V. The hnrnp family: Insights into their role in health and disease. Hum Genet. 2016;135(8):851-67
53. Liu X, Cervantes C, Liu F. Common and distinct regulation of human and mouse brown and beige adipose tissues: A promising therapeutic target for obesity. Protein Cell. 2017;8(6):446-54
54. Ikeda K, Maretich P, Kajimura S. The common and distinct features of brown and beige adipocytes. Trends Endocrinol Metab. 2018;29(3):191-200
55. Lu W H, Chang Y M, Huang Y S. Alternative polyadenylation and differential regulation of ucp1: Implications for brown adipose tissue thermogenesis across species. Front Pediatr. 2020;8:612279
56. Kozak L P, Anunciado-Koza R. Ucp1: Its involvement and utility in obesity. Int J Obes (Lond). 2008 32 Suppl 7(Suppl 7):S32-8
57. Sakers A, De Siqueira M K, Seale P, Villanueva C J. Adipose-tissue plasticity in health and disease. Cell. 2022;185(3):419-46
58. Chouchani E T, Kazak L, Spiegelman B M. New advances in adaptive thermogenesis: Ucp1 and beyond. Cell Metab. 2019;29(1):27-37
59. Ortega S P, Chouchani E T, Boudina S. Stress turns on the heat: Regulation of mitochondrial biogenesis and ucp1 by ros in adipocytes. Adipocyte. 2017;6(1):56-61
60. Chen H F, Hsu C M, Huang Y S. Cpeb2-dependent translation of long 3'-utr ucp1 mrna promotes thermogenesis in brown adipose tissue. EMBO J. 2018;37(20):e99071
61. Statello L, Guo C J, Chen L L, Huarte M. Gene regulation by long non-coding rnas and its biological functions. Nat Rev Mol Cell Biol. 2021;22(2):96-118
62. Mattick J S, Amaral P P, Carninci P, Carpenter S, Chang H Y, Chen L L. et al. Long non-coding rnas: Definitions, functions, challenges and recommendations. Nat Rev Mol Cell Biol. 2023;24(6):430-47
63. Carrieri C, Cimatti L, Biagioli M, Beugnet A, Zucchelli S, Fedele S. et al. Long non-coding antisense rna controls uchl1 translation through an embedded sineb2 repeat. Nature. 2012;491(7424):454-7
64. Timmons J A, Wennmalm K, Larsson O, Walden T B, Lassmann T, Petrovic N. et al. Myogenic gene expression signature establishes that brown and white adipocytes originate from distinct cell lineages. Proc Natl Acad Sci U S A. 2007;104(11):4401-6
65. Cinti S. Transdifferentiation properties of adipocytes in the adipose organ. Am J Physiol Endocrinol Metab. 2009;297(5):E977-86
66. Barbatelli G, Murano I, Madsen L, Hao Q, Jimenez M, Kristiansen K. et al. The emergence of cold-induced brown adipocytes in mouse white fat depots is determined predominantly by white to brown adipocyte transdifferentiation. Am J Physiol Endocrinol Metab. 2010;298(6):E1244-53
67. Lee Y H, Petkova A P, Konkar A A, Granneman J G. Cellular origins of cold-induced brown adipocytes in adult mice. FASEB J. 2015;29(1):286-99
68. Winkle M, El-Daly S M, Fabbri M, Calin G A. Noncoding rna therapeutics — challenges and potential solutions. Nature Reviews Drug Discovery. 2021;20(8):629-51
69. Lin X, Li H. Obesity: Epidemiology, pathophysiology, and therapeutics. Front Endocrinol (Lausanne). 2021;12:706978
70. Swinburn B A, Sacks G, Hall K D, McPherson K, Finegood D T, Moodie M L. et al. The global obesity pandemic: Shaped by global drivers and local environments. Lancet. 2011;378(9793):804-14
71. Jebeile H, Kelly A S, O'Malley G, Baur L A. Obesity in children and adolescents: Epidemiology, causes, assessment, and management. Lancet Diabetes Endocrinol. 2022;10(5):351-65
72. Betz M J, Enerback S. Targeting thermogenesis in brown fat and muscle to treat obesity and metabolic disease. Nat Rev Endocrinol. 2018;14(2):77-87
73. Liu J, Wang Y, Lin L. Small molecules for fat combustion: Targeting obesity. Acta Pharm Sin B. 2019;9(2):220-36
74. Liang D, Li G. Pulling the trigger: Noncoding rnas in white adipose tissue browning. Rev Endocr Metab Disord. 2024;25(2):399-420
75. Lidell M E, Betz M J, Dahlqvist Leinhard O, Heglind M, Elander L, Slawik M. et al. Evidence for two types of brown adipose tissue in humans. Nature Medicine. 2013;19(5):631-4
Author contact
![]() Corresponding authors: liyuac.cn (Y.L.), chani_1213com (Y.C), zhao.zhangedu (Z.Z.), yunzhaoac.cn (Z.Y.).
Corresponding authors: liyuac.cn (Y.L.), chani_1213com (Y.C), zhao.zhangedu (Z.Z.), yunzhaoac.cn (Z.Y.).