Impact Factor
- Issue 14; 2026
- Issue 13; 2026
- Issue 12; 2026
- Issue 11; 2026
- Issue 10; 2026
- Volume 16; 2026
- Advance Articles
- Past Issues
- Cover Images
- Cover Suggestion
- Index & Coverage
- Special Issues
Introduction
Materials and methods
Results
Discussion
Supplementary Material
Acknowledgements
References
International Journal of Biological Sciences
International Journal of Medical Sciences
 Global reach, higher impact

Theranostics 2025; 15(8):3439-3461. doi:10.7150/thno.103722 This issue Cite
Research Paper
A novel pathway for stemness propagation and chemoresistance in non-small cell lung cancer via phosphorylated PKM2-loaded small extracellular vesicles
Jingyi Wang1,3#, Liu Liu1#, Xinyu Gao2, Xiyu Liu2, Yitian Dai4, Zijun Mao2, Shengzhe Huang2, Junjian Li5, Dongliang Wang6, Yu Qi7, Yingwen Han1, Yunjing Xu2, Corrine Ying Xuan Chua3, Alessandro Grattoni3,8,9, Wenhui Xie1 ![]() , Hao Yang2
, Hao Yang2 ![]() , Gang Huang1,2
, Gang Huang1,2 ![]()
1. Department of Nuclear Medicine, Shanghai Chest Hospital, Shanghai Jiao Tong University School of Medicine, Shanghai 200025, China.
2. Shanghai Key Laboratory of Molecular Imaging, Jiading District Central Hospital Affiliated Shanghai University of Medicine and Health Sciences, Shanghai 201318, China.
3. Department of Nanomedicine, Houston Methodist Research Institute, Houston, TX 77030, USA.
4. Laboratory of Stem Cell Biology and Engineering, New York Blood Center, New York, NY 10065, USA.
5. Department of Oncology, Shanghai General Hospital, Shanghai Jiao Tong University School of Medicine, Shanghai 200080, China.
6. Department of Nuclear Medicine, Cancer Institute, Fudan University Shanghai Cancer Center, Shanghai 200032, China.
7. Department of Pathology, Fudan University Shanghai Cancer Center, Shanghai, 200032, China.
8. Department of Surgery, Houston Methodist Hospital, Houston, TX 77030, USA.
9. Department of Radiation Oncology, Houston Methodist Hospital, Houston, TX 77030, USA.
# These authors contribute equally as first authors.
Received 2024-9-15; Accepted 2025-2-11; Published 2025-2-24
Abstract

Rationale: Non-small cell lung cancer (NSCLC) is a predominant cause of cancer-related mortality, with its progression and treatment resistance significantly influenced by cancer stem cells (CSCs) and their complex intercellular communication mechanisms. Small extracellular vesicles (sEVs) have emerged as pivotal mediators of intercellular signaling, affecting tumor microenvironment modulation and therapeutic resistance. This study investigates the role of CSC-derived sEVs in transmitting stemness traits through the selective sorting of pyruvate kinase M2 phosphorylated at the Y105 site (pY105-PKM2), mediated by the adaptor protein IQGAP1, which supports CSC maintenance and drug resistance in NSCLC.
Methods: In vitro and in vivo experiments, including proteomic and transcriptomic analyses, were conducted to identify key regulators of sEV-mediated signaling. Immunoprecipitation, proximity ligation assays, and immunofluorescence were used to examine the role of IQGAP1 in the sorting of pY105-PKM2 into sEVs. Functional assays, including sphere formation, chemoresistance tests, metabolic assessments, and cell cycle analysis, were conducted to evaluate the effects of sEV-mediated delivery of pY105-PKM2 on recipient cells. Additionally, immunohistochemistry and survival analysis were performed on tumor samples from NSCLC patients to establish clinical correlations.
Results: We unveiled a novel mechanism by which CSC-derived sEVs transmit stemness traits to replenish the CSC pool in NSCLC. CSC-derived sEVs were enriched with pY105-PKM2, correlating with enhanced stemness, chemoresistance, and poor clinical outcomes. Mechanistically, IQGAP1 was identified as an adaptor facilitating the selective sorting of pY105-PKM2 into sEVs through interactions with the ESCRT component TSG101. Recipient cells treated with CSC-derived sEVs exhibited metabolic reprogramming, slower cell cycle progression, and enhanced chemoresistance. The synergistic role of IQGAP1 and pY105-PKM2 was confirmed, highlighting their critical contributions to CSC maintenance and malignant progression.
Conclusion: This study highlights the critical role of CSC-derived sEVs in NSCLC progression and therapy resistance through the IQGAP1-mediated selective sorting of pY105-PKM2. By uncovering this novel pathway, our findings provide valuable insights into CSC pool replenishment and therapeutic resistance mechanisms in NSCLC, identifying IQGAP1 and pY105-PKM2 as promising therapeutic targets for mitigating CSC-driven malignancy and enhancing treatment efficacy.
Keywords: cancer stem cells, small extracellular vesicles, pY105-PKM2, IQGAP1, drug resistance
Introduction
Lung cancer ranks as one of the most lethal types of cancer worldwide, with non-small cell lung cancer (NSCLC) being the predominant subtype. According to the latest GLOBOCAN 2020 data, lung cancer has an incidence rate of 11.4% among all malignancies globally, placing it second, and a mortality rate of 18%, ranking it first [1]. Despite advancements in treatment, including the use of platinum-based drugs and docetaxel, therapeutic resistance continues to hinder long-term efficacy [2]. Recent strategies combining targeted therapy and immunotherapy with chemotherapy have yielded short-term benefits for some patients [3-5]. However, overcoming the inevitable issue of drug resistance in NSCLC remains a global challenge and priority.
Recent studies have highlighted the critical role of cancer stem cells (CSCs) in tumor initiation, progression, and therapeutic resistance [6-8]. CSCs are characterized by their capacity for self-renewal and differentiation into diverse cell lineages within the tumor mass, thereby contributing to the complexity and treatment-resistant nature of the disease [9]. Traditional strategies focused on inhibiting CSC-specific surface markers, such as CD44 or CD133, or the disruption of their signaling pathways, including Hedgehog, Wnt, and Notch, have largely failed to overcome therapeutic resistance [10]. Emerging evidence has illuminated a fundamental challenge: the hierarchy within CSC populations is not hardwired. Douglas Hanahan's recent proposition of “phenotypic plasticity” as a novel dimension enhances our comprehension of cancer's hallmarks by highlighting the potential of cancer cells to dedifferentiate to a progenitor-like state from a fully differentiated one [11, 12]. Cellular plasticity within the tumor microenvironment allows for the reprogramming of non-CSCs or differentiated cancer cells back into CSCs, suggesting a dynamic equilibrium that permits the replenishment of the CSC pool, thereby facilitating tumor recurrence and resistance to therapy [13, 14]. Therefore, elucidating the mechanisms behind CSC pool replenishment is essential for completely eradicating CSCs and may hold the key to more effective cancer treatments.
Small extracellular vesicles (sEVs), as defined by the International Society for Extracellular Vesicles, are entities less than 200 nm in diameter, generated through the amalgamation of multivesicular bodies with the plasma membrane [15]. These vesicles, ubiquitously released by a wide range of cells and found in various bodily fluids, play a critical role in cellular communication, carrying an array of molecules, including proteins, lipids, RNA, and DNA [16-18]. Clinical observations have documented more sEVs in cancerous cells relative to their benign counterparts, implicating them in various pathological processes, such as angiogenesis, chemoresistance, cellular differentiation within the tumor microenvironment, immune modulation, and pre-metastatic niche regulation [19, 20]. Recent studies have also highlighted the role of CSC-derived sEVs in immune evasion, where they modulate the tumor microenvironment to suppress antitumor immune responses, facilitating immune escape and promoting tumor progression [21]. While sEVs are recognized for their role in transferring bioactive molecules that contribute to the aggressive behavior of cancer, the specific pathways and molecular cargos driving CSC maintenance and expansion, particularly in NSCLC, remain underexplored.
Another facet of oncology that has attracted interest is the altered metabolism within cancer cells, serving as a foundation for innovative therapeutic interventions [11, 22]. Previous research in this domain has not adequately addressed the metabolic heterogeneity within cancer cell populations [23]. The distinct metabolic behavior of CSCs represents another layer of complexity in cancer [24-26]. Our research has demonstrated that PKM2 cargo in sEVs drives cisplatin resistance [27]. However, it remains uncertain whether this phenomenon is associated with CSC behavior. Recent findings have suggested a correlation between the levels of pyruvate kinase M2 phosphorylated at the Y105 site (pY105-PKM2) and the emergence of stemness features in breast cancer cells, positing an association between metabolic shifts and the acquisition of stem cell-like traits in cancer [28]. Nevertheless, the specific role of pY105-PKM2 in promoting a CSC-like phenotype in NSCLC cells and its integration into the regulatory networks associated with sEVs needs to be clearly defined.
In this study, we investigated the role of CSC-derived sEVs in NSCLC progression and chemoresistance, focusing on the selective incorporation of pY105-PKM2. We identified IQGAP1 as a key mediator of this process, linking pY105-PKM2 to TSG101 and facilitating its packaging into sEVs. These sEVs enhance stemness, metabolic reprogramming, and drug resistance in recipient cells. Additionally, we confirmed the synergistic role of IQGAP1 and pY105-PKM2, highlighting their critical contributions to CSC maintenance and malignant progression. Our findings provide new insights into CSC maintenance and sEV-mediated resistance, identifying potential therapeutic targets to disrupt CSC-driven malignancy.
Materials and methods
Cell culture
Human lung cancer cell line A549 (ATCC, Cat# CCL-185) was cultured in RPMI-1640 medium supplemented with 10% fetal bovine serum (Yeasen Biotechnology, Shanghai, China) and 1% penicillin-streptomycin (Gibco, Cat# 15140122, MA, USA). Cisplatin-resistant A549 cells (A549CR) were developed by gradually increasing the cisplatin concentration over 10 months, with a final maintenance dose of 1.0 μg/mL cisplatin.
For sphere formation, cells in the exponential growth phase were plated at a density of 1,000 cells/mL in serum-free DMEM/F12 medium (Absin Bioscience Inc., Shanghai, China) supplemented with B-27 (1:50, Absin Bioscience Inc.), N2 supplement (1:100, Absin Bioscience Inc.), and human recombinant epidermal growth factor (20 ng/mL, Sigma-Aldrich, Darmstadt, Germany). Cells were cultured in ultra-low attachment 6-well plates (Corning, Cat# 3471, NY, USA) for 7-14 days to form spheres, which were identified using a phase-contrast microscope. Spheres exceeding 50 µm in diameter were quantified.
All cell lines were authenticated by STR profiling and tested for mycoplasma contamination every 2 weeks. Cells were maintained at 37 °C in a humidified atmosphere with 5% CO₂. Paclitaxel, cisplatin, TEPP-46, and Apcin were obtained from Selleck Chemicals (TX, USA).
Cell line establishment
To investigate the role of PKM2 phosphorylation at Y105 and IQGAP1 in NSCLC, we established multiple genetically modified cell lines. Stable PKM2WT-expressing and PKM2Y105F-expressing A549 cells were generated by CRISPR-Cas9-mediated PKM2 knockout, followed by lentiviral transduction with plasmids encoding either PKM2WT or the non-phosphorylatable PKM2Y105F mutant. Selection was performed using puromycin (Selleck Chemicals). Two guide RNA sequences were used for PKM2 knockout and for control: CTTGCCTGCTGTGTCGGAGAAGG and GCAAAATCGAGAATCATGAGGGG. The pLenti-Flag-PKM2Y105F plasmid was constructed by amplifying Flag-PKM2Y105F mutant DNA with primers PKM2-PrimerF and PKM2-PrimerR and cloning into the pLenti vector.
For IQGAP1 silencing, A549-PKM2WT and A549-PKM2Y105F cells were transfected with 20 nM siRNA using Lipofectamine RNAiMAX (Thermo Fisher, USA) following the manufacturer's protocol. Cells were seeded at 1.5 × 10⁵ cells per well in six-well plates and transfected at 50-60% confluency. siRNA and Lipofectamine RNAiMAX were separately diluted in Opti-MEM, incubated for 5 min, mixed, and left for 20 min at room temperature to form transfection complexes. The mixture was then added to antibiotic-free RPMI-1640 medium, and cells were incubated for 48 h before further analysis. The sequences of the siRNAs used for IQGAP1 silencing were:
siRNA-IQGAP1#1: GCCCACUUAAGCAUCAUUATT/UAAUGAUGCUUAAGUGGGCTT; siRNA-IQGAP1#2: CCAGUCGUGAAGGAAAUUATT/UAAUUUCCUUCACGACUGGTT; siRNA-IQGAP1#3: GUUGCAGUCAUGAAAUUAUTT/AUAAUUUCAUGACUGCAACTT; siRNA-IQGAP1#4: GCGACAAAGUCCUGAACAUTT/AUGUUCAGGACUUUGUCGCTT.
To further assess the role of IQGAP1 in CSC maintenance and chemoresistance, we established IQGAP1-overexpressing A549 cells, as well as A549 cell lines co-expressing IQGAP1 with PKM2WT or PKM2Y105F. These cell lines were generated via lentiviral transduction and selected using puromycin. The expression of IQGAP1 and PKM2 variants was validated by fluorescent protein expression, where IQGAP1 was tagged with red fluorescence, and PKM2WT and PKM2Y105F were tagged with green fluorescence, before further experiments.
Colony formation assay
Clonogenic potential was assessed using a colony formation assay. A549, A549CR, and stable PKM2WT- or PKM2Y105F-expressing cells were seeded in 6-well plates at 1,000 cells/well and maintained in complete growth medium for 10 days. Colonies were fixed with 4% paraformaldehyde and stained with crystal violet. Images of stained colonies were captured using a digital camera.
CSC enrichment
CSCs were isolated from A549 tumors extracted from tumor-bearing mice. Tumors were first minced into small fragments using sterile scissors, and the minced tissue was then digested in a solution comprising 100 mg/mL collagenase type I (Sigma-Aldrich, Cat# C0130, TX, USA), 3 mM CaCl2 (Sigma-Aldrich, Cat# C1016), and 10 mg/mL hyaluronidase (Sigma-Aldrich, Cat# H3506) at 37 °C for 4 h with gentle agitation. Post-digestion, enzymatic activity was halted, and the resulting cell suspension was filtered through a 40 µm cell strainer (Corning, Cat# 431750) to eliminate debris and undigested tissue fragments. The single-cell suspension obtained was further purified and cultured in serum-free DMEM/F12 medium, supplemented with B-27, N2 supplement, and human recombinant epidermal growth factor in ultra-low attachment 6-well plates, to enrich for CSCs, as described before.
Flow cytometry assay
CD133+ and CD44+ cell populations were quantified using flow cytometry (NovoCyte, Agilent Technologies, CA, USA). Cells were detached with trypsin-EDTA (ThermoFisher, MA, USA), washed, and suspended in phosphate-buffered saline (PBS). Anti-CD133-APC (10 μL, Miltenyi Biotec, Cat# 130-113-668, CA, USA) and anti-CD44-PE (10 μL, Miltenyi Biotec, Cat# 130-113-342) antibodies were added to 100 μL of cell suspension. Non-stained cells served as controls. Following incubation in the dark at 4 °C for 15 min and two PBS washes, cells were resuspended in 300 μL of PBS and kept on ice. Data were acquired on a flow cytometer and analyzed using NovoExpress software (version 1.5.0, Agilent Technologies).
Apoptosis assay
Apoptosis was measured after a 24 h exposure to 5 μg/mL cisplatin or 200 ng/mL paclitaxel using the Annexin V-PE/7-AAD Apoptosis Detection Kit (Yeasen Biotechnology). Cells were collected, washed with cold PBS, and centrifuged at 300 g for 5 min. Cells were resuspended in 1× binding buffer to a final density of 1 × 10⁶ cells/mL. Annexin V/PE (5 μL) and 7-AAD (10 μL) were added to 100 μL of cell suspension, incubated in the dark at room temperature for 15 min, and analyzed by flow cytometry (NovoCyte, Agilent Technologies) with data processed using NovoExpress software.
Cytotoxicity assays
Cell viability in response to cisplatin and paclitaxel was assessed using the Cell Counting Kit-8 (Yeasen Biotechnology). Cells were seeded in 96-well plates at 5,000 cells/well and exposed to various drug concentrations for 48 h. Optical density at 450 nm was measured, and IC50 values were calculated by generating dose-response curves.
Liquid chromatography-tandem mass spectrometry (LC-MS/MS)
Proteomic analysis was performed using LC-MS/MS. Cell lysates were prepared in RIPA buffer, protein concentrations were determined using the BCA protein assay, and binding partners of Flag-tagged proteins were immunoprecipitated. Trypsin-digested peptides were analyzed on a Q Exactive HF-X Hybrid Quadrupole-Orbitrap Mass Spectrometer with an Ultimate 3000 RSLCnano System. Data analysis was conducted using Proteome Discoverer 2.4 with SEQUEST HT searching against the Human UniProt database and validated using Percolator at a 1% FDR.
Isolation and characterization of sEVs
Cells were cultured in serum-free DMEM or DMEM/F12 for 72 h. The medium was collected, centrifuged at 2,000 g and 10,000 g for 10 min each, filtered through a 0.45 μm filter (MilliporeSigma, Darmstadt, Germany), and subjected to ultracentrifugation at 120,000 g for 90 min using an Optima XPN-100 centrifuge (Beckman Coulter, CA, USA). The pellet was resuspended in PBS, re-centrifuged, and stored at -80 °C. sEV concentration and size distribution were analyzed using nanoparticle tracking analysis (ZetaView, Particle Metrix, Meerbusch, Germany) and nanoflow cytometry. sEV morphology was assessed using transmission electron microscopy (FEI Tecnai G2 Spirit, OR, USA), and protein markers were evaluated by western blot.
Fluorescence labeling and cellular uptake of sEVs
For in vitro uptake analysis, sEVs were labeled with PKH67 dye (PKH67GL, Sigma-Aldrich, MO, USA) following the manufacturer's instructions. Labeled sEVs were centrifuged to remove excess dye, resuspended in PBS, and added to lung cancer cells plated on coverslips. After 24 h of incubation, cells were fixed, and stained with DAPI (Yeasen Biotechnology, Cat# 40728ES03) to visualize nuclei and phalloidin (Yeasen Biotechnology, Cat# 40762ES75) to stain the cytoskeleton. Imaging was performed using a confocal microscope (TCS-SP8, Leica, Heidelberg, Germany).
For in vivo tracking of sEV uptake by tumors, sEVs were labeled with the lipophilic near-infrared dye Dir (MedchemExpress, Cat# HY-D1048, NJ, USA). Briefly, sEVs were incubated with 1 μM Dir dye at room temperature for 15 min in the dark, followed by ultracentrifugation at 120,000 g for 70 min to remove unbound dye. The labeled sEVs were resuspended in PBS and injected intravenously into tumor-bearing nude mice. After two injections, fluorescence signals were detected using IVIS Spectrum imaging (PerkinElmer, MA, USA) to assess sEV biodistribution and tumor uptake.
Glucose uptake and lactate production assay
Cells were cultured in 12-well plates. After 24 h, the medium was replaced with 500 μL serum-free high-glucose DMEM for 8 h. The conditioned medium was then collected and glucose uptake and lactate production were measured using kits (Sigma-Aldrich, MO, USA, and Jiancheng Bioengineering Institute, Nanjing, China). The results were normalized to the total cell number.
Seahorse assay
Cells were pre-treated with Vec-sEV, PKM2WT-sEV, or PKM2Y105F-sEV for 48 h and seeded in seahorse XF96 microplates at 2 × 10⁴ cells per well and cultured for 24 h. The medium was replaced with seahorse XF base medium (pH 7.4) supplemented with 2 mM glutamine, 25 mM glucose, and 1 mM sodium pyruvate, followed by incubation in a CO₂-free incubator for 1 h. For the mitochondrial stress test, 1.5 μM oligomycin, 1.0 μM FCCP, and 0.5 μM rotenone were sequentially injected to assess basal respiration, ATP production, maximal respiration, and spare respiratory capacity. Oxygen consumption rate (OCR) was recorded using the Seahorse XF96 Analyzer (Agilent Technologies, CA, USA).
RNA-sequencing
Transcriptomic sequencing was performed on A549 cells treated with sEVs derived from A549-PKM2WT and A549-PKM2Y105Fcells. Total RNA was extracted using Trizol (Invitrogen, CA, USA), and quality was assessed using an Agilent 2100 Bioanalyzer. mRNA was enriched, fragmented, and converted into cDNA using the NEBNext Ultra RNA Library Prep Kit, followed by sequencing on an Illumina NovaSeq 6000. For miRNA profiling, sEVs derived from A549-PKM2WT and A549-PKM2Y105Fcells were subjected to small RNA sequencing. RNA was extracted using the miRNeasy Mini Kit (Qiagen, Hilden, Germany), and small RNA libraries were prepared with the NEBNext Multiplex Small RNA Library Prep Set. Libraries were sequenced on an Illumina NovaSeq 6000 platform. Bioinformatic analyses for both datasets, including differential expression and pathway enrichment, were conducted using Omicsmart, a real-time interactive platform for multi-omics analysis.
Cell cycle assay
Cell cycle analysis was performed by fixing cells in 85% ethanol overnight at 4 °C. Cells were washed and resuspended in propidium iodide staining solution (500 μL, BD Biosciences, NJ, USA) for 15 min in the dark. DNA content was measured using flow cytometry (NovoCyte, Agilent Technologies) and analyzed using NovoExpress software.
Immunoprecipitation and immunoblotting
Cell lysates were prepared using RIPA buffer (Epizyme, Shanghai, China). For immunoprecipitation, anti-Flag immunomagnetic beads (Epizyme, Cat# YJ007), anti-TSG101 (Proteintech, Cat# 67381-1, IL, USA), or anti-IQGAP1 (Cell Signaling Technology, Cat# 20648, MA, USA) antibodies were used with Protein A/G beads (Bimake, Cat# B23201, TX, USA). Proteins were separated by SDS-PAGE, transferred to PVDF membranes, and probed with primary antibodies: PKM2 (Cat# 3198S), phospho-PKM2 (Tyr105) (Cat# 3827), and IQGAP1 (Cat# 20648) from Cell Signaling Technology; NANOG (Cat# 14295-1-AP), OCT4 (Cat# 11263-1-AP), SOX2 (Cat# 11064-1-AP), Calnexin (Cat# 10427-2-AP ), CD44 ( Cat#60224-1-Ig), CD133 (Cat# 18470-1-AP), and TSG101 (Cat# 67381-1) from Proteintech; CDK1 (phospho T14 + Y15) (Cat# ab277772) from Abcam (MA, USA); JAK3 (Cat# CY7016) and ITK (Cat# CY6933) from Abways (Shanghai, China); Yes1 (Cat# R26126), Src (Cat# R25792), AXL (Cat# R23576), FAK (Cat# R24277), Cyclin B1 (Cat# R23324), CDK1 (Cat# R23884), and CDC25B (Cat# R381486) from Zen Bioscience (Chengdu, China); β-actin (Cat# AC206) from ABclonal (MA, USA); and FLAG (Cat# LF304) from Epizyme. Detection was performed using HRP-conjugated secondary antibodies and ECL reagent (Yeasen Biotechnology), and visualized with a chemiluminescence detection system (Tanon, Shanghai, China).
Duo-link proximity ligation assay
The interactions between Flag-tagged proteins (PKM2WT or PKM2Y105F) and TSG101 were assessed using the Duolink proximity ligation assay kit (orange, DUO92007, Sigma-Aldrich). Cells were fixed, permeabilized, blocked, and incubated with primary antibodies against Flag-tag and TSG101. Duolink probes were applied, followed by ligation and amplification. DAPI was used for counterstaining, and interactions were imaged using a confocal microscope (LSM 880, Zeiss, Oberkochen, Germany).
Immunofluorescence
A549 cells expressing PKM2WT or PKM2Y105F and transfected with siRNA targeting IQGAP1 or a non-targeting siRNA control (siRNA-NC) were subjected to fixation, permeabilization, and blocking. The cells were incubated with primary antibodies against TSG101 (Proteintech, Cat# 14497-1-AP) and Flag (Epizyme, Cat# LF304), followed by secondary antibody incubation with anti-rabbit IgG conjugated with Alexa Fluor Cy3 (Yeasen Biotechnology, Cat# 33108ES60) and anti-mouse IgG conjugated with Alexa Fluor 647 (Yeasen Biotechnology, Cat# WA3323060). Nuclei were counterstained with DAPI, and fluorescent images were captured using a Leica TCS-SP8 confocal microscope.
Tumor formation and in vivo limiting dilution assays
A549 cells expressing PKM2WT or PKM2Y105F, infected with a luciferase-expressing adenovirus, were used for tumor formation assays. Cells (5 × 10⁶) were subcutaneously injected into 6-8-week-old male Balb/c mice (Shanghai Laboratory Animal Center). For limiting dilution assays, cells at varying concentrations were injected into bilateral flanks of mice, with tumor incidence assessed after three weeks via bioluminescence imaging. Tumorigenic capacity was calculated based on tumor formation frequency. To assess sEV-related tumorigenicity, 6-8-week-old male Balb/c mice were injected with 5 × 10⁶ luciferase-tagged A549 cells. Tumors were allowed to grow to ~100 mm³ before sEV injections (1 × 10⁹ particles) from different cell types were administered tri-weekly adjacent to the tumor site, and tumor volumes were measured. All animal procedures followed ethical guidelines from the Committee on Animal Research Ethics at the Shanghai Chest Hospital.
Bioluminescence imaging of xenograft tumors in mice
Bioluminescence imaging was conducted using an IVIS Spectrum system (PerkinElmer) following intraperitoneal injection of D-luciferin (Yeasen Biotechnology). Mice were anesthetized with isoflurane during the imaging process to minimize movement and ensure consistent image capture. Imaging parameters were optimized to detect luminescence signal intensity.
PET/CT imaging of xenograft tumors in mice
Mice were food-restricted for 6-8 h before PET/CT imaging to ensure optimal glucose uptake. Each mouse received an intravenous injection of 5 MBq of 18F-FDG. 30 min post-injection, mice were anesthetized with isoflurane and positioned in the Siemens Inveon PET/CT system (Siemens Medical Solutions, Erlangen, Germany), and PET/CT scans were performed to assess metabolic activity. PET images were reconstructed using a 3D-ordered subset expectation maximization algorithm, and CT images were used for anatomical reference and attenuation correction. Image analysis was performed using Inveon Research Workplace software (Siemens Medical Solutions).
Immunohistochemical analysis
Xenograft tumor specimens were fixed, paraffin-embedded, and stained with hematoxylin and eosin. For immunohistochemistry, tissues were quenched with 3% H2O2 solution, blocked with 3% bovine serum albumin, and incubated with primary antibodies against PKM2 (Bioss, Cat#bs-0102M), phospho-PKM2 (Tyr105) (Bioss, Cat# bs-3334R,), OCT4 (Proteintech, Cat#, 11263-1-AP,), SOX2 (Proteintech, Cat# 11064-1-AP,), CDC25B (Zen Bioscience, Cat# R381486,), CyclinB1 (Cat# R23324, Zen Bioscience), and CDK1 (Zen Bioscience, Cat# R23884,). Sections were then incubated with HRP-conjugated goat anti-rabbit IgG secondary antibody (Proteintech, Cat# SA00001-2) and HRP-conjugated goat anti-rabbit IgG secondary antibody (Proteintech, Cat# SA00001-1) for 1 h at 37 °C. Signal visualization was performed using DAB substrate (ZSGB-BIO, Cat# ZLI-9018,) with reaction time controlled under microscopic observation. Nuclei were counterstained with hematoxylin, followed by dehydration, clearing, and mounting with neutral resin. Images were captured using a Nikon Eclipse E100 microscope equipped with a CCD camera (Nikon DS-Ri2).
Lung cancer tissues from patients at Shanghai Chest Hospital were used to create microarrays for immunohistochemistry of PKM2 (Bioss, Cat# bs-0102M), phospho-PKM2 (Tyr105) (Bioss, Cat# bs-3334R), CD133 (Abclonal, Cat# A0818), and IQGAP1 (Cell Signaling Technology, Cat# 20648). Immunohistochemistry scores were assessed independently by two pathologists. The proportion of positively stained cells was categorized as follows: 0 for 0-5%, 1 for 5-25%, 2 for 25-50%, and 3 for 50-100%. Staining intensity was graded as 0 (negative), 1 (weak expression), 2 (medium expression) and 3 (strong expression). The final immunohistochemistry score for each sample was determined by multiplying the positive cells rate score by the staining intensity score. An immunohistochemistry score < 6 is considered low expression, while a score > 6 is considered high expression. The ethical framework for the study was reviewed and approved by the Human Ethics Committee of Shanghai Chest Hospital.
Statistical analysis
Data analysis was performed using GraphPad Prism 10 (GraphPad Software, Inc., USA) and SPSS 20.0 (SPSS, Inc., Chicago, IL). Data are expressed as mean ± SD. Student's t-test was used for analyzing data from colony and sphere formation assays. One-way ANOVA was used for independent variables with more than two group and followed by Tukey's post hoc test, as appropriate. Two-way ANOVA was used for tumor growth curves, followed by Bonferroni post hoc test. Statistical significance was defined as p < 0.05.
Results
CSC-derived sEVs drive stemness propagation and maintain the CSC pool
To identify the primary contributors to tumor drug resistance, we compared the stemness properties of A549 cisplatin-resistant cells (A549CR) with their chemosensitive counterparts. A549CR cells exhibited significantly enhanced stemness traits, as shown by increased clonogenic survival and sphere formation compared to chemosensitive A549 cells (Figure S1A-C). We enriched the CSC population through sphere culture from A549 and H1299 tumor-bearing mice and verified the enrichment using western blotting and flow cytometry to detect stem cell transcription factors (NANOG, OCT4, SOX2) and CSC surface markers (CD44, CD133) (Figure 1A-C, Figure S1D-F).
Characterization of CSCs and their sEVs. (A) Schematic representation of the workflow for CSC enrichment, characterization, and proteomic analysis. Tumor-bearing mice were used to generate single-cell suspensions, followed by sphere culture to enrich CSCs. Enriched CSCs were used for subsequent stemness characterization and drug resistance comparison. Proteomic profiling was conducted via LC-MS. (B) Flow cytometry analysis of CD44 and CD133 expression in A549, A549CR, and CSC-enriched populations. (C) Quantification of CD44- and CD133-positive cells across different populations. Data are presented as mean ± SD (*p < 0.05, ***p < 0.001, n = 3). Comparisons between groups were analyzed using one-way ANOVA, followed by Tukey's post-hoc test. (D) Dose-response curves for cisplatin and paclitaxel treatment in A549, A549CR, and CSCs. Data are presented as mean ± SD (n = 3). (E) GO enrichment analysis of proteins identified from proteomic profiling, focusing on extracellular vesicle-related pathways. (F) Diagram showing the isolation of sEVs from different cell populations and their subsequent co-culture with A549 cells for functional characterization. (G) SEM images of sEVs derived from A549, A549CR, and CSCs. Scale bar: 200 nm. (H) NTA of sEVs from A549, A549CR, and CSCs showing size distribution. (I) Confocal microscopy images of A549 cells incubated with PKH67-labeled sEVs showing sEV uptake. Nuclei are stained with DAPI (blue), cytoskeletons with phalloidin (red), and sEVs with PKH67 (green). Scale bar: 20 µm. (J) Western blot analysis of stem cell markers in A549 cells after incubation with sEVs from different origins. (K) Flow cytometry analysis of CD44 and CD133 expression in A549 cells treated with sEVs. (L) Quantification of cells positive for CD44 and CD133 after treatment with sEVs from different sources. Data are presented as mean ± SD (ns: not significant, *p < 0.05, ***p < 0.001, n = 3).
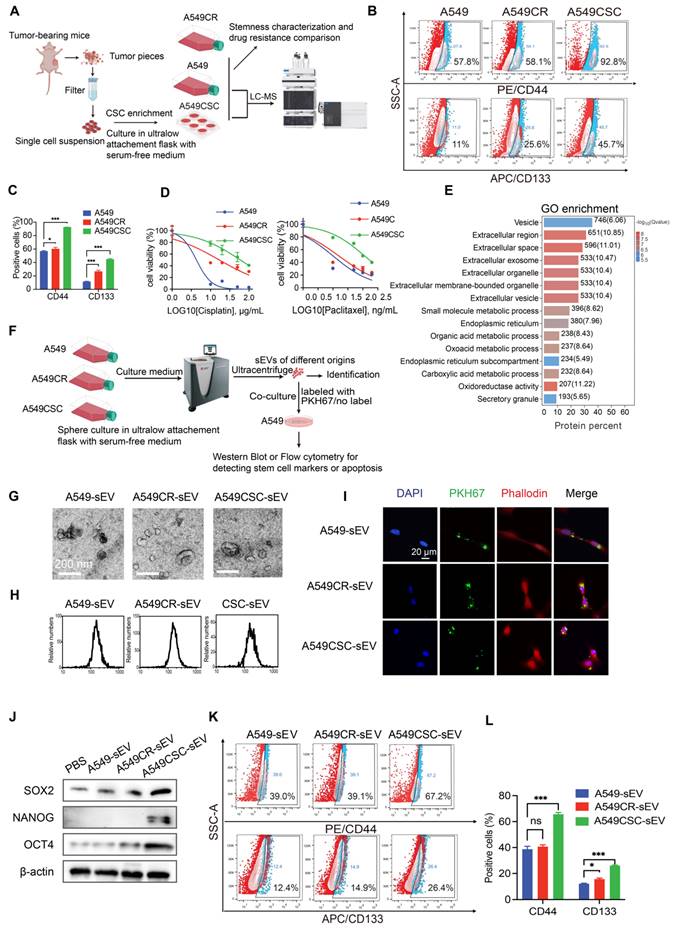
Next, we evaluated the drug resistance profiles of these cell populations. Upon exposure to cisplatin and paclitaxel, CSCs exhibited marked resistance, retaining high cell viability and displaying minimal apoptotic activity compared to their chemosensitive counterparts (Figure S1G-J). The IC50 values for cisplatin were 4.3 µg/mL (A549), 17 µg/mL (A549CR), 60 µg/mL (A549-CSCs), 1.328 µg/mL (H1299), and 12.21 µg/mL (H1299-CSC). Similarly, the IC50 values for paclitaxel were 10.93 ng/mL, 15.93 ng/mL, 42.98 ng/mL, 53.04 ng/mL, and 3740 ng/mL, respectively (Figure 1D, Figure S1I-J).
To investigate the mechanisms underlying CSC resistance, we conducted comparative proteomic profiling of A549-sensitive cells and CSCs using liquid chromatography-mass spectrometry (Figure 1A). Of the 6,761 proteins identified and quantified, 1,003 were upregulated and 1,173 were downregulated in CSCs (Figure S1K). Gene Ontology (GO) enrichment analysis revealed upregulation of extracellular vesicle-related pathways in CSCs, suggesting a role for CSC-derived sEVs in stemness propagation (Figure 1E). To further explore this hypothesis, we isolated and characterized sEVs from A549, A549CR, and A549 CSC culture media (Figure 1F). Scanning electron microscopy confirmed the characteristic cup-shaped morphology of sEVs (Figure 1G). Nanoparticle tracking analysis and nanoflow cytometry demonstrated that sEVs consistently fell within the typical size range of 30-200 nm (Figure 1H and Figure S1L). Western blotting confirmed the enrichment of sEV markers (CD63, CD81) and the absence of contamination markers (GRP94, Calnexin), validating the purity of isolated sEVs (Figure S1M).
To assess the functional effects of sEVs, we labeled them with the green fluorescent dye PKH67 and observed their uptake by A549 cells (Figure 1I). Notably, cells treated with CSC-derived sEVs exhibited increased expression of stemness markers (OCT4, NANOG, SOX2) compared to those treated with sEVs from A549 or A549CR cells (Figure 1J). Flow cytometry confirmed higher expression of CD44 and CD133 and reduced apoptosis when exposed to chemotherapy in CSC-sEV-treated cells (Figure 1K-L, Figure S1N-O). Further analysis excluded the possibility that sEVs carried CD44 and CD133 directly, as no differences were detected in the protein levels within the sEVs themselves; however, significant variations were observed in the expression of these proteins in recipient cells treated with sEVs from different sources (Figure S1P).
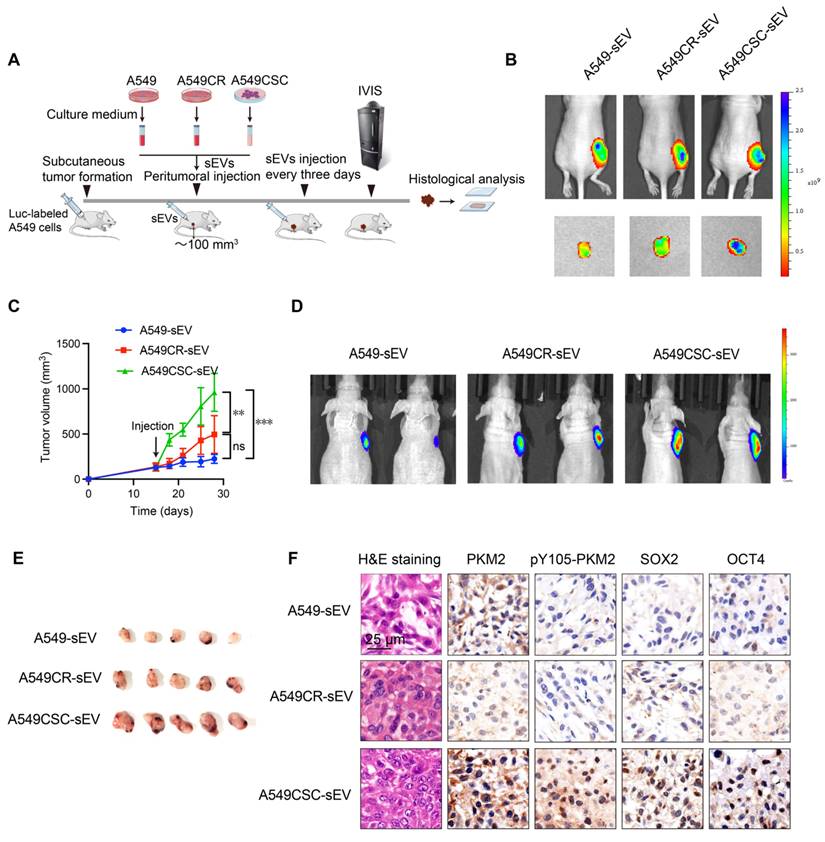
Consistent with these in vitro results, in vivo experiments demonstrated that sEVs can propagate stemness in the tumor microenvironment. A549 cells implanted subcutaneously in nude mice were treated with sEVs from various cellular sources (Figure 2A). To confirm sEV uptake by tumors, we labeled sEVs with the lipophilic near-infrared dye Dir and detected fluorescence signals in tumor-bearing mice via IVIS imaging after two injections (Figure 2B). Tumors treated with CSC-derived sEVs exhibited accelerated growth, as demonstrated by tumor growth curves and confirmed via in vivo and ex vivo imaging (Figure 2C-E). Immunohistochemical analysis of harvested tumors revealed elevated levels of stemness markers (OCT4, SOX2) in CSC-sEV-treated groups (Figure 2F).
In vivo effects of sEVs on tumor growth and stemness. (A) Schematic diagram of the in vivo experimental design. A549 cells were injected subcutaneously into nude mice to establish tumors. sEVs derived from A549, A549CR, and A549CSC were injected peritumorally every three days. Tumor growth was monitored using IVIS imaging, and histological analyses were performed post-harvest. (B) Representative IVIS imaging showing fluorescence signals in tumors treated with Dir-labeled sEVs from different origins. The images include in vivo and ex vivo fluorescence signals after sEV injection. (C) Tumor growth curves showing tumor volume changes over time in mice treated with sEVs from different sources. Data are presented as mean ± SD (ns: not significant, **p < 0.01, ***p < 0.001, n = 5). Comparisons between groups were analyzed using one-way ANOVA followed by Tukey's post-hoc test. (D) Representative IVIS images showing in vivo bioluminescent signal intensity in tumor-bearing mice treated with sEVs derived from A549, A549CR, or A549CSC. (E) Representative images of harvested tumors from each group after treatment with sEVs. (F) Histological and immunohistochemical analyses of tumors. H&E staining shows tumor morphology, while immunohistochemical staining shows PKM2, pY105-PKM2, SOX2, and OCT4. Scale bar: 25 µm.
These findings collectively indicate that CSC-derived sEVs promote the dissemination of stemness traits, which replenish the CSC pool and may explain the persistence of stemness even after the original CSC population is depleted.
Phosphorylation of PKM2 at Y105 is associated with stemness features and predicts poor clinical outcomes in NSCLC
Proteomic analysis of A549 chemosensitive cells and CSCs revealed significant enrichment of the pyruvate metabolic pathway and marked upregulation of PKM protein in CSCs (Figure 3A-B). Considering PKM2's pivotal role in cancer metabolism, we focused on its post-translational modifications, specifically phosphorylation at Y105, which influences its dimeric/monomeric state and oncogenic functions [29]. Our results showed that PKM2 is upregulated in CSCs and predominantly exists in dimer/monomer forms following crosslinking in A549 and H1299 cells (Figure 3C and Figure S2A). Notably, phosphorylation of PKM2 at the Y105 site promotes its dimer/monomer configuration, a state associated with enhanced glycolytic activity and tumorigenic potential [30]. Western blot analysis confirmed enhanced phosphorylation of PKM2 at Y105 in CSCs compared to chemosensitive cells (Figure 3C).
Analysis of PKM2 and its phosphorylation in NSCLC cells and tissues. (A) KEGG pathway enrichment analysis of differentially expressed proteins in A549 chemosensitive cells and CSCs. (B) Heatmap depicting proteomic analysis of A549 chemosensitive cells and CSCs. (C) Western blot analysis of PKM2 and pY105-PKM2 in A549, A549CR, and CSCs, with or without TEPP-46 treatment. Crosslinking experiments show PKM2 configurations, and immunoprecipitation (IP) indicates phosphorylation at Y105. (D) Western blot analysis of selected kinases (YES1, Src, JAK3, FAK, ITK, AXL) in A549, A549CR, and CSCs. (E) Representative immunohistochemical staining of PKM2 and pY105-PKM2 in tumor and peritumoral tissues. Scale bars: 50 µm. (F) Box plots showing IHC scores of PKM2 and pY105-PKM2 in tumor and peritumoral tissues. (G) Kaplan-Meier survival curves comparing overall survival (OS) of NSCLC patients based on PKM2 and pY105-PKM2 expression levels. (H) Representative immunohistochemistry staining of CD133 in tumor and peritumoral tissues. Scale bars: 50 µm. (I) Scatter plots showing the relationship between CD133 expression and PKM2 or pY105-PKM2 in tumor tissues.
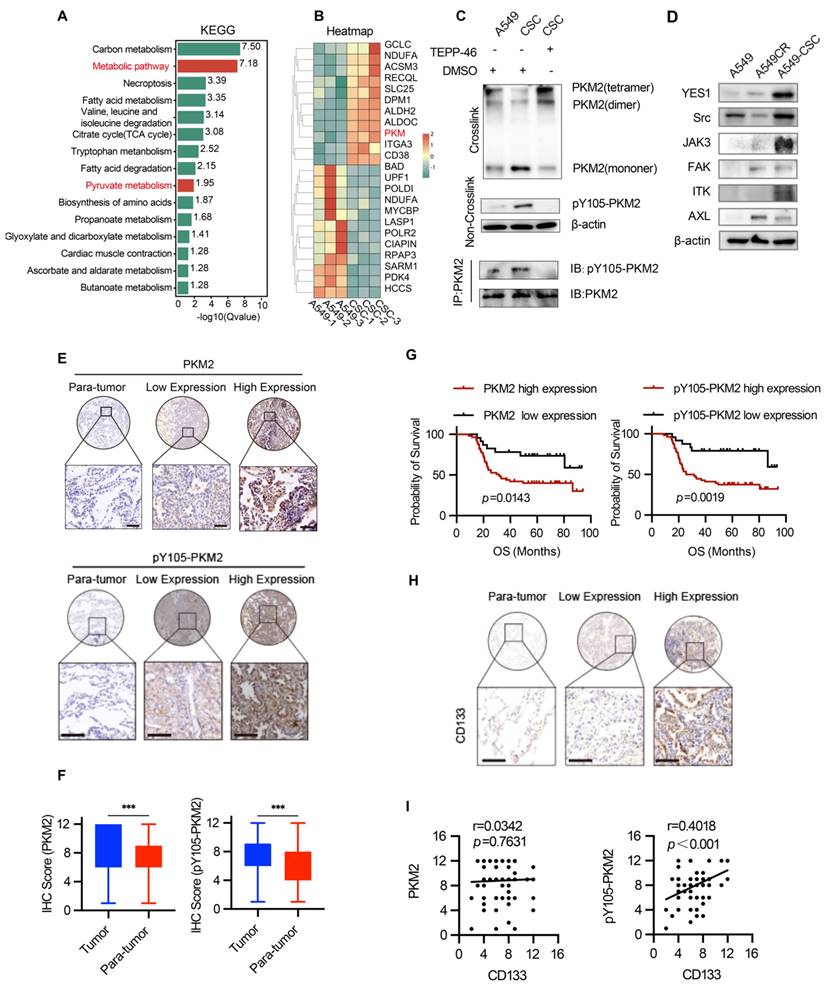
To further investigate the functional implications of PKM2 phosphorylation, we utilized TEPP-46, an allosteric activator that stabilizes PKM2 in its tetrameric form and inhibits its dimeric configuration [31]. Treatment with TEPP-46 reduced the dimeric form of PKM2 while increasing pY105-PKM2 levels, suggesting a feedback mechanism that maintains PKM2 phosphorylation in CSCs (Figure 3C). PKM2 immunoprecipitation of the samples in Figure 3C confirmed the specificity of Y105 phosphorylation. After normalizing PKM2 levels, we observed a significant increase in Y105 phosphorylation in CSCs, which was attenuated by TEPP-46 treatment, further supporting the role of PKM2 phosphorylation in CSC biology (Figure 3C). In the animal experiments described earlier (Figure 2A), we found that treatment of A549 tumors with CSC-derived sEVs significantly increased PKM2 levels, particularly the phosphorylation of PKM2 at Y105, compared to tumors treated with sEVs from A549 or A549CR cells (Figure 2F). This suggests that CSC-derived sEVs carry regulatory factors that modulate PKM2 phosphorylation in recipient cells, thereby promoting stemness traits. We hypothesized that the elevated pY105-PKM2 levels in CSCs result from aberrant activation of oncogenic tyrosine kinases. Previous studies have shown that YES1, Src, JAK3, FAK, ITK, and AXL can induce PKM2 phosphorylation at Y105 [28]. Consistent with this, our western blot analysis revealed increased expression of these six proteins in CSCs compared to chemosensitive cells (Figure 3D). Similar results were observed in H1299 cells, indicating a conserved mechanism across different NSCLC models (Figure S2B).
To validate our findings clinically, we analyzed tumor and peritumoral tissue samples from 80 NSCLC patients. Tissue microarrays were constructed, and immunohistochemical staining was performed for PKM2, pY105-PKM2, and the stemness marker CD133. Statistical analysis revealed that tumor tissues exhibited significantly higher levels of PKM2 and pY105-PKM2 than adjacent non-tumorous tissues (Figure 3E-F). Elevated pY105-PKM2 levels were strongly associated with lymph node metastasis, chemotherapy recurrence, and advanced TNM stage (Table S1 and Table S2). Notably, pY105-PKM2 emerged as a robust predictor of reduced overall survival, displaying a stronger correlation with poor overall survival outcomes than total PKM2 (p = 0.0019 and p = 0.0143, respectively) (Figure 3G). Importantly, only pY105-PKM2 expression, not total PKM2, was associated with the presence of the stemness marker CD133 (Figure 3H-I). These findings highlight the critical role of pY105-PKM2 in promoting stemness traits and influencing NSCLC patient prognosis.
In summary, these results demonstrate that PKM2 phosphorylation at Y105 is a key regulator of stemness in NSCLC. The elevated levels of pY105-PKM2 in CSCs, its association with stemness markers, and its strong correlation with poor clinical outcomes underscore its potential as a therapeutic target and prognostic biomarker.
Phosphorylated PKM2 facilitates the acquisition of CSC-like phenotypes in NSCLC cells in vitro and in vivo
To determine whether pY105-PKM2 drives stemness in lung cancer cells, we genetically modified A549 and H1299 cells to stably overexpress either wild-type PKM2 (PKM2WT) or its non-phosphorylatable mutant, PKM2Y105F, where tyrosine at position 105 was replaced with phenylalanine. First, endogenous PKM2 was ablated using CRISPR-Cas9 gene editing, as shown in Figure 4A and Figure S3A. Subsequently, plasmids encoding PKM2WT or PKM2Y105F were introduced into PKM2-knockout cells via lentiviral transduction (Figure 4B). Stable cell lines overexpressing PKM2WT or PKM2Y105F were established through puromycin selection and validated by western blotting (Figure 4C and Figure S3B).
Generation and characterization of PKM2WT and PKM2Y105F cell lines and their impact on NSCLC stemness and tumorigenicity. (A) Schematic of CRISPR-Cas9-based PKM2 knockout in A549 cells followed by lentiviral transduction of PKM2WT or PKM2Y105F plasmids and western blot validation of PKM2 knockout.(B) Workflow of lentiviral packaging, transduction, and selection of PKM2WT and PKM2Y105F stable cell lines. (C) Western blot analysis showing expression of PKM2 and pY105-PKM2 in PKM2WT and PKM2Y105F cell lines. (D) Western blot analysis of stemness markers (OCT4, SOX2, and NANOG) in PKM2WT and PKM2Y105F cell lines. (E) Cell viability assays of PKM2WT and PKM2Y105F cells following cisplatin treatment. Data are presented as mean ± SD (ns: not significant, *p < 0.05, ** p < 0.01, n = 3). (F) Colony formation assay of PKM2WT and PKM2Y105F cells. Representative images and quantified colony numbers are shown. Data are presented as mean ± SD (**p < 0.01, n = 3). (G) Sphere formation assay of PKM2WT and PKM2Y105F cells. Representative images and quantified sphere numbers are shown. Data are presented as mean ± SD (**p < 0.01, n = 3). (H) Representative images of harvested subcutaneous xenograft tumors derived from PKM2WT and PKM2Y105F cells. (I) Tumor growth curves showing tumor volume over time for PKM2WT and PKM2Y105F xenografts. Data are presented as mean ± SD (**p < 0.01, n = 6). (J) Limiting dilution assay using bioluminescence imaging of subcutaneous xenografts with decreasing cell numbers (1×10⁶ to 5×10³) of PKM2WT and PKM2Y105F cells. (K) Immunohistochemical analysis of xenograft tumors showing H&E staining, PKM2, pY105-PKM2, and stemness markers (OCT4, SOX2). Scale bar = 25 μm.
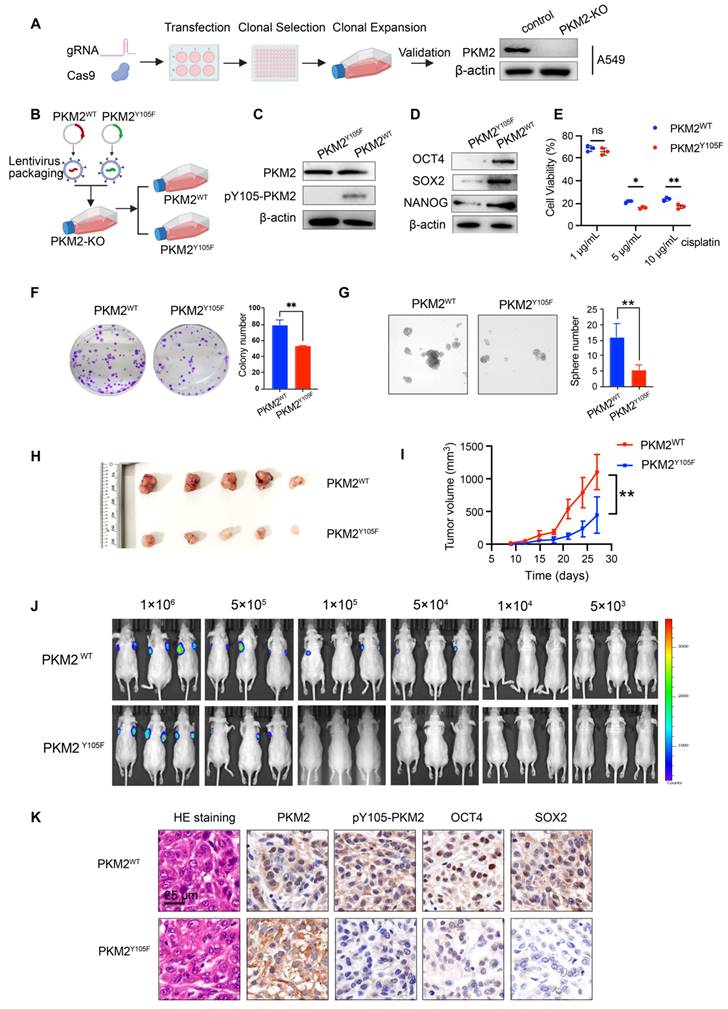
To assess the impact of PKM2 phosphorylation status on chemoresistance, we performed cell viability assays following cisplatin treatment. Cells expressing PKM2WT exhibited significantly higher drug resistance than those expressing PKM2Y105F (Figure 4E and Figure S3C). Stemness properties were evaluated using colony formation assay, spheroid formation assay, and western blotting for stemness markers (OCT4, SOX2, and NANOG) (Figure 4D-G and Figure S3D-F). Cells expressing PKM2Y105F showed a marked reduction in stemness traits compared to PKM2WT-expressing cells, indicating that phosphorylation at Y105 is critical for maintaining stemness.
We used subcutaneous xenograft models for in vivo validation. PKM2WT-expressing cells demonstrated enhanced tumorigenicity, as evidenced by increased tumor volume (Figure 4H-I). To further assess stemness in vivo, we conducted a limiting dilution assay—the gold standard for stemness evaluation—by subcutaneously inoculating varying numbers of cells and assessed tumor formation after three weeks. In vivo bioluminescence imaging and statistical analysis revealed that 1×10⁵ and 5×10⁴ PKM2Y105F cells exhibited a significantly reduced ability to initiate tumors compared to PKM2WT cells (Figure 4J and Figure S3G). Immunohistochemical analysis of xenograft tumors showed elevated expression of OCT4 and SOX2 in tumors derived from PKM2WT-expressing cells, further supporting the role of pY105-PKM2 in promoting stemness (Figure 4K).
Collectively, these findings show that pY105-PKM2 is a critical regulator of stem-like properties in NSCLC, driving increased expression of stemness markers, enhanced tumorigenicity, and chemoresistance in vitro and in vivo.
sEV-mediated pY105-PKM2 induces slow cell cycle, metabolic remodeling, and promotes chemoresistance and stemness in NSCLC
Our previous studies demonstrated that drug resistance can be transferred via sEVs carrying PKM2 from drug-resistant cells to chemosensitive cells [27]. Building on these findings, we hypothesized that the phosphorylated form of PKM2 at tyrosine 105 (pY105-PKM2), a known driver of tumor stemness, could contribute to the transmission of stem-like traits via sEVs, thereby replenishing the CSC pool. To test this hypothesis, we isolated sEVs from A549 cells overexpressing either wild-type PKM2 (A549-PKM2WT), the Y105F mutant variant (A549-PKM2Y105F), or control cells. These sEVs were incubated with chemosensitive A549 cells for 48 h (Figure S3H). Flow cytometry revealed increased CD44 and CD133 expression in cells treated with A549-PKM2WT sEVs (Figure S3I-J). These results indicate that PKM2WT-derived sEVs promote the acquisition of stem-like properties in recipient cells.
To assess the influence of sEVs on chemoresistance, we incubated A549 cells with sEVs derived from A549-PKM2WT, A549-PKM2Y105F, or control cells for 48 h, followed by treatment with cisplatin or paclitaxel for an additional 24 h (Figure S3K). Cell viability assays demonstrated that cells treated with A549-PKM2WT-derived sEVs displayed significantly higher survival rates than those treated with sEVs from A549-PKM2Y105F or control cells, indicating enhanced chemoresistance (Figure S3K). Consistent with these findings, flow cytometry analysis showed that apoptosis levels were significantly reduced in A549 cells exposed to A549-PKM2WT-derived sEVs compared to those treated with A549-PKM2Y105F or control sEVs (Figure S3L-M).
Collectively, these results highlight the role of sEV-mediated delivery of pY105-PKM2 in promoting chemotherapeutic resilience in recipient cells.
To investigate the molecular mechanisms underlying these effects, we performed transcriptomic sequencing on A549 cells treated with sEVs from A549-PKM2WT and A549-PKM2Y105F (Figure 5A). Of the 629 genes differentially expressed between the two treatment groups, 196 genes were upregulated and 433 were downregulated in the A549-PKM2WT sEV group (Figure S4A-B; fold-change ≥ 2, adjusted p ≤ 0.01). A heatmap of representative genes revealed alterations in biological processes critical for cell cycle regulation, vesicular transport, protein biosynthesis, and post-translational modifications (Figure S4C). GO and KEGG pathway analyses highlighted significant enrichment in cellular metabolic processes, protein metabolic processes, pyruvate metabolism, and cell cycle regulation (Figure S4D-E). Gene Set Enrichment Analysis (GSEA) further demonstrated a positive enrichment of pyruvate metabolism in the A549-PKM2WT sEV treatment group, suggesting enhanced metabolic activity in this condition. Conversely, cell cycle-related pathways, including G1/S phase transition and cell cycle checkpoint, showed a negative enrichment in the A549-PKM2Y105F sEV treatment group, indicating disrupted cell cycle progression (Figure S4F). Reactome pathway analysis reinforced these findings, showing that pathways associated with APC/C-CDC20-mediated regulation of the cell cycle were prominently altered (Figure S5G).
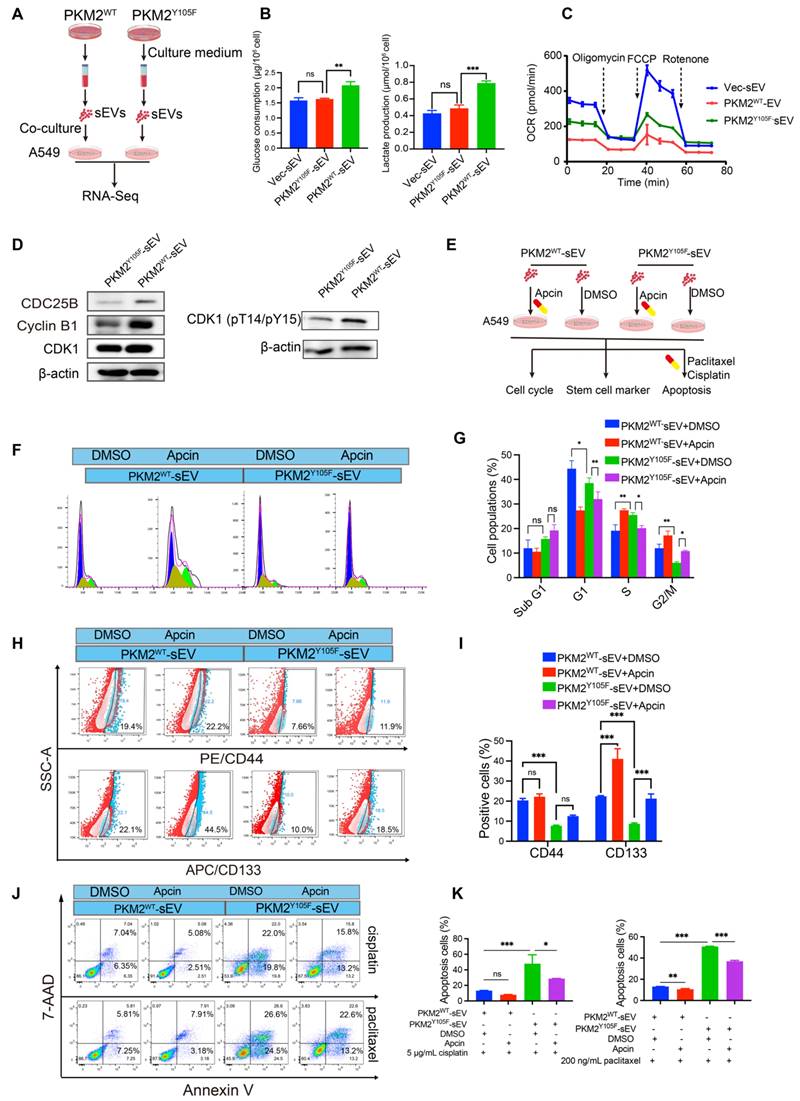
sEV-mediated pY105-PKM2 induces slow cell cycle, metabolic remodeling, and promotes chemoresistance and stemness in NSCLC. (A) Schematic representation of the experimental setup. A549 cells were treated with sEVs derived from A549-PKM2WT and A549-PKM2Y105F cells, followed by transcriptomic sequencing. (B) Glucose consumption and lactate production in A549 cells treated with Vec-sEV, PKM2^WT-sEV, or PKM2^Y105F-sEV. Data are presented as mean ± SD (ns, not significant, **p < 0.01, ***p < 0.001, n = 3). (C) OCR of A549 cells treated with Vec-sEV, PKM2WT-sEV, or PKM2Y105F-sEV under sequential injections of oligomycin, FCCP, and rotenone. (D) Western blot analysis of Cyclin B1, CDC25B, total CDK1, and CDK1 phosphorylated at Thr14 and Tyr15 in A549 cells treated with PKM2WT-sEV or PKM2Y105F-sEV. (E) Schematic representation of Apcin treatment experiments designed to assess the role of APC/CDC20 in sEV-induced cell cycle regulation, stemness, and chemoresistance. (F) Flow cytometry analysis of cell cycle distribution in A549 cells treated with PKM2WT-sEV or PKM2Y105F-sEV, with or without Apcin treatment. (G) Quantification of cell populations in different phases of the cell cycle (Sub G1, G1, S, G2/M) based on flow cytometry analysis. Data are presented as mean ± SD (ns, not significant, *p < 0.05, **p < 0.01, n = 3). (H) Flow cytometry analysis of CD44 and CD133 expression in A549 cells treated with PKM2WT-sEV or PKM2Y105F-sEV, with or without Apcin treatment. (I) Quantification of CD44- and CD133-positive cells in A549 cells treated as described in Panel H. Data are presented as mean ± SD (ns, not significant, ***p < 0.001, n = 3). (J) Flow cytometry analysis of apoptotic cells in A549 cells treated with sEVs, followed by cisplatin or paclitaxel treatment, with or without Apcin. (K) Quantification of apoptotic cells in A549 cells treated as described in Panel J. Data are presented as mean ± SD (ns, not significant, *p < 0.05, **p < 0.01, ***p < 0.001, n = 3).
To investigate whether RNA enclosed in sEVs contributes to cell cycle regulation in recipient cells, we performed miRNA sequencing on sEVs derived from A549-PKM2WT and A549-PKM2Y105F cells, given that miRNAs are the primary regulatory RNAs in EVs. A total of 62 sEV-associated miRNAs were identified with significant differences (Figure S5A-B). KEGG (Figure S5C) and Reactome (Figure S5D) analyses of their target genes revealed enrichment in GPCR signaling and SUMOylation regulation rather than direct involvement in cell cycle control. Therefore, we propose that sEVs mediate APC/C-dependent cell cycle regulation in recipient cells predominantly through the delivery of Y105-phosphorylated PKM2.
A549-PKM2WT sEV treatment enhanced glycolysis, as demonstrated by increased glucose consumption and lactate production accompanied by weakened mitochondrial oxidative phosphorylation (Figure 5B-C). Inhibition of APC/CDC20 activity is known to impede the degradation of its substrates, delay the mitosis-to-G1 phase transition, and thereby induce slower cell cycle progression, ultimately contributing to chemotherapeutic resistance [32-34]. Western blot analysis following A549-PKM2WT sEV treatment showed upregulated Cyclin B1, a known substrate of APC/CDC20 [34], suggesting inhibition of APC/CDC20 activity (Figure 5D). Although total CDK1 levels remained unchanged, an increase in CDK1 Thr14 and Tyr15 phosphorylation was observed in A549 cells treated with A549-PKM2WT sEVs, with the upregulation of CDC25B further supporting CDK1 activity (Figure 5D). CDC25A/B-mediated dephosphorylation of CDK1 at Thr14 and Tyr15 is critical for CDK1 activation and the initiation of mitosis [35]. Notably, flow cytometry analysis revealed that A549-PKM2WT sEV treatment induced a slower cell cycle progression, characterized by a reduction in the proportion of mitotically active cells (G2/M phase), compared to cells treated with A549-PKM2Y105F sEVs (Figure 5E-G).
These findings collectively indicate that the uptake of A549-PKM2WT-derived sEVs by recipient cells modulates the expression of cell cycle proteins at the transcriptional level, driving these cells into a slower cell cycle phase.
To determine whether the slow cell cycle induced by A549-PKM2WT sEVs contributes to enhanced resistance and stemness in recipient cells, we treated chemosensitive A549 cells with sEVs from different sources, followed by Apcin, a small-molecule inhibitor of APC/CDC20 activity (Figure 5E). Apcin treatment resulted in a prolonged G2/M phase in cells treated with A549-PKM2Y105F-derived sEVs, leading to slower cell cycle progression (Figure 5F-G) and enhanced stemness and chemoresistance in recipient cells (Figure 5H-K) - effects similar to those observed with A549-PKM2WT sEV treatment. These results suggest that inhibiting the APC/CDC20 pathway by A549-PKM2WT sEVs drives enhanced chemoresistance and stemness in recipient cells.
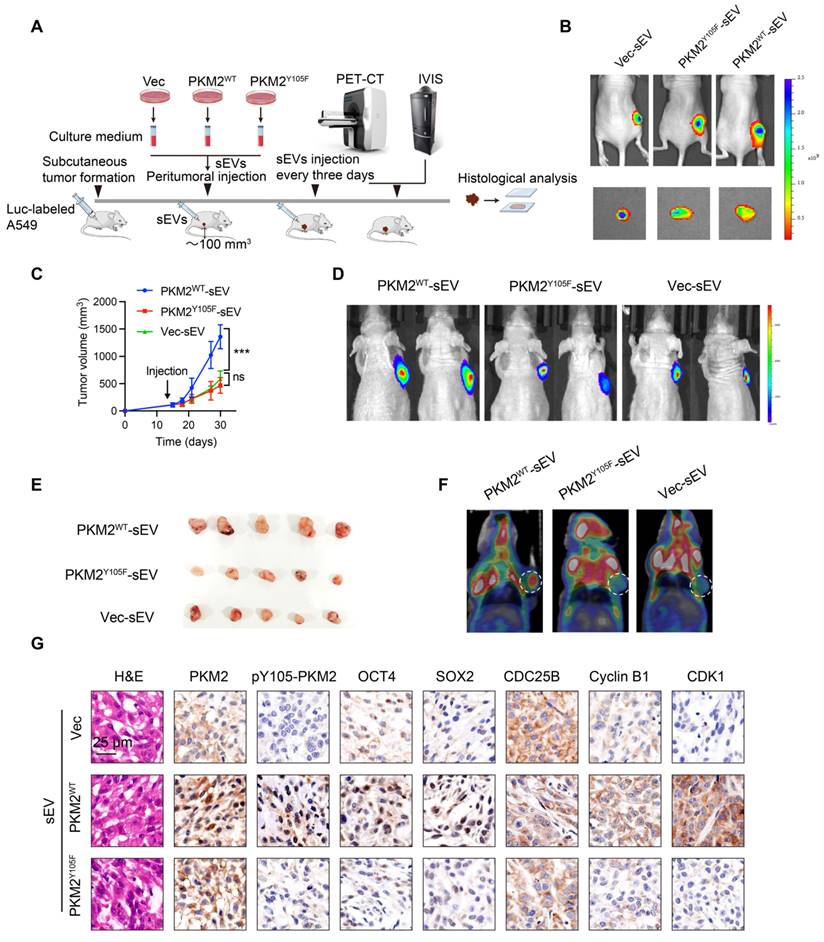
In complementary in vivo experiments, we subcutaneously implanted chemosensitive A549 cells into nude mice and administered sEVs from different sources when tumors reached ~100 mm³ (Figure 6A). Tumors treated with A549-PKM2WT-derived sEVs exhibited enhanced stemness, as evidenced by increased tumor volume compared to tumors treated with A549-PKM2Y105F sEVs (Figure 6B—E). Additionally, ¹⁸F-FDG PET-CT scans revealed elevated glycolytic metabolism in tumors treated with A549-PKM2WT sEVs (Figure 6F). Immunohistochemistry analysis further demonstrated increased expression of the stemness markers OCT4 and SOX2 along with the accumulation of Cyclin B1, CDC25B, and CDK1 (Figure 6G).
In vivo assessment of the effects of sEVs derived from PKM2WT and PKM2Y105F cells on tumor growth, glycolytic activity, and stemness. (A) Schematic representation of the in vivo experimental design. Chemosensitive A549 cells were subcutaneously implanted into nude mice, and upon tumor volumes reaching ~100 mm³, sEVs derived from Vec, PKM2WT, or PKM2Y105F cells were administered peritumorally every three days. Tumor growth was monitored, followed by ¹⁸F-FDG PET-CT and IVIS imaging and histological analysis of harvested tumors. (B) Representative IVIS imaging showing fluorescence signals in tumors treated with Dir-labeled sEVs from different origins. The images include in vivo and ex vivo fluorescence signals after sEV injection. (C) Tumor growth curves depicting tumor volumes over time in mice treated with different sEVs. Data are presented as mean ± SD (ns, not significant, ***p < 0.001, n = 5). (D) Representative IVIS images showing bioluminescent signals from subcutaneous tumors at the experimental endpoint in mice treated with Vec-sEV, PKM2WT-sEV, or PKM2Y105F-sEV. (E) Images of harvested tumors from mice treated with different sEVs. (F) Representative ¹⁸F-FDG PET-CT scans showing glycolytic activity in tumors treated with different sEVs. (G) Histological analysis of tumor tissues, including hematoxylin and eosin (HE) staining and immunohistochemistry for PKM2, pY105-PKM2, stemness markers OCT4 and SOX2, and cell cycle regulators CDC25B, Cyclin B1, and CDK1. Scale bar: 25 µm.
Taken together, these results indicate that A549-PKM2WT-derived sEVs promote metabolic reprogramming and modulate the expression of cell cycle-related genes in recipient tumor cells, facilitating their survival under chemotherapeutic stress and expanding the stem cell pool.
IQGAP1 serves as an adaptor which bridges phosphorylated PKM2 to TSG101
We further investigated the mechanisms underlying the selective incorporation of pY105-PKM2 into sEVs. Flag-PKM2WT and Flag-PKM2Y105F proteins and their binding partners were immunoprecipitated using Anti-Flag beads. LC-MS/MS analysis of these complexes identified 335 proteins interacting with PKM2WT and PKM2Y105F, of which 79 were exclusive to PKM2Y105F and 85 to PKM2WT (Figure 7A). Secondary mass spectrometry revealed that IQGAP1 binds exclusively to the phosphorylatable form of PKM2 (Figure 7B).
IQGAP1 links phosphorylated PKM2 to TSG101. (A) Experimental workflow for immunoprecipitation and mass spectrometry analysis. Flag-tagged PKM2WT and PKM2Y105F proteins were immunoprecipitated using anti-Flag magnetic beads, followed by liquid chromatography-mass spectrometry. The Venn diagram illustrates the overlap and unique binding partners of PKM2WT and PKM2Y105F. (B) Mass spectrometry results highlighting the binding of IQGAP1 exclusively to PKM2WT. (C) Co-immunoprecipitation of IQGAP1, pY105-PKM2, and TSG101 in A549-PKM2WT and A549- PKM2Y105F cells. Total protein input is shown for comparison. (D) Immunoprecipitation analysis of interactions between IQGAP1, TSG101, and PKM2 in A549- PKM2WT and A549- PKM2Y105F cells. (E) Co-immunoprecipitation results following siRNA-mediated knockdown of IQGAP1 in A549-PKM2WT and A549-PKM2Y105F cells. (F) Total protein input levels of IQGAP1, TSG101, and PKM2 in A549- PKM2WT and A549- PKM2Y105F cells, with or without IQGAP1 knockdown. (G) Immunoprecipitation analysis showing the effect of TEPP-46 treatment on interactions between IQGAP1, PKM2, and TSG101 in A549- PKM2WT and A549- PKM2Y105F cells. (H) DuoLink proximity ligation assay detecting interactions between PKM2 and TSG101. Signals (yellow) are shown in A549- PKM2WT and A549- PKM2Y105F cells, with and without IQGAP1 knockdown. DAPI (blue) marks nuclei, and phalloidin (red) labels actin filaments. Scale bar: 10 µm. (I) Immunofluorescence analysis showing colocalization of Flag-tagged PKM2WT and PKM2Y105F with TSG101 in A549 cells, with and without IQGAP1 knockdown. Scale bar: 10 µm.
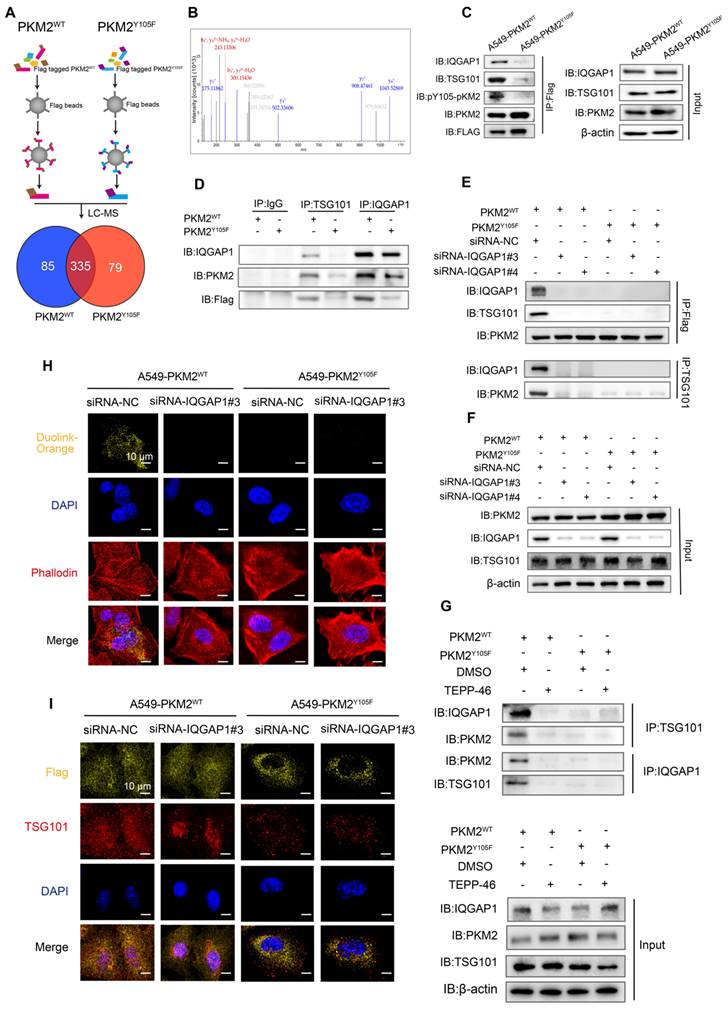
Previous research has shown that IQGAP1 mediates ESCRT-dependent cargo activation and loading of proteins, such as TSG101, into sEVs [36]. We hypothesized that IQGAP1 serves as an adaptor linking pY105-PKM2 to TSG101. Immunoprecipitation assays confirmed that IQGAP1, pY105-PKM2, and TSG101 were pulled down together in A549-PKM2WT cells but not in A549-PKM2Y105F cells with mutated tyrosine 105 (Figure 7C and Figure S6A-B). IQGAP1 also co-immunoprecipitated with pY105-PKM2 and TSG101 in A549-PKM2WT cells but not in A549-PKM2Y105F cells (Figure 7D). Additionally, TSG101 pulled down IQGAP1 and pY105-PKM2 only in PKM2WT cells (Figure 7D).
Gene silencing experiments with siRNA targeting IQGAP1 (siRNA-IQGAP1#3 and siRNA-IQGAP1#4) further revealed that the interaction between PKM2WT and TSG101 was disrupted upon IQGAP1 knockdown (Figure S6C, Figure 7E-F). However, this knockdown had no effect on PKM2Y105F-TSG101 binding (Figure 7E-F). Similarly, TEPP-46 treatment, which stabilizes PKM2 in its tetrameric form and inhibits Y105 phosphorylation, disrupted the interaction between PKM2WT, IQGAP1, and TSG101, but not between PKM2Y105F and TSG101 (Figure S6D and 7G).
A DuoLink proximity ligation assay confirmed that PKM2-TSG101 binding was exclusive to PKM2WT cells and absent in PKM2Y105F cells. This binding was abolished by IQGAP1 silencing, reinforcing the role of IQGAP1 as an adaptor linking pY105-PKM2 to TSG101 (Figure 7H). Immunofluorescence colocalization further supported these findings, showing colocalization of Flag-tagged proteins with TSG101 in A549-PKM2WT cells, which was disrupted upon IQGAP1 knockdown (Figure 7I).
IQGAP1 mediates the selective sorting of pY105-PKM2 into sEVs and promotes drug resistance in recipient cells
Given the potential interaction between IQGAP1 and pY105-PKM2, we investigated whether IQGAP1 regulates the incorporation of pY105-PKM2 into sEVs. Western blot analysis demonstrated that pY105-PKM2 was present in sEVs derived from A549-PKM2WT but not A549-PKM2Y105F cells (Figure 8A). siRNA-silencing of IQGAP1 significantly reduced the levels of pY105-PKM2 in sEVs (Figure 8A), suggesting that IQGAP1 is crucial for the selective sorting of pY105-PKM2 into sEVs.
IQGAP1 mediates the sorting of pY105-PKM2 into sEVs and synergistically promotes stemness and drug resistance. (A) Western blot analysis of pY105-PKM2 in sEVs derived from A549-PKM2WT or A549-PKM2Y105F cells, with or without IQGAP1 silencing using siRNA (siRNA-NC, siRNA-IQGAP1#3, or siRNA-IQGAP1#4). (B) Flow cytometry analysis of apoptosis in recipient A549 cells treated with sEVs from IQGAP1-silenced or control A549-PKM2WT cells, followed by treatment with cisplatin (5 µg/mL) or paclitaxel (200 ng/mL). (C) Western blot analysis of pY105-PKM2 in sEVs derived from A549-PKM2WT or A549-PKM2Y105F cells, with or without TEPP-46 treatment, which inhibits PKM2 phosphorylation at Y105. (D) Flow cytometry analysis of apoptosis in recipient A549 cells treated with sEVs from TEPP-46-treated A549-PKM2WT cells, followed by cisplatin or paclitaxel treatment. (E) Sphere formation assay of A549 cells overexpressing IQGAP1, PKM2WT, PKM2Y105F, or combinations thereof. Representative images and quantification of sphere numbers are shown. (F) Cell viability assay of A549 cells overexpressing IQGAP1, PKM2WT, PKM2Y105F, or their combinations, following cisplatin treatment (5 µg/mL). (G) Correlation between IQGAP1 and PKM2 expression in CD133-high and CD133-low tumor samples. (H) Correlation between IQGAP1 and pY105-PKM2 expression in CD133-high and CD133-low tumor samples. Data (B-F) are presented as mean ± SD (n = 3). Statistical significance: ns, not significant; *p < 0.05, **p < 0.01, ***p < 0.001, ****p < 0.0001.
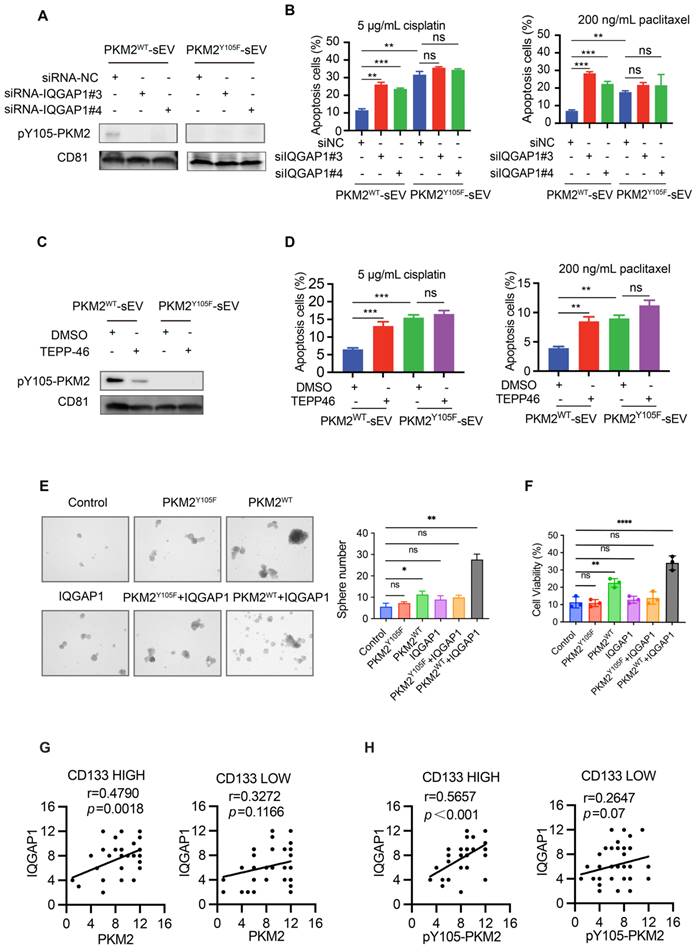
To assess the functional consequences of IQGAP1 silencing for sEVs, we analyzed apoptosis in recipient A549 cells treated with sEVs derived from IQGAP1-silenced A549-PKM2WT cells. These sEVs failed to enhance drug resistance, as evidenced by increased apoptosis rates upon cisplatin or paclitaxel treatment, consistent with reduced pY105-PKM2 levels in the recipient cells (Figure 8B, Figure S6E-F). Similarly, TEPP-46 treatment, which inhibits PKM2 phosphorylation at Y105, resulted in the loss of pY105-PKM2 in sEVs and rendered these sEVs ineffective in promoting drug resistance (Figure 8C-D, Figure S6G-H).
Collectively, these results establish that IQGAP1 mediates the selective sorting of pY105-PKM2 into sEVs, highlighting its critical role in modulating the functional properties of these vesicles during drug resistance.
IQGAP1 and phosphorylated PKM2 synergistically promote stemness and malignant progression
Building on our findings that IQGAP1 mediates the selective incorporation of pY105-PKM2 into sEVs and enhances drug resistance in recipient cells, we investigated whether IQGAP1 and pY105-PKM2 act synergistically to promote stemness and malignant progression in NSCLC. We established cell lines overexpressing IQGAP1, as well as cell lines co-overexpressing IQGAP1 with either wild-type PKM2 (PKM2WT) or the Y105F mutant PKM2 (PKM2Y105F). Sphere formation assays revealed that IQGAP1 and PKM2WT, but not PKM2Y105F, synergistically enhanced stemness (Figure 8E). Chemoresistance assays further corroborated these findings, indicating that co-overexpression of IQGAP1 and PKM2WT significantly promoted drug resistance compared to individual overexpression of either protein (Figure S7A, Figure 8F).
To assess the clinical significance of IQGAP1, we conducted immunohistochemical staining on 80 pairs of tumor and para-tumor tissue samples. Tumors were categorized into low and high IQGAP1 expression groups. We observed a significant upregulation of IQGAP1 in tumor tissues compared to adjacent para-tumor tissues (Figure S7B-C). Importantly, higher IQGAP1 expression levels were strongly associated with poor overall survival (p < 0.001, Figure S7D). Detailed clinicopathological analysis revealed that IQGAP1 expression was significantly associated with advanced TNM stage (p < 0.001), metastasis (p = 0.02), and recurrence (p < 0.001), suggesting a role in disease progression (Table S3). We further examined the interaction between IQGAP1 and PKM2 in CD133-high and CD133-low groups to explore their relationship in cancer stemness. IQGAP1 showed a significant positive correlation with PKM2 expression in the CD133-high group (r = 0.4790, p = 0.0018) but not in the CD133-low group (r = 0.3272, p = 0.1166) (Figure 8G). Notably, phosphorylated PKM2 (pY105-PKM2) was strongly correlated with IQGAP1 in the CD133-high group (r = 0.5657, p < 0.001) but not in the CD133-low group (Figure 8H).
These findings highlight the synergistic role of IQGAP1 and phosphorylated PKM2 in promoting stemness and driving malignant progression in NSCLC. The elevated expression of IQGAP1, particularly in conjunction with pY105-PKM2, underscores their importance in NSCLC pathogenesis and positions them as promising therapeutic targets to mitigate stemness and malignant progression.
Discussion
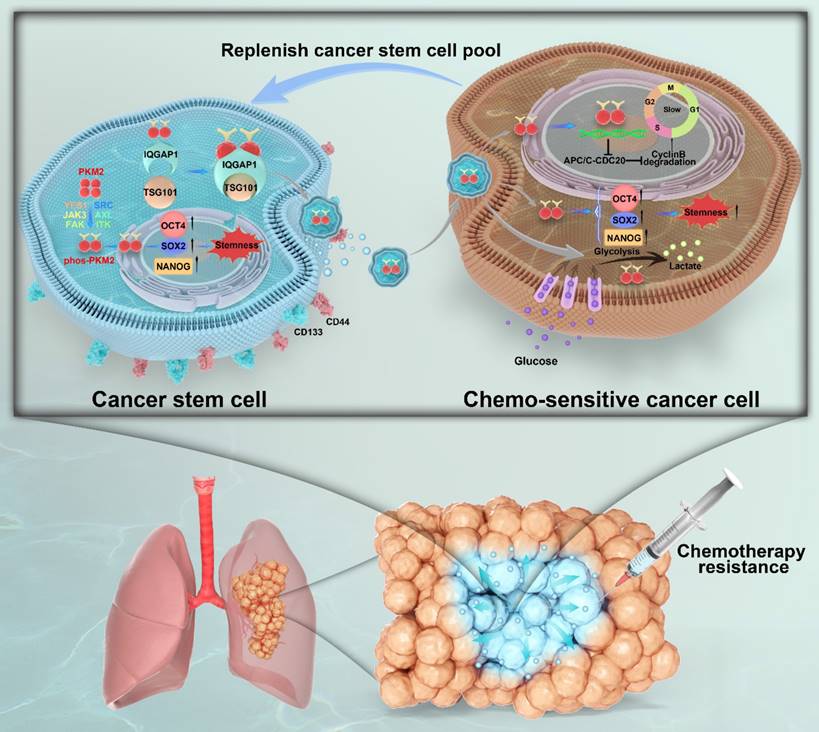
Unlocking phenotypic plasticity has recently been recognized as a dimension of cancer hallmarks [11]. In this study, we explored the complex dynamics of CSCs and their capacity for phenotypic plasticity and illustrate the ability of non-CSCs to acquire or revert to CSC-like traits mediated by CSC-derived sEVs (Figure 9). This adaptability of CSCs is corroborated by ablation studies and lineage tracing in human colorectal cancer mouse models and organoid configurations, where research spearheaded by Shimokawa and Modrusan revealed that differentiated tumor cells could reacquire a LGR5+ state, indicative of colorectal cancer stem cell markers, and regain proliferative abilities following the targeted elimination of LGR5+ cells through cancer therapeutics or CRISPR editing techniques [13, 37]. Ous is the first study to investigate the role of pY105-PKM2 as cargo within sEVs, highlighting its vital role in augmenting stemness characteristics in NSCLC recipient cells. Through this mechanism, pY105-PKM2 significantly contributes to the maintenance of the CSC pool and promotes therapeutic resistance.
Graphical summary of IQGAP1-mediated sorting of phos-PKM2 in CSC-derived sEVs and its role in chemoresistance in NSCLC. This schematic illustrates the role of CSC-derived sEVs in promoting stemness and chemoresistance in NSCLC. In CSCs (left panel), surface markers CD44 and CD133 are expressed. Phosphorylation of PKM2 at Y105 (phos-PKM2) is induced by receptor tyrosine kinases (YES1, Src, JAK3, FAK, ITK, AXL), facilitating its transition from the tetrameric to the dimeric form. phos-PKM2 translocates to the nucleus to enhance the expression of stemness-related transcription factors (SOX2, NANOG, and OCT4). IQGAP1 mediates the selective incorporation of phos-PKM2 into sEVs through interactions with the ESCRT component TSG101, enabling the secretion of sEVs into the tumor microenvironment. In chemosensitive cancer cells (right panel), CSC-derived sEV uptake delivers phos-PKM2, inducing metabolic reprogramming (enhanced glycolysis and suppressed oxidative phosphorylation) and slowing the cell cycle via APC/C-CDC20 inhibition and reduced Cyclin B degradation. These processes collectively promote stemness and chemoresistance, replenishing the CSC pool. The lower section illustrates a lung tumor model, depicting how CSC-derived sEVs expand the CSC population within the tumor microenvironment, thereby driving chemotherapy resistance and malignant progression.
sEVs harbor various functional proteins, RNAs, DNA fragments, and bioactives that orchestrate intercellular material transfer and information exchange, thereby regulating cellular functions and steering oncogenic processes [18, 38]. There is also increasing evidence that sEVs promote cancer stemness [39, 40]. Glioblastoma stem cells secrete sEVs that facilitate the formation of neurospheres and endothelial tubes and enhance glioblastoma invasiveness [41], and sEVs originating from fibroblasts augment colorectal CSC proliferation to bolster chemoresistance [42]. Additionally, the tumorigenic capabilities of glioma stem-like cells are amplified through the transfer of miR-1587 by sEVs produced by glioma-associated mesenchymal stem cells [43]. Our findings highlight the critical role of sEVs as mediators of intercellular communication within the CSC niche, revealing how CSC-derived sEVs facilitate interactions between CSCs and their normal counterparts. This, in turn, propagates stemness and chemoresistance and replenishes the CSC pool in NSCLC.
PKM2, a key rate-limiting enzyme of glycolysis, is overexpressed in various cancers and is instrumental in the metabolic reprogramming of cancer cells to prefer glycolysis for energy production, even in the presence of oxygen—a phenomenon known as the Warburg effect [44-46]. The phosphorylation of PKM2 at Y105 is a key factor in sustaining the CSC state and facilitating tumor progression [31]. We observed a correlation between elevated levels of pY105-PKM2 and poor prognosis in NSCLC patients, with the phosphorylated enzyme showing potential as a biomarker for disease progression and treatment outcomes. Most importantly, a strong association between the CSC marker CD133 and phosphorylated PKM2, but not its unmodified form, underscores that PKM2 phosphorylation at Y105 is a critical determinant of cancer cell stemness and drug resistance in NSCLC, and we confirmed this by constructing point mutation cells. Whether pY105-PKM2 can be sorted into sEVs, the underlying mechanisms, and the downstream effects on the behavior of recipient cells remain incompletely elucidated. However, our research shows that pY105-PKM2 is an essential sEV component, driving stemness in recipient non-CSCs and thereby supporting the CSC pool and enhancing chemoresistance. Notably, our study illuminates the selective sorting mechanism of pY105-PKM2 into sEVs mediated by the adaptor protein IQGAP1. This discovery links the phosphorylation state of a glycolytic enzyme to the sophisticated molecular sorting machinery within CSCs, highlighting a previously underappreciated layer of regulation in CSC propagation and sEV cargo specificity.
Cancer cell heterogeneity and plasticity are major barriers to the efficacy of current therapeutic strategies [47, 48]. Within tumors, there exists a population of slow-cycling cells that are not actively proliferating and, hence, intrinsically resistant to treatments that target dividing cells [49-51]. These slow-cycling cells share characteristics with CSCs, including quiescence, and can evade anti-neoplastic treatments, contributing to tumor relapse, maintaining tumor dormancy, and mediating metastasis [49, 52, 53]. In this study, the transfer of pY105-PKM2 via sEVs to recipient cells induced slower cell cycle progression, metabolic remodeling, and enhanced chemoresistance, highlighting the mechanisms underlying CSC resilience and the recurrence often seen in NSCLC. This study revealed that pY105-PKM2-induced changes in cell cycle dynamics in recipient cells mediated by the APC/C pathway may play a role in gaining stemness, although the exact molecular mechanisms need to be fully elucidated.
In conclusion, our study not only reinforces the central role of CSCs and their derived sEVs in NSCLC pathogenesis but also provides a mechanistic link between sEV-mediated intercellular communication and the propagation of stemness and drug resistance, emphasizing the importance of pY105-PKM2 in this process. By advancing our understanding of the molecular mechanisms driving CSC maintenance and therapeutic resistance, we pave the way for innovative treatment strategies targeting the sEV-mediated communication network in NSCLC.
Supplementary Material
Supplementary figures and tables.
Acknowledgements
This study was supported by research grants from the National Natural Science Foundation of China (Nos. 82127807, 82372852, 82272044, 82372007, and 82202219), the National Key Research and Development Program of China (2020YFA0909000), the Natural Science Foundation of Shanghai (Nos. 23ZR1427500 and 22ZR14500), the Explorer Program of Shanghai (23TS1400900), and the Shanghai Key Laboratory of Molecular Imaging (18DZ2260400). A.G. and C.Y.X.C. are supported by Houston Methodist Research Institute. The authors thank Shaefali Rodgers, Office of Faculty and Research Development, Houston Methodist Academic Institute for scientific editing assistance.
Data availability statement
The RNA sequencing data generated in this study have been deposited in BioProject under the accession number PRJNA1148020. Other data generated in this study are available from the corresponding author upon reasonable request.
Competing Interests
The authors have declared that no competing interest exists.
References
1. Sung H, Ferlay J, Siegel RL, Laversanne M, Soerjomataram I, Jemal A. et al. Global Cancer Statistics 2020: GLOBOCAN Estimates of Incidence and Mortality Worldwide for 36 Cancers in 185 Countries. CA Cancer J Clin. 2021;71:209-49
2. Ashrafi A, Akter Z, Modareszadeh P, Modareszadeh P, Berisha E, Alemi PS. et al. Current Landscape of Therapeutic Resistance in Lung Cancer and Promising Strategies to Overcome Resistance. Cancers (Basel). 2022;14:4562
3. Miller M, Hanna N. Advances in systemic therapy for non-small cell lung cancer. BMJ. 2021;375:n2363
4. Zhong L, Li Y, Xiong L, Wang W, Wu M, Yuan T. et al. Small molecules in targeted cancer therapy: advances, challenges, and future perspectives. Signal Transduct Target Ther. 2021;6:201
5. Chen J, Lu W, Chen M, Cai Z, Zhan P, Liu X. et al. Efficacy of immunotherapy in patients with oncogene-driven non-small-cell lung cancer: a systematic review and meta-analysis. Ther Adv Med Oncol. 2024;16:17588359231225036
6. Yang L, Shi P, Zhao G, Xu J, Peng W, Zhang J. et al. Targeting cancer stem cell pathways for cancer therapy. Signal Transduct Target Ther. 2020;5:8
7. Trumpp A, Haas S. Cancer stem cells: The adventurous journey from hematopoietic to leukemic stem cells. Cell. 2022;185:1266-70
8. Prater AR, Deutscher SL. Selection of Cancer Stem Cell-Targeting Agents Using Bacteriophage Display. Methods Mol Biol. 2022;2394:787-810
9. Batlle E, Clevers H. Cancer stem cells revisited. Nat Med. 2017;23:1124-34
10. Zhou HM, Zhang JG, Zhang X, Li Q. Targeting cancer stem cells for reversing therapy resistance: mechanism, signaling, and prospective agents. Signal Transduct Target Ther. 2021;6:62
11. Hanahan D. Hallmarks of Cancer: New Dimensions. Cancer Discov. 2022;12:31-46
12. Shi ZD, Pang K, Wu ZX, Dong Y, Hao L, Qin JX. et al. Tumor cell plasticity in targeted therapy-induced resistance: mechanisms and new strategies. Signal Transduct Target Ther. 2023;8:113
13. Shimokawa M, Ohta Y, Nishikori S, Matano M, Takano A, Fujii M. et al. Visualization and targeting of LGR5(+) human colon cancer stem cells. Nature. 2017;545:187-92
14. Li YR, Fang Y, Lyu Z, Zhu Y, Yang L. Exploring the dynamic interplay between cancer stem cells and the tumor microenvironment: implications for novel therapeutic strategies. J Transl Med. 2023;21:686
15. Welsh JA, Goberdhan DCI, O'Driscoll L, Buzas EI, Blenkiron C, Bussolati B. et al. Minimal information for studies of extracellular vesicles (MISEV2023): From basic to advanced approaches. J Extracell Vesicles. 2024;13:e12404
16. Hallal S, Tuzesi A, Grau GE, Buckland ME, Alexander KL. Understanding the extracellular vesicle surface for clinical molecular biology. J Extracell Vesicles. 2022;11:e12260
17. Miron RJ, Zhang Y. Understanding exosomes: Part 1-Characterization, quantification and isolation techniques. Periodontol 2000. 2024;94:231-56
18. van Niel G, Carter DRF, Clayton A, Lambert DW, Raposo G, Vader P. Challenges and directions in studying cell-cell communication by extracellular vesicles. Nat Rev Mol Cell Biol. 2022;23:369-82
19. Qian K, Fu W, Li T, Zhao J, Lei C, Hu S. The roles of small extracellular vesicles in cancer and immune regulation and translational potential in cancer therapy. J Exp Clin Cancer Res. 2022;41:286
20. Zhang C, Qin C, Dewanjee S, Bhattacharya H, Chakraborty P, Jha NK. et al. Tumor-derived small extracellular vesicles in cancer invasion and metastasis: molecular mechanisms, and clinical significance. Mol Cancer. 2024;23:18
21. Gholami A. Cancer stem cell-derived exosomes in CD8(+) T cell exhaustion. Int Immunopharmacol. 2024;137:112509
22. Hanahan D, Weinberg RA. Hallmarks of cancer: the next generation. Cell. 2011;144:646-74
23. Tanabe A, Sahara H. The Metabolic Heterogeneity and Flexibility of Cancer Stem Cells. Cancers (Basel). 2020;12:2780
24. Snyder V, Reed-Newman TC, Arnold L, Thomas SM, Anant S. Cancer Stem Cell Metabolism and Potential Therapeutic Targets. Front Oncol. 2018;8:203
25. Sancho P, Barneda D, Heeschen C. Hallmarks of cancer stem cell metabolism. Br J Cancer. 2016;114:1305-12
26. Chae YC, Kim JH. Cancer stem cell metabolism: target for cancer therapy. BMB Rep. 2018;51:319-26
27. Wang D, Zhao C, Xu F, Zhang A, Jin M, Zhang K. et al. Cisplatin-resistant NSCLC cells induced by hypoxia transmit resistance to sensitive cells through exosomal PKM2. Theranostics. 2021;11:2860-75
28. Zhou Z, Li M, Zhang L, Zhao H, Sahin O, Chen J. et al. Oncogenic Kinase-Induced PKM2 Tyrosine 105 Phosphorylation Converts Nononcogenic PKM2 to a Tumor Promoter and Induces Cancer Stem-like Cells. Cancer Res. 2018;78:2248-61
29. Icard P, Fournel L, Wu Z, Alifano M, Lincet H. Interconnection between Metabolism and Cell Cycle in Cancer. Trends Biochem Sci. 2019;44:490-501
30. Dayton TL, Jacks T, Vander Heiden MG. PKM2, cancer metabolism, and the road ahead. EMBO Rep. 2016;17:1721-30
31. Vander Heiden MG, Christofk HR, Schuman E, Subtelny AO, Sharfi H, Harlow EE. et al. Identification of small molecule inhibitors of pyruvate kinase M2. Biochem Pharmacol. 2010;79:1118-24
32. Yang Q, Ferrell JE Jr. The Cdk1-APC/C cell cycle oscillator circuit functions as a time-delayed, ultrasensitive switch. Nat Cell Biol. 2013;15:519-25
33. Cuesta-Borras E, Salvans C, Arques O, Chicote I, Ramirez L, Cabellos L. et al. DPPA3-HIF1alpha axis controls colorectal cancer chemoresistance by imposing a slow cell-cycle phenotype. Cell Rep. 2023;42:112927
34. Sivakumar S, Gorbsky GJ. Spatiotemporal regulation of the anaphase-promoting complex in mitosis. Nat Rev Mol Cell Biol. 2015;16:82-94
35. Wang Q, Bode AM, Zhang T. Targeting CDK1 in cancer: mechanisms and implications. NPJ Precis Oncol. 2023;7:58
36. Liao Y, Chen X, Miller-Little W, Wang H, Willard B, Bulek K. et al. The Ras GTPase-activating-like protein IQGAP1 bridges Gasdermin D to the ESCRT system to promote IL-1beta release via exosomes. EMBO J. 2023;42:e110780
37. de Sousa e Melo F, Kurtova AV, Harnoss JM, Kljavin N, Hoeck JD, Hung J. et al. A distinct role for Lgr5(+) stem cells in primary and metastatic colon cancer. Nature. 2017;543:676-80
38. Jeppesen DK, Fenix AM, Franklin JL, Higginbotham JN, Zhang Q, Zimmerman LJ. et al. Reassessment of Exosome Composition. Cell. 2019;177:428-45 e18
39. Tian L, Lu J, Ng IO. Extracellular vesicles and cancer stemness in hepatocellular carcinoma - is there a link? Front Immunol. 2024;15:1368898
40. Hu JL, Wang W, Lan XL, Zeng ZC, Liang YS, Yan YR. et al. CAFs secreted exosomes promote metastasis and chemotherapy resistance by enhancing cell stemness and epithelial-mesenchymal transition in colorectal cancer. Mol Cancer. 2019;18:91
41. Bronisz A, Wang Y, Nowicki MO, Peruzzi P, Ansari K, Ogawa D. et al. Extracellular vesicles modulate the glioblastoma microenvironment via a tumor suppression signaling network directed by miR-1. Cancer Res. 2014;74:738-50
42. Hu Y, Yan C, Mu L, Huang K, Li X, Tao D. et al. Fibroblast-Derived Exosomes Contribute to Chemoresistance through Priming Cancer Stem Cells in Colorectal Cancer. PLoS One. 2015;10:e0125625
43. Figueroa J, Phillips LM, Shahar T, Hossain A, Gumin J, Kim H. et al. Exosomes from Glioma-Associated Mesenchymal Stem Cells Increase the Tumorigenicity of Glioma Stem-like Cells via Transfer of miR-1587. Cancer Res. 2017;77:5808-19
44. Liu F, Ma F, Wang Y, Hao L, Zeng H, Jia C. et al. PKM2 methylation by CARM1 activates aerobic glycolysis to promote tumorigenesis. Nat Cell Biol. 2017;19:1358-70
45. Zhu S, Guo Y, Zhang X, Liu H, Yin M, Chen X. et al. Pyruvate kinase M2 (PKM2) in cancer and cancer therapeutics. Cancer Lett. 2021;503:240-8
46. Wu B, Liang Z, Lan H, Teng X, Wang C. The role of PKM2 in cancer progression and its structural and biological basis. J Physiol Biochem. 2024;80:261-75
47. Perez-Gonzalez A, Bevant K, Blanpain C. Cancer cell plasticity during tumor progression, metastasis and response to therapy. Nat Cancer. 2023;4:1063-82
48. Lauko A, Lo A, Ahluwalia MS, Lathia JD. Cancer cell heterogeneity & plasticity in glioblastoma and brain tumors. Semin Cancer Biol. 2022;82:162-75
49. Basu S, Dong Y, Kumar R, Jeter C, Tang DG. Slow-cycling (dormant) cancer cells in therapy resistance, cancer relapse and metastasis. Semin Cancer Biol. 2022;78:90-103
50. Shiokawa D, Sakai H, Ohata H, Miyazaki T, Kanda Y, Sekine S. et al. Slow-Cycling Cancer Stem Cells Regulate Progression and Chemoresistance in Colon Cancer. Cancer Res. 2020;80:4451-64
51. Yahiro S, Kawamoto T, Fujiwara S, Hara H, Fukase N, Sawada R. et al. Identification and characterization of slow-cycling cells in Ewing sarcoma. Int J Oncol. 2022;61:138
52. Antonica F, Santomaso L, Pernici D, Petrucci L, Aiello G, Cutarelli A. et al. A slow-cycling/quiescent cells subpopulation is involved in glioma invasiveness. Nat Commun. 2022;13:4767
53. Kusienicka A, Ciesla M, Bukowska-Strakova K, Nowak WN, Bronisz-Budzynska I, Seretny A. et al. Slow-cycling murine melanoma cells display plasticity and enhanced tumorigenicity in syngeneic transplantation assay. Neoplasia. 2023;36:100865
Author contact
![]() Corresponding author: Gang Huang (huanggang502edu.cn), Hao Yang (yanghedu.cn), and Wenhui Xie (xknuclearcom).
Corresponding author: Gang Huang (huanggang502edu.cn), Hao Yang (yanghedu.cn), and Wenhui Xie (xknuclearcom).