Impact Factor
- Issue 14; 2026
- Issue 13; 2026
- Issue 12; 2026
- Issue 11; 2026
- Issue 10; 2026
- Volume 16; 2026
- Advance Articles
- Past Issues
- Cover Images
- Cover Suggestion
- Index & Coverage
- Special Issues
1. Introduction
2. Invasive and...
3. Glucose monitoring techniques
4. Colorimetric assay
5. The current colorimetric...
6. Future direction
7. Conclusion
Abbreviations
Acknowledgements
References
Author Biographies
International Journal of Biological Sciences
International Journal of Medical Sciences
 Global reach, higher impact

Theranostics 2022; 12(14):6308-6338. doi:10.7150/thno.72152 This issue Cite
Review
Nanozyme-based colorimetric biosensor with a systemic quantification algorithm for noninvasive glucose monitoring
Hee-Jae Jeon1,2, Hyung Shik Kim3, Euiheon Chung4,5,6 ![]() , Dong Yun Lee3,7,8,9
, Dong Yun Lee3,7,8,9 ![]()
1. Weldon School of Biomedical Engineering, Purdue University, Indiana 47906, USA
2. Department of Mechanical and Biomedical Engineering, Kangwon National University, Chuncheon 24341, Republic of Korea
3. Department of Bioengineering, College of Engineering, and BK FOUR Biopharmaceutical Innovation Leader for Education and Research Group, Hanyang University, Seoul 04763, Republic of Korea
4. Department of Biomedical Science and Engineering, Gwangju Institute of Science and Technology (GIST), Gwangju 61005, Republic of Korea
5. AI Graduate School, GIST, Gwangju 61005, Republic of Korea
6. Research Center for Photon Science Technology, GIST, Gwangju 61005, Republic of Korea
7. Institute of Nano Science and Technology (INST), Hanyang University, Seoul 04763, Republic of Korea
8. Institute for Bioengineering and Biopharmaceutical Research (IBBR), Hanyang University, Seoul 04763, Republic of Korea
9. Elixir Pharmatech Inc., Seoul 07463, Republic of Korea
Received 2022-2-18; Accepted 2022-8-20; Published 2022-9-7
Abstract

Diabetes mellitus accompanies an abnormally high glucose level in the bloodstream. Early diagnosis and proper glycemic management of blood glucose are essential to prevent further progression and complications. Biosensor-based colorimetric detection has progressed and shown potential in portable and inexpensive daily assessment of glucose levels because of its simplicity, low-cost, and convenient operation without sophisticated instrumentation. Colorimetric glucose biosensors commonly use natural enzymes that recognize glucose and chromophores that detect enzymatic reaction products. However, many natural enzymes have inherent defects, limiting their extensive application. Recently, nanozyme-based colorimetric detection has drawn attention due to its merits including high sensitivity, stability under strict reaction conditions, flexible structural design with low-cost materials, and adjustable catalytic activities. This review discusses various nanozyme materials, colorimetric analytic methods and mechanisms, recent machine learning based analytic methods, quantification systems, applications and future directions for monitoring and managing diabetes.
Keywords: nanozyme, colorimetric analytic methods, glucose, colorimetric biosensor
1. Introduction
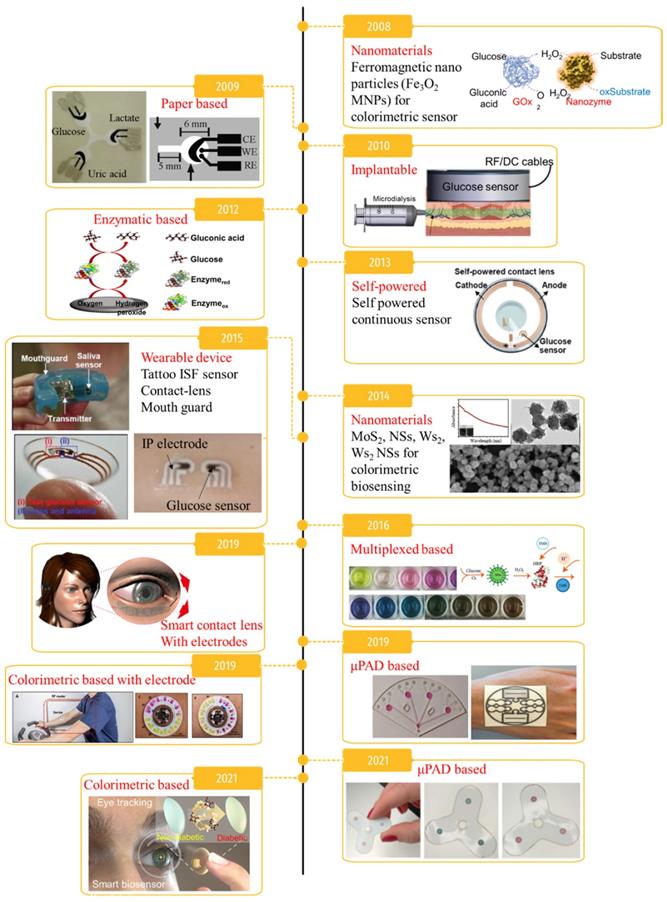
Diabetes mellitus is a significant cause of death and a chronic disorder affecting more than 422 million people worldwide [1]. Chronically elevated blood glucose can cause retinopathy, cardiovascular diseases, neuropathy, blindness, and a high risk of congenital disability [2], causing 1.6 million deaths every year according to the World Health Organization (WHO) [3]. Therefore, early diagnosis and proper glycemic management are crucial to prevent further progression and complications in diabetic patients. Millions of diabetic patients rely on self-monitoring of blood glucose, but the current approaches have vast opportunities for improvement. In general, to manage blood glucose in diabetic patients, blood should be collected using a finger-prick method several times every day [4, 5]. While direct monitoring of blood glucose is the most accurate measurement [6-8], it can create mental trauma for patients as well as infections and fingertip inflammation due to the requirement of several measurements a day, which is a major issue in terms of patient compliance with glycemic methods. Therefore, the demand for technology development to monitor blood glucose using noninvasive strategies has increased. Nanomaterial-based invasive and noninvasive glucose monitoring methods developed in the last 15 years are summarized in Figure 1. Advances in nanotechnology have led to the development of ultra-sensitive and high-performance platforms, including colorimetric, fluorometric, chemiluminescent, surface-enhanced Raman scattering, and electrochemical biosensors [9]. In addition, nanomaterial-based glucose monitoring biosensors have expanded from using blood to utilizing bodily fluids including sweat, tears, urine, saliva, and interstitial fluid (ISF).
A brief timeline of glucose monitoring methods and its applications. Adapted with permission from [116-126].
Conventionally, the basic principle of detecting glucose is based on the glucose oxidase (GO) enzyme, which recognizes glucose as a substrate and initiates a biochemical enzymatic reaction. Therefore, since the reactivity of this enzyme has a significant influence on the sensitivity and reliability of the biosensor, much research is being conducted to improve the performance of the GO enzyme using protein engineering technology. Since the term 'Nanozyme' was first used in 2004, research and development using various functional nanomaterials that mimic the function of the GO enzyme have been conducted [10]. The definition of a nanozyme has been solidified into an enzyme-mimicking nanomaterial that demonstrates intrinsic peroxidase-like activity [11, 12]. Functional nanomaterials as artificial enzymes (nanozymes) show several remarkable advantages, including simple and excellent tunable catalytic activity, controllable synthesis protocols, ultrahigh environmental stability, ease of modification, low cost, and large-scale production [13, 14]. These properties greatly facilitate automation of multiple processes and high-speed integration of separation and detection procedures, saving time and reducing preparation steps. Recently, a few types of inorganic nanoparticles such as nanocarbon materials (carbon nanotubes and graphene oxide) [15], polymer-coated nanoparticles [16, 17], and nanocomposites [17], have been spotlighted for their ability to catalyze chemical reaction as enzyme-mimics that can be utilized for bio-detection. These nanozymes have been applied as chemical sensors and biosensors for colorimetric detection of pH, temperature, ions, reductive small molecules, H2O2, glucose, viruses, bacteria, cancer cells, and pesticides [18]. In addition, invasive and noninvasive biosensors using these nanozymes are being developed to monitor glucose. Over the last decade, colorimetric-based biosensors with nanozymes have expanded due to several advantages including high efficiency, high versatility, low-cost, and high stability.
Nanozyme-based biosensors mainly detect color in a qualitative manner [19, 20]. Therefore, for quantitative measurement of glucose concentration, many algorithms have been developed in different color spaces (RGB, CMYK, HSB/HSL, CIE XYZ, L*a*b*, and YUV models) to analyze color variations. In addition, since color values can be affected by the measurement area of the device or the surrounding environment, algorithms including supervised learning based convolutional neural networks (CNN), artificial neural network (ANN), and support vector machine (SVM), polynomial regression, statistical learning-based color reconstruction, and color checker-based digital image reconstruction are being developed to improve these errors [21].
This review highlights important advances in colorimetric-based glucose detection utilizing nanozymes, various mechanisms, colorimetric analysis methods, and their applications in biosensors. This review also discusses sensor performance in whole blood, saliva, urine, tears, and interstitial fluid. Finally, we address future development requirements of biosensing nanozymes for wearable glucose sensors.
2. Invasive and noninvasive/minimally invasive glucose detection
Various enzyme-based glucose sensors have been developed for bodily fluids including whole blood, urine, saliva, tear, and interstitial fluid (ISF) [22, 23]. The finger-pricking whole blood test is the most widely used method for fast glucose monitoring because blood possesses a high biomolecule concentration [6]. However, since this method requires pricking a finger to extract a small amount of blood for analysis up to 8 times a day, procedural discomfort decreases patient compliance. In addition, there is a high risk of complications such as infection and fibrosis. Therefore, implantable biosensors and microdialysis-type devices that can continuously monitor blood glucose have been developed [6]. However, implantable glucose sensors pose several challenges, including short lifespan, susceptibility to infection, and poor biocompatibility. Therefore, alternative methods have been explored for noninvasive glucose measurements using body fluids [24].
Several studies have shown that glucose concentrations in body fluids such as ISF, tears, saliva, and sweat correlate with that of whole blood [13]. Therefore, many studies have focused on these body fluids to develop noninvasive biosensors for glucose monitoring. To this end, advances in nanotechnology have made it an attractive and alternative sample medium for noninvasive continuous blood monitoring. Table 1 compares the key aspects of the most studied nanomaterials for various physiological measures, including biomarkers, representative concentrations, and their advantages and disadvantages. However, various considerations are required to protect the quality and accuracy of glucose concentration measurements in body fluids. One of the main considerations is that glucose concentration in these body fluids is lower than in whole blood (2-40 × 10-3 M in blood vs. 0.008-1.77 × 10⁻³ M in saliva, 0.01-1.11 × 10⁻³ M in sweat, 0.05-5 × 10⁻³ M in tears, and 1.99-22.2 × 10⁻³ M in ISF) [13, 25]. Therefore, an optimized design and analysis method for monitoring systems specialized for each body fluid method should be developed.
Interstitial fluid (ISF)-based glucose monitoring comparison of body fluids for including whole blood, saliva, tears, and sweat
| Body fluids | Biomarker | Typical concentration (mg/dL) | Typical concentration (mM) | Advantages | Disadvantages | Most studied Nano-materials | Ref |
|---|---|---|---|---|---|---|---|
| Blood | Glucose | 80 - 120 | 0.33 - 6.66 | Cost-effective, real-time monitoring | Invasive, highly uncomfortable for patients, infection risk | ZnO, metal NPs, metal oxide, CNTs, NiSe2-NS transition metal dichalcogenide, MOFs | [130-132] |
| Urine | Glucose | 0 - 50 | 0 - 2.77 | Noninvasive and painless, portable, rapid reproduction | Low accuracy, low glucose detection level, requires frequent calibration, susceptible to interference by bodily fluid | Metal NPs, CNTs, Pt, Ag@Au nanoprism-MOF | [133, 134] |
| Saliva | Glucose | 1.5 - 4 | 0.08 - 0.22 | Noninvasive and painless, safe for children and adults, easy sample collection, cost-effective | Low detection level, requires high sensitivity, inaccurate reading | Polymer, quantum dots, CNTs, Graphene, MOF-Encapsulated TiO2 Platform | [135-137] |
| Sweat | Glucose | 1 - 4 | 0.06 - 0.22 | Non or minimally invasive, sufficient quantities and rapid reproduction | Difficult sample collection, requires long calibration times, irritation and blistering of the skin, inaccurate readings, lag and inconsistent testing | Polymer,QDs, CNTs, Ni-based MOF | [138, 139] |
| Interstitial fluid (ISF) | Glucose | 80 - 120 | 4.44 - 6.66 | Painless, portable, quick results, long term use | Results and analysis influenced by multiple confounding factors, invasive, vulnerable to infection | Polymer, CNTs | [140] |
| Tear | Glucose | 2.2 - 12.5 | 0.11 - 0.55 | Highly accessible, less susceptibility to dilution, numerous testing methods, cost-effective | Lack of suitable power source for testing, requires low LOD, high sensitivity, high selectivity | Polymer, metal oxide NPs, CNTs, cerium nanoparticle (CNPs) | [19] |
The sampling method and physicochemical properties of each body fluid are also important considerations. For example, ISF fills the spaces between most of the body's cells and provides a significant portion of the body's liquid environment [13]. ISF has potential for medical diagnosis because it is very similar to whole blood plasma in terms of composition. Subcutaneous injection of a needle is required to monitor ISF, which can be inconvenient for prospective users [13]. Saliva is a complex mixture of 99.5% water and 0.5% electrolytes (glycoproteins, lipase, mucin, amylase, glucose, and antimicrobial enzymes) [26]. Analytes can be easily collected by spitting, but saliva contains many impurities, making it difficult to isolate the intrinsic glucose in the fluid. In tears, they can be excreted from the body as an extracellular fluid containing mucin, lipids, glucose, water, lysozyme, lactoferrin, lipocalin, lacritin, urea, sodium, immunoglobulins, and potassium [25, 26]. Tear glucose concentration has been shown to be highly correlated with blood glucose, with relatively little interference by impurities. However, biosensors require high sensitivity, selectivity, and low limit of detection (LOD) to monitor tear glucose concentration. Lastly, sweat is composed of water, ammonia, urea, salts, and glucose. The glucose level in sweat shows a high correlation with that in whole blood [27]. Sweat is easily accessible, but it is complicated by impurities and other components and requires exercise for collection.
All of these approaches using body fluids for blood glucose monitoring have unresolved hurdles as their respective fluid-based glucose measurements have not been strongly correlated with plasma glucose concentration or clinical evidence. However, painless and noninvasive methods using each body fluid-based glucose measurement are promising as they allow faster and more convenient monitoring of glucose concentrations in diabetes patients. Therefore, for the finding high correlation and clinical evidence, a system capable of requiring more accurate measurement is needed, and many clinical trials are required.
3. Glucose monitoring techniques
Developing a practical glucose biosensor with high reliability and sensitivity must be a top consideration for the biosensor industry. Various noninvasive glucose biosensors have been developed including optical, electrochemical, transdermal, colorimetric assay, luminescent detection, magnetic signal detection, and microwave approaches [28]. Table 2 shows the advantages and disadvantages of LOD, nanomaterials, and techniques for glucose detection with different methods and the current research status using body fluids. Optical methods of near-infrared reflectance spectroscopy (NIRS) [29, 30], surface plasmon resonance interferometry [31] photoacoustic spectroscopy [32], polarized optical rotation [33], Raman spectroscopy [34], fluorescence [35] and optical coherence tomography (OCT) [36] are illustrated in Figure 2, 3.
Summary of the glucose detection methods, nanomaterials, limits of detection (LODs), advantages, and disadvantages
| Technique | Sample | Nano- materials | LOD | Advantages | Disadvantages | Ref | |
|---|---|---|---|---|---|---|---|
| Optical | Infrared spectroscopy | Glucose solution | CuInS2 quantum dots (QDs) CuBDC | 4.1 μM, 1.2 mM | Low scattering, low-cost materials, high penetration | Not portable, requires high hardware sensitivity, stability, and scanning pressure | [29, 30, 141] |
| Raman spectroscopy | Saliva, urine | AuNPs onto Cu-tetra(4carboxyphenyl) porphyrin chloride (Fe(III)) | 3.9 μM | Sharpens spectra, less sensitive to temperature changes | Not portable, high cost, instability of laser wavelength, low SNR | [34, 142] | |
| Fluorescence spectroscopy | Glucose solution | Boronic acid Functionalized\CNPs, Carbon-based nanozyme CuAA | 1.56 μM, 10 μM | Highly sensitive, less damage to the body | Not portable, high cost, scattering phenomena can affect accuracy | [35, 143] | |
| Surface plasmon resonance interferometry | Glucose solution | Gold in TiO2 coated in PCF, Gold nanoparticles | 10 mg/dL, 25 μM | Rapid detection, real-time monitoring | Not portable, high cost, limited to high molecular weight biomolecules glucose, requires complex setup | [31, 144] | |
| Optical coherence tomography | Blood sample | Silica gold nanoshells | 5.78 mM 0.015-0.045 mg/dL | High resolution, high penetration | Sensitive to individual movement, affected by temperature | [36, 145] | |
| Photoacoustic spectroscopy | Skin, Blood, glucose | AuNPs | 0.035 - 0.098 μg/dL | High detection rate, high SNR | Sensitive to changes in temperature and pressure, vulnerable to motion artifacts | [32, 146] | |
| Optical Polarimetry | Tear, skin, glucose | 125.4, 151.1 mg /dL | High resolution, easy to be miniaturized | Sensitive to temperature and motion changes, not portable, long lag time < 30 min | [33] | ||
| Transdermal | Impedance spectroscopy | Glucose solution, Skin | Gold nanoparticles | 0.9 μM, 0.02-0.05 mg/dL | Differentiates between extracellular and intracellular fluids | Requires a long processing time | [145, 147] |
| Reverse iontophoresis | Glucose solution | Gold nanoparticles PBNPs | 0.01 mM, 0.85 μM | Biocompatibility, easy handling | Skin irritation, inaccurate and long-term measurement | [38, 148] | |
| Electrochemical | Enzymatic detection of glucose | Tear, saliva, sweat, glucose solution | Gold nanoparticles SiO2, ZnO, Silver, WSNFs | 0.1 μM, 3.7 μM 500 nM | Real-time monitoring, high detection range sensitivity, and low LOD | Requires electrodes, toxicity, vulnerable to temperature and motion change | [149-151] |
| Amperometry | Glucose solution | Gold nanoparticlesPt | 0.024 mM/L, 4 μM | Easily commercialized, high accuracy by multiple sensors | Sensor error from drift, calibration error and delays | [152, 153] | |
| Other | Colorimetric assay | Tear, saliva, sweat | Cerium Nanoparticles | 1.25 ng/mL 0.1 ng/mL | Rapid, widely used, reliable performance, portable and convenient, easy to manipulate, cost-effectiveness | Low accuracy, toxicity, limited by battery life and storage | [58, 154] |
| Luminescent detection | Tear, saliva, sweat, H2O2 | ZnO, Lanthanide-doped Nanoparticles and MOFs and CPs | 5 ng/dL, 20 pg/mL 0.1 μM | High accuracy and sensitive, widely used | Not portable, need specific excitation source, high autofluorescence background, complicated operation | [155, 156] | |
| Magnetic signal detection | Tear, saliva, sweat | MoS2/Fe3O4 magnetic nanoparticles (MNPs) | 100 nM, 0.5 ng/mL 8.6 nM | High accuracy and sensitivity, detect entire magnetic interference, portable, convenient, high accuracy | Requires an ultrasensitive magnetic sensor, vulnerable to external magnetic interference, high cost | [157-159] | |
| Microwave | Glucose solution | CuO nanoparticles | 0.2 -10 μM, 36-454 mg/dL | High accuracy and sensitivity | High cost, toxicity, sensitive to temperature and motion artifacts | [160, 161] |
An illustration of the principle for glucose detection using optical monitoring methods. Principles of (A) NIR spectroscopy, (B) Raman spectroscopy, (C) Surface plasmon resonance (D) Optical polarimetry, and (E) OCT scanning. Reproduced with permission [43]. Copyright 2019, MDPI
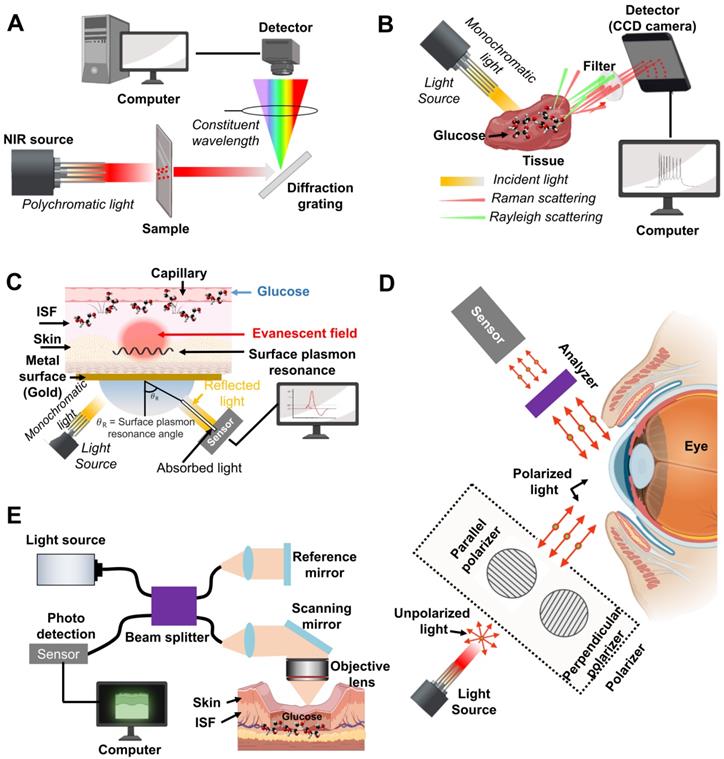
Optical methods measure the glucose concentration from body fluids and indirectly calculate the blood glucose concentration using correlations between glucose concentrations in whole blood and body fluids.
3.1. Near-infrared reflectance spectroscopy (NIRS) and Raman spectroscopy
Arnold et al. reported noninvasive glucose monitoring in diabetic patients utilizing the visible and near-infrared (NIR) spectral regions [37, 38]. A spectrophotometer can measure reflected/transmitted light intensities as a function of concentration, absorption coefficient, and sample thickness as well as evaluate the effect of scattered light in body fluids (Figure 2A). However, the internal structure of human tissues is complex, and spectral information of numerous materials or substances can interfere with the accuracy of the results. Therefore, NIRS methods require processing algorithms to extract the glucose concentration from multiple parameters such as refractive index, angle information, and information of the illumination light source. To improve this issues, deep neural network (DNN) model and efficient regression models has been designed for prediction of serum glucose concentration from healthy subjects, prediabetic, and diabetic condition [39]. These DNN make more high accuracy serum glucose prediction in comparison with other NIR measurement with detection range of 80 - 420 mg/dL. However, since the training data and validation sets were relatively small and it can only detect prediabetic and diabetic condition, it is necessary to collect more clinical sample for the training and validation purpose for the detection of hypoglycemic ranges.
Raman spectroscopy is a non-destructive chemical analysis technique with sharp spectral peaks that provide direct chemical variations of the glucose molecule. Raman scattering is an inelastic scattering involving the target molecule's vibrational energy changes from interaction with incident photons. This wavelength change, called the Raman shift, can represent the glucose difference between the initial and final vibration states (Figure 2B) [37]. Raman spectroscopy is performed at low frequencies at the end of the NIR band and detects fundamental vibrations of atomic groups, leading to more accurate identification. However, compared with other optical methods, Raman spectroscopy suffers from weak Raman signals, extremely challenging calibration in turbid samples, and strong background noise of the surrounding environments. Thus, current efforts are underway to resolve these issues in a wide range of techniques including photon migration theory and multivariate calibration (MVC) analysis for tissue modulation [40]. However, to extract meaningful information, chemometric algorithms which is mathematical, statistical, and computational methods are required for interpreting analytical data. For this aspect, recently the combination of machine learning and surface enhanced Raman Spectroscopy (SERS), and convolutional neural networks (CNN) composed hidden layers are introduced and enhanced the Raman scattering. In 2022, Wang et al. introduced the Gramian angular field (GAF-CNN) which can convert into blood glucose concentration (output) with 1-D Raman spectral data (input) for prediction of glucose concentration. They showed the high performance with error of prediction (REMSP = 0.065) and coefficient of predication (0.999). These algorithms might be good option to predict of glucose concentration with Raman signal [41, 42].
3.2. Fluorescence spectroscopy
Fluorescence spectroscopy uses specialized molecules called fluorophores that absorb the energy of an excitation photon at a specific wavelength and then emit fluorescence, causing a wavelength difference known as the Stroke's shift [43]. In glucose detection, fluorophores like intermediate molecules can bind directly to glucose and alter fluorescence [43]. Fluorescent glucose sensing molecules may be configured to increase or decrease fluorescence at baseline depending on ambient glucose concentration. A variety of glucose-sensing fluorophore, ranging from inorganic (e.g. synthetic carbon nanotube materials and quantum dots) to organic (e.g. enzyme, glucose binding proteins (GBPs), and boronic acid derivatives), have been introduced over the decade [44]. Quantum dots (QDs), nanometer-sized semiconductor crystal, can be designed to fluoresce at any wavelength depending on the crystal size and material used. There are three types of organic molecules that generally recognize glucose: (1) enzymes, (2) GBP, and (3) boronic acid derivatives. It consists of a fluorescent glucose sensor that can be integrated with a fluorophore to reversibly bind glucose. These organic molecules have the advantage of being able to monitor a wide spectral range from ultraviolet (380 nm) to near infrared (880 nm) depending on the immobilized fluorophore. Hitomi et al. reported fluorescence resonant energy transfer (FRET) as shown in Figure 2C, which provides excellent sensitivity for detecting low glucose concentrations [45]. Fluorescence biosensors have advantages of high specificity, sensitivity, and a wide detection range, allowing measurement of analyte concentration based on fluorescence intensity and decay time due to the characteristic emission spectra of specific fluorophores. Therefore, in vitro test projects and experiments commonly use fluorescence biosensors. However, fluorescence biosensors have limitations, including potential toxicity issues, susceptibility to interference due to pH changes and oxygen concentrations, short lifespan of the fluorophore, photostability issues, loss of recognition capability, and a low signal-to-noise ratio. In addition, conventional statistical algorithms are often limited by low accuracy under low illumination conditions, long computation times, and incorrect initial assumptions of decay parameter [46]. Therefore, machine learning-based simple training architectures of artificial neural network (ANN) or convolutional neural network (CNN) have been employed to improve the visualization, less computational time, and detect low fluorescent signal. In 2022, Chen et al. used a Wasserstein GAN-based algorithm in which the generator (G) is trained to generate a high-photon-count fluorescence decay histogram using a low-photon-count input. The GAN training algorithm with rectified linear unit (ReLU) activation was up to 2,800 times faster than the gold standard estimation and showed more accurate analysis of low-photon-count histograms. Since these algorithms have not yet been applied to fluorescence-based glucose detection, better neural network architecture with appropriate activation functions will eventually improve the issues.
3.3. Optical polarimetry (OP)
As another optical method, Cameron et al. developed optical polarimetry (OP) to noninvasively measure blood glucose concentration [47]. They used a polarized beam of light to illuminate a glucose solution and measured the rotation angle of the incident light's polarized plane (Figure 2D) because glucose is an optically active substance and can rotate the plane of the polarized beam [37]. The polarization orientation plane will be changed by the deflection angle from the original incident direction depending on the glucose concentration. The total rotation is proportional to the optical path length, concentration of the analyte, temperature, and wavelength of the laser beam (400-780 nm). Optical polarimetry takes advantage of the easy miniaturization of optical components because it only uses molecules that can rotate the plane of polarized light [48]. However, the relatively low measurement accuracy is challenging issues, mainly due to the presence of other active molecules, high degree of scattering in skin tissue, varying corneal birefringence, and high deflection angle. To improve these issues, a number of geometric and physical model have been proposed to explain physical process, overcoming is difficult because extracting the sample itself is untidy, rendering unpopular sampling methods [49].
3.4. Optical coherence tomography (OCT) and photoacoustic spectroscopy (PAS)
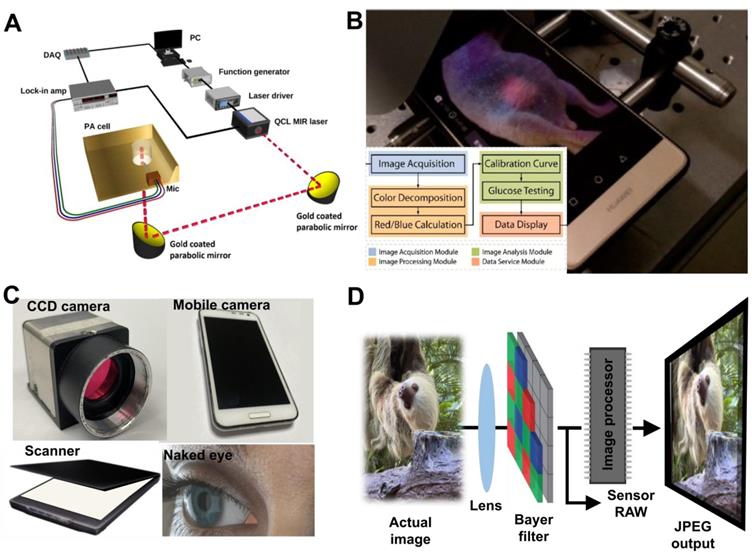
Optical coherence tomography (OCT) has been developed to measure glucose concentration more accurately for high-resolution imaging, providing depth-oriented tomography with two- or three-dimensional images using low-coherence interferometry (Figure 2E). OCT typically employs the NIR range of light and can be used to observe internal biological tissues at depths of 1-2 mm with a spatial resolution of 10-15 microns. OCT was proposed to detect blood glucose from specific skin or in vitro samples and has distinct advantages including continuously monitoring blood glucose concentration with a high signal-to-noise ratio, high resolution, and high noninvasive penetration depth. However, OCT is sensitive to motion artifacts such as skin temperature change, pH, and humidity, leading to low measurement accuracy. In addition, variation of the scattering coefficient by physiological compound is a key factor restricting its development. Therefore, a photoacoustic spectroscopy (PAS) technique was reported by Tanaka et al. [50]. The basic concept of PAS is shown in Figure 3A. The technology of PAS uses ultrasound waves and short laser pulses with wavelengths that are absorbed to produce microscopic-scale localized heating. The localized heating causes a volumetric expansion of the medium, generating an ultrasound wave that can be detected by an acoustic biosensor to measure variations of blood glucose concentration. Even though it can improve the depth and increase detection reliability on the micrometer scale [51], and has low detection sensitivity in the range of physiological glucose concentrations, PAS of the detection sensitivity is still unsatisfactory for clinically approved glucose monitoring. In 2018, Sim et al. developed in vivo microscopic PAS for noninvasive glucose monitoring. They used two laser sources (glucose absorbing and insensitive region detection wavelengths) to improve the system's overall signal-to-noise ratio (SNR) [52]. In 2022, Abdulrahman et al. introduced a photoacoustic spectroscopy using machine learning to detect glucose level in skin sample with 40, 200 dataset and enhancing the sensitivity ± 25 mg/dLdL [53]. Even though this study required to demonstrate the feasibility of in vivo, measurement of glucose concentration can be further enhanced with different classification models.
An illustration of the principle for glucose detection with different types of monitoring methods. Working principles of (A) photoacoustic spectroscopy for glucose monitoring. Adapted with permission from [53]. Copyright 2017, MDPI. (B) optical transducer. Adapted with permission from [103]. Copyright 2018, American Chemical Society. (C) Different devices used for image acquisition of the colorimetric reaction: (left-top) sCMOS, CCD-based digital camera (right-top), smartphone (left-bottom), image scanner (right-bottom), and the naked eye. (D) The working principle of the image sensor from the colorimetric reaction.
3.5. Luminescent detection
Luminescent detection-based assays have emerged with high glucose detection sensitivity based on fluorescence intensity to determine glucose variations in biochemistry and immunoreaction applications. Fluorescence emission requires excitation energy, usually at a shorter wavelength (Figure 3B). Luminescent detection is performed to capture the fluorescent intensity from luminescent nanoparticles such as quantum dots (QDs) [54], dye-doped nanoparticles [55] and up-converting nanoparticles [56]. Similar to colorimetric detection, luminescent detection can be carried out on a handheld device that is cost-effective and easy to manage compared to bench-top apparatuses. In 2008, Faulstich et al. reported a pocket-size device that contains an illumination source and filters. The end-user inserts the test strip, activates the excitation light source, and monitors the test result with their naked eye [57]. In 2013, to obtain more quantitative results, Kozma et al. developed a handheld fluorescent microarray reader consisting of a filter, CCD camera, laser diode (λ=635 nm) with a collimator, and a prism. The total measurement time was less than 20 s [58]. In 2017, Zhang et al. introduced a more rapid system with an analysis range of 1-100 ng/mL [59]. Conventional imaging setup required high quality of sCMOS or CCD, however, with the rapid development of sensing capabilities, the smartphone can capture luminescence image or fluorescence signal with expansion of attachments and software applications. Nonetheless, luminescent detection requires sophisticated optical components to result in high sensitivity.
4. Colorimetric assay
Colorimetric detection utilizes specific indicators (nanozyme or nanomaterials) that change color when interacting with molecules of interest. The color information is recorded with a complementary metal-oxide-semiconductor (CMOS) or charge-coupled device (CCD) divided into two-dimensional grids, known as pixels. The sensor converts the photons into electrons in each pixel. The electrical signal is processed by an image processor to produce final images in JPEG, PNG, TIFF, and BMP formats, as illustrated in Figure 3C- D. Digital cameras, scanners, and smartphones are now widely used to measure color changes and have emerged as suitable alternatives for colorimetric analysis. Among them, current smartphones are prominent as they are equivalent to a microcomputer with high-capacity internal memories and are equipped with high-resolution cameras and wirelessly communicate with other devices [60]. Significant advances in smartphones make them useful for colorimetric assays, including fluorometric or spectroscopy applications.
In the algorithms aspects, conventional colorimetric analysis is started to track the region of interest (ROI), extracting the true color in color space of RGB, CMYK, HSB/HSL, CIE XYZ, L*a*b*, and YUV models. Each acquired intensity was directly plotted with prepared glucose concentrations, generating a calibration curve. This curve fitting was used to estimate sample glucose concentrations. However, colorimetric analysis is highly affected by ambient light conditions and camera optics. To address this issue, advanced algorithms such as machine learning based deep neuronal networks were proposed in the quantitative glucose evaluation process with automated decision-making and self-learning from the data.
4.1. Color space
RGB, CMYK, HSB/HSL, CIE XYZ, CIELAB, and YUV models are commonly used color spaces. The advantages and disadvantages of the color spaces are compared in Table 3. Primary RGB (red, green, and blue) or CMYK (cyan, magenta, yellow, and black) are the most used color spaces. In the RGB color space, each color is assigned to orthogonal coordinate axes in 3D space. The RGB color space ranges from 0 to 255 (8-bit format) or 0 to 1 (fractional format). The RGB color space is commonly used in industry, such as the Bayer filter used in CMOS sensors and many digital products (e.g. smartphones, webcams, flatbed scanners, digital cameras). Utilization of nanozyme in colorimetric-based glucose biosensors can typically use the RGB color space due to its simplicity. In 2022, Firdaus et al. developed smartphone application called glucose analyzer and built the Android Studio platform (DIC-Smartphone), which can achieve a detection limit of 0.043 μM [61]. Although these algorithms can precisely extract RGB color values for calculation of glucose concentration, the RGB color space sometime omits a much smaller number of colors, indicating the limitations of the perceptual space.
Comparison of color spaces for analysis of colorimetric detection
| Color space | Color mixing | Primary parameters | Advantages | Disadvantages |
|---|---|---|---|---|
| RGB | Additive | Red, Green, Blue | Convenient for image acquisition and display | Non-uniform illumination, colors is not linear |
HSV/HIS | Additive | Hue, Saturation, Value Hue, Saturation, Intensity | Based on human color perception; robust before non-uniform illumination, the chromaticity is decoupled from the intensity | Non-removable singularities |
| CIE L* a* b*, L* u* v* | Additive | L: Luminance, a: red to green b: blue to yellow u: Saturationv: Hue angle | Efficient in measuring small color differences, chromaticity is decoupled from the intensity | Singularity problems, nonlinear transformation |
| CMYK | Subtractive | Cyan, Magenta, Yellow, and Black | Commonly used for production printer color | Since it is a subtractive model, the components are pigments or inks |
| YUV, YIQ | Additive | Y (luminance), U (blue chroma), V (red chroma) I (rotated from U), Q (rotated from V) | Efficient coding color information for TV signal | The color range is restricted, difficult to recreate image display |
On the other hand, the CMYK color space, mainly used for color printing, can be applied to paper-based glucose detection. Each color creates a range of colors from 0 to 100%. All colors are created from combination of different CMYK amounts. In 2018, Wilson et al. introduced a paper-based microfluidic device for glucose analysis employing artificial neural networks. They used 4-channel CMYK color data to demonstrate the effectiveness of ANN fitting and classification algorithms [62]. Typically, the RGB colors from the images recorded by the camera were converted to the CMYK color space using Photoshop (Adobe, Inc., USA). However, since RGB can produce much more vivid colors than CMYK, a lot of data can be lost during this conversion.
The International Commission on Illumination (ICI) established CIE XYZ in 1931, the first system for scientifically defining light or additive colors. It is widely accepted as an international standard method for defining color. In CIE XYZ, chromaticity is defined by X and Z, and luminance is defined by Y. The calculated CIE XYZ coordinates are not the same as the original RGB values. The CIE XYZ color space is not as easily represented as the RGB color cube, but it is very similar to the RGB color space with noticeable color distortion. Spectrophotometers and digital color analytical instruments with a CCD or sCMOS sensor typically use the CIE XYZ color space because they can provide reflected or transmitted light from samples. In 2021, Samira et al. introduced a smartphone-based colorimetric sensing system for the measurement of glucose concentration in urine samples. They mapped image color acquired in the CIE chromaticity space, compared them with the reference color, and increased sensitivity with commercial reference charts [63]. However, it is not easy to compare two colors due to the non-uniform color distribution.
HSB, also known as HSV, represents three components: Hue, Saturation, and Brightness. The HSB color space is a kind of non-linear transformation of RGB defined as the simple addition or subtraction of RGB color. Hue is the color type and can be defined as the length of the illumination spectrum ranging from 0 to 360º (for example, the value of 0º is red and 45º is a shade of orange). Saturation is a color range of high intensity values from 0 to 100%. Here 0% means no color and 100% is the most intense color. Brightness is the visual perception derived by luminance ranging from 0 to 100%, where 0% is colorless (black) and 100% is intense color (white saturated color). The HSL (hue, saturation, lightness) space is similar to that of HSB or HSV. However, the main difference of HSL is that it is symmetric to light and dark. Therefore, HSL usually provides a more accurate color approximation than HSB or HSV. This color space can represent a single parameter (H), avoiding redundant color coordinate information when use in colorimetric-based biosensors. In 2020, Simon et al. developed colorimetric sensor for glucose monitoring using smartphone camera. They used HSL and RGB color space to directly compare the estimated performance and show better results in the HSL models [64]. However, this is not the same as the CIE XYZ color space. Thus, it is also difficult to find significant differences between the two-color spaces [108].
The L*, a*, and b* (CIELAB) spaces are international standard for color measurements adopted by the CIE in 1976. CIELAB consists of a luminance or luminance component (L*) between 0 to 100. The parameter a* is the color change from red to green. The parameter b* is the color change from yellow to blue. Unlike CIE XYZ and HSL, the CIELAB space is perceptually uniform due to slight change in the chromaticity diagram that produce changes perceived by the human eye. Thus, the CIELAB space can extract color differences between two colors, which is relevant for colorimetric-based biosensors. In addition, another advantage of the CIELAB space is that it uses Euclidean distance to determine the amount of color difference between two colors, providing information about color and time function changes for different glucose concentrations based on colorimetric detection via continuous and monotonic color profiles. In 2021, Son et al. introduced a colorimetric biosensor using deep neural network. To address the existing perceptual non-uniformity, they used CIELAB color space and found highly perceptible spectra with CIELAB coordinate values [65]. However, the major disadvantage is the requirement of further processing and the number of steps needed to obtain the results.
As the last color space, the YUV model also describes color. The parameter Y is the brightness (luma component) in the range of 0 ~ 100%, the parameter U is the blue luminance of the chrominance component, and the parameter V is the red luminance of the chrominance component. In 2022, Yang et al. developed a biosensor for colorimetric determination of uric acid. For the colorimetric detection, they used algorithm in the YUV color space [66], because the Y value showed good linear relationship in the range of UA concentration. Moreover, the YUV model is suitable for detecting moving objects because YUV simulates human perception of color more closely than does the primary RGB color space model.
4.2. Image processing software and analysis formats
Digital images can be obtained from various devices (e.g., smartphones, webcams, flatbed scanners, digital cameras) with different image qualities. Therefore, to quantitatively monitor the colorimetric variation, the same devices collect images to minimize instrumental errors. Image processing and analysis methods are essential to adopt colorimetric-based biosensors to reduce instrumental error and increase repeatability across devices. Table 4 summarizes colorimetric glucose detection in body fluids. Many acquisition devices are based on the color change used for glucose monitoring. The RGB, CMYK, HSV/HSL, CIE XYZ, CIELAB, and YUV color spaces are usually processed using Matlab, Adobe Photoshop, Image J, Image color Picker processing, and Photometrix software. Matlab, Image J, and Adobe Photoshop are widely used in processing images obtained by digital devices [67]. Several analytical parameters can be monitored after capturing digital images to measure colorimetric variation. In this step, a histogram is acquired, and various parameters can be calculated to obtain colorimetric differences. In addition, the Lambert-Beer Law (-log (I/I0)) or RGB normalization is used to determine a quantitative correlation of analyte concentration [19], where I0 refers to the background signal intensity (Black), and I refers to the sample signal intensity monitored from chemical or enzymatic reactions [68]. However, CIELAB, CIE XYZ, or HSV are unrelated to color intensity. Thus, the use of images analyzed by different processing programs has been used as a strategy to determine a variety of analytes present in different matrices.
Summary of color spaces, image acquisition, and processing for colorimetric glucose analysis using various body fluids
| Color space | Sample | Acquisition device | Acquisition format | Image Processing Software | Ref |
|---|---|---|---|---|---|
| HSV | Serum, urine | Canon Power shot S5 IS digital camera, iPhone 4.0 | JPEG | Image J, Objective C | [162] |
| SRGB | Glucose solutions | Smartphone | JPEG | Image J, Gray color value filter paper | [89] |
| SRGB | Urine | Smartphone | JPEG | Android apps | [61] |
| SRGB | Glucose solutions, human serum | Smartphone | JPEG | Color picker, application n-pads | [163] |
| SRGB | Glucose solutions | iPod Touch | JPEG | Image J | [164] |
| CIELAB | Artificial sweat, human sweat | Smartphone | JPEG | Image J | [124] |
| CMYK | Glucose solution | Epson Perfection V600 scanner | JPEG | MATLAB image processing, toolbox, adobe photoshop, Photoshop CS2 | [62] |
| SRGB | Artificial sweat, human sweat | Smartphone | JPEG | Smartphone based software | [89] |
| SRGB | Artificial sweat, human sweat | Smartphone | JPEG | Color grab application | [165] |
| CIE-RGB-to-HSV | Human urine | Galaxy A20e | JPEG | C++, Java, API 28 in Android Studio 4.0 | [63] |
| SRGB | Glucose solutions, human serum, tears | iPhone 6 | JPEG | Image J, Gray value filter paper | [166] |
| RGB, HSL | Glucose solution | Smartphone | JPEG | Android app | [64] |
| SRGB | Glucose solutions, artificial urine | Smartphone | JPEG | Urine analysis and android application | [167] |
| SRGB | Glucose solutions, artificial saliva | iPhone 7 | JPEG | MATLAB | [168] |
| SRGB | Blood glucose | iPhone 5s | JPEG | Color assist application | [169] |
| SRGB, RGB | Whole blood Glucose solutions | Sony DSC-HX300, digital camera, Galaxy S5, Tab A, Moto G4 | JPEG | Image J, Avidemux 2.6, Python, Open CV, Android studio | [170] |
| SRGB | Glucose solutions | Xiaomi MI 2SC | JPEG | Image J | [171] |
| SRGB, RGB | Glucose solutions blood glucose | Scanner (Epson perfection V700), LG Optimus Vu | JPEG | Image J | [172] |
| HSV | Glucose solutions, real samples | Smartphone | JPEG | Color Lab application | [173] |
| SRGB | Glucose solutions, human serum | LG Optimus L5 II | JPEG | Image J | [174] |
| CIE LAB | Glucose solution | Reflectance spectra | - | MATLAB, | [65] |
| SRGB | Glucose solutions | LG G2 | JPEG | Image J, Microsoft, PowerPoint | [175] |
| SRGB | Glucose solutions | Smartphone | JPEG | Image J | [176] |
| SRGB | Glucose solutions, human serum | iPhone 6 | JPEG | Image J, Adobe Photoshop, Gray value-μpad | [177] |
| SRGB, RGB | Glucose solutions human serum | I8000U, CCD (HDF70-A) | JPEG | Adobe Photoshop CS4 | [178] |
| CIELAB, SRGB | Glucose solutions real samples | iPhone 5S, Samsung J5, Scanner (Canon MF 4780dn) | JPEG | C-Measure Lite, Color Grab, Digital Color meter | [179] |
| SRGB | Glucose solutions | HTC sensation XE, iPhone 5s, Nokia Lumia 920 | JPEG | Cell phone spectrometer application | [95] |
| SRGB | Glucose solutions, urine | iPhone 4, Galaxy SII, MEIZU MX2 | JPEG | Cam card, adobe photoshop | [180] |
| SRGB, YUV | Uric acid, human plasma | Smartphone, Microplate reader | JPEG | Color software | [66] |
| SRGB | Serum samples | iPhone 4 | JPEG | ColorAssist application, RGB colors-commercial test slide | [181] |
| SRGB | Uric acid | Smartphone | JPEG | Image J, Android studio app | [182] |
| SRGB | Serum samples | Smartphone | JPEG | Image J-μPad | [183] |
| SRGB | Artificial urine | iPhone 5, Galaxy 5 | JPEG | RGB colors-colorimetric urine test strips | [184] |
| SRGB | Glucose solutions | Smartphone | JPEG | Color detector application | [185] |
| RGB, HSV | Glucose solutions Human serum | Smartphone | JPEG | HSV application | [186] |
| SRGB | Human tears, glucose solutions | Smartphone | JPEG | MATLAB, ImageJ | [20] |
| RGB | Human tears, glucose solutions | Color CCD | TIFF | MATLAB, ImageJ | [19] |
| SRGB | Urine glucose | MIX6X Xiaomi | JPEG | Color Picker 1.5.2 | [103] |
The image save format also affects the image quality of the color value in colorimetric-based biosensors. The detailed image format characteristics are described in Table 5. JPEG, also called JPG, is widely used to measure colorimetric variation due to their smaller file size, leading to fast image processing. However, the algorithm compresses images when creating JPEG, resulting in quality loss. Therefore, JPEG can lose some information that is not recoverable. Although GIF images undergo a different type of image compression that reduces the file size, they only use 256 colors, leading to poor image quality. PNG and BMP images use different image compression strategies without any quality loss and can be extended up to 24-bit color. Therefore, the images can be saved and analyzed without degradation. In addition, raw TIFF and DNG files are much larger, which means they require more storage capacity and result in a longer transmission time for image processing. However, TIFF and DNG images offer exceptionally detailed and high-quality images. Thus, these formats allow the ability to identify slight differences of color in colorimetric-based biosensors. Recently, smartphones have emerged as attractive capture devices because other devices cannot independently handle the image information and must connect to a computer for colorimetric detection and measurement. Moreover, various smartphone applications exist that can be used to capture digital images, controlling the macro, focal length, brightness, and exposure time. Recent smartphones produce raw image files of DNG, offering numerous advantages for colorimetric-based biosensors.
The characteristics of image formats for colorimetric glucose analysis and their advantages and disadvantages
| Image Format | Available colors | Compression | File size | Advantages | Disadvantages |
|---|---|---|---|---|---|
| JPEG (.jpg) | 16.7 million | Lossy | Small (<1MB) | Small image size, fast processing, widely used in the digital image | Loss some of the data files and not recoverable, lower image quality |
| GIF (.gif) | 256 | Lossless | Small (<1MB) | Suitable for animation as it enables transparency, good internet browser support | Few colors (256), low level of transparency support |
| PNG (.png) | 16.1 milion + transparency | Lossless | Large (<3MB) | Extendable up to 24-bit color, can adjust color when displayed on different monitors | Lossless, large file size |
| TIFF (.tif) | Variable | Variable | Large (<3MB) | No compression, supported by image manipulation application, high image quality | Large file size, requires more storage data and long transmission time |
| DNG (.dng) Raw | Billions | No | Very large (<10MB) | Smartphone-based generation, 8 and 10 raw image files, high image quality | Large image file size, requires more storage data and long transmission time |
| BMP | Variable | Lossless | Large (<3MB) | Very easy to create, Simple to output | Does not allow image compression, low image quality |
In general, colorimetric-based biosensors enable quantitative evaluation of glucose concentration with simple image processing without much consideration of errors resulting from illumination from external light sources. However, a proper lighting position, angle, and power control are essential to increase precision and accuracy. Moreover, the focal length and exposure time difference are essential factors because they can affect the sensor's color recognition (CCD or CMOS) [69]. Thus, measuring accurate color values is not trivial and requires specific control. Methods to reduce experimental error in other research fields can be used, such as normalization, training-based color reconstruction, color checker-based digital image reconstruction, auto-tracking, and real-time monitoring algorithms.
4.3. Colorimetric-based glucose detection with nanozyme
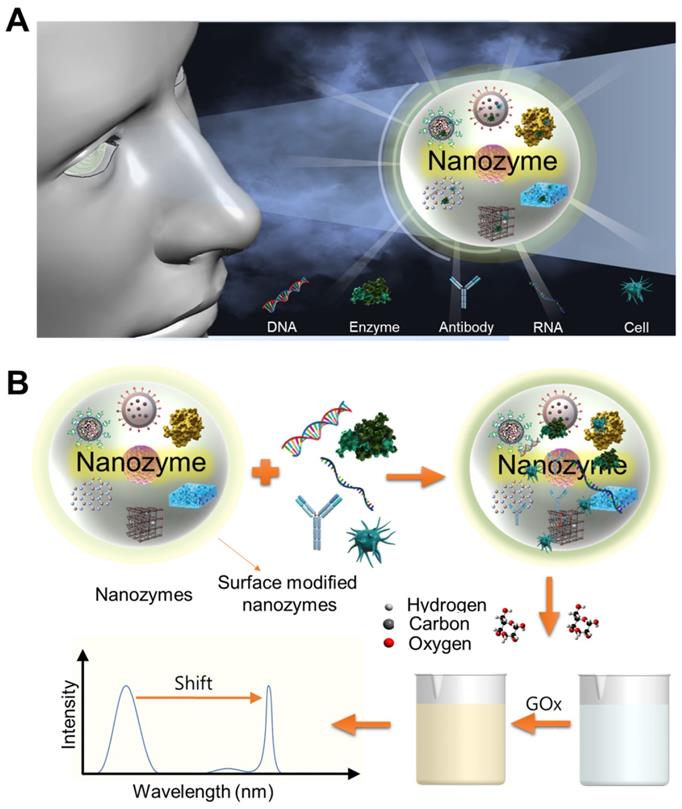
Nanomaterials of natural enzymes have attracted enormous attention due to their unique characteristics compared to their molecular and bulk counterparts [70]. However, with the exception of some catalytic RNA molecules, all natural enzymes have some intrinsic disadvantages. Some of the fundamental limitations of natural enzymes include their low stability, storage difficulty, high cost, tedious purification processes, limited application conditions, and specific operating conditions (i.e., narrow substrate, temperature, and pH ranges). For example, degradation upon exposure to various environmental conditions is a risk factor, and natural enzymes are particularly susceptible to digestion by proteases. They also require time-consuming preparation and purification processes, relatively high costs, and specific storage conditions. Therefore, nanomaterial-based artificial mimetic enzymes are receiving considerable attention. Recently, nanomaterials with 'enzyme-like' activity that mimic traditional biological catalysts such as catalase, oxidase, and peroxidase have attracted interest for potential applications as artificial enzymes. Several engineered nanoparticles (NPs), called nanozymes, have been used as active substances in bioassay, biosensor, and biomedical fields [71, 72]. These NPs include nanomaterials such as simple metal and metal oxide nanoparticles, metal‐organic frameworks (MOF), metal nanoclusters, nanotubes, nanowires, carbon dots as well as quantum dots. These versatile nanomaterials can exhibit enzyme-like catalytic capabilities while overcoming many of the stability limitations and effective range associated with natural enzymes. In addition, the applications of hybrid, synthesis, and stimulus-responsive advanced nanozymes could revolutionize current practices in life sciences and biosensor applications. According to the activity they exhibit, nanozymes are classified into two large families: the oxidoreductase family and the hydrolase family. Nanozymes that are involved in redox catalysis and function similarly to oxidase, peroxidase, catalase, superoxide dismutase, or nitrate reductase are classified in the oxidoreductase family. As shown in Figure 4, by modifying the surface of iron oxide nanozyme or glucose oxidase or configuring it in a hybrid form, it is possible to construct a nanozyme capable of performing the function of an oxidase. In this assembly, oxidase activity is crucial as it provides a peroxidase-like nanozyme with hydrogen peroxide to induce a color change or emit light in colorimetric or fluorescent biosensors. These synergistic characteristics have led to ultra-sensitive platforms and high performance, including colorimetric, fluorometric, chemiluminescent, surface-enhanced Raman scattering, and electrochemical biosensors.
Nanozyme-based colorimetric biosensor with color classification. (A) Nanozyme based colorimetric detection with naked eye. (B) An illustration of nanozymes through assembly with peroxidase mimics.
The most widely studied nanozymes in these biosensing systems are summarized in Table 6, including metal nanoparticles (NPs), metal oxide NPs, and carbon-based nanomaterials. Various nanomaterials, such as Fe3O4 NPs, Co3O4 NPs, carbon nanotubes, and graphene oxide, have peroxidase mimic activity [73, 74]. In addition, CNPs have been demonstrated to have peroxidase-like activity, which can be applied to design corresponding colorimetric sensing systems [75]. The peroxidase-like activity of iron oxide nanocomposites has been widely used for glucose detection. As peroxidase-mimicking nanozymes can oxidize chromogenic substrates (e.g. TMB, ABTS, and OPD) and produce color in the presence of H2O2, they can directly detect H2O2 or other H2O2-generating substrates (e.g. glucose). In all cases, these materials were combined with GOx, and the synergistic effect of these two enzymes is a key factor in achieving high sensitivity and superior analytical performance in biomolecular detection. The superior activity of these nanozymes facilitated colorimetric assays of H2O2, glucose, and sarcosine. In addition, it is possible to increase the effective catalytic surface area by introducing pores into iron oxide nanoparticles and to increase glucose detection sensitivity by exposing metal ions to the surface.
Summary of nanozyme-based glucose detection.
| Principle | Nano materials | Biological sample | Enzyme | LOD [uM] | Substrate | Optimum pH | Response time (min) | Ref |
|---|---|---|---|---|---|---|---|---|
| Colorimetry | Fe3O4-Au @ mesoporous SiO2 microspheres | Glucose solution | GOx | 0.5 | TMB | 4.0 | 10 | [187] |
| Colorimetry | V2O3-Au NP nano composites | Glucose solution | GOx | 0.5 | ABTS | 7.0 | - | [188] |
| Colorimetry | Au@BSA NPs-GO nano composites | Glucose solution | GOx | 0.6 | TMB | 4.0 | - | [189] |
| Colorimetry | HRP·H2O2·TMB | Urine | GOx | 0.03 | TMB | - | [190] | |
| Colorimetry | AuNPs 2,2′-azino-bis(3-ethylbenzothiazoline-6-sulfonic acid) radical (ABTS+•) | Glucose solution | GOx | 80 | TMB | 4.0 | - | [14] |
| Colorimetry | Carboxyl-NS@GOx | Urine | GOx | 125 | - | 4.3 | 2 | [90] |
| Colorimetry | C/H-Aerogel | Blood, sweat | GOx | 11.4 | 10 | [191] | ||
| Colorimetry | MGCN-chitin-AcOH | Blood, urine | 0.055 | 3 | [192] | |||
| Colorimetry | MnO2 nano-oxidizers | Human blood | 10 | 50 | [191] | |||
| Colorimetry | Pt NPs | Glucose Uric acid | 4 | TMB + 4AD | 7.0 | 20 | [182] | |
| Colorimetry | NL-MnCaO2 | Human blood | 23.86 | - | [193] | |||
| Colorimetry | Fe-N-C/MgO | Glucose solution | GOx | 2.1 | TMB | 4.0 | - | [194] |
| Colorimetry | Pt2+2.30@g-C3N4 | Human blood | 0.01 | - | [195] | |||
| Colorimetry | g-C3N4 | Human serum | GOx | 0.71 | TMB | 5.0 | - | [196] |
| Colorimetry | Pd91-GBLP NPs | Human blood | 1 | - | [197] | |||
| Colorimetry | Fe3O4@MnO2 | Uric acid Human plasma | GOx | 0.27 | TMB | - | 1 | [66] |
| Colorimetry | AuNCs | Human serum | GOx | 74.7 | TMB | 3.0 | - | [198] |
| Colorimetry | P-Co3O4 | Human blood | 0.69 | 30 | [199] | |||
| Colorimetry | R-Co3O4 | Human blood | 0.32 | 30 | [199] | |||
| Colorimetry | Fe3O4 magnetic nanoparticles (MNPs) | Glucose solution | GOx | 30 | ABTS | 4.0 | 10 | [200] |
| Colorimetry | Positively charged AuNPs | Glucose solution | 4 | TMB | 4.0 | 15 | [201] | |
| Colorimetry | AuNPs | Urine | GOx | 0.043 | 7.0 | - | [61] | |
| Colorimetry | ceria nanoparticles (CeO2 NPs) | Human blood | GOx | 3 | TMB | 4.0 | 30 | [202] |
| Colorimetry | Carbon nanodots (C-dots) | Human blood | 0.4 | TMB | 3.5 | 15 | [203] | |
| Colorimetry | Ag nanoplates | Human blood | GOx | 0.2 | 7.38 | 15 | [204] | |
| Colorimetry | Chitosan stabilized silver nanoparticles (Ch-Ag NPs) | Human blood | GOx | 0.1 | 3.0 | 10 | [16] | |
| Colorimetry | DNA-embedded core-shell Au@Ag nanoparticles | Fetal bovine serum | GOx | 0.01 | 4.5 | 30 | [205] | |
| Colorimetry | Nitrogen-doped graphene quantum dots | Serum | GOx | 16 | TMB | 3.0 | 90 | [206] |
| Colorimetry | V2O3-OMC | Serum | GOx | 3.3 | ABTS | 4.0 | 10 | [207] |
Recently, supramolecular peptide nanomaterials are attracting attention as candidates for constructing organic nanozymes because peptides and enzymes are composed of amino acids as basic units [76]. These organic nanozymes can be rationally developed through self-assembly of peptides containing key amino acid sequences that participate in the formation of catalytically active sites. Amphiphilic amino acids can serve as building blocks for the supramolecular construction of nanoassemblies with the help of cofactors such as metal ions, and offer the possibility to fabricate nanozymes with minimal biological building blocks [77]. Several organic nanozymes studied so far are inspired by the supramolecular structure and redox principle of horseradish peroxidase (HRP), a typical natural metalloenzyme that catalyzes oxidative substrates by H2O2. In this regard, histidine in native HRP plays an important role in participating in oxidation reactions and providing binding sites for coordination interactions with iron in heme. Therefore, inspired by the supramolecular structure of HRP, Geng et al. reported an organic nanozyme by co-assembly of an amphiphilic amino acid (Fmoc-histidine, FH) and a heme derivative (hemin) [78]. The FH/hemin assembly showed flexible nanostructures and morphologies by tuning the molar ratio between FH hemins and optimizing catalytic activity to establish a sensing platform for rapid and sensitive glucose detection.
Metal-organic frameworks (MOFs) are emerging as important candidates in the field of glucose sensing. MOFs are a class of materials composed of organic ligands and metal nodes. MOF nanozymes exhibit additional properties due to their diverse structures and functions compared to nanozymes based on noble metals, carbon materials, or transition metal compounds. Strong coordination interactions between metal ions and organic ligands allow the formation of unique framework structures with multimodal properties; (1) the porous structure of the MOF provides abundant surfaces and channels for rapid mass transfer; (2) the specific pore size of the MOF is conducive to the loading, adsorption and separation of the target; (3) the presence of metal nodes in MOFs contributes to possible active sites for catalysis; (4) The organic ligands of MOFs provide attractive electrical, optical and thermal properties and abundant functional groups for chemical modification [79]. Mechanically, the enzyme-like catalytic ability of MOFs can be attributed to two aspects: First, MOFs containing metal nodes such as Fe, Ce, Cu, Co or Ni can provide enzyme-mimicking catalytic activity due to the presence of these metal redox pairs. On the other side, the organic ligands of MOFs act as electron mediators, accepting electrons from a substrate and then donating electrons to other substrates, facilitating reactions similar to natural enzymes. Recently, several MOFs have been introduced as promising nanozymes with peroxidase-mimicking activity for glucose detection. In the study of Lin et al., terephthalic acid (TA) was used as a crosslinking ligand for MIL-53(Fe), which was applied as a fluorescent probe for hydroxyl radicals [80]. Fluorescent products were generated under the catalysis of H2O2 by MIL-53(Fe) MOF-based nanozymes, and the fluorescence intensity of the sensing system was related to H2O2 and glucose concentrations. Shahrokhian et al. reported an in situ strategy for the direct growth of Co3(BTC)2 MOFs on free carbon electrodes [81]. Electrodes designed for glucose concentration detection exhibit two linear ranges: 1 µM to 0.33 mM and 0.33 to 1.38 mM, with sensitivities of 1792 and 1002 µAm/M/cm2, respectively. In the context of colorimetric glucose sensing, glucose oxidase@Cu-hemin metal-organic frameworks (GOD@Cu-hemin MOFs) with ball-flower structures as bi-enzyme catalysts for glucose detection have been reported by Lin et al. [82]. The absorption intensity of oxTMB increases linearly with increasing glucose concentration from 0.01 to 1.0 mM, with a detection limit of 2.8 μM, which is claimed to be reasonably designed for colorimetric glucose sensors. Another example of MOF for glucose detection was designed to fabricate a nanoassembly by binding an amphiphilic amino acid, a histidine derivative, to a heme derivative containing an iron ion at the center [83]. The iron ion of the heme derivative and the side chain of the histidine derivative interact non-covalently and exhibit peroxidase mimicking properties that can confer glucose sensing ability.
Although electrochemical-based biosensors utilizing nanozymes demonstrate highly selective and sensitive performance, they require sophisticated fabrication, storage capacity, electrodes, and chips for wireless communication. These drawbacks have led researchers to design glucose biosensors that do not require electrodes. It would be very useful if colorimetric biosensors could achieve the same performance as electrochemical biosensors. Therefore, nanozymes in colorimetric-based biosensors are important to achieve cost-effectiveness, high sensitivity, high selectivity, and stable biosensors for diagnosis and management of diabetic patients. Colorimetric glucose detection using nanozymes has the advantage of providing a rapid response (color change) to obtain visual observation (color camera and naked eye) [84]. After the first results are obtained, the concentration and severity of the disease can be quantified using a color camera (CCD or CMOS) or other quantitative measurements to determine the management strategies and treatment options. Additionally, the digital cameras, scanners, and smartphones are now widely used to measure color changes and have emerged as suitable alternatives for colorimetric analysis. Among them, current smartphones are prominent as they are equivalent to a microcomputer with high-capacity internal memories and are equipped with high-resolution cameras and wirelessly communicate with other devices. Significant advances in smartphones make them useful for colorimetric assays, including fluorometric or spectroscopy applications. It might be overcome using smartphone-based glucose detection platforms for widespread use and better sensitivity for self-diagnosis and management of diabetic patients. Also, algorithm software, including machine learning-based detection and polynomial regression, can improve sensitive glucose detection. Therefore, colorimetric-based glucose detection using nanozymes is suitable for self-monitoring of glucose because of its rapid and cost-effectiveness glucose detection.
5. The current colorimetric analytical devices with nanozymes
5.1. Paper-based colorimetric glucose biosensors
A paper-based colorimetric detection with nanozymes consists of the conjugation of sample analyte, detection, and signal amplification. Paper can serve as the base material for biosensing platform with a significantly lower manufacturing cost. This assay platform is promising for glucose monitoring. To this end, nanozymes enable low-cost glucose detection and have been used as high-sensitivity probes for detection and signal amplification [85]. One of the important advantages of using nanozymes is that they can be easily synthesized without expensive chemical and sophisticated instrumentation, reducing the overall manufacturing cost. This allows the application of numerous metals, metal oxides, and MOF nanozymes for inexpensive colorimetric-based biosensors. Ornatrska et al. introduced the fabrication of a cerium oxide (CeO2)-based bioactive sensing paper strip to detect H2O2 and glucose concentrations (Figure 5A). With a reproducibility of 4.3%, this paper-based detection can be used for a minimum of 10 cycles without loss of activity, reducing costs in each experimental cycle [86]. The basic concept of this study was to use simple electrostatic adsorption method using functionalization of CeO2 nanoparticles. Glucose oxidation produces higher concentration of H2O2, and the physicochemical properties of CeO2 change with oxidation state, resulting in colorimetric detection of glucose and H2O2. The acquired images were analyzed using Adobe Photoshop software, and the blue color intensity are mainly monitored because blue is the complementary color of yellow/orange. Reusability and the use of cost-effective materials are the main advantages of this study. Another advantage of nanozymes is their high thermal stability and mild storage conditions, which can reduce manufacturing costs. Although there are significant advantages in terms of cost-effectiveness from the materials, the acquired image system is bulky and inconvenient for the end-user.
A paper-based colorimetric glucose biosensor. (A) Paper strip to detect H2O2 and glucose utilizing a cerium oxide (CeO2)-based bioactive biosensor. Adapted with permission from [86]. Copyright 2011, American Chemical Society. (B) Chromatic characteristic of plasmonic paper with gold nanoparticles (AuNPs) formation in the CIE XYZ in 1931 color space. Adapted with permission from [87] Copyright 2020, MDPI. (C) Schematic illustration of the ATO-based paper biosensor as peroxidase mimics for colorimetric detection of glucose using smartphone read-out. Adapted with permission from [89], Copyright 2019, Springer. (D) User interface with smartphone readout of glucose urine tests using smartphone app. Adapted with permission from [63], Copyright 2021, Royal Society of Chemistry.
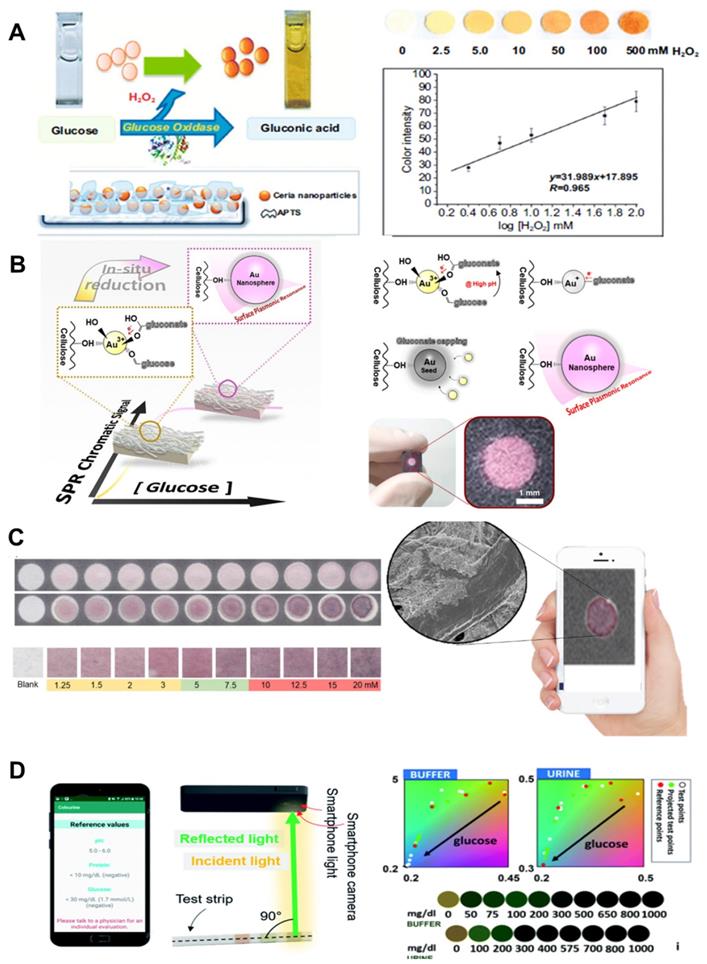
In 2018, Tran et al. developed a nanocomposite using peroxidase mimicry to detect glucose in human urine using FEOOH and N-doped carbon nanosheets. They demonstrated Fe-CN nanocomposite stability for up to 90 days. Another excellent example of low-cost biosensor fabrication utilizing highly stable nanozymes was established by Kim et al. (Figure 5B) [87]. Their work utilized plasmonic paper-based gold nanoparticle formation (AuNPs) and detected color change. An image of RGB values acquired from a scanner (1200 dpi) was converted into CIE XYZ in 1931 space. Glucose concentrations were estimated using exponential smoothing curve fitting. They showed a high linear correlation (R2 = 0.97) and similar sensitivity within low glucose concentrations. These studies demonstrate that nanozymes reduce manufacturing cost and provide much higher detection sensitivity compared to natural enzymes. However, despite the cost-effectiveness and facile synthesis of nanozymes, color change measurement requires expensive and bulky UV or visible spectrophotometer equipment, which can be overcome using smartphone-based glucose detection platforms.
Currently, smartphones have become an essential part of our lives and are being used for scientific purposes. Most smartphones have built-in sensors such as Bluetooth, HD (high definition) cameras, USB (universal serial bus) ports, thermometers, microphones, and gyroscopes. These features make smartphones an attractive platform for analytical devices in environmental monitoring and disease surveillance [88]. Li et al. first reported Antimony-doped tin oxide nanoparticles (ATO NPs) loaded on a filter paper mimicking peroxidase-like activity, and combined them with a smartphone to an analyzer that detects H2O2 and glucose [89]. This approach was used to determine glucose in aqueous samples. In addition, for the development of rapid, disposable, cost-effective manufacturing and inexpensive devices, Pinheiro et al. developed a colorimetric paper-based assay for determination of glucose concentration determination [90]. They synthesized gold nanoparticles (AuNPs) by reducing the gold salt precursor to directly measure glucose using a smartphone camera in Figure 5C. Smartphone cameras utilizing nanozymes for colorimetric glucose detection show harness portability, high-speed processing, and high sensitivity. However, the development of digital systems that can interface with mobile sensors in an efficient manner remains a challenge because of the low sensitivity and optical noise of ambient light. In 2021, Balbach et al. reported a smartphone application that estimates colorimetric signals for glucose detection. As shown in Figure 5D, they put in a reference color chart and a CIE-RGB to HSV color space conversion to remove background noise provided by ambient lighting. These efforts have been devoted to the development of smartphone applications for colorimetric detection. Such a system would provide benefits to diabetics who need to constantly monitor their blood glucose levels on a daily basis.
5.2. Microfluidic paper-based device for glucose biosensors
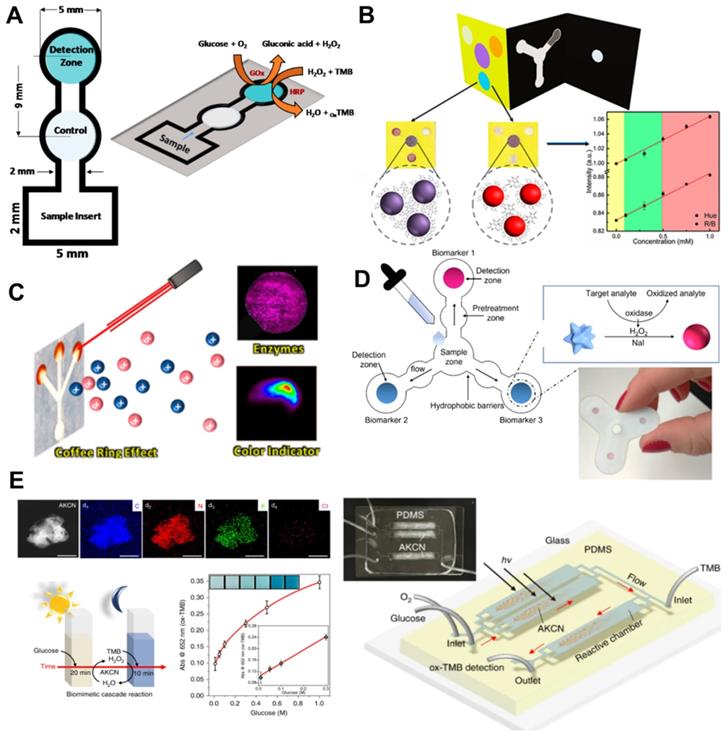
The performance of microfluidic paper-based devices (μPADs) has been extensively investigated for monitoring glucose concentrations [91]. μPAD is attractive for the following reasons: first, μPAD is ubiquitous and consists of very inexpensive materials. Second, μPAD is compatible with other chemical, biochemical, and medical applications. Third, μPAD uses capillary forces to transport liquids without external forces. Various two-dimensional (2D) and 3D microfluidic channels have been made on paper, which transport body fluids in pre-designed μPAD pathways, allowing quantitative detection of glucose concentrations [92]. Coltro et al. reported a paper-based colorimetric biosensor for the measurement of surface acetic acid-to-chitosan-modified tear glucose [114]. They measured glucose concentrations in human tears using TMB as a chromogenic reagent (Figure 6A). Images are recorded with office scanner at 600-dpi resolution and converted to RGB color space. Pinheiro et al. also presented the application of chemically produced and tailored AuNPs in μPADs for glucose sensing (Figure 6B). They also used commercial scanner to minimize the effect of ambient light conditions, and a AuNP-based plasmon for colorimetric transformation of paper substrate sand showed an LOD of 1.25 mM at a time of 2 min [93]. Although μPAD is a cost-effective material and commercial scanners can also improve glucose detection sensitivity, the paper may fluoresce under prolonged illumination and interfere with true color detection. Pomili et al. introduced fully integrated all-in-one paper-based device to detect salivary glucose concentrations. They used colloidal 60-nm multibranched AuNP (MGNPs) and read the colorimetric response within 10 min with the naked eye or using a smartphone. Ortiz-Gómez et al. also reported a paper-based microfluidic colorimetric device for measuring glucose in urine and serum based on a Fe-MIL-101 metal-organic framework (MOF) [123]. The assay was based on Fe-MIL-101 MOF to mimic horseradish peroxidase (HRP) immobilized on commercial cellulose paper. Their μPAD allowed for accurate measurement of glucose using a small sample volume (10 μL) with low LOD (2.5-10 μM/L). Images acquired with a smartphone can be processed on the same device as the developed iOS application without a separate attachment.
The glucose biosensor of microfluidic paper-based devices (μPADs). (A) The layout of µPAD assays of the enzymatic reaction for glucose detection. Adapted with permission from [127]. Copyright 2017, MDPI. (B) Scheme of paper microfluidics and tailored AuNPs, colorimetric multiplex biomarker detection. Adapted with permission from [93]. Copyright 2011, American Chemical Society. (C) Illustration of microfluidic paper-based analytical device for glucose colorimetric assay by mass spectrometry imaging. Adapted with permission from [128]. Copyright 2018, American Chemical Society. (D) The schematic illustration of the paper-based multiplexed colorimetric device with microfluidic pattern for detection of salivary biomarkers. Adapted with permission from [126]. Copyright 2021, MDPI. (E) Comparative enzymatic cascade reaction for glucose detection and scheme in a microfluidic device. Adapted with permission from [98], Copyright 2019, Nature Publishing.
However, accurate measurement requires the system to set certain conditions, including shutter speed, aperture value, focal length, automatic white balance, and the same ambient lighting conditions. Also, the captured image is processed after saving the JPEG, where the raw color information can be lost. Therefore, in 2021, Mercan et al. reported a portable platform based on a color change in μPAD by implementing machine learning classifier with Linear Discriminant Analysis (LDA), Gradient Boosting Classifier (GBC), and Random Forest (RF) [94]. They used different smartphones to train images captured in seven different lighting conditions. Among the tested and calibrated image sets, TMB (98.24%) with an LOD of 0.8 μM obtained the highest accuracy classification. The platform can automatically find ROI and minimize human error, contributing to user-friendly and accurate measurement of POC systems.
For improved sensitivity, Freitas et al. used mass spectrometry in combination with matrix-assisted laser desorption/ionization (MALDI) and desorption electrospray ionization (DESI) to monitor color gradient-based μPAD (Figure 6C). To understand assay performance such as reproducebility and sensitivity, they used a glucose enzyme assay using potassium iodide (KI) as a chromogen for generating color formation [93]. Although MALDI and DESI imaging techniques have been successfully explored in enzymatic assays for glucose colorimetric detection, the above studies have reusability issues, information loss due to RGB color space conversion, and bulky imaging setups. From these points of view, inexpensive, simple and reliable self-monitoring image acquisition systems and algorithms are highly demanded for POC devices. For the development of POC devices, Wang et al. developed a smartphone-based spectrometer for colorimetric-based glucose biosensors containing aptamer-functionalized AuNP [95]. The smartphone-based spectrometer is integrated with the grid substrate, and it uses the built-in camera and LED flash in the smartphone. They experimentally demonstrated the detection of glucose and human cardiac Troponin I (cTnl) with peptide-functionalized AuNP. A smartphone-based spectrometer with spectral numerical correction enables fast and sensitive real-time glucose monitoring with LOD from 0.2 to 0.47 mM. However, the integrated grating substrate is expensive and still requires additional devices and complex processing.
Meanwhile, to improve sensitivity, Darabdhara et al. fabricated paper strips to exploit the peroxidase and oxidase mimic activity [96]. They prepared bimetallic Cu-Pd NPs to reduce graphitic carbon nitride (g-C3N4), graphene oxide (rGO) and MoS2 sheets with a size of less than 10 nm. They optimized the synthesis of Cu-Pd NPs with the desired shape, size, and oxidation state (Figure 6D). A designed biosensor strip of μPAD measured glucose in serum with a detection limit of 0.29 μM and a detection range from 0.2 to 50 μM [96]. Tian et al. designed a 2D layer of PtS2 integrated with dopamine-functionalized hyaluronic acid (HA-DA) hydrogel microspheres for sensing H2O2 using a low-cost ultrasonication-assisted liquid exfoliation method [97]. This biosensor has a greater color change than the PtS2 nanosheets by adding it directly to the glucose solution. Subsequently, a colorimetric biosensor based on PtS2 nanosheets and PtS2@HA-DA microspheres was developed to quantitatively determine glucose concentrations in buffer and human serum, respectively. The PtS2 nanosheet showed linearity in the dynamic range (0.5 to 150 μM) with a low LOD of 0.20 μM. Although a μPAD has been reported using this bifunctional oxidase-peroxide mimicking nanozyme and has provided a low-cost and simple platform for glucose detection, μPADs require reaction time to premix samples prior to the final reaction. From this point of view, inexpensive and metal-free bifunctional nanozymes using earth-abundant elements are highly desirable. Zhang et al. reported metal-free nanozymes of modified graphitic carbon nitride (g-C3N4: GCN) and demonstrated an enzymatic mimic role of this function [98]. They demonstrated dual-functional enzyme-mimicking behaviors that combines the roles of oxidase (GOx) and peroxidase (HRP) using metal-free nanozymes based on modified graphitic carbon nitride (g-C3N4: GCN). In addition, they demonstrated bifunctional cascade catalysis in microfluidics for continuous colorimetric detection of glucose with an LOD of 0.8 μM within 30 s (Figure 6E). However, although this study showed a low LOD in microfluidic device that is sensitive enough for clinical glucose concentration, clinical validation and in vivo test are further required for practical application.
5.3. Colorimetric-based wearable glucose biosensors
With digitization of glucose monitoring, wearable systems are a convenient way for diabetes patients. Colorimetric-based wearable biosensors connected to digital cameras and smartphones can allow continuous monitoring by the end-user, while sample collection can be performed painlessly, an essential advantage for improving patient compliance [99]. The development of wearable biosensors requires specific functions, such as soft, thin, and stretchable features [100]. Therefore, the wearable biosensor withstands the physical burden and is in close contact with the body surface, making it convenient to wear and avoid physical perturbation due to skin contact. For example, if the material is hard, stabilization may occur during operation, which can affect measurement errors.
Different materials could alter the mechanical properties of the wearable glucose biosensors. Standard materials are textiles or fabrics, polymer composites, and papers that can be transformed into tattoos, patches, contact lenses, smartwatches, eyeglasses, and e-skin biosensors to act as sensors with integrated electronic devices [101].
Microneedles (MNs) are introduced in implantable wearable devices to achieve instrument-free glucose detection and continuous blood glucose control. Ensuring the stability and accuracy of implantable wearable biosensors is very important for commercialization. Yang et al. reported a glucose biosensor without a noninvasive instrument [102]. They designed a glucose-biosensing microneedle patch (GBMP) composed of GOx-conjugated MnO2/graphene oxide nanozymes (GOx-MnO2@GO) and swollen methacrylate gelatin (MeGel). GBMP is demonstrated by inserting into the skin to measure glucose concentration in ISF under hyperglycemic conditions to generate gluconic acid and H2O2 due to the enzymatic reaction of GOx and glucose in the body. Color changes are monitored with the naked eye or as RGB value with a smartphone camera. Color intensity is based on the quantitative analysis of glucose concentration and collects 5.1 ± 0.3 μL sweat from skin ISF within 3 min. Sun et al. also introduced an ultrasensitive optical transducer for wireless glucose monitoring with smartphone (Figure 7A). They developed oxygen-sensitive polymer dots (Pdots) and implanted subcutaneously on the dorsal side of mice for in vivo glucose monitoring [103]. In order to clearly distinguish between normoglycemia and hyperglycemia, the image acquired with a smartphone was processed with an RGB model, and the contrast ratios of red and blue were compared. This design has the advantages of being easy to use, cost effective, high sensitivity, short measurement time, sustainability, and pain-free by detecting the color change of various samples. However, to increase accuracy by reducing measurement noise through advanced diagnostic algorithms such as machine learning and artificial intelligence, huge demand must be met.
Colorimetric-based wearable glucose biosensors. (A) An implantable optical transducer using ultrasensitive luminescence signal detection for wireless glucose monitoring. Adapted with permission from [103]. Copyright 2018, American Chemical Society. (B) A wearable microfluidic device using sweat on skin for colorimetric analysis. Adapted with permission from [21], Copyright 2019, ACS publication. (C) The images of wearable biosensor with glucose-responsive of the transparent nanofiber hydrogel patches. Adapted with permission from [129], Copyright 2020, Nature Publishing. (D) Schematic illustration of tear glucose measurement by the reflectance spectrum of a nanoparticle embedded contact lens (NECL) and configuration of the integrating sphere with external light source and spectrometer. Adapted with permission from [38], Copyright 2019, Nature Publishing. (E) Schematic illustration of colorimetric NECL and optical monitoring system. Adapted with permission from [24], Copyright 2019, ACS publication.
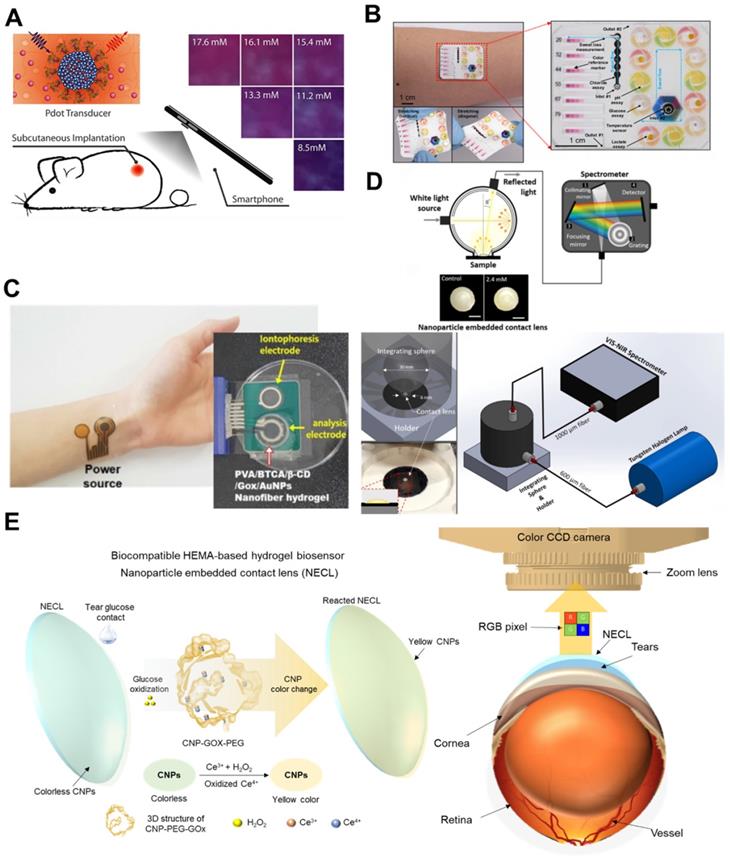
In 2019, Choi et al. developed a sweat-based stretchable microfluidic device for the development of a patch types wearable device [21]. It is the most advanced colorimetric-based biosensor platform for commercialization by optimizing microfluidic designs, chemistry and device layouts to enable precise evaluation. This platform is capable of measuring sweat, sweat rate, sweat temperature, pH, glucose concentration, chloride, and lactate in a physiologically relevant range (Figure 7B). To reduce errors in this work, they adopted a reference marker and measured glucose concentrations of ~0.1 μM. The integrated color reference markers can provide accurate colorimetric estimation of body fluids under various lighting conditions, and it is demonstrated at the different smartphone models in a remote setting. Koh et al. also reported that sweat is harvested and stored from human skin to measure glucose concentration, chloride, sweat rate, lactate, and pH levels [104]. As shown in Figure 7C, tortuous channels within the microfluidic automatically collect sweat and image combined with a smartphone camera for RGB information. This allows the glucose concentration to be quantitatively determined from the RGB values. One distinct advantage of a sweat colorimetric-based wearable biosensor is that the wearer can interpret the qualitative analysis of the analytes in real-time without the need for an external device. However, wider use of the device requires the introduction of uncalibrated sensors associated with colorimetric glucose sensing systems. In addition, in vivo and clinical validation for meaningful medical applications is needed to monitor the association of sweat glucose concentration with blood readings.
Tear-based continuous enzyme sensing of a contact lens type, a wearable device, centers around glucose sensing, and current designs of intraocular nanozyme sensing have been incorporated into polymer matrix-forming contact lenses [105]. In 2011, Yao et al. reported a contact lens sensing platform to measure glucose concentration by applying a GOD/titania sol-gel film immobilized glucose oxidase [106]. They used Nafion® to decrease potential interference from the tear film and demonstrated real-time monitoring with a loop antenna, a wireless communication chip embedded in a polymeric contact lens. This kind of biosensor has fast response time (20 s) and dynamic range (0.1 - 0.6 mM). The 2014 Google glucose-sensing contact lens project was based on this work. In 2017, Kim et al. incorporated silver nanowires and graphene hybrid to improve the stretchability, conductivity, transparency, and contact lens-based biosensor [107]. They designed a graphene/nanowire hybrid source-drain and graphene channel supported by biocompatible parylene substrate. This contact lens-based biosensor was in vivo demonstrated in rabbit and further ex vivo monitored glucose on a bovine eyeball. From this point of view, colorimetric detection using nanozyme is a promising method without requiring electrodes, a bulky system, energy storage capacity or detectors. However, the biosensors in this device are not generally biocompatible.
Moreddu et al. reported a paper-based microfluidic approach with contact lens [108]. The glucose detection biosensor was a lab-made poly-HEMA contact lens combined with paper to detect multiple components, such as pH, ascorbic acid, glucose, proteins, and nitrite ions, in 2 μL of artificial tear in less than 35 s. In addition, they applied a smartphone application for glucose detection, converted to the CIE XYZ in 1931 chromaticity diagram to compare color changes, and used nearest-neighbor color search to return density values corresponding to the corrected color in the plot. These techniques can expand the number of calibration points and improve specificity by combining them within machine learning algorithm. Their paper-based microfluidic contact lens provided high sensitivity (3.9 nM/L) and LOD (1.1 mM/L) with reduced error under various lighting conditions. However, although this biosensor was not associated with toxicity issues, it is not evaluated in animal models in vivo and in vitro to understand body responses.
Recently, Park et al. developed a biocompatible biosensor of a nanoparticle-embedded contact lens (NECL) composed of complexes of cerium oxide nanoparticles (CNPs), glucose oxidase (GOx), and a polyethylene glycol (PEG) [20]. After reacting with tear glucose and H2O2, NECLs are oxidized and changed into a yellowish color. A spectrometer was used for quantitative analysis of color change to measure glucose concentration using NECL. A detectable change in the reflection spectrum of NECL was found in relation glucose concentration (Figure 7D) [38]. However, current spectrometers are expensive and require pre- and post-processing steps. Thus, they developed a simple RGB camera and smartphone-based optical monitoring system utilizing the NECL in animal models and clinical human tears [19]. To reduce the environmental errors and enable continuous monitoring of the NECL in animal models, they developed an image processing algorithm that automatically optimizes the measurement accuracy even when images are obscured by motion artifacts (Figure 7E). This algorithm would be of great benefit to patients by enabling near real-time visualization and measurement of tear glucose concentration. In fact, they conducted blind evaluation of human tears provided by normal person and diabetic patients, and as a result, using the developed system, they were able to accurately discriminate between diabetic patients and normal person with a probability of over 90%. Furthermore, they evaluated the cytotoxicity of NECLs in human umbilical vein endothelial cells (HUVECs) and human corneal epithelial cells (HCECs). The cytotoxicity of NECLs was not noticeable, indicating that no problems occurred during contact lens fabrication.
6. Future direction
Recent research on nanozymes with enzyme-mimicking activity has overwhelmingly increased, expanding the scope of application of colorimetric-based glucose detection. Nanozymes integrated with colorimetric-based glucose biosensors have several advantages over natural enzymes as key functional components for analyte detection, including higher efficiency, greater versatility, lower cost, and higher stability. However, despite these significant advances, some research gaps and hurdles remain at these boundaries, and some work remains to realize the great potential of nanozymes in the development of colorimetric-based biosensors. First, although many nanomaterials have been used to mimic various natural enzymes in terms of material, oxidoreductase mimetics are mainly peroxidase mimics, because of their low-cost, easy storage, rapidity, and high sensitivity. Given the diversity of natural enzymes, additional efforts are needed to develop novel strategies for designing nanozyme with novel catalytic properties and machine learning based algorithms for quantitatively measure of glucose concentration. This increases the flexibility of nanozyme applications in biosensor development and provides affordability for detecting a wider range of analytes. Second, the sensitivity of colorimetric-based biosensors depends mainly on the catalytic efficiency of nanozymes. However, more attention should be paid to rational design of high-performance nanozymes to achieve the desired sensitivity-based colorimetric biosensors. For example, natural enzymes work together as enzyme clusters to provide high catalytic efficiencies within a confined environment for cascade reactions. For better sensitivity, nanozyme assembly is a good option, such as aggregation of other nanozymes or nanozymes with native enzymes. In addition, researchers have introduced several new materials with outstanding performance, such as the metal-doped composite materials or perovskite materials [14, 72, 74]. Perovskite is a ceramic oxide with the molecular formula ABX3. The A is usually rare earth metal such as lanthanide and the B is a transition metal. Both A and B can be replaced by other metal ions of similar radius to form various compounds. There are studies that perovskite nanocomposites have high oxidase-like catalytic activity by a simple and accurate colorimetric detection method [109]. Third, some studies have used other biosensing mechanisms instead of colorimetric signals for the growth of portable biosensors. However, the lack of portability and the existence of sophisticated and complex instruments limit the versatility of nanozymes using fluorescence or other sensing methods that rely on optical properties. Lastly, it has not been highly reported that studies on the toxicological mechanisms or potential toxicity of nanozymes identified so far. Since most of nanozymes are nanomaterials produced through metal-based bottom-up chemical synthesis, research on the toxicity of nanozymes is very important. For example, a previous study investigated the toxic effects of CeO2, a type of metal oxide constituting nanozymes [110]. In that study, morphological-dependent cytotoxicity was confirmed by increased serum concentrations of lactate dehydrogenase (LDH) and tumor necrosis factor alpha (TNF-α) in rod-shaped CeO2 compared to cubic/octahedral CeO2. As shown in this example, a close toxicity analysis is required because there is a change in toxicity depending on the form, concentration, and degree of oxidation of the nanozyme even with the same component. The integration of nanozymes with wearable, implantable, and collectable biosensors requires careful control of the effective window to avoid potential toxicity, and systematic studies are required to evaluate the toxicity of nanozymes. Although previous reports have highlighted the therapeutic importance of several nanozymes in animal models, translating drugs into clinical applications remains a challenge [111]. In addition, a thorough mechanism and understanding of the experimental phenomena under the practical application of nanozymes limits their rapid development for practical applications. The reason for this is that the relatively low catalytic activity and potential toxicity issues of nanozymes compared to natural enzymes make it very difficult to meet the practical application requirements of nanozymes. Therefore, this challenge remains a major hurdle to overcome in nanozyme applications in biosensing and will undoubtedly become an active area for future research. More research may be done in the future, especially to address issues above the processing step, simplify complex physical fabrication, reduce potential toxicity, and combine nanozyme monitoring systems with other technologies that continue to improve.
In terms of colorimetric analysis, naked eye detection is the simplest detection method. However, visual perception varies from person to person and depends on ambient conditions such as lighting. Therefore, in order to accurately and quantitatively measure the colorimetric change, a simple scanner or a digital camera that can accurately measure the colorimetric change is required. The advantage of digital devices is that no skilled manpower is required, high-resolution images can be generated, and color change can be quantitatively measured. Many colorimetric-based studies using smartphones to monitor glucose concentration have been heavily introduced due to their convenience and portability. However, there are several issues that need to be addressed using smartphones. First, images acquired from smartphone cameras are easily distorted and compressed, resulting in low correlation with real-world signals. The result is low repeatability, low accuracy, and low sensitivity in colorimetric-based glucose detection. These limitations are caused by ambient or environmental conditions, including varying lighting conditions, shooting distance, angle of the acquired image, and motion artifacts such as breathing and subtle movements. Second, different smartphone models have different RGB responses, so that different colors can be obtained from images processed by different smartphones. To reduce interference and increase accuracy, color correction methods using polynomial or linear regression algorithms using a color checker have been developed as basic information for color intensity [112]. Accurate correction is performed by processing the acquired images through image normalization and white balance, brightness correction, saturation correction, and color transformation steps. Finally, accurate evaluation algorithms have been developed to improve the detection performance of in vivo models. Nowadays the application of machine learning in nanozyme will increase rapidly in the next few years, especially in material sciences and related fields as shown in Table 7. Because machine learning is great option, a subfield of artificial intelligence (AI) that uses statistics to improve accuracy techniques. It provides computer models with the ability to learn from a dataset, allowing models to perform specific tasks without explicit programming.
The summary of recent machine learning based colorimetric analysis.
| Learning type | Purpose | Image format | Machine learning model | Software | Training data | Color space | Sample | Ref |
|---|---|---|---|---|---|---|---|---|
| Supervised learning | Classification | RAW JPEG | Least-Squares Support-Vector Machine (LS-SVM) | MATLAB | 385 images | RGB, HSV, LAB | Hydrogen peroxide | [208] |
| Supervised learning | Classification | JPEG | Linear Discriminant analysis (LDA), Gradient Boosting Classifier (GBC), Random forest RF) | Python, MATLAB | 224 images | RGB, HSV, LAB | Artificial Saliva | [94] |
| Supervised learning | Classification | JPEG | LDA, SVM, ANN | MATLAB, Python, Android studio | - | RGB, HSV, YUV, Lab | Alcohol solution | [209] |
| Supervised learning | Classification | JPEG | LDA Ensemble bagging classifier (EBC) | Matlab, Android studio | 616 images | RGB, HSV, YUV, LAB | Artificial saliva | [210] |
| Supervised learning | Classification | JPEG | Convolutional neural network (CNN) | MATLAB | 1600 images | RGB | Glucose solution | [211] |
| Supervised learning | Classification | Spectrum | Support vector machine-radial basis function (SVM-RBF) | - | - | - | Glucose solution | [212] |
| Supervised learning | Classification | JPEG | Multi-Layer Perceptron (MLP), Residual Network (ResNet), CNN | - | 490 images | RGB | C-reactive protein (CRP) | [212] |
| Supervised learning | Classification | JPEG, RAW | LS-SVM | MATLAB | 450 images | RGB | prepared PH solution | [213] |
| Supervised learning | Classification | JPEG, Spectrum | Faster region-based (CNN) | - | 1500 images | RGB | Urine | [102] |
| Supervised learning | Classification | RAW | Artificial neural networks (ANNs) | MATLAB | 160 and 54 data points | CMYK | Artificial urine | [62] |
| Supervised learning | Classification | NIR Spectrum | Deep neuronal network (DNN) | - | 1024 dataset | - | Serum glucose | [39] |
| Supervised learning | Classification | Spectrum | Multi-Channel -CNN | - | - | - | Glucose solution | [214] |
Artificial neural network (ANN) or convolutional neural network (CNN), and support vector machine (SVM) are very powerful ML model that can learn continuous functions using linear or non-linear systems with or without hidden layers. They show fast computation and easy implementation because they has fascinating features of learning [113]. They only require input-output variables and identification of the relationship between processing parameters. Although they can adapt to real-time operations and calculate the fast result, they have little application in biosensors for colorimetric-based glucose detection. Additionally, the optical hyperspectral image (HSI) can provide more detailed color information, because it covers narrow spectral bands in the visible, NIR, and IR range instead of assigning primary colors (Red, Green, and Blue). Therefore, more detailed information can be achieved from colorimetric detection than the primary colors [114]. However, spectrophotometers are bulky and expensive, making it challenging to apply glucose monitoring in various conditions. Recently low-cost hyperspectral imaging with smartphone techniques has been introduced [115]. This is statistical learning-based image processing algorithms to be included in machine learning. They can convert RGB into hyperspectral image by training between actual measurements of spectral reflectance obtained from a hyperspectral camera or handheld spectrometer and RGB image captured by smartphone. Obviously, the reconstructed hyperspectral images computed on the smartphone allow for accurate glucose detection and are very useful. However, since the nanozyme-based colorimetric biosensor has not yet been integrated as a standard, additional work is required to apply clinical purpose, and it should be possible to calibrate the smartphone image obtained through it. Therefore, we argue that developing nanozymes with different enzymatic activities and developing various algorithms that can accurately detect color values are excellent options for improving the accuracy of colorimetric-based glucose sensing.
7. Conclusion
The success of colorimetric-based biosensors utilizing nanozymes for glucose detection in diabetic patients requires high accuracy, user-friendly device portability, biocompatibility, and ease-of-use in image acquisition. Collectively, the challenges faced in design of colorimetric-based glucose biosensor applications are development of nanozymes. Rather than hindering future research, essential information collected from the current state-of-the-research is introduced along with detailed analyses to suggest future research directions.
Abbreviations
ISF: interstitial fluid; LOD: limit of detection; NIRS: near-infrared reflectance spectroscopy; OCT: optical coherence tomography; NIR: near-infrared; MVC: multivariate calibration; GBPs: glucose biding proteins; QDs: quantum dots; FRET: fluorescence resonant energy transfer; OP: optical polarimetry; PAS: photoacoustic spectroscopy; SNR: signal-to-noise ratio; RI: reverse iontophoresis; GOx: glucose oxidase; EIS: electrical impedance spectroscopy; CMOS: complementary metal-oxide-semiconductor; CCD: charge couple device; NPs: nanoparticles; AuNPs: gold nanoparticles; RGB: red, green, and blue; CMYK: cyan, magenta, yellow, and black; HSB: hue, saturation, and brightness; CeO2: cerium oxide; μPADs: microfluidic paper-based devices; cTnl: cardiac troponin I; MOF: metal-organic framework; HRP: horseradish peroxidase; TMB: tetramethylbenzidine; g-C3N4: graphitic carbon nitride; rGO: graphene oxide; HA-DA: dopamine-functionalized hyaluronic acid; g-C3N4:GCN: graphitic carbon nitride; GBMP: glucose-biosensing microneedle patch; GOx-MnO2@GO: GOx-conjugated MnO2/graphene oxide nanozymes; MeGel: methacrylate gelatin; CNPs: cerium oxide nanoparticles; NECL: nanoparticle-embedded contact lens; PEG: polyethylene glycol; HUVECs: human umbilical vein endothelial cells; HCECs: human corneal epithelial cells; LS-SVM: Least-Squares Support-Vector Machine; LDA: Linear Discriminant analysis; GBC: Gradient Boosting Classifier; RF: Random forest; EBC: Ensemble bagging classifier; SVM-RBF: Support vector machine-radial basis function; CNN: Convolutional neural network; MLP: Multi-Layer Perceptron; ResNet: Residual Network; CuBDC: copper 1,4-benzenedicarboxylate, copper-doped carbon-based nanozyme; PBNS: Prussian blue nanoparticles; WSNF: nanohybrid fiber.
Acknowledgements
This research was supported by the National Research Foundation of Korea (NRF) grant funded by the Korea government (MSIT) (NRF-2022R1A4A1030421, NRF-2020R1A2C3005834 and NRF-2019R1A2C2086003). This work was also supported by the 2022 Joint Research Project of Institutes of Science and Technology.
Author contributions
H.J.J., E.C., and D.Y.L. collected the related papers and drafted the manuscript. H.J.J. and H.S.K. prepared the figures and tables. H.J.J., H.S.K., E.C., and D.Y.L. revised the manuscript. E.C. and D.Y.L. conceived the review article and provided supervision. All authors read and approved the final manuscript.
Competing Interests
The authors have declared that no competing interest exists.
References
1. WHO. Draft recommendations to strengthen and monitor diabetes responses within national noncommunicable disease programmes, including potential targets. 9 August 2021. https://cdn.who.int/media/docs/default-source/searo/eb150--annex-2-(diabetes).pdf?sfvrsn=b01fa62_12&download=true
2. Ballance WC, Qin EC, Chung HJ, Gillette MU, Kong H. Reactive oxygen species-responsive drug delivery systems for the treatment of neurodegenerative diseases. Biomaterials. 2019;217:119292
3. WHO. Diabetes. 2020. https://www.who.int/health-topics/diabetes#tab=tab_1
4. Grzybowski A, Kanclerz P, Huerva V, Ascaso FJ, Tuuminen R. Diabetes and Phacoemulsification Cataract Surgery: Difficulties, Risks and Potential Complications. J Clin Med. 2019 8
5. Davies MG, Kim JH, Klyachkin ML, Barber L, Dalen H, Svendsen E. et al. Diabetes mellitus and experimental vein graft structure and function. J Vasc Surg. 1994;19:1031-43
6. Clarke WL, Cox D, Gonder-Frederick LA, Carter W, Pohl SL. Evaluating clinical accuracy of systems for self-monitoring of blood glucose. Diabetes care. 1987;10:622-8
7. Ascaso FJ, Huerva V. Noninvasive Continuous Monitoring of Tear Glucose Using Glucose-Sensing Contact Lenses. Optom Vis Sci. 2016;93:426-34
8. Oh SY, Kim H, Kang JM, Lim SH, Park HD, Jung SS. et al. Eosinophilic peritonitis in a patient with continuous ambulatory peritoneal dialysis (CAPD). Korean J Intern Med. 2004;19:121-3
9. Rodbard D. Continuous glucose monitoring: a review of successes, challenges, and opportunities. Diabetes technology & therapeutics. 2016;18:S2-3 -S2-13
10. Gao L, Yan X. Nanozymes: an emerging field bridging nanotechnology and biology. Science China Life Sciences. 2016;59:400-2
11. Manea F, Houillon FB, Pasquato L, Scrimin P. Nanozymes: Gold-nanoparticle-based transphosphorylation catalysts. Angewandte Chemie. 2004;116:6291-5
12. Li G, Wen D. Sensing nanomaterials of wearable glucose sensors. Chinese Chemical Letters. 2021;32:221-8
13. Lee H, Hong YJ, Baik S, Hyeon T, Kim DH. Enzyme-based glucose sensor: from invasive to wearable device. Advanced healthcare materials. 2018;7:1701150
14. Chen J, Ma Q, Li M, Chao D, Huang L, Wu W. et al. Glucose-oxidase like catalytic mechanism of noble metal nanozymes. Nature communications. 2021;12:1-9
15. Luo W, Li Y-S, Yuan J, Zhu L, Liu Z, Tang H. et al. Ultrasensitive fluorometric determination of hydrogen peroxide and glucose by using multiferroic BiFeO3 nanoparticles as a catalyst. Talanta. 2010;81:901-7
16. Jiang H, Chen Z, Cao H, Huang Y. Peroxidase-like activity of chitosan stabilized silver nanoparticles for visual and colorimetric detection of glucose. Analyst. 2012;137:5560-4
17. Han L, Li C, Zhang T, Lang Q, Liu A. Au@Ag heterogeneous nanorods as nanozyme interfaces with peroxidase-like activity and their application for one-pot analysis of glucose at nearly neutral pH. ACS applied materials & interfaces. 2015;7:14463-70
18. Gao L, Fan K, Yan X. Iron oxide nanozyme: A multifunctional enzyme mimetics for biomedical application. Nanozymology. 2020:105-40
19. Jeon H-J, Kim S, Park S, Jeong I-K, Kang J, Kim YR. et al. Optical Assessment of Tear Glucose by Smart Biosensor Based on Nanoparticle Embedded Contact Lens. Nano Letters. 2021;21:8933-40
20. Park S, Hwang J, Jeon H-J, Bae WR, Jeong I-K, Kim TG. et al. Cerium Oxide Nanoparticle-Containing Colorimetric Contact Lenses for Noninvasively Monitoring Human Tear Glucose. ACS Applied Nano Materials. 2021;4:5198-5210
21. Choi J, Bandodkar AJ, Reeder JT, Ray TR, Turnquist A, Kim SB. et al. Soft, skin-integrated multifunctional microfluidic systems for accurate colorimetric analysis of sweat biomarkers and temperature. ACS sensors. 2019;4:379-88
22. Jang S, Xu C. Review of emerging approaches in non-or minimally invasive glucose monitoring and their application to physiological human body fluids. 2018.
23. Badugu R, Lakowicz JR, Geddes CD. Ophthalmic glucose monitoring using disposable contact lenses—a review. Journal of fluorescence. 2004;14:617-33
24. Kim J, Campbell AS, de Ávila BE-F, Wang J. Wearable biosensors for healthcare monitoring. Nature biotechnology. 2019;37:389-406
25. Bruen D, Delaney C, Florea L, Diamond D. Glucose sensing for diabetes monitoring: recent developments. Sensors. 2017;17:1866
26. Corrie SR, Coffey J, Islam J, Markey K, Kendall M. Blood, sweat, and tears: developing clinically relevant protein biosensors for integrated body fluid analysis. Analyst. 2015;140:4350-64
27. Moyer J, Wilson D, Finkelshtein I, Wong B, Potts R. Correlation between sweat glucose and blood glucose in subjects with diabetes. Diabetes technology & therapeutics. 2012;14:398-402
28. Tang L, Chang SJ, Chen C-J, Liu J-T. Non-invasive blood glucose monitoring technology: a review. Sensors. 2020;20:6925
29. Ellis DI, Goodacre R. Metabolic fingerprinting in disease diagnosis: biomedical applications of infrared and Raman spectroscopy. Analyst. 2006;131:875-85
30. Liu Z, Liu L, Sun M, Su X. A novel and convenient near-infrared fluorescence “turn off-on” nanosensor for detection of glucose and fluoride anions. Biosensors and Bioelectronics. 2015;65:145-51
31. Zhu J, Huo X, Liu X, Ju H. Gold nanoparticles deposited polyaniline-TiO2 nanotube for surface plasmon resonance enhanced photoelectrochemical biosensing. ACS applied materials & interfaces. 2016;8:341-9
32. Zhang Y-J, Chen S, Yu Y-L, Wang J-H. A miniaturized photoacoustic device with laptop readout for point-of-care testing of blood glucose. Talanta. 2020;209:120527
33. Malik BH, Pirnstill CW, Coté GL. Dual-wavelength polarimetric glucose sensing in the presence of birefringence and motion artifact using anterior chamber of the eye phantoms. Journal of Biomedical Optics. 2013;18:017007
34. Hu S, Jiang Y, Wu Y, Guo X, Ying Y, Wen Y. et al. Enzyme-Free Tandem Reaction Strategy for Surface-Enhanced Raman Scattering Detection of Glucose by Using the Composite of Au Nanoparticles and Porphyrin-Based Metal-Organic Framework. ACS Applied Materials & Interfaces. 2020;12:55324-30
35. Lu Q, Huang T, Zhou J, Zeng Y, Wu C, Liu M. et al. Limitation-induced fluorescence enhancement of carbon nanoparticles and their application for glucose detection. Spectrochimica Acta Part A: Molecular and Biomolecular Spectroscopy. 2021;244:118893
36. Kirillin MY, Shirmanova MV, Sirotkina MA, Bugrova M, Khlebtsov BN, Zagainova EV. Contrasting properties of gold nanoshells and titanium dioxide nanoparticles for optical coherence tomography imaging of skin: Monte Carlo simulations and in vivo study. Journal of biomedical optics. 2009;14:021017
37. Arnold MA, Small GW. Determination of physiological levels of glucose in an aqueous matrix with digitally filtered Fourier transform near-infrared spectra. Analytical Chemistry. 1990;62:1457-64
38. Kim S, Jeon H-J, Park S, Lee DY, Chung E. Tear glucose measurement by reflectance spectrum of a nanoparticle embedded contact lens. Scientific reports. 2020;10:1-8
39. Joshi AM, Jain P, Mohanty SP, Agrawal N. iGLU 2.0: A new wearable for accurate non-invasive continuous serum glucose measurement in IoMT framework. IEEE Transactions on Consumer Electronics. 2020;66:327-35
40. Pandey R, Paidi SK, Valdez TA, Zhang C, Spegazzini N, Dasari RR. et al. Noninvasive monitoring of blood glucose with Raman spectroscopy. Accounts of chemical research. 2017;50:264-72
41. Wang Q, Pian F, Wang M, Song S, Li Z, Shan P. et al. Quantitative analysis of Raman spectra for glucose concentration in human blood using gramian angular field and convolutional neural network. Spectrochimica Acta Part A: Molecular and Biomolecular Spectroscopy. 2022: 121189.
42. Lussier F, Missirlis D, Spatz JP, Masson J-F. Machine-learning-driven surface-enhanced Raman scattering optophysiology reveals multiplexed metabolite gradients near cells. ACS nano. 2019;13:1403-11
43. Villena Gonzales W, Mobashsher AT, Abbosh A. The progress of glucose monitoring—A review of invasive to minimally and non-invasive techniques, devices and sensors. Sensors. 2019;19:800
44. Klonoff DC. Overview of fluorescence glucose sensing: a technology with a bright future. Journal of diabetes science and technology. 2012;6:1242-50
45. Takanaga H, Chaudhuri B, Frommer WB. GLUT1 and GLUT9 as major contributors to glucose influx in HepG2 cells identified by a high sensitivity intramolecular FRET glucose sensor. Biochimica et Biophysica Acta (BBA)-Biomembranes. 2008;1778:1091-9
46. Chen Y-I, Chang Y-J, Liao S-C, Nguyen TD, Yang J, Kuo Y-A. et al. Generative adversarial network enables rapid and robust fluorescence lifetime image analysis in live cells. Communications Biology. 2022;5:1-11
47. Cameron BD, Baba JS, Cote GL. Optical polarimetry applied to the development of a noninvasive in-vivo glucose monitor. Optical Diagnostics of Biological Fluids V: International Society for Optics and Photonics. 2000;3923:66-77
48. Malik BH, Coté GL. Real-time, closed-loop dual-wavelength optical polarimetry for glucose monitoring. Journal of biomedical optics. 2010;15:017002
49. Bolla AS, Priefer R. Blood glucose monitoring-an overview of current and future non-invasive devices. Diabetes & Metabolic Syndrome: Clinical Research & Reviews. 2020;14:739-51
50. Tanaka Y, Tajima T, Seyama M, Waki K. Differential continuous wave photoacoustic spectroscopy for non-invasive glucose monitoring. IEEE Sensors Journal. 2019;20:4453-8
51. Kottmann J, Rey JM, Sigrist MW. Mid-Infrared photoacoustic detection of glucose in human skin: towards non-invasive diagnostics. Sensors. 2016;16:1663
52. Sim JY, Ahn C-G, Jeong E-J, Kim BK. In vivo microscopic photoacoustic spectroscopy for non-invasive glucose monitoring invulnerable to skin secretion products. Scientific reports. 2018;8:1-11
53. Aloraynan A, Rassel S, Xu C, Ban D. A Single Wavelength Mid-Infrared Photoacoustic Spectroscopy for Noninvasive Glucose Detection Using Machine Learning. Biosensors. 2022;12:166
54. Wang C, Hou F, Ma Y. Simultaneous quantitative detection of multiple tumor markers with a rapid and sensitive multicolor quantum dots based immunochromatographic test strip. Biosensors and Bioelectronics. 2015;68:156-62
55. Zhao P, Wu Y, Zhu Y, Yang X, Jiang X, Xiao J. et al. Upconversion fluorescent strip sensor for rapid determination of Vibrio anguillarum. Nanoscale. 2014;6:3804-9
56. Huang X, Aguilar ZP, Li H, Lai W, Wei H, Xu H. et al. Fluorescent Ru (phen) 32+-doped silica nanoparticles-based ICTS sensor for quantitative detection of enrofloxacin residues in chicken meat. Analytical chemistry. 2013;85:5120-8
57. Faulstich K, Gruler R, Eberhard M, Lentzsch D, Haberstroh K. Handheld and portable reader devices for lateral flow immunoassays. Lateral flow immunoassay: Springer. 2009:1-27
58. Kozma P, Lehmann A, Wunderlich K, Michel D, Schumacher S, Ehrentreich-Förster E. et al. A novel handheld fluorescent microarray reader for point-of-care diagnostic. Biosensors and Bioelectronics. 2013;47:415-20
59. Su L, Yu X, Qin W, Dong W, Wu C, Zhang Y. et al. One-step analysis of glucose and acetylcholine in water based on the intrinsic peroxidase-like activity of Ni/Co LDHs microspheres. Journal of Materials Chemistry B. 2017;5:116-22
60. Kanchi S, Sabela MI, Mdluli PS, Bisetty K. Smartphone based bioanalytical and diagnosis applications: A review. Biosensors and Bioelectronics. 2018;102:136-49
61. Firdaus ML, Saputra E, Ginting SM, Wyantuti S, Eddy DR, Rahmidar L. et al. Smartphone-based digital image colorimetry for non-enzymatic detection of glucose using gold nanoparticles. Sensing and Bio-Sensing Research. 2022: 100472.
62. Lee W, Gonzalez A, Arguelles P, Guevara R, Gonzalez-Guerrero MJ, Gomez FA. Thread/paper-and paper-based microfluidic devices for glucose assays employing artificial neural networks. Electrophoresis. 2018;39:1443-51
63. Balbach S, Jiang N, Moreddu R, Dong X, Kurz W, Wang C. et al. Smartphone-based colorimetric detection system for portable health tracking. Analytical Methods. 2021;13:4361-9
64. Fairclough SM, Giannetti C, Wagner I, Shakeel H. Colorimetric sensor for pH monitoring of liquid samples using bubble wrap and mobile phone camera. 2020 IEEE International Conference on Flexible and Printable Sensors and Systems (FLEPS): IEEE. 2020:1-4
65. Son H, Kim S-J, Hong J, Sung J, Lee B. Design of Highly Perceptible Dual-resonance All-dielectric Metasurface Colorimetric Sensor via Deep Neural Networks. Scientific Reports. 2022;12:1-10
66. Yang W, Fei J, Xu W, Jiang H, Sakran M, Hong J. et al. A biosensor based on the biomimetic oxidase Fe3O4@ MnO2 for colorimetric determination of uric acid. Colloids and Surfaces B: Biointerfaces. 2022: 112347.
67. Lazaros N, Sirakoulis GC, Gasteratos A. Review of stereo vision algorithms: from software to hardware. International Journal of Optomechatronics. 2008;2:435-62
68. Shimada M, Masuda Y, Yamada Y, Itoh M, Takahashi M, Yatagai T. Explanation of human skin color by multiple linear regression analysis based on the modified Lambert-Beer law. Optical Review. 2000;7:348-52
69. Hong JI, Chang B-Y. Development of the smartphone-based colorimetry for multi-analyte sensing arrays. Lab on a Chip. 2014;14:1725-32
70. Zheng X, Liu Q, Jing C, Li Y, Li D, Luo W. et al. Catalytic gold nanoparticles for nanoplasmonic detection of DNA hybridization. Angewandte Chemie. 2011;123:12200-4
71. Hayat A, Cunningham J, Bulbul G, Andreescu S. Evaluation of the oxidase like activity of nanoceria and its application in colorimetric assays. Analytica chimica acta. 2015;885:140-7
72. Wang X, Cao W, Qin L, Lin T, Chen W, Lin S. et al. Boosting the peroxidase-like activity of nanostructured nickel by inducing its 3+ oxidation state in LaNiO3 perovskite and its application for biomedical assays. Theranostics. 2017;7:2277
73. Steiner M-S, Duerkop A, Wolfbeis OS. Optical methods for sensing glucose. Chemical Society Reviews. 2011;40:4805-39
74. Kim HY, Park KS, Park HG. Glucose oxidase-like activity of cerium oxide nanoparticles: use for personal glucose meter-based label-free target DNA detection. Theranostics. 2020;10:4507
75. Ballesteros CA, Mercante L, Alvarenga A, Facure MHM, Schneider R, Correa D. Recent trends in nanozymes design: from materials and structures to environmental applications. Materials Chemistry Frontiers. 2021;5:7419-51
76. Makam P, Yamijala SS, Tao K, Shimon LJ, Eisenberg DS, Sawaya MR. et al. Non-proteinaceous hydrolase comprised of a phenylalanine metallo-supramolecular amyloid-like structure. Nature catalysis. 2019;2:977-85
77. Han J, Zou Q, Su W, Yan X. Minimal metallo-nanozymes constructed through amino acid coordinated self-assembly for hydrolase-like catalysis. Chemical Engineering Journal. 2020;394:124987
78. Geng R, Chang R, Zou Q, Shen G, Jiao T, Yan X. Biomimetic nanozymes based on coassembly of amino acid and hemin for catalytic oxidation and sensing of biomolecules. Small. 2021;17:2008114
79. Niu XH, Li X, Lyu ZY, Pan JM, Ding SC, Ruan XF. et al. Metal-organic framework based nanozymes: promising materials for biochemical analysis. Chem Commun. 2020;56:11338-53
80. Lin TR, Qin YM, Huang YL, Yang RT, Hou L, Ye FG. et al. A label-free fluorescence assay for hydrogen peroxide and glucose based on the bifunctional MIL-53(Fe) nanozyme. Chem Commun. 2018;54:1762-5
81. Shahrokhian S, Ezzati M, Hosseini H. Fabrication of a sensitive and fast response electrochemical glucose sensing platform based on co-based metal-organic frameworks obtained from rapid in situ conversion of electrodeposited cobalt hydroxide intermediates. Talanta. 2020 210
82. Lin CH, Du Y, Wang SQ, Wang L, Song YH. Glucose oxidase@Cu-hemin metal-organic framework for colorimetric analysis of glucose. Mat Sci Eng C-Mater. 2021 118
83. Geng R, Chang R, Zou QL, Shen GZ, Jiao TF, Yan XH. Biomimetic Nanozymes Based on Coassembly of Amino Acid and Hemin for Catalytic Oxidation and Sensing of Biomolecules. Small. 2021 17
84. Mahmudunnabi RG, Farhana FZ, Kashaninejad N, Firoz SH, Shim Y-B, Shiddiky MJ. Nanozyme-based electrochemical biosensors for disease biomarker detection. Analyst. 2020;145:4398-420
85. Wang Q, Wei H, Zhang Z, Wang E, Dong S. Nanozyme: An emerging alternative to natural enzyme for biosensing and immunoassay. TrAC Trends in Analytical Chemistry. 2018;105:218-24
86. Ornatska M, Sharpe E, Andreescu D, Andreescu S. Paper bioassay based on ceria nanoparticles as colorimetric probes. Analytical chemistry. 2011;83:4273-80
87. Kim HJ, Hyung J, Noh H. Rationalization of In-Situ Synthesized Plasmonic Paper for Colorimetric Detection of Glucose in Ocular Fluids. Chemosensors. 2020;8:81
88. Song J, Pandian V, Mauk MG, Bau HH, Cherry S, Tisi LC. et al. Smartphone-based mobile detection platform for molecular diagnostics and spatiotemporal disease mapping. Analytical chemistry. 2018;90:4823-31
89. Li Y, Sun J, Mao W, Tang S, Liu K, Qi T. et al. Antimony-doped tin oxide nanoparticles as peroxidase mimics for paper-based colorimetric detection of glucose using smartphone read-out. Microchimica Acta. 2019;186:1-10
90. Pinheiro T, Ferrão J, Marques AC, Oliveira MJ, Batra NM, Costa PM. et al. Based In-Situ Gold Nanoparticle Synthesis for Colorimetric, Non-Enzymatic Glucose Level Determination. Nanomaterials. 2020;10:2027
91. Mabey D, Peeling RW, Ustianowski A, Perkins MD. Diagnostics for the developing world. Nature Reviews Microbiology. 2004;2:231-40
92. Liu S, Su W, Ding X. A review on microfluidic paper-based analytical devices for glucose detection. Sensors. 2016;16:2086
93. Pinheiro T, Marques AC, Carvalho P, Martins R, Fortunato E. Paper microfluidics and tailored gold nanoparticles for nonenzymatic, colorimetric multiplex biomarker detection. ACS Applied Materials & Interfaces. 2021;13:3576-90
94. Mercan ÖB, Kılıç V, Şen M. Machine learning-based colorimetric determination of glucose in artificial saliva with different reagents using a smartphone coupled μPAD. Sensors and Actuators B: Chemical. 2021;329:129037
95. Wang Y, Liu X, Chen P, Tran NT, Zhang J, Chia WS. et al. Smartphone spectrometer for colorimetric biosensing. Analyst. 2016;141:3233-8
96. Darabdhara G, Boruah PK, Das MR. Colorimetric determination of glucose in solution and via the use of a paper strip by exploiting the peroxidase and oxidase mimicking activity of bimetallic cu-pd nanoparticles deposited on reduced graphene oxide, graphitic carbon nitride, or MoS 2 nanosheets. Microchimica Acta. 2019;186:1-10
97. Zhang W, Li X, Cui T, Li S, Qian Y, Yue Y. et al. PtS2 nanosheets as a peroxidase-mimicking nanozyme for colorimetric determination of hydrogen peroxide and glucose. Microchimica Acta. 2021;188:1-9
98. Zhang P, Sun D, Cho A, Weon S, Lee S, Lee J. et al. Modified carbon nitride nanozyme as bifunctional glucose oxidase-peroxidase for metal-free bioinspired cascade photocatalysis. Nature communications. 2019;10:1-14
99. Muzny M, Henriksen A, Giordanengo A, Muzik J, Grøttland A, Blixgård H. et al. Wearable sensors with possibilities for data exchange: Analyzing status and needs of different actors in mobile health monitoring systems. International journal of medical informatics. 2020;133:104017
100. Jung S, Kim JH, Kim J, Choi S, Lee J, Park I. et al. Reverse-micelle-induced porous pressure-sensitive rubber for wearable human-machine interfaces. Advanced Materials. 2014;26:4825-30
101. Toi PT, Trung TQ, Dang TML, Bae CW, Lee N-E. Highly electrocatalytic, durable, and stretchable nanohybrid fiber for on-body sweat glucose detection. ACS applied materials & interfaces. 2019;11:10707-17
102. Hsu W-L, Huang C-Y, Hsu Y-P, Hwang T-L, Chang S-H, Wang H-YJ. et al. On-skin glucose-biosensing and on-demand insulin-zinc hexamers delivery using microneedles for syringe-free diabetes management. Chemical Engineering Journal. 2020;398:125536
103. Sun K, Yang Y, Zhou H, Yin S, Qin W, Yu J. et al. Ultrabright polymer-dot transducer enabled wireless glucose monitoring via a smartphone. ACS nano. 2018;12:5176-84
104. Koh A, Kang D, Xue Y, Lee S, Pielak RM, Kim J. et al. A soft, wearable microfluidic device for the capture, storage, and colorimetric sensing of sweat. Science translational medicine. 2016;8:366ra165-366ra165
105. Kudo H, Sawada T, Kazawa E, Yoshida H, Iwasaki Y, Mitsubayashi K. A flexible and wearable glucose sensor based on functional polymers with Soft-MEMS techniques. Biosensors and Bioelectronics. 2006;22:558-62
106. Yao H, Shum AJ, Cowan M, Lähdesmäki I, Parviz BA. A contact lens with embedded sensor for monitoring tear glucose level. Biosensors and Bioelectronics. 2011;26:3290-6
107. Kim J, Kim M, Lee M-S, Kim K, Ji S, Kim Y-T. et al. Wearable smart sensor systems integrated on soft contact lenses for wireless ocular diagnostics. Nature communications. 2017;8:1-8
108. Moreddu R, Elsherif M, Adams H, Moschou D, Cordeiro MF, Wolffsohn JS. et al. Integration of paper microfluidic sensors into contact lenses for tear fluid analysis. Lab on a Chip. 2020;20:3970-9
109. Song LF, Zhu Y, Yang ZZ, Wang C, Lu XF. Oxidase-mimicking activity of perovskite LaMnO3+ nanofibers and their application for colorimetric sensing. Journal of Materials Chemistry B. 2018;6:5931-9
110. Forest V, Leclerc L, Hochepied J-F, Trouvé A, Sarry G, Pourchez J. Impact of cerium oxide nanoparticles shape on their in vitro cellular toxicity. Toxicology in Vitro. 2017;38:136-41
111. Liu X, Gao Y, Chandrawati R, Hosta-Rigau L. Therapeutic applications of multifunctional nanozymes. Nanoscale. 2019;11:21046-60
112. Zhang Y, Wu Y, Zhang Y, Ozcan A. Color calibration and fusion of lens-free and mobile-phone microscopy images for high-resolution and accurate color reproduction. Scientific reports. 2016;6:1-14
113. Leem JW, Jeon H-J, Ji Y, Park SM, Kwak Y, Park J. et al. Edible Matrix Code with Photogenic Silk Proteins. ACS Central Science. 2022;8:513-26
114. Jeon H-J, Leem JW, Ji Y, Park SM, Park J, Kim KY. et al. Cyber-Physical Watermarking with Inkjet Edible Bioprinting. Advanced Functional Materials. 2022: 2112479.
115. Park SM, Visbal-Onufrak MA, Haque MM, Were MC, Naanyu V, Hasan MK. et al. mHealth spectroscopy of blood hemoglobin with spectral super-resolution. Optica. 2020;7:563-73
116. Tortorich RP, Shamkhalichenar H, Choi J-W. Inkjet-printed and paper-based electrochemical sensors. Applied Sciences. 2018;8:288
117. Falk M, Andoralov V, Silow M, Toscano MD, Shleev S. Miniature biofuel cell as a potential power source for glucose-sensing contact lenses. Analytical chemistry. 2013;85:6342-8
118. Kim J, Imani S, de Araujo WR, Warchall J, Valdés-Ramírez G, Paixão TR. et al. Wearable salivary uric acid mouthguard biosensor with integrated wireless electronics. Biosensors and Bioelectronics. 2015;74:1061-8
119. Farandos NM, Yetisen AK, Monteiro MJ, Lowe CR, Yun SH. Contact lens sensors in ocular diagnostics. Advanced healthcare materials. 2015;4:792-810
120. Bandodkar AJ, Jia W, Yardımcı C, Wang X, Ramirez J, Wang J. Tattoo-based noninvasive glucose monitoring: a proof-of-concept study. Analytical chemistry. 2015;87:394-8
121. Feng W, Chen L, Qin M, Zhou X, Zhang Q, Miao Y. et al. Flower-like PEGylated MoS2 nanoflakes for near-infrared photothermal cancer therapy. Scientific reports. 2015;5:1-13
122. Jang J, Kim J, Shin H, Park Y-G, Joo BJ, Seo H. et al. Smart contact lens and transparent heat patch for remote monitoring and therapy of chronic ocular surface inflammation using mobiles. Science Advances. 2021;7:eabf7194
123. Lin Y, Zhao M, Guo Y, Ma X, Luo F, Guo L. et al. Multicolor colormetric biosensor for the determination of glucose based on the etching of gold nanorods. Scientific reports. 2016;6:1-7
124. Zhang Z, Azizi M, Lee M, Davidowsky P, Lawrence P, Abbaspourrad A. A versatile, cost-effective, and flexible wearable biosensor for in situ and ex situ sweat analysis, and personalized nutrition assessment. Lab on a Chip. 2019;19:3448-60
125. Bandodkar AJ, Gutruf P, Choi J, Lee K, Sekine Y, Reeder JT. et al. Battery-free, skin-interfaced microfluidic/electronic systems for simultaneous electrochemical, colorimetric, and volumetric analysis of sweat. Science advances. 2019;5:eaav3294
126. Pomili T, Donati P, Pompa PP. Based Multiplexed Colorimetric Device for the Simultaneous Detection of Salivary Biomarkers. Biosensors. 2021;11:443
127. Gabriel EFM, Garcia PT, Lopes FM, Coltro WKT. Based colorimetric biosensor for tear glucose measurements. Micromachines. 2017;8:104
128. de Freitas SV, de Souza FcR, Rodrigues Neto JC, Vasconcelos GsA, Abdelnur PcV, Vaz BG. et al. Uncovering the formation of color gradients for glucose colorimetric assays on microfluidic paper-based analytical devices by mass spectrometry imaging. Analytical chemistry. 2018;90:11949-54
129. Kim GJ, Kim KO. Novel glucose-responsive of the transparent nanofiber hydrogel patches as a wearable biosensor via electrospinning. Scientific reports. 2020;10:1-12
130. Ali SMU, Nur O, Willander M, Danielsson B. A fast and sensitive potentiometric glucose microsensor based on glucose oxidase coated ZnO nanowires grown on a thin silver wire. Sensors and Actuators B: Chemical. 2010;145:869-74
131. Mani S, Ramaraj S, Chen S-M, Dinesh B, Chen T-W. Two-dimensional metal chalcogenides analogous NiSe2 nanosheets and its efficient electrocatalytic performance towards glucose sensing. Journal of colloid and interface science. 2017;507:378-85
132. Lin C, Du Y, Wang S, Wang L, Song Y. Glucose oxidase@ Cu-hemin metal-organic framework for colorimetric analysis of glucose. Materials Science and Engineering: C. 2021;118:111511
133. Radhakumary C, Sreenivasan K. Naked eye detection of glucose in urine using glucose oxidase immobilized gold nanoparticles. Analytical chemistry. 2011;83:2829-33
134. Huang P-H, Hong CP, Zhu JF, Chen T-T, Chan C-T, Ko Y-C. et al. Ag@ Au nanoprism-metal organic framework-based paper for extending the glucose sensing range in human serum and urine. Dalton Transactions. 2017;46:6985-93
135. Liao C, Zhang M, Niu L, Zheng Z, Yan F. Highly selective and sensitive glucose sensors based on organic electrochemical transistors with graphene-modified gate electrodes. Journal of Materials Chemistry B. 2013;1:3820-9
136. Tang B, Cao L, Xu K, Zhuo L, Ge J, Li Q. et al. A new nanobiosensor for glucose with high sensitivity and selectivity in serum based on fluorescence resonance energy transfer (FRET) between CdTe quantum dots and Au nanoparticles. Chemistry-A European Journal. 2008;14:3637-44
137. Paul A, Srivastava DN. Amperometric glucose sensing at nanomolar level using MOF-encapsulated TiO2 platform. Acs Omega. 2018;3:14634-40
138. Sun T-P, Shieh H-L, Ching CT-S, Yao Y-D, Huang S-H, Liu C-M. et al. Carbon nanotube composites for glucose biosensor incorporated with reverse iontophoresis function for noninvasive glucose monitoring. International journal of nanomedicine. 2010;5:343
139. Xuan X, Qian M, Pan L, Lu T, Han L, Yu H. et al. A longitudinally expanded Ni-based metal-organic framework with enhanced double nickel cation catalysis reaction channels for a non-enzymatic sweat glucose biosensor. Journal of Materials Chemistry B. 2020;8:9094-109
140. Jeerapan I, Sempionatto JR, Wang J. On-body bioelectronics: wearable biofuel cells for bioenergy harvesting and self-powered biosensing. Advanced Functional Materials. 2020;30:1906243
141. Cheng X, Zheng Z, Zhou X, Kuang Q. Metal-organic framework as a compartmentalized integrated nanozyme reactor to enable high-performance cascade reactions for glucose detection. ACS Sustainable Chemistry & Engineering. 2020;8:17783-90
142. Gu X, Wang H, Schultz ZD, Camden JP. Sensing glucose in urine and serum and hydrogen peroxide in living cells by use of a novel boronate nanoprobe based on surface-enhanced Raman spectroscopy. Analytical chemistry. 2016;88:7191-7
143. Fu Q, Zhou X, Wang M, Su X. Nanozyme-based sensitive ratiometric fluorescence detection platform for glucose. Analytica Chimica Acta. 2022: 339993.
144. Kim H-M, Kim W-J, Kim K-O, Park J-H, Lee S-K. Performance improvement of a glucose sensor based on fiber optic localized surface plasmon resonance and anti-aggregation of the non-enzymatic receptor. Journal of Alloys and Compounds. 2021;884:161140
145. Pullano SA, Greco M, Bianco MG, Foti D, Brunetti A, Fiorillo AS. Glucose biosensors in clinical practice: Principles, limits and perspectives of currently used devices. Theranostics. 2022;12:493
146. Zhang R, Gao F, Feng X, Jin H, Zhang S, Liu S. et al. “Guide star” assisted noninvasive photoacoustic measurement of glucose. ACS sensors. 2018;3:2550-7
147. Sapountzi E, Braiek M, Vocanson F, Chateaux J-F, Jaffrezic-Renault N, Lagarde F. Gold nanoparticles assembly on electrospun poly (vinyl alcohol)/poly (ethyleneimine)/glucose oxidase nanofibers for ultrasensitive electrochemical glucose biosensing. Sensors and Actuators B: Chemical. 2017;238:392-401
148. Xu C, Jiang D, Ge Y, Huang L, Xiao Y, Ren X. et al. A PEDOT: PSS conductive hydrogel incorporated with Prussian blue nanoparticles for wearable and noninvasive monitoring of glucose. Chemical Engineering Journal. 2022;431:134109
149. Huang Z, Zheng L, Feng F, Chen Y, Wang Z, Lin Z. et al. A simple and effective colorimetric assay for glucose based on MnO2 nanosheets. Sensors. 2018;18:2525
150. Thanh TD, Balamurugan J, Hwang JY, Kim NH, Lee JH. In situ synthesis of graphene-encapsulated gold nanoparticle hybrid electrodes for non-enzymatic glucose sensing. Carbon. 2016;98:90-8
151. Ensafi AA, Zandi-Atashbar N, Rezaei B, Ghiaci M, Taghizadeh M. Silver nanoparticles decorated carboxylate functionalized SiO2, new nanocomposites for non-enzymatic detection of glucose and hydrogen peroxide. Electrochimica Acta. 2016;214:208-16
152. German N, Kausaite-Minkstimiene A, Ramanavicius A, Semashko T, Mikhailova R, Ramanaviciene A. The use of different glucose oxidases for the development of an amperometric reagentless glucose biosensor based on gold nanoparticles covered by polypyrrole. Electrochimica acta. 2015;169:326-33
153. Sakdaphetsiri K, Thaweeskulchai T, Schulte A. Rapid sub-micromolar amperometric enzyme biosensing with free substrate access but without nanomaterial signalling support: oxidase-based glucose detection as a proof-of-principle example. Chemical Communications. 2020;56:7132-5
154. Qin W, Wang K, Xiao K, Hou Y, Lu W, Xu H. et al. Carcinoembryonic antigen detection with “Handing”-controlled fluorescence spectroscopy using a color matrix for point-of-care applications. Biosensors and Bioelectronics. 2017;90:508-15
155. Cetin AE, Coskun AF, Galarreta BC, Huang M, Herman D, Ozcan A. et al. Handheld high-throughput plasmonic biosensor using computational on-chip imaging. Light: Science & Applications. 2014;3:e122-e
156. Gorai T, Schmitt W, Gunnlaugsson T. Highlights of the development and application of luminescent lanthanide based coordination polymers, MOFs and functional nanomaterials. Dalton Transactions. 2021;50:770-84
157. Rettcher S, Jungk F, Kühn C, Krause H-J, Nölke G, Commandeur U. et al. Simple and portable magnetic immunoassay for rapid detection and sensitive quantification of plant viruses. Applied and environmental microbiology. 2015;81:3039-48
158. Shipunova V, Nikitin M, Nikitin P, Deyev S. MPQ-cytometry: a magnetism-based method for quantification of nanoparticle-cell interactions. Nanoscale. 2016;8:12764-72
159. Liu J, Du J, Su Y, Zhao H. A facile solvothermal synthesis of 3D magnetic MoS2/Fe3O4 nanocomposites with enhanced peroxidase-mimicking activity and colorimetric detection of perfluorooctane sulfonate. Microchemical Journal. 2019;149:104019
160. Zheng J, Zhang W, Lin Z, Wei C, Yang W, Dong P. et al. Microwave synthesis of 3D rambutan-like CuO and CuO/reduced graphene oxide modified electrodes for non-enzymatic glucose detection. Journal of Materials Chemistry B. 2016;4:1247-53
161. Jagadeesan M, Movlaee K, Krishnakumar T, Leonardi S, Neri G. One-step microwave-assisted synthesis and characterization of novel CuO nanodisks for non-enzymatic glucose sensing. Journal of Electroanalytical Chemistry. 2019;835:161-8
162. Ortiz-Gómez I, Salinas-Castillo A, García AG, Álvarez-Bermejo JA, de Orbe-Payá I, Rodríguez-Diéguez A. et al. Microfluidic paper-based device for colorimetric determination of glucose based on a metal-organic framework acting as peroxidase mimetic. Microchimica Acta. 2018;185:1-8
163. Alizadeh N, Salimi A, Hallaj R. Mimicking peroxidase-like activity of Co3O4-CeO2 nanosheets integrated paper-based analytical devices for detection of glucose with smartphone. Sensors and Actuators B: Chemical. 2019;288:44-52
164. Lertvachirapaiboon C, Maruyama T, Baba A, Ekgasit S, Shinbo K, Kato K. Optical sensing platform for colorimetric determination of silver nanoprisms and its application for hydrogen peroxide and glucose detections using a mobile device camera. Analytical Sciences. 2018: 18P412.
165. Xiao G, He J, Chen X, Qiao Y, Wang F, Xia Q. et al. A wearable, cotton thread/paper-based microfluidic device coupled with smartphone for sweat glucose sensing. Cellulose. 2019;26:4553-62
166. Wang X, Li F, Cai Z, Liu K, Li J, Zhang B. et al. Sensitive colorimetric assay for uric acid and glucose detection based on multilayer-modified paper with smartphone as signal readout. Analytical and bioanalytical chemistry. 2018;410:2647-55
167. Jalal UM, Jin GJ, Shim JS. Paper-plastic hybrid microfluidic device for smartphone-based colorimetric analysis of urine. Analytical chemistry. 2017;89:13160-6
168. Jia Y, Sun H, Li X, Sun D, Hu T, Xiang N. et al. based graphene oxide biosensor coupled with smartphone for the quantification of glucose in oral fluid. Biomedical microdevices. 2018;20:1-9
169. Wang H-C, Chang F-Y, Tsai T-M, Chen C-H, Chen Y-Y. Design, fabrication, and feasibility analysis of a colorimetric detection system with a smartphone for self-monitoring blood glucose. Journal of biomedical optics. 2019;24:027002
170. Erenas MM, Carrillo-Aguilera B, Cantrell K, Gonzalez-Chocano S, de Vargas-Sansalvador IMP, de Orbe-Payá I. et al. Real time monitoring of glucose in whole blood by smartphone. Biosensors and Bioelectronics. 2019;136:47-52
171. Chen L, Zhang C, Xing D. based bipolar electrode-electrochemiluminescence (BPE-ECL) device with battery energy supply and smartphone read-out: a handheld ECL system for biochemical analysis at the point-of-care level. Sensors and Actuators B: Chemical. 2016;237:308-17
172. Choi S, Kim S-K, Lee G-J, Park H-K. based 3D microfluidic device for multiple bioassays. Sensors and Actuators B: Chemical. 2015;219:245-50
173. Hosu O, Lettieri M, Papara N, Ravalli A, Sandulescu R, Cristea C. et al. Colorimetric multienzymatic smart sensors for hydrogen peroxide, glucose and catechol screening analysis. Talanta. 2019;204:525-32
174. Pla-Tolós J, Moliner-Martínez Y, Molins-Legua C, Campíns-Falcó P. Solid glucose biosensor integrated in a multi-well microplate coupled to a camera-based detector: application to the multiple analysis of human serum samples. Sensors and Actuators B: Chemical. 2018;258:331-41
175. Chun HJ, Han YD, Park YM, Kim KR, Lee SJ, Yoon HC. An optical biosensing strategy based on selective light absorption and wavelength filtering from chromogenic reaction. Materials. 2018;11:388
176. Gosselin D, Belgacem M, Joyard-Pitiot B, Baumlin J, Navarro F, Chaussy D. et al. Low-cost embossed-paper micro-channels for spontaneous capillary flow. Sensors and Actuators B: Chemical. 2017;248:395-401
177. Li F, Wang X, Liu J, Hu Y, He J. Double-layered microfluidic paper-based device with multiple colorimetric indicators for multiplexed detection of biomolecules. Sensors and Actuators B: Chemical. 2019;288:266-73
178. Li J, Sun Y, Chen C, Sheng T, Liu P, Zhang G. A smartphone-assisted microfluidic chemistry analyzer using image-based colorimetric assays for multi-index monitoring of diabetes and hyperlipidemia. Analytica chimica acta. 2019;1052:105-12
179. Baş D. Sensitive and reliable paper-based glucose sensing mechanisms with smartphone readout using the L* a* b* color space. Analytical Methods. 2017;9:6698-704
180. Jia M-Y, Wu Q-S, Li H, Zhang Y, Guan Y-F, Feng L. The calibration of cellphone camera-based colorimetric sensor array and its application in the determination of glucose in urine. Biosensors and Bioelectronics. 2015;74:1029-37
181. Wu Y, Boonloed A, Sleszynski N, Koesdjojo M, Armstrong C, Bracha S. et al. Clinical chemistry measurements with commercially available test slides on a smartphone platform: Colorimetric determination of glucose and urea. Clinica Chimica Acta. 2015;448:133-8
182. Zheng J, Zhu M, Kong J, Li Z, Jiang J, Xi Y. et al. Microfluidic paper-based analytical device by using Pt nanoparticles as highly active peroxidase mimic for simultaneous detection of glucose and uric acid with use of a smartphone. Talanta. 2022;237:122954
183. Chun HJ, Park YM, Han YD, Jang YH, Yoon HC. based glucose biosensing system utilizing a smartphone as a signal reader. BioChip Journal. 2014;8:218-26
184. Yetisen AK, Martinez-Hurtado J, Garcia-Melendrez A, da Cruz Vasconcellos F, Lowe CR. A smartphone algorithm with inter-phone repeatability for the analysis of colorimetric tests. Sensors and actuators B: chemical. 2014;196:156-60
185. Wu X, Chen T, Chen Y, Yang G. Modified Ti3C2 nanosheets as peroxidase mimetics for use in colorimetric detection and immunoassays. Journal of Materials Chemistry B. 2020;8:2650-9
186. Kou X, Tong L, Shen Y, Zhu W, Yin L, Huang S. et al. Smartphone-assisted robust enzymes@ MOFs-based paper biosensor for point-of-care detection. Biosensors and Bioelectronics. 2020;156:112095
187. He X, Tan L, Chen D, Wu X, Ren X, Zhang Y. et al. Fe3O4-au@ mesoporous SiO2 microspheres: an ideal artificial enzymatic cascade system. Chemical Communications. 2013;49:4643-5
188. Qu K, Shi P, Ren J, Qu X. Nanocomposite incorporating V2O5 nanowires and gold nanoparticles for mimicking an enzyme cascade reaction and its application in the detection of biomolecules. Chemistry-A European Journal. 2014;20:7501-6
189. Zhang H, Liang X, Han L, Li F. “Non-Naked” Gold with Glucose Oxidase-Like Activity: A Nanozyme for Tandem Catalysis. Small. 2018;14:1803256
190. Wang T-T, Guo K, Hu X-M, Liang J, Li X-D, Zhang Z-F. et al. Label-free colorimetric detection of urine glucose based on color fading using smartphone ambient-light sensor. Chemosensors. 2020;8:10
191. Zhang J, Dai X, Song Z-L, Han R, Ma L, Fan G-C. et al. One-pot enzyme-and indicator-free colorimetric sensing of glucose based on MnO2 nano-oxidizer. Sensors and Actuators B: Chemical. 2020;304:127304
192. Sengupta P, Pramanik K, Datta P, Sarkar P. Chemically modified carbon nitride-chitin-acetic acid hybrid as a metal-free bifunctional nanozyme cascade of glucose oxidase-peroxidase for “click off” colorimetric detection of peroxide and glucose. Biosensors and Bioelectronics. 2020;154:112072
193. Rashtbari S, Dehghan G, Amini M. An ultrasensitive label-free colorimetric biosensor for the detection of glucose based on glucose oxidase-like activity of nanolayered manganese-calcium oxide. Analytica chimica acta. 2020;1110:98-108
194. Chen M, Zhou H, Liu X, Yuan T, Wang W, Zhao C. et al. Single iron site nanozyme for ultrasensitive glucose detection. Small. 2020;16:2002343
195. Zeng G, Duan M, Xu Y, Ge F, Wang W. Platinum (II)-doped graphitic carbon nitride with enhanced peroxidase-like activity for detection of glucose and H2O2. Spectrochimica Acta Part A: Molecular and Biomolecular Spectroscopy. 2020;241:118649
196. Qu L, Fang X, Xie T, Xu H, Yang G, Liu W. Nanozyme-catalyzed cascade reactions for high-sensitive glucose sensing and efficient bacterial killing. Sensors and Actuators B: Chemical. 2022;353:131156
197. Cui Y, Lai X, Liu K, Liang B, Ma G, Wang L. Ginkgo Biloba leaf polysaccharide stabilized palladium nanoparticles with enhanced peroxidase-like property for the colorimetric detection of glucose. RSC Advances. 2020;10:7012-8
198. Feng J, Huang P, Wu F-Y. Gold-platinum bimetallic nanoclusters with enhanced peroxidase-like activity and their integrated agarose hydrogel-based sensing platform for the colorimetric analysis of glucose levels in serum. Analyst. 2017;142:4106-15
199. Lu J, Zhang H, Li S, Guo S, Shen L, Zhou T. et al. Oxygen-vacancy-enhanced peroxidase-like activity of reduced Co3O4 nanocomposites for the colorimetric detection of H2O2 and glucose. Inorganic chemistry. 2020;59:3152-9
200. Wei H, Wang E. Fe3O4 magnetic nanoparticles as peroxidase mimetics and their applications in H2O2 and glucose detection. Analytical Chemistry. 2008;80:2250-4
201. Jv Y, Li B, Cao R. Positively-charged gold nanoparticles as peroxidiase mimic and their application in hydrogen peroxide and glucose detection. Chem Commun. 2010;46:8017-9
202. Jiao X, Song H, Zhao H, Bai W, Zhang L, Lv Y. Well-redispersed ceria nanoparticles: promising peroxidase mimetics for H2O2 and glucose detection. Analytical Methods. 2012;4:3261-7
203. Shi W, Wang Q, Long Y, Cheng Z, Chen S, Zheng H. et al. Carbon nanodots as peroxidase mimetics and their applications to glucose detection. Chemical Communications. 2011;47:6695-7
204. Xia Y, Ye J, Tan K, Wang J, Yang G. Colorimetric visualization of glucose at the submicromole level in serum by a homogenous silver nanoprism-glucose oxidase system. Analytical chemistry. 2013;85:6241-7
205. Kang F, Hou X, Xu K. Highly sensitive colorimetric detection of glucose in a serum based on DNA-embeded Au@ Ag core-shell nanoparticles. Nanotechnology. 2015;26:405707
206. Lin L, Song X, Chen Y, Rong M, Zhao T, Wang Y. et al. Intrinsic peroxidase-like catalytic activity of nitrogen-doped graphene quantum dots and their application in the colorimetric detection of H2O2 and glucose. Analytica chimica acta. 2015;869:89-95
207. Han L, Zeng L, Wei M, Li CM, Liu A. AV2O3-ordered mesoporous carbon composite with novel peroxidase-like activity towards the glucose colorimetric assay. Nanoscale. 2015;7:11678-85
208. Solmaz ME, Mutlu AY, Alankus G, Kılıç V, Bayram A, Horzum N. Quantifying colorimetric tests using a smartphone app based on machine learning classifiers. Sensors and Actuators B: Chemical. 2018;255:1967-73
209. Kim H, Awofeso O, Choi S, Jung Y, Bae E. Colorimetric analysis of saliva-alcohol test strips by smartphone-based instruments using machine-learning algorithms. Applied Optics. 2017;56:84-92
210. Doğan V, Yüzer E, Kılıç V, Şen M. Non-enzymatic colorimetric detection of hydrogen peroxide using a μPAD coupled with a machine learning-based smartphone app. Analyst. 2021;146:7336-44
211. Tania MH, Lwin KT, Shabut AM, Abu-Hassan KJ, Kaiser MS, Hossain MA. Assay type detection using advanced machine learning algorithms. 2019 13th International Conference on Software, Knowledge, Information Management and Applications (SKIMA): IEEE. 2019:1-8
212. Sasaki Y, Hamedpour V, Kubota R, He Y, Torii Y, Minami T. Facile indicator displacement assay-based supramolecular chemosensor: quantitative colorimetric determination of xylose and glucose in the presence of ascorbic acid. Chemistry Letters. 2019;48:1368-70
213. Mutlu AY, Kılıç V, Özdemir GK, Bayram A, Horzum N, Solmaz ME. Smartphone-based colorimetric detection via machine learning. Analyst. 2017;142:2434-41
214. Huang R, Zhou Y, Hu J. Deep Learning-Assisted Fe3o4 Nps for In-Situ Visual Recognition of Multi-Dimensional Information on Latent Fingerprints. 2022: 132020.
Author Biographies
 Dr. Dong Yun Lee is a professor in the Department of Bioengineering, College of Engineering, Hanyang University, Seoul, Republic of Korea. He has coauthored over 115 publications in journals including Science Advances, Journal of the American Chemical Society, Journal of Nanobiotechnology, Nano Letters, Bioactive Materials, and Biomaterials. He holds more than 45 domestic and international patents. He is also the founder & CEO of Elixir Pharmatech Inc., Seoul, Republic of Korea. The current research interests in Professor Lee's group include: (1) self-respiratory materials for tissue engineering, (2) nanomedicine (gold & ironic nanoparticles) for theranostics, (3) smart contact lens for early diagnosis, and (4) chemical-based anti-inflammatory medication.
 Dr. Euiheon Chung is a professor of the Department of Biomedical Science and Engineering, Gwangju Institute of Science and Technology (GIST), and is the Gliopathic Pain Research Center director. He holds B.S. and M.S. from Korea Advanced Institute of Science and Technology (KAIST) and Ph.D. from the Harvard-MIT Division of Health Sciences and Technology (HST) at MIT, followed by postdoctoral training at the Massachusetts General Hospital and Harvard Medical School. Dr. Chung has authored over 76 publications, including Nature Methods, Nature Reviews Clinical Oncology, PNAS, Nano Letters, Optica and dozens of domestic and international patents. He currently runs the Neurophotonics Lab at GIST.
 Dr. Hee-Jae Jeon is a professor of the Department of Mechanical and Biomedical engineering, Kangwon National University. He holds Ph.D. degree from the Department of Biomedical Science and Engineering at GIST, followed by postdoctoral training in the Weldon School of Biomedical Engineering at the Purdue University. Dr. Jeon research is centered on development of biomedical optics, mobile phone-based digital health care, and machine learning-based image processing.
 Dr. Hyung Shik Kim obtained his Ph.D. degree from the Department of Bioengineering, Hanyang University in 2022 under the supervision of Prof. Dong Yun Lee. He is now working as a post-Doc. Fellow in the same current group. His research is centered on development of gold nanoparticle-based anticancer therapy.
![]() Corresponding authors: Dong Yun Lee, Ph.D., Department of Bioengineering, College of Engineering, and BK FOUR Biopharmaceutical Innovation Leader for Education and Research Group, and Institute of Nano Science and Technology (INST) & Institute for Bioengineering and Biopharmaceutical Research (IBBR), Hanyang University, and Elixir Pharmatech Inc., 222 Wangsimni-ro, Seongdong-gu, Seoul 04763, Republic of Korea. Tel: +82-2-2220-2348; fax: +82-2-2220-4741; e-mail: dongyunleeac.kr. Euiheon Chung, Ph.D., Department of Biomedical Science and Engineering, Gwangju Institute of Science and Technology, 123 Cheomdan Gwagi-ro, Buk-gu, Gwangju 61005, Republic of Korea. Tel: +82-62-715-2753; fax: +82-62-715-5309; e-mail: ogong50ac.kr
Corresponding authors: Dong Yun Lee, Ph.D., Department of Bioengineering, College of Engineering, and BK FOUR Biopharmaceutical Innovation Leader for Education and Research Group, and Institute of Nano Science and Technology (INST) & Institute for Bioengineering and Biopharmaceutical Research (IBBR), Hanyang University, and Elixir Pharmatech Inc., 222 Wangsimni-ro, Seongdong-gu, Seoul 04763, Republic of Korea. Tel: +82-2-2220-2348; fax: +82-2-2220-4741; e-mail: dongyunleeac.kr. Euiheon Chung, Ph.D., Department of Biomedical Science and Engineering, Gwangju Institute of Science and Technology, 123 Cheomdan Gwagi-ro, Buk-gu, Gwangju 61005, Republic of Korea. Tel: +82-62-715-2753; fax: +82-62-715-5309; e-mail: ogong50ac.kr