Impact Factor
- Issue 14; 2026
- Issue 13; 2026
- Issue 12; 2026
- Issue 11; 2026
- Issue 10; 2026
- Volume 16; 2026
- Advance Articles
- Past Issues
- Cover Images
- Cover Suggestion
- Index & Coverage
- Special Issues
Introduction
Results
Discussion
Materials and Methods
Supplementary Material
Acknowledgements
References
International Journal of Biological Sciences
International Journal of Medical Sciences
 Global reach, higher impact

Theranostics 2015; 5(7):724-732. doi:10.7150/thno.10734 This issue Cite
Research Paper
Longitudinal Tracing of Spontaneous Regression and Anti-angiogenic Response of Individual Microadenomas during Colon Tumorigenesis
Jin Woo Choi1,2,3 ![]() , Pilhan Kim4, Jun Ki Kim5, Yi Rang Kim4,6,7, Dai Fukumura8, Seok Hyun Yun1,4
, Pilhan Kim4, Jun Ki Kim5, Yi Rang Kim4,6,7, Dai Fukumura8, Seok Hyun Yun1,4 ![]()
1. Harvard Medical School and Wellman Center for Photomedicine, Massachusetts General Hospital, 40 Blossom St., Boston, MA 02114, USA
2. Department of Pharmacology and Dental Research Institute, School of Dentistry / Department of Smart Life-Care Convergence Graduate School, Wonkwang University, Iksan, Chonbuk 570-749, Korea
3. Advanced Institute of Convergence Technology, Seoul National University, Suwon Gyeonggi-do 443-270, Korea
4. Graduate School of Nanoscience and Technology, Korea Advanced Institute of Science and Technology, 291 Daehak-Ro, Yusong-Gu, Daejeon 305-701, Korea
5. Biomedical Engineering Research Center, Asan Institute for Life Sciences, Asan Medical Center and University of Ulsan College of Medicine, Seoul 138-736, Korea
6. Graduate School of Medical Science and Engineering, Korea Advanced Institute of Science and Technology, 291 Daehak-Ro, Yusong-Gu, Daejeon 305-701, Korea
7. Department of Oncology, Asan Medical Center, University of Ulsan College of Medicine, Seoul 138-736, Korea
8. Edwin L. Steele Lab of Tumor Biology, Department of Radiation Oncology, Massachusetts General Hospital, Boston, MA 02114, USA
Received 2014-10-6; Accepted 2015-2-11; Published 2015-4-1
Abstract

Angiogenesis is essential for the progression of cancer, but its involvement in the initial phase of colon tumorigenesis is not well understood. Using intravital endomicroscopy, we visualized the natural history of early pre-tumorous lesions and adenomas in the colon of conditional Apc-knockout and Apc/Kras double mutant mouse models. Early lesions emerged about 4 weeks after the onset of somatic mutations, accompanying vascular dilation when the size of lesions reached about 200 μm, but most lesions regressed spontaneously and cleared within 10 weeks after their emergence. Anti-angiogenic treatments with vascular endothelial growth factor receptor (VEGFR) antagonists reduced the size of the early lesions and the number of polyps. We found surprisingly that anti-angiogenic treatments delayed the natural clearance of transient lesions by up to several weeks in both genetic models. The results represent the previously unexpected role of early angiogenesis on the spontaneous regression of early-stage colon tumors.
Keywords: Angiogenesis, tumorigenesis, colon tumor
Introduction
In cancer development, angiogenesis is essential for the growth of tumor. Angiogenesis plays a critical role by supplying oxygen and nutrients to the cancer and other cells constituting the tumor [1, 2]. In colorectal cancer, angiogenesis is generally known to begin in a quite early stage of tumorigenesis, compared to other types of cancer [3, 4]. Some hallmarks of angiogenesis, such as increased vascular density, appear even in aberrant crypt foci (ACF) [5-7]. Therapy aimed at inhibiting angiogenesis has promise for the treatment for colon cancer. Most clinical and basic research on angiogenesis and anti-angiogenic therapy has focused on the late stages of malignant carcinomas and metastasis. Understanding the role of angiogenesis in early colon tumorigenesis is expected to provide insights into early intervention or preventive care of colon cancer.
Here, we describe an in vivo imaging study of angiogenesis in conditionally inducible, genetically modified murine models of colon tumor. Conditional knockout of the adenomatous polyposis coli (Apc) gene in the colon mimics a somatic mutation found in the majority of patients with colon cancer [8]. Further mutations in specific oncogenes and tumor-suppressor genes, such as Kras and p53, promote the development of colon cancer by increasing the aggressiveness of cancer [9, 10]. In this study, we used two transgenic mouse models in which inactivation of Apc and expression of mutated-Kras can be induced by administration of Cre into the colon, and the mutated cells are tagged by constitutive expression of enhanced green fluorescent protein (eGFP) [11]. The use of fluorescent proteins and developments in optical imaging technology permit the direct observation of cancer cells in their original sites [12, 13] and observe the dynamic processes of tumor growth [14]. Here, we used our recently developed, confocal endomicroscope [15] to track the natural history of individual tumors in vivo and over time during spontaneous tumorigenesis in the murine colon. We longitudinally monitored the tumors in mice treated with anti-angiogenic agents, DC101, a monoclonal antibody against murine vascular endothelial growth factor receptor (VEGFR) 2 [16], and sunitinib, a tyrosine kinase inhibitor that blocks VEGFRs [17]. Our finding revealed remarkable, unexpected effects of anti-angiogenic therapy on the natural clearance of micro-adenomas.
Results
Mouse models of spontaneous colon tumorigenesis show regression of initial lesions
We used two different transgenic mouse models in which the administration of adeno-Cre into the distal colon induces Apc knockout alone (the Apc mouse) or both Apc knockout and mutant Kras (G12D) activation (the Apc-Kras mouse), accompanied by eGFP expression (see Materials and Methods section) [11]. Using in vivo confocal endomicroscopy, we monitored the growth pattern of eGFP-expressing tumors from the week of administration for 3-4 months at intervals of 1-2 weeks. In Apc mice, within 1-3 weeks after adeno-Cre administration, many small eGFP-expressing legions appeared in the colon (Fig. 1A). Some legions apparently consisted of a single or a few cells at the time of their first detection. Most of these lesions regressed or disappeared before week 10 [15]. However, the rest, remaining lesions grew to become large adenomas (Fig. 1B). Apc/Kras mice exhibited a similar growth pattern, but they developed about 3 times more lesions than the Apc mice (Fig. 1C and D). Also, the growth speed of the lesions appeared to be faster than the Apc mice. At weeks 4 to 5, the typical size of the lesions ranged from 200 to 600 µm in diameter in the Apc/Kras mice, compared to the size of 200 to 400 µm in the Apc mice (Fig. 1D and S1). Similar to the Apc mice, most lesions in the Apc/Kras mice disappeared by week 12 (Supplementary Material: Fig. S1).
In vivo visualization of the natural evolution of colorectal tumors following conditional genetic modification in situ. A, In vivo confocal fluorescence image showing two GFP-positive lesions (green) in the colon of an Apc mouse at week 2 after adeno-cre administration. Blood vessels were visualized with TRITC-Dextran (red). Arrow and dotted circle indicate the eGFP expression at the single-cell level. B, Time-lapse images of a growing adenoma in an Apc mouse. C, In vivo image of a group of GFP-positive micro-adenomas in the colon of an Apc/Kras mouse at week 2. D, Time-lapse images of a continuously growing adenoma in an Apc/Kras mouse. E, A colonoscopy image showing a polyp in an Apc mouse at week 20. F, The percentage of transient lesions among the total lesions. The remaining lesions became polyps. G, The number of polyps per mouse was counted at week 20. Error bars represent standard deviations. ***, P < 0.001. The number (n) of mice is indicated. H, Excised tissue section showing a polyp at week 20. I, Fluorescence immunohistochemistry image of a eGFP-positive macro-adenoma. Scale bars, 250 µm in A-D, 5 mm in H, and 1 mm in I.
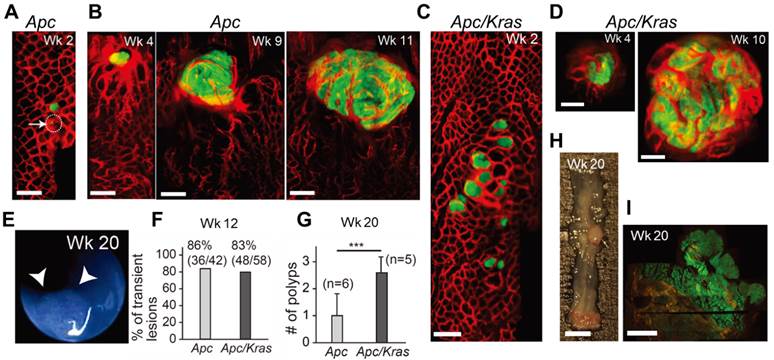
After week 12, the remaining adenomas grew to a size greater than 1 mm and protruded from the colon wall. In this later stage of tumorigenesis, we used white-light mouse colonoscopy [18] to measure tumor sizes (Fig. 1E). Of 92 total lesions in Apc mice (n=6) and Apc/Kras mice (n=6), 86% (36/42) in the Apc mice and 83% (48/58) in the Apc/Kras mice cleared by week 12 (Fig. 1F). At week 20, the Apc mice had, on average, one polyp per mouse in the distal colon, whereas the Apc/Kras mice had 2-3 polyps per mouse (Fig. 1G). Ex vivo examinations performed at weeks 12-20 confirmed the expression of eGFP in the polyps (Fig. 1H and I).
Vessel dilation and leakage in the elevated lesions
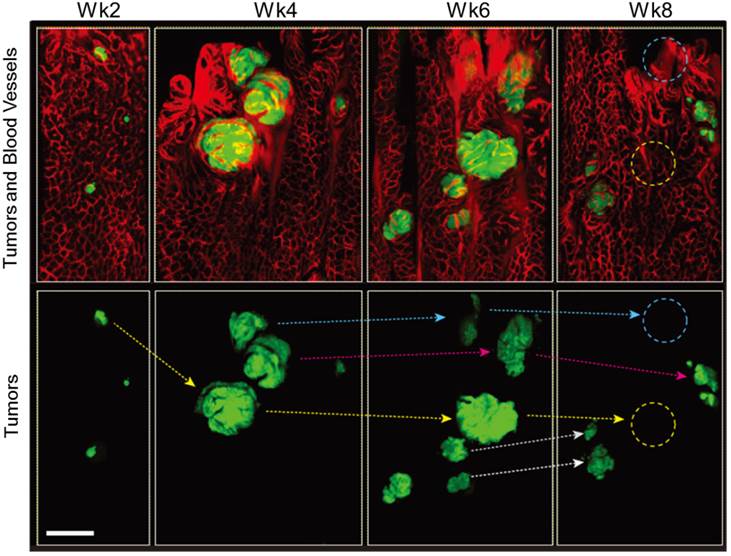
As the lesions grew in size, the distance between blood vessels and the diameter of the vessels increased in both Apc and Apc/Kras mice (Fig. 1B and D). The relative density of vessels was time invariant (Supplementary Material: Fig. S2). The apparent vascular dilation and leakage of intravascular fluorescence dye, which are signs of angiogenesis, were observed as early as week 4 in the lesions that were larger than 100-200 μm, similar to a typical oxygen-diffusion distance of 100 μm in tissue. When tumor size exceeded about 200 µm, the tumors exhibited typical characteristics of tumor vessels, such as tortuous patterns and vascular dilation (Fig. 1B and D). The vasculature around the transient lesions was qualitatively changed out of shape (Fig. 2). Interestingly, after the transient lesions regressed and disappeared, the blood vessels appeared to regain normal morphology over time (Fig. 2; see the region marked with yellow circle in Week 8) or to be abated compared with before (Fig. 2; see the region marked with blue circle in Week 8).
In vivo tracing of transient tumors in an Apc/Kras double mutant mouse. Top panels show two-color fluorescence images of approximately the same region in the colon imaged biweekly after adeno-cre administration. Green, eGFP-positive tumors; red, Rhodamine dextran-positive blood vessels. Lower panel shows tracing (arrows) of individual tumors identified with reference to the vasculature and distribution of lesions. Blue or yellow-dotted regions show the region where tumor disappeared. Scale bar, 250 µm.
The effects of anti-angiogenic therapy on the growth of transient micro-adenomas
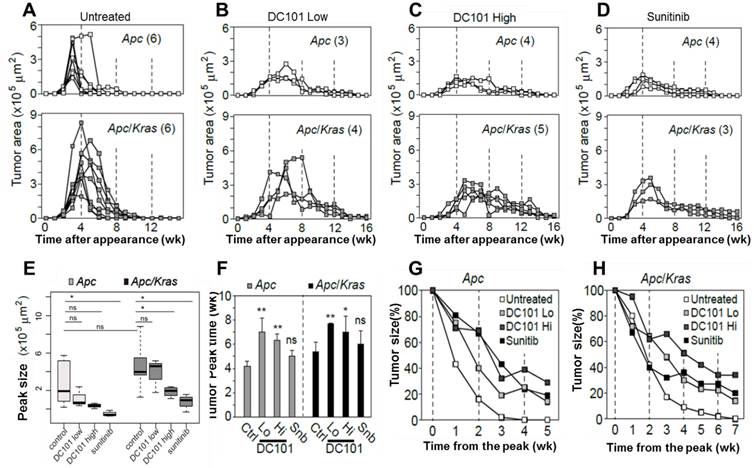
The observation of early angiogenesis led us to inquire whether anti-angiogenic therapy affected the development and kinetics of transient lesions. We treated Apc mice (n=3) and Apc/Kras mice (n=3) from week 1 with DC101 (10 or 40 mg/kg, once every three days) or sunitinib (40 mg/kg, every day). We tracked individual eGFP-positive regions in the treated and untreated animal groups by endomicroscopy every week. From the time-lapse images, the growth profiles of individual lesions were determined (Fig. 3A-D). The lifespan of transient lesions before complete disappearance ranged from 6 to 9 week for Apc mice and 8 to 10 weeks for Apc/Kras mice (Fig. 3A). Anti-angiogenic treatments substantially altered the growth kinetics (Fig. 3B-D). The average peak size of the lesions commonly showed decreasing propensity in Apc or Apc/Kras mice when anti-angiogenic treatments were administered (Fig. 3E). The growth period of the lesions, the duration from their first appearance till reaching a peak size, was 3-4 weeks for the Apc mice and 4-6 weeks for the Apc/Kras mice in the absence of treatment. Anti-angiogenic treatment lengthened the growth period by 1-3 weeks (Fig. 3F). Interestingly, the total lifespan of the lesions increased significantly from 6-10 weeks without the treatments to 14-18 weeks with the treatments (Fig S3). This extended period is mostly due to the slower rate of regression. For the Apc mice, treatment with a low dose of DC101 (10 mg/kg) or sunitinib delayed the lesion clearance by 2-3 weeks, and high-dose DC101 (40 mg/kg) treatment lengthened the existence of the transient lesions by 3-4 weeks (Fig. 3G and Supplementary Material: Fig. S3). In Apc/Kras mice, the life time was extended by approximately 2 weeks with the treatment with low-dose DC101 or sunitinib, and by 4 weeks with high-dose DC101 treatment (Fig. 3H and Supplementary Material: Fig. S3). Taken together, our data indicate that the anti-angiogenic treatments significantly influenced not only the growth but also the clearance of early transient adenomas.
Quantitative time-lapse measurement of transient micro-adenomas after anti-angiogenic treatment. A-D, The measured growth curves of individual eGFP-positive lesions in the Apc (upper panel) and Apc/Kras (lower panel) mice in different treatment groups: (A) non-treated control and treated with (B) low-dose DC101 (10 mg/kg), (C) high-dose DC101 (40 mg/kg), and (D) sunitinib (40 mg/kg). The numbers in parentheses in (A-D) indicate the number of microadenoma examined for each case. E, The maximum tumor area from each mouse was measured from the longitudinal monitoring data in Fig. 3A-D. The differences between animal groups were statistically analyzed using Wilcoxon rank sum test. ns, not significant; *, P < 0.05.F, The time point of maximum growth of micro-adenomas after genetic mutation. ns, not significant; *, P < 0.05; **, P < 0.005. G-H, Regression curve of tumor size normalized to the peak size for (G) Apc and (H) Apc/Kras mice.
The effects of anti-angiogenic therapy on macro-adenomas
To investigate the growth and incidence rate of macro-adenomas, we treated Apc mice (n=5) and Apc/Kras mice (n=5) from week 1 with DC101 once every three days or with sunitinib every day. At week 8 in untreated controls, the average size of non-transient, continuously growing adenomas in untreated Apc mice was approximately 400-500 μm in diameter or 0.2 mm2 in area (Fig. 4A). The tumor size in untreated Apc/Kras mice were slightly but not statistically significantly larger than that of Apc tumor (Fig. 4A). In the Apc mice treated with DC101 or sunitinib, the tumor size at week 8 was approximately 30% smaller than in untreated mice on average (Fig. 4A). Similarly, the treated Apc/Kras mice showed 40% reduction in tumor area (Fig. 4A).
The effects of anti-angiogenic therapy on continuously growing tumors. A, Tumor area at week 8. ns, not significant; *, P < 0.05. B, The number of polyps at week 20. Snb, sunitinib (40 mg/kg); DC101 Hi, high dose (40 mg/kg); DC101 Lo, low dose (10 mg/kg); ns, not significant; *, P < 0.05; **, P < 0.005. C, The incidence of polyps at week 10. Statistics was calculated on the different responsiveness between Apc and Apc/Kras using Wilcoxon signed rank test. P<0.05 D, Blood vessels in macroscopic adenomas in an Apc mouse before (at week 8) and after (at week 12) DC101 treatment. White arrows indicate dilated or torturous vessels, and yellow arrows indicate apparently normal vessels in the tumor regions. E, Fluorescence images of the blood vessels in macro-adenomas in an Apc mouse with and without treatment with sunitinib. Blue, DAPI-stained nucleus; red, CD31-stained blood vessels. F, The measured relative vascular area with and without anti-angiogenic therapy. **, P < 0.01. Scale bars, 250 µm in D and 50 µm in E.
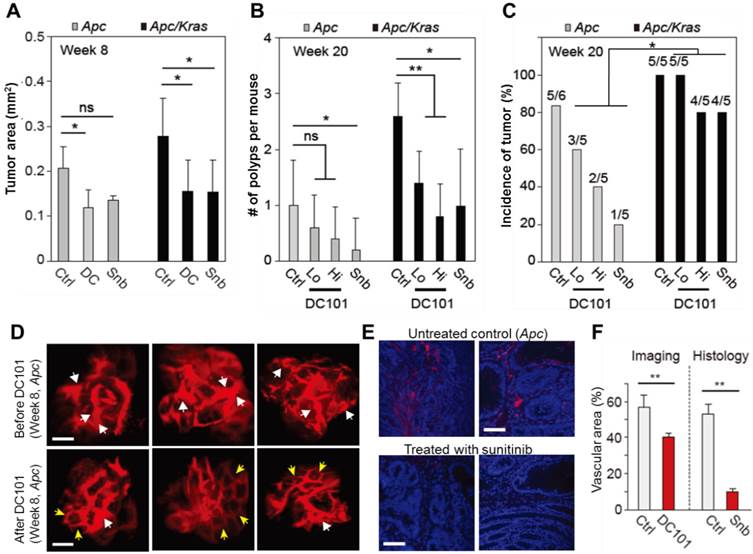
All the adenomas in both control and treated animal eventually grew to become macro-adenomas or polyps, as confirmed both by colonoscopy and histology. At week 20, the treated Apc mice had one or no polyps, whereas untreated animals had one poly on average (Fig. 4B). The number of polyps in the Apc/Kras mice decreased statistically significantly in all treatment groups (Fig. 4B). The incidence rate of polyps was 5 of 6 (83%) for the untreated Apc mice and 5 of 5 (100%) for the untreated Apc/Kras mice (Fig. 4C). In Apc mice, the incidence rates decreased to 60% and 40% in the groups treated with low and high doses of DC101, respectively, and to 20% in the sunitinib-treated group. By stark contrast, the treatment did not significantly affected the incidence rate (>80%) in the Apc/Kras mice (Fig. 4C). Overall, these data demonstrated that anti-angiogenesis therapy suppressed the development of polyps in the Apc single mutant mouse model of colon tumorigenesis but to a lesser degree for Apc/Kras double mutant mice.
To determine the effect of anti-angiogenic therapy on blood vessels in our mouse models, we performed time-lapse confocal endomicroscopy in Apc mice treated with DC101 (30 mg/kg, once every three days) or sunitinib (40 mg/kg, every day) from week 8 for 4 weeks. In vivo images showed apparent reductions in vascular diameters and tortuosity after DC101 treatment (Fig. 4D). The mean vascular density decreased from 56% to 40%. Histological analysis of adenoma tissues collected at week 12 showed significantly smaller CD31-positive areas (Fig. 4E), indicating lower vascular density, in the mice treated with sunitinib that those in the untreated mice (Fig. 4F). These findings are consistent with the previous observation that anti-angiogenic therapy inhibits angiogenesis in adenomatous polyps [19-21].
Anti-VEGFR2 treatment reduced proliferation and apoptosis of adenomas
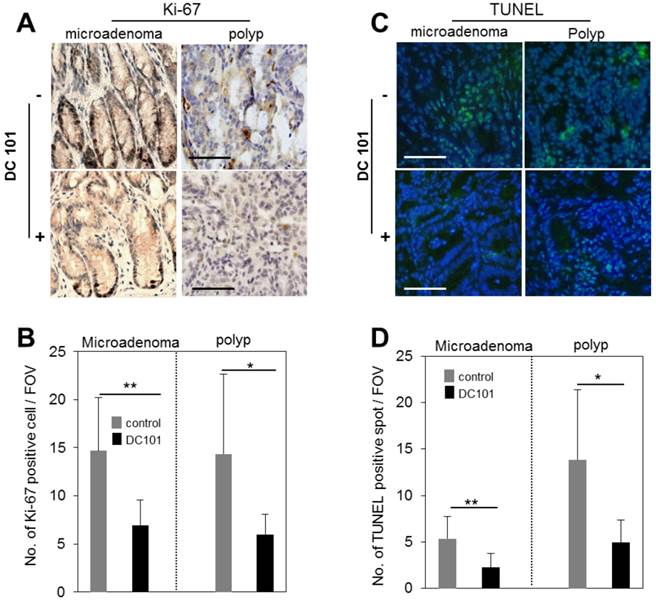
We evaluated the rate of proliferation and apoptosis to gain mechanistic insights into how the anti-angiogenic treatment affected tumor growth in micro and macro adenomas. The number of Ki-67+ proliferative cells was found to be reduced in DC101 treated groups significantly both in microadenoma and polyps (Fig. 5A-B). TUNEL assay showed that apoptosis signal was significantly stronger in polyps than microadenomas in both untreated and treated animals (Fig. 5C-D). However, the apoptosis signal strength is significantly reduced in DC101-treated animals than untreated animals (Fig. 5C-D).
Reduction of apoptosis and proliferation rates in tumors by DC101 treatment. A, Ki-67 antibody-stained immunohistology images of microadenoma and polyps of control and DC101-treated animals. B, The number of Ki-67 positive cells per field of view (FOV, 20X) (n=4). C, TUNEL-stained images of microadenoma and polyps of control and DC101-treated animals. D, The number of TUNEL-positive spots per FOV. Scale bars, 100 µm in A and C. *, P < 0.05; **, P < 0.01 in B and D.
Discussion
The development of colon cancer involves multiple stages, which takes several to a few tens of years from an initial somatic mutation. Clinical data have showed that whether a colon tumor remains benign or develops to a macroscopic adenoma is decided during its micro-adenoma stage [5, 7]. Angiogenesis is essential for the transformation of micro-adenomas to macro-adenomas [6]. In our study, using two genetic mouse models of spontaneous colon tumor and in vivo endoscopic imaging we observed the natural progression of transient lesions, which apparently mimic the micro-adenomas and ACF found in patients. Characteristic vascular dilations were observed in the transient lesions as early as 4 weeks after the onset of somatic mutation, when the radius of the lesions reached the oxygen diffusion distance of ~100 µm in tissue. Angiogenesis in such small lesions in the human colon has been reported [6].
In molecular epidemiological studies of colon cancer, the deficiency of Apc was frequently observed in early adenomas, whereas the frequency of Kras mutation generally increased in intermediate grade tumors [10, 22]. With deletion of Apc gene, additional mutation of Kras (G12D) not only enhances colon tumorigenesis but also impedes the response to anti-angiogenic therapies. Although the rates of micro-adenoma to macro-adenoma conversion were similar in Apc single mutant and Apc/Kras double mutant mice, there were significant differences in terms of the growth and regression of micro-adenomas. The micro-adenomas grew larger and survived longer in mice with the Kras mutation.
The phenotypes of the micro-adenomas showed substantial differences beginning at weeks 4-6, when some transient lesions started to shrink or suddenly disappear; other lesions grew to become polyps at week 20. After anti-angiogenic treatment with DC101 or sunitinib, vessel diameter and vascular area decreased, vessel morphology normalized, and the number of polyps declined. Anti-angiogenic therapy slowed the growth of transient lesions by up to 3 weeks and reduced their peak sizes by a factor of 2-3. The stronger growth suppressing effect on both micro and macro adenomas were observed in Apc single mutant mice than in Apc/Kras double mutant mice. This may be explained by that Kras mutation involves the overexpression of other angiogenic factors, such as platelet-derived growth factor (PDGF), fibroblast growth factor (FGF), and their receptors [23, 24]. The biphasic effect of antiangiogenic therapy in early tumorigenesis may be specific to the colon and rectum, and perhaps small intestines, where the turnover rate of epithelium is fast and various immune cells are abundant.
Unexpectedly, we found that anti-angiogenic therapy delayed the process of spontaneous regression significantly by 4 to 8 weeks depending on the specific drug dose and genetic type. The precise mechanism for this phenomenon is not currently understood. In colon tumorigenesis, early angiogenesis may provide a channel for anti-tumoral cells or cytokines to the initial lesions. It has previously been reported that anti-angiogenic therapy can inhibit infiltration of immune cells into tumors [25, 26]. A reduction in the number of anti-tumoral immune cells can extend tumor cell survival. In addition to this hypothesis, another potential mechanism for natural clearance may be natural crypt generation. The cells in the crypt bottom continuously proliferate and migrate up towards the luminal surface [27, 28], which may exert physical pressure on the transient lesions. The anti-angiogenic agents may hamper crypt regeneration [29], thereby delaying clearance of the transient micro-adenomas.
Materials and Methods
Animals and anti-angiogenesis therapy
Conditional Apc KO (Apc CKO) and Apc CKO/LSL-Kras (heterozygous for the G12D mutant allele) mice were kind gifts from Dr. Raju Kucherlapati (Harvard Medical School, Boston, MA, USA). Apc inactivation and Kras activation were initiated by administering adeno-Cre as previously described [11]. This change is accompanied by the constitutive expression of eGFP. Tumors were monitored by eGFP expression in the egfp-Apc or egfp-Kras mice. Sunitinib and DC101 were purchased Sigma Aldrich (St. Louis, MO, USA) and Bio X Cell (West Lebanon, NH, USA), respectively. Mice were orally administered 0.9% saline or sunitinib (40 mg/kg) once a day for 12 weeks from week 1. For DC101 treatment, mice were intraperitoneally injected with 10 mg/kg (Lo) or 40 mg/kg (Hi) DC101 once every 3 days for 12 weeks. Adenomas from mice were isolated and monitored (n=2 to 5 for each group). All animal experiments were performed in compliance with institutional guidelines and were approved by the subcommittee on research animal care at Massachusetts General Hospital.
Endomicroscopy system
The endoscope probe was fabricated by using three GRIN lenses and a right-angle micro prism for side view imaging [30]. The designed endoscope was mounted and aligned on a custom-built confocal microscope system using a precise XYZ translational stage and rotational stage. The system has three continuous-wave excitation lasers at center wavelengths of 491, 532, and 635 nm, respectively, and three detection channels covering spectral ranges of 505-548 nm, 562-610 nm, and 635-725 nm, respectively [30].
Optical imaging
Mice were starved for 24 hours before imaging to eliminate auto-fluorescence from excrement and digested food. The colon was cleaned by injecting 0.5 ml of 0.9% saline via enema using a rubber-tipped needle before in vivo imaging. Mice were anesthetized by intraperitoneal injection of ketamine and xylazine (90 mg and 9 mg per kg body weight, respectively). Mice were placed on the heated plate of a motorized XYZ translational stage. For vasculature imaging, tetramethylrhodamine (TAMRA) dextran conjugates (5 μg/μl, 2,000,000 MW; Invitrogen, Carlsbad, CA, USA) were injected intravenously. Images were typically acquired within 5 to 40 minutes after the injection. eGFP-expressing cells were visualized by excitation at 491 nm and detection through a bandpass filter at 502-537 nm (Semrock, Rochester, NY, USA). TAMRA was imaged by excitation at 532 nm and detection through a bandpass filter at 562-596 nm (Semrock). At each time point, vascular parameters, including vascular density, average diameter, and branch number, were analyzed, and the degree of deviation from the normal hexagonal structure was calculated by spatial correlation analysis using the MATLAB and ImageJ programs.
Immunohistochemistry and TUNEL assay
Isolated tissue sections were paraffinized. Deparaffinized tissues were blocked with 3% H2O2 in methanol to inactivate endogenous peroxidases. Slides were washed with phosphate-buffered saline, incubated for 20 min in protein-blocking solution supplemented with 4% normal bovine serum albumin, incubated overnight at 4 °C with primary antibodies against Ki-67 and counterstained with 4′,6-diamidino-2-phenylindole (DAPI). To detect apoptosis in tissues, we used Apoptag kit (Millipore) following the manufacturer's instruction. Briefly, after deparaffinizing the sections and digesting proteins with proteinase K, the slides were incubated in the equilibration buffer containing TdT enzyme, followed by stop/wash buffer. Then 50 μl of anti-digoxigenin-fluorescein was added and the slides were covered with mounting solution containing 0.5 μg/ml propidium iodide. Vessel density was analyzed using ImageJ 2.0.
Tumor growth analysis
The distance-dependent magnification of colonoscopy was calibrated by imaging a ruler at a predetermined distance from the sample. The width and height of each were measured from 3-chip video images, and the tumor volume was calculated to be two times the product of the measured width and height [31]. The difference in tumor growth between animal groups was analyzed by using the Wilcoxon rank sum test.
Supplementary Material
Fig.S1 -Fig.S3.
Acknowledgements
This work was supported by grants from the National Institutes of Health (U54CA143837, P01CA080124, P01HL120839, P41-EB015903) and the National Research Foundation of Korea (2008-0062484, 2011K000864, 2012M3A6A4054261, 2013M3A6A4072626 and 2014R1A1A1002431)
Author Contributions
J.W.C. designed and performed experiments, analyzed data, and wrote the manuscript. P.K., J.K.K., and Y.K. assisted with experiments. D.F. analyzed data and edited the manuscript. S.H.Y. supervised the project and wrote the manuscript.
Competing Interests
The authors have declared that they have no conflict of interest.
References
1. Potente M, Gerhardt H, Carmeliet P. Basic and therapeutic aspects of angiogenesis. Cell. 2011;146:873-87
2. Carmeliet P, Jain RK. Molecular mechanisms and clinical applications of angiogenesis. Nature. 2011;473:298-307
3. Roy HK, Wali RK, Kim Y, Liu Y, Hart J, Kunte DP. et al. Inducible nitric oxide synthase (iNOS) mediates the early increase of blood supply (EIBS) in colon carcinogenesis. FEBS letters. 2007;581:3857-62
4. Tiwari AK, Crawford SE, Radosevich A, Wali RK, Stypula Y, Kunte DP. et al. Neo-angiogenesis and the premalignant micro-circulatory augmentation of early colon carcinogenesis. Cancer letters. 2011;306:205-13
5. Shpitz B, Bomstein Y, Mekori Y, Cohen R, Kaufman Z, Neufeld D. et al. Aberrant crypt foci in human colons: distribution and histomorphologic characteristics. Human pathology. 1998;29:469-75
6. Shpitz B, Gochberg S, Neufeld D, Grankin M, Buklan G, Klein E. et al. Angiogenic switch in earliest stages of human colonic tumorigenesis. Anticancer research. 2003;23:5153-7
7. Takayama T, Katsuki S, Takahashi Y, Ohi M, Nojiri S, Sakamaki S. et al. Aberrant crypt foci of the colon as precursors of adenoma and cancer. The New England journal of medicine. 1998;339:1277-84
8. Lynch HT, de la Chapelle A. Hereditary colorectal cancer. The New England journal of medicine. 2003;348:919-32
9. Janssen KP, Alberici P, Fsihi H, Gaspar C, Breukel C, Franken P. et al. APC and oncogenic KRAS are synergistic in enhancing Wnt signaling in intestinal tumor formation and progression. Gastroenterology. 2006;131:1096-109
10. Kinzler KW, Vogelstein B. Lessons from hereditary colorectal cancer. Cell. 1996;87:159-70
11. Hung KE, Maricevich MA, Richard LG, Chen WY, Richardson MP, Kunin A. et al. Development of a mouse model for sporadic and metastatic colon tumors and its use in assessing drug treatment. Proceedings of the National Academy of Sciences of the United States of America. 2010;107:1565-70
12. Condeelis J, Segall JE. Intravital imaging of cell movement in tumours. Nature reviews Cancer. 2003;3:921-30
13. Kishimoto H, Kojima T, Watanabe Y, Kagawa S, Fujiwara T, Uno F. et al. In vivo imaging of lymph node metastasis with telomerase-specific replication-selective adenovirus. Nature medicine. 2006;12:1213-9
14. Sahai E. Illuminating the metastatic process. Nature reviews Cancer. 2007;7:737-49
15. Kim P, Chung E, Yamashita H, Hung KE, Mizoguchi A, Kucherlapati R. et al. In vivo wide-area cellular imaging by side-view endomicroscopy. Nature methods. 2010;7:303-5
16. Shaheen RM, Ahmad SA, Liu W, Reinmuth N, Jung YD, Tseng WW. et al. Inhibited growth of colon cancer carcinomatosis by antibodies to vascular endothelial and epidermal growth factor receptors. British journal of cancer. 2001;85:584-9
17. Marzola P, Degrassi A, Calderan L, Farace P, Nicolato E, Crescimanno C. et al. Early antiangiogenic activity of SU11248 evaluated in vivo by dynamic contrast-enhanced magnetic resonance imaging in an experimental model of colon carcinoma. Clinical cancer research. 2005;11:5827-32
18. Becker C, Fantini MC, Neurath MF. High resolution colonoscopy in live mice. Nature protocols. 2006;1:2900-4
19. Shaheen RM, Tseng WW, Vellagas R, Liu W, Ahmad SA, Jung YD. et al. Effects of an antibody to vascular endothelial growth factor receptor-2 on survival, tumor vascularity, and apoptosis in a murine model of colon carcinomatosis. International journal of oncology. 2001;18:221-6
20. Goodlad RA, Ryan AJ, Wedge SR, Pyrah IT, Alferez D, Poulsom R. et al. Inhibiting vascular endothelial growth factor receptor-2 signaling reduces tumor burden in the ApcMin/+ mouse model of early intestinal cancer. Carcinogenesis. 2006;27:2133-9
21. Korsisaari N, Kasman IM, Forrest WF, Pal N, Bai W, Fuh G. et al. Inhibition of VEGF-A prevents the angiogenic switch and results in increased survival of Apc+/min mice. Proceedings of the National Academy of Sciences of the United States of America. 2007;104:10625-30
22. Fearon ER, Vogelstein B. A genetic model for colorectal tumorigenesis. Cell. 1990;61:759-67
23. Beenken A, Mohammadi M. The FGF family: biology, pathophysiology and therapy. Nature reviews Drug discovery. 2009;8:235-53
24. Ostman A, Heldin CH. PDGF receptors as targets in tumor treatment. Advances in cancer research. 2007;97:247-74
25. Roland CL, Lynn KD, Toombs JE, Dineen SP, Udugamasooriya DG, Brekken RA. Cytokine levels correlate with immune cell infiltration after anti-VEGF therapy in preclinical mouse models of breast cancer. PloS one. 2009;4:e7669
26. Adotevi O, Pere H, Ravel P, Haicheur N, Badoual C, Merillon N. et al. A decrease of regulatory T cells correlates with overall survival after sunitinib-based antiangiogenic therapy in metastatic renal cancer patients. Journal of immunotherapy. 2010;33:991-8
27. Heath JP. Epithelial cell migration in the intestine. Cell biology international. 1996;20:139-46
28. Michor F, Iwasa Y, Rajagopalan H, Lengauer C, Nowak MA. Linear model of colon cancer initiation. Cell cycle. 2004;3:358-62
29. Valcz G, Krenacs T, Sipos F, Leiszter K, Toth K, Balogh Z. et al. The role of the bone marrow derived mesenchymal stem cells in colonic epithelial regeneration. Pathology oncology research: POR. 2011;17:11-6
30. Kim JK, Lee WM, Kim P, Choi M, Jung K, Kim S. et al. Fabrication and operation of GRIN probes for in vivo fluorescence cellular imaging of internal organs in small animals. Nature protocols. 2012;7:1456-69
31. Choi JW, Kim JK, Choi M, Kim YR, Yun SH. In vivo imaging of Lgr5-positive cell populations using confocal laser endomicroscopy during early colon tumorigenesis. Endoscopy. 2014;46:1110-6
Author contact
![]() Corresponding authors: Jin Woo Choi, Ph.D. Email: jinwoochoiac.kr or Seok Hyun Yun, Ph.D. Email: syunharvard.edu
Corresponding authors: Jin Woo Choi, Ph.D. Email: jinwoochoiac.kr or Seok Hyun Yun, Ph.D. Email: syunharvard.edu