Impact Factor
- Issue 14; 2026
- Issue 13; 2026
- Issue 12; 2026
- Issue 11; 2026
- Issue 10; 2026
- Volume 16; 2026
- Advance Articles
- Past Issues
- Cover Images
- Cover Suggestion
- Index & Coverage
- Special Issues
Introduction
Material and Methods
Results
Discussion
Conclusion
Abbreviations
Supplementary Material
Acknowledgements
References
International Journal of Biological Sciences
International Journal of Medical Sciences
 Global reach, higher impact

Theranostics 2025; 15(11):5220-5237. doi:10.7150/thno.105857 This issue Cite
Research Paper
ATP released by ultrasound targeted microbubble cavitation induces vascular inflammation and improves immune checkpoint blockade efficacy
Sepideh Jahangiri1,2,3, Samuel Bourdages1,2,4, Emma Skora2,5, John Stagg2,5, François Yu1,2,4,6 ![]()
1. Microbubble Theranostics Laboratory, Imaging and engineering axis, CHUM Research Center, Montreal, Canada.
2. Institut du Cancer de Montréal, Centre de Recherche du Centre Hospitalier de l'Université de Montréal, Montréal, Canada.
3. Faculty of Medicine, Université de Montréal, Montreal, Canada.
4. Biomedical Engineering Institute, Université de Montréal, Montreal, Canada.
5. Faculty of Pharmacy, Université de Montréal, Montreal, Canada.
6. Department of Radiology, Radiation Oncology and Nuclear Medicine, Faculty of Medicine, Université de Montréal, Montreal, Canada.
Received 2024-10-26; Accepted 2025-2-20; Published 2025-4-11
Abstract

Rationale: Extracellular ATP (eATP) is a potent immune stimulant that functions as a damage-associated molecular pattern. The regulation of eATP is primarily mediated by cell surface ecto-nucleotidases (CD39 and CD73) which hydrolyze ATP into adenosine, a potent immune suppressor. CD39 and CD73 are upregulated in most cancers. Therapeutic strategies aimed at increasing ATP release in the tumor microenvironment or inhibiting adenosine activity are active areas of research in immuno-oncology. Ultrasound-Targeted Microbubble Cavitation (UTMC) is an externally applied, spatially targeted approach that has demonstrated synergy with immune checkpoint blockade (ICB) in solid tumors. However, the underlying mechanisms and optimal therapeutic combinations remain under investigation. We hypothesized that modulating purinergic signaling by UTMC could further leverage ICB efficacy.
Methodologies: Here, we investigated non-ablative and flow-preserving UTMC to enhance ATP release and induce inflammatory responses in a murine syngeneic colorectal tumor model (MC38) with and without CD39 inhibition. We compared two UTMC pressures (400 and 850 kPa), evaluating their impact on tumor blood flow by contrast perfusion imaging, their ability to release ATP using bioluminescence, their effect on vascular inflammation and cancer cell death through histological analysis, their synergy with aPDL1 to improve ICB efficacy, immune cell infiltration to the tumor, and immune cell drainage to the tumor-draining lymph nodes (TDLN).
Results: UTMC at 850 kPa and in CD39 knockout model released higher eATP concentrations, which correlated with increased vascular inflammation, enhanced cancer cell death, and reduced cancer cell proliferation. The combination of aPDL1 with UTMC and CD39 blockade significantly reduced tumor growth. This treatment also increased cytotoxic T cells (CTL), the CTL/Treg ratio, dendritic cells, and M1-prototype tumor-associated macrophages, while reducing M2-prototype macrophages within the tumor. In the TDLNs, the fully combined treatment elevated CTLs, dendritic cells, and M1-prototype macrophages, with a concurrent reduction in M2-prototype macrophages.
Conclusion: Our findings support that purinergic signaling can be leveraged in combination with UTMC to improve ICB therapy.
Keywords: eATP, microbubble, ultrasound targeted microbubble cavitation, vascular inflammation, immune checkpoint blockade, aPDL1
Introduction
ATP and adenosine (Ado) are critical metabolic and immune regulators that modulate cancer immunosuppression in the tumor microenvironment (TME). Extracellular ATP (eATP) is a potent immune stimulant and functions as a Danger-Associated Molecular Pattern (DAMP) [1]. In the TME, eATP induces immunogenic cell death (ICD) and secretion of immune-stimulating factors, including high-mobility group protein B1 (HMGB1), calreticulin, and type I interferons [2]. eATP affects cancer cell growth, metastasis, and inflammatory response [3-5]. Low eATP concentrations typically foster tumor growth and immune suppression, whereas high eATP levels activate inflammatory cells, enhancing antitumor immunity [6, 7]. eATP at high concentrations activates P2X7R, which is found on macrophages, dendritic cells (DCs), granulocytes, T and B cells [6, 8-10]. P2X7R activation facilitates NLRP3 inflammasome assembly and the subsequent release of IL-18 and IL-1β to recruit anti-tumor immune responses [11]. Conversely, Ado, the downstream product of ATP hydrolysis, is a potent immuno-suppressor and tumor growth promoter [12]. Ado ligation to its receptors, mainly A2AR, initiates immune-suppressive signaling and causes T cell exhaustion and NK cell suppression [13]. The eATP/Ado balance is regulated by cell surface ecto-nucleotidases, chiefly CD39 and CD73. CD39 hydrolyzes ATP to ADP and AMP, whereas CD73 degrades AMP to Ado [12]. Interestingly, CD39 and CD73 are usually overexpressed in the hypoxic TME [14]. Hypoxia enhances CD39 and CD73 expression on tumor cells, immune cells (such as regulatory T cells (Treg), myeloid-derived suppressor cells (MDSCs), macrophages, DCs, and Th17), endothelial cells, fibroblasts, and mesenchymal stromal cells, leading to increase Ado production [12, 14, 15]. CD73 and/or CD39 deletion help anti-tumor immune responses and improve mice survival [16, 17], suggesting their implication in tumor progression and immune suppression. Alternatively, overexpression of CD39 and CD73 is associated with a poor prognosis and tumor progression in several cancer types [5]. The therapeutic strategies that increase ATP concentration within the TME or inhibit Ado activity are active research areas in immuno-oncology [12, 18, 19], including in combination with immune checkpoint blockade (ICB) [14, 18, 20].
ICB can reactivate the host's immune system to combat cancer. By inhibiting immune-suppressive pathways like PD-1/PD-L1 and CTLA-4, ICB leads to improved outcomes in various cancers, including an overall response rate of 26% in melanoma patients. However, it also typically causes immune-related side effects [5, 21, 22]. Increasing the ICB dose to achieve a higher success rate is not always a reliable solution, as it can substantially amplify these side effects [23]. Hence, to enhance the efficacy of immunotherapy while minimizing systemic toxicities, it is crucial to gain a deeper understanding of therapeutic resistance mechanisms, develop strategies to overcome them, and enhance the efficacy of ICBs across a wider range of cancer types and in larger patient cohorts.
Focused ultrasound (FUS) is a non-invasive focal therapeutic technique that utilizes high-frequency sound waves guided by imaging to treat deep tissue structures, which can be used for cancer ablation [24-27] and local drug delivery [28, 29] including CAR-T cell therapy [30, 31], and ICB delivery in solid tumors [5, 32-39]. Interestingly, it has recently been found that ablative FUS possesses immunomodulation effects, turning a cold TME into a hot TME, hence making FUS a potential enhancer of immunotherapy [5, 25]. Several studies have demonstrated that FUS can induce ICD and enhance antigen presentation, transforming an immunosuppressive TME into an inflamed immune-active one [25, 34]. However, the underlying mechanisms and optimal therapeutic combinations remain under investigation. FUS is also typically ablative, which may hinder the subsequent access of drugs and immune cells to the ablated area.
Ultrasound-Targeted Microbubble Cavitation (UTMC) is a FUS modality that utilizes low-intensity pulsed ultrasound at low to moderate pressure levels, typically between 0.1 and 4 MPa, combined with the systemic administration of microbubbles (MB) [5]. Under US stimulation, MBs undergo stable and inertial cavitation, producing shear stress on nearby cell membranes and vessel boundaries, which can lead to the breakdown of tight junctions between vascular endothelial cells, compromising vessel integrity [40, 41]. Non-ablative UTMC treatment causes mechanical perturbation that enhances antibody delivery in several cancers [5, 36]. A promising example of UTMC application for enhanced antibody delivery was recently reported by Meng et al. (2021) in a single-armed, open-labelled clinical study (NCT03714243) using an MRI-guided focused ultrasound system for enhancing Trastuzumab delivery in four patients with progressive intracranial HER2-positive brain metastases [42]. UTMC treatment can enhance tumor perfusion, relieve hypoxia, and thus improve radiotherapy efficacy in a rodent model [40]. Recently, non-ablative UTMC was shown to increase DAMPs such as HMGB1, HSP60, HSP70, and calreticulin in tumor tissue, stimulating adaptive immune responses [33, 40, 43]. Interestingly, UTMC was also reported to release ATP in mice muscle [44] and tumors [45]. Therefore, these reports highlight the importance of non-ablative UTMC and its potential to improve adjuvant cancer therapy.
In this study, we are interested in investigating whether non-ablative, flow-preserving UTMC, could induce antitumor inflammatory responses in MC38 tumors with and without CD39 inhibition. We hypothesized that this mechanism is ATP-dependent and involves vascular inflammation. To the best of our knowledge, the importance of ATP release by UTMC in the context of ICB had not been studied, nor has the role of ATP in vascular inflammation post-UTMC. To determine which US pressure would be more effective at inducing anti-tumor inflammatory responses, US pressures of 400 and 850 kPa were studied. Therefore, our objectives were: 1) to determine if UTMC enhances eATP with CD39 inhibition, 2) to investigate whether enhanced ATP with CD39 inhibition induces vascular inflammation, 3) to assess if enhanced ATP causes cancer cell death, 4) to assess if CD39 inhibition can enhance UTMC + ICB efficacy, and 5) to determine if the immune cell responses in TME are shifted toward an inflamed TME.
Material and Methods
Cells and animals
The mouse colorectal carcinoma cell line (MC38), kindly provided by Dr. Stagg (CRCHUM), was cultured in high-glucose RPMI 1640 (Wisent) supplemented with L-glutamine, 1.5 g/L sodium bicarbonate, sodium pyruvate, HEPES, 10% fetal bovine serum (Wisent), and 100 U/ml penicillin/streptomycin (Wisent) under 5% CO2 at 37 °C. Eight to ten-week-old female C57BL/6 wild-type mice (WT) were purchased from Charles River (Canada). CD39 knockout mice (CD39KO) with a C57BL/6 background, kindly provided by Dr. Stagg, were bred and maintained at the Centre de Recherche du Centre Hospitalier de l'Université de Montréal. 2.5×10⁵ MC38 cells in a mixture (1:1) with Matrigel (Corning, Tewksbury, MA) were subcutaneously inoculated into the posterior upper flank area of WT or CD39KO female mice (100 µl/side). Tumor size was measured using calipers every 2-3 days, and the volume was calculated as (length × width × depth/2). All animal studies were approved by the Institutional Animal Protection Committee of the University of Montreal Hospital Research Center (ethical approval number #2I23011FYs), which holds a Certificate of Good Animal Practice from the Canadian Council on Animal Care.
Ultrasound image guided therapy
A 7 MHz central frequency ultrasonic imaging probe (15L8 probe, Sequoia, Siemens) was placed horizontally aiming at the tumor, allowing contrast-enhanced ultrasound (CEUS) imaging. An MB suspension (Definity®, Lantheus) was slowly infused (4-6 µl/min) through the tail vein during the treatment and for real-time CEUS imaging. Burst replenishment cineloops were recorded (CPS7 mode; mechanical index (MI) = 0.2, Sequoia, Siemens) before, during, and after treatment. Cineloops were analysed offline by fitting a mono-exponential function (video intensity,  ) to compute the reperfusion rate AB (dB/s) [40], using a custom MATLAB program (MATLAB, version 9.8.0 (R2020a); Natick, Massachusetts), as described elsewhere [40]. In brief, the kinetics of MB perfusion were quantified by measuring AB parameters both pre-treatment and three minutes after treatment. The steady-state post-treatment perfusion AB (dB/s) values were averaged and normalized by muscle MB perfusion (untreated area) in the pre-treatment clip to compensate for changes in MB concentration between cineloop recordings. The therapeutic transducer (1 MHz, 0.5 inches, A303S, Olympus) was calibrated using a membrane hydrophone (ONDA HMB-0200 S/N:1423) in a degassed water tank. For tumor treatment, the single-element unfocused transducer was positioned directly over the tumor using coupling gel and perpendicularly to the imaging plane. Ultrasound pressure for efficacy studies was set at either 400 kPa or 850 kPa corresponding to MI of 0.4 and 0.85, resp. Trains of 5000 cycles were generated by a function generator (Model 33500B Trueform Waveform Generator, Keysight, Santa Rosa, CA), amplified (Model 1040, ENI, Rochester, NY, USA), and delivered every 5 seconds for 10 minutes to the tumor site.
Treatment protocols in acute studies
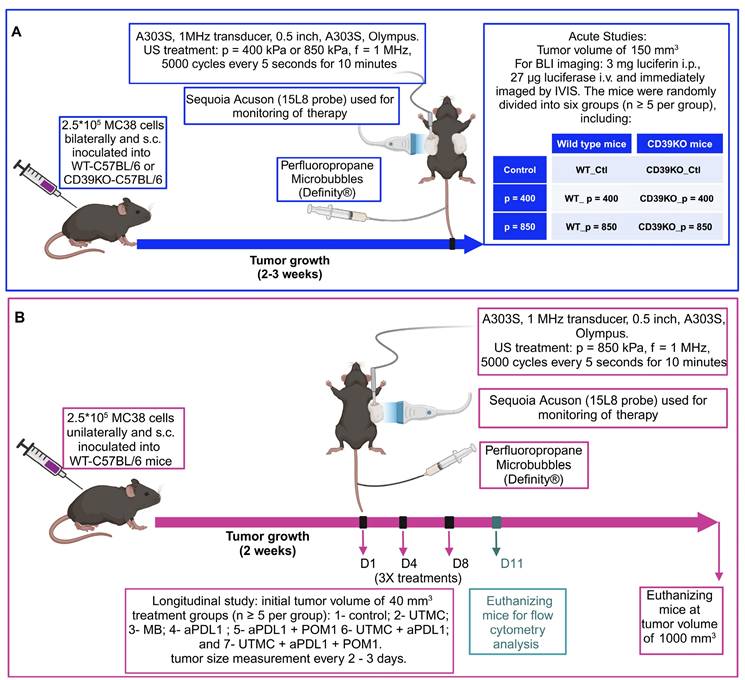
Before treatment, the mice were anesthetized with ketamine (50 mg/kg) + Dexmedetomidine (0.5 mg/kg) and isoflurane 0.5% (if needed for maintenance). As shown in Figure 1A, when the tumor volume reached 150 mm3, the mice were randomly divided into six groups (n ≥ 5 per group), including: 1- control wild type (WT_Ctl); 2- wild type treated with p = 400 kPa (WT_p = 400); 3- wild type treated with p = 850 kPa (WT_p = 850); 4- control CD39KO (CD39KO_Ctl); 5- CD39KO treated with p = 400 kPa (CD39KO_p = 400); 6- CD39KO treated with p = 850 kPa (CD39KO_p = 850). For ATP quantification, mice were immediately transferred to the IVIS chamber to measure the bioluminescent signal. These mice were then sacrificed 2 h post UTMC to quantify vasodilation on H&E slides. For histopathological investigation (CC3, ki67, CD3, ICAM, VCAM1, CD31), another group of mice were humanely euthanized 24 h after UTMC by cervical dislocation. The tumor samples were then collected, formalin-fixed, and embedded in paraffin, or were frozen in O.C.T. mounting medium (Sakura Tissue-Tek, Torrance, CA) for further analysis.
Treatment protocols for (A) acute and (B) longitudinal studies. 2.5 x 10⁵ MC38 cells were injected s.c. (A) bi-laterally or (B) unilaterally into flanks of wild-type or CD39KO mice. (A) At a tumor volume of 150 mm3, mice were treated and imaged by IVIS (at 2 h) and histological analysis (at 24 h); (B) At a tumor volume of 40 mm3, mice received three treatments of UTMC + aPDL1 (100 µg i.p.) + POM1 (250 µg i.p.). MBs were infused via a tail vein catheter during UTMC treatment. CEUS was used to guide the therapeutic probe placement and burst replenishment imaging was performed to assess MB perfusion before and after UTMC. Tumor size was measured longitudinally. To study immune responses, mice were euthanized three days after treatment #3, at which time (D11) tumor samples and TDLNs were collected. aPDL1: anti-programmed cell death ligand-1; BLI: bioluminescence imaging; CD39KO-C57BL/6: CD39 knockout mice; Contrast enhanced ultrasound (CEUS); i.v.: intravenous injection; POM-1: Sodium polyoxotungstate-1; s.c.: subcutaneous; TDLN: tumor-draining lymph nodes US: ultrasound; WT-C57BL/6; wild-type mice.
Treatment protocols in longitudinal studies
Before treatment, the tumor-bearing mice were anesthetized with Ketamine (50 mg/kg) + Dexmedetomidine (0.5 mg/kg) or with isoflurane 1.5%. As shown in Figure 1B, when the tumor volume reached 40 mm3, the mice were randomly divided into different treatment groups (n ≥ 5 per group), including: 1- control; 2- UTMC; 3- MB; 4- aPDL1 (100 µg); 5- aPDL1 (100 µg) + POM-1 (250 µg); 6- UTMC + aPDL1 (100 µg); and 6- UTMC + aPDL1 (100 µg) + POM-1 (250 µg). The role of ATP was investigated by pharmacological CD39 inhibition (POM-1) or using a CD39 knockout mouse model (CD39KO). aPDL1 and POM-1 were administered through the intraperitoneal (i.p.) route 30 minutes before UTMC treatment. Treatments were given three times with a 2-3 day interval. Tumor volume (0.5 × Length × Width × Depth) was measured using a digital caliper daily. Mice were sacrificed if the tumor reached the end-point cut-off volume of 1000 mm3. Tumor collection was the same as described for acute studies. Immune cell infiltration into the tumor and immune cell trafficking to the tumor-draining lymph nodes (TDLNs) were assessed in the same longitudinal model. However, in this case, the mice were euthanized on day 11, three days after their third treatment.
Optical imaging of eATP following UTMC
To examine changes in the level of eATP following UTMC treatment in WT or CD39KO mice, 3 mg XenoLight D-Luciferin (#122796, Perkin Elmer, Waltham, MA) was administered i.p., and 27 µg Luciferase (Promega, Canada) was administered i.v. To quantify ATP release, both tumors (UTMC-treated and the untreated (control)) were imaged for bioluminescent signal (BLI) using an IVIS Spectrum Imaging System (PerkinElmer, Waltham, MA), and the total flux (photon/second) was calculated using Living Image® software analysis (PerkinElmer, Waltham, MA).
Histology
Paraffin-embedded specimens were cut into 5 µm sections and used for histological staining with H&E or IHC, and IF staining, using the BenchMark XT automated stainer (Ventana Medical System Inc; Tucson, AZ). Antigen retrieval was carried out with Cell Conditioning 1 (Ventana Medical System Inc; #950-123) for 90 minutes for all primary antibodies. Cell proliferation and cell apoptosis were studied through IHC staining using antibodies against Ki-67 (Cell Signaling #9449, 1:500 dilution) and CC3 (Cleaved Caspase-3; Cell Signaling #9661, 1:100 dilution), resp. IHC sections were scanned using the Leica Aperio VERSA 200 scanner (Leica Biosystems), and the level of expression of each marker was analyzed through VisiomorphDP software (VisioPharm, Hørsholm, Denmark). Normalized expression was defined as the extent area of each marker divided by the tissue area. Consecutive sections were also used for IF staining against the vascular inflammatory markers VCAM-1 and ICAM-1 within CD31-positive endothelial cells. To quantify vascular inflammation, the vasculature was first detected using CD31 signal in non-necrotic regions and marked as CD31 ROI. Then, the surface area of ICAM-1 or VCAM-1 within CD31 ROI was quantified and normalized by CD31 surface area. IF staining was performed with a cocktail of primary antibodies, including rat anti-VCAM-1 (Invitrogen, #13-1061-82, 1:100 dilution), mouse anti-ICAM-1 (Invitrogen, # MA5407, 1:500 dilution), and rabbit anti-CD31 (Abcam, ab28364, 1:25 dilution). A mixture of secondary antibodies, including goat polyclonal anti-rabbit-AF647 (Invitrogen, A-21422, 1:125 dilution), goat anti-mouse-AF555 (Invitrogen A-21244, 1:1500 dilution), and goat anti-rat-AF488 (Invitrogen, 1:100 dilution), was added and incubated for 1 hour at room temperature. Sections were then washed three times for 5 minutes each with PBS, mounted with ProLong Gold Antifade with DAPI (ThermoFisher, P36931), and sealed. IF slides were scanned with an Olympus Optical microscope BX61VSF 241 (Olympus, Shinjuku, Tokyo, Japan) using a 20X 0.75NA objective and a resolution of 0.3225 μm (Olympus Canada Inc., Richmond Hill, ON, Canada), linked to the OlyVIA® image 243 viewer software (Olympus, xvViewer.exe) and analyzed using Visiomorph software.
Flow cytometry analysis
Tumor samples and TDLNs were collected three days after the third treatment (Figure 1B, on D11), minced and digested in tumor dissociating media (RPMI1640, 20ug/ml DNAse I (Roche), and 1mg/ml Collagenase type IV (Worthington Biochemical)) for 1h at 37°C. The cell suspension was then passed through a 70 µm cell strainer (Zellsieb) and washed twice in FACS buffer (PBS 1X, 2% FBS (fetal bovine serum), and 2.5 mM EDTA). Anti-CD16/32 mAb (Cytek, clone 2.4G2) was used to block Fc receptors. For extracellular marker staining, single-cell suspensions were incubated with a cocktail of viability dye (ef506, Thermo Fisher Scientific; cat.: 65-0866-14) and fluorescence-conjugated antibodies (1:200 BUV737 mouse anti-mouse CD45, 1:500 BV786 hamster anti-mouse CD3e, 1:1000 AF700 rat anti-mouse CD4, 1:200 Pacific Blue rat anti-mouse CD8a, 1:500 BUV395 rat anti-mouse CD11b, 1:50 APC hamster anti-mouse CD11c, 1:200 PE rat anti-mouse F4/80, 1:1000 BV650 rat anti-mouse CD86, and 1:200 PE-Cy7 rat anti mouse CD206) for 30 minutes on ice.
Next, for intracellular FoxP3 staining, single-cell suspensions were first fixed and permeabilized using fixation/permeabilization buffer (Invitrogen, #00-5523-00) for 30 minutes on ice, washed with permeabilization buffer (Invitrogen, #00-5523-00), and then stained with 1:200 AF488 rat anti-mouse FoxP3. Flow cytometry was conducted on an LSRFortessaTM (BD Bioscience, San Jose, CA, USA) and analyzed using FlowJo software (version 10.8.0).
Statistical analysis
Data were first tested for normality using the Shapiro Wilk test. If the data were normally distributed, parametric tests were used. Perfusion rates (AB) were analyzed using paired t-tests in longitudinal and acute studies. For comparing differences between multiple groups, two-way ANOVA followed by Tukey's multiple comparisons test was used. For non-normal data set (supplementary results), group differences were compared using the Mann-Whitney test. Mice survival was analyzed using the Log-rank Mantel-Cox test. All data are presented as mean ± SEM, and statistical significance was set at p < 0.05. All statistical analyses were performed using GraphPad Prism version 10.0 (San Diego, California, USA, www.graphpad.com).
Results
Tumor perfusion was maintained following UTMC
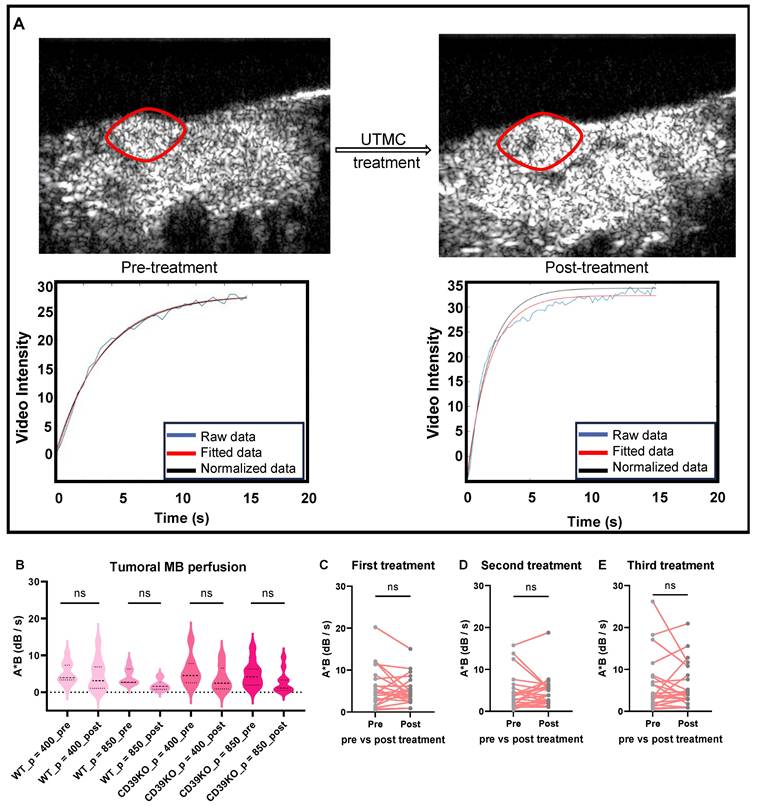
CEUS imaging was used to analyze the tumor blood perfusion before and after treatment (Figure 2A). The MB perfusion was quantified in both pre- and post-treatment videos using MATLAB. Comparing pre- versus post-treatment videos revealed that UTMC treatments at pressures of either 400 (p = 0.81 in WT and p = 0.19 in CD39KO mice) or 850 kPa (p = 0.33 in WT and p = 0.08 in CD39KO mice) did not shut down the tumor perfusion (Figure 2B-C). Additionally, MB perfusion was analysed pre- and post-UTMC on each treatment day, confirming the non-ablative treatment at the studied timepoints (Figure 2C-E). Hence, molecular and pathological modifications in TME were explored following non-ablative UTMC in our next steps.
Tumor perfusion following UTMC treatment. A) The tumor area is highlighted with a red line. An example of burst replenishment imaging is provided to display MB perfusion before starting UTMC treatment and 5 minutes after UTMC. MB replenishment was quantified offline to derive blood volume (A) and MB perfusion (A × B) by fitting video intensity with an exponential function  , where A is the plateau video intensity [dB] (maximum MB concentration) and B is the rate constant [s-1 ] (blue line: raw data, red line: fitted data, black line: normalized data based on MB concentration in non-treated region (muscle) of pre-treatment video). B) In acute studies, MB perfusion was similar in tumors pre- vs. post-treatment, therefore UTMC was not ablative (n > 5 per group, p > 0.05 in each set of comparison, paired t-test). C-E) In longitudinal studies, MB perfusion did not change before and after first, second or third UTMC treatments (p = 0.45, p = 0.91, and p = 0.78, resp., paired t-test). MB: microbubble; UTMC: ultrasound targeted microbubble cavitation; VI: video intensity.
UTMC induces vasodilation in WT and CD39KO mice
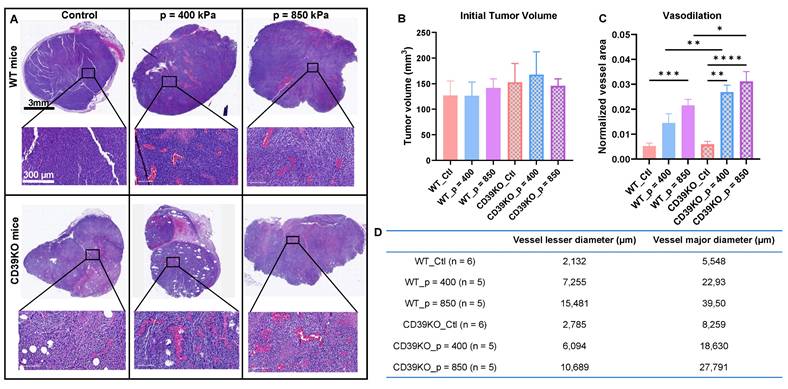
To further analyze UTMC effect on perfusion and inducing vasodilation, tumor samples were collected 2 h post-UTMC and sequential slides were stained by H&E and CD31 marker. Histological examination revealed a notable vasodilation in all UTMC-treated samples, which was absent in control slides. Enlarged blood vessels, with extensive accumulation of red blood cells in the vessel lumens, were consistently observed (Figure 3A). This observation was further confirmed by independent pathologists who were blinded to the mice groupings and quantified offline. Initial tumor volume was not significantly different between any of the groups (Figure 3B). Figure 3C and D show that normalized vessel area was increased following UTMC in WT_p = 850 compared to WT_Ctl group (p = 0.0003). In CD39KO group, the normalized vessel area was increased in CD39KO_p = 400 (p = 0.001) and CD39KO_p = 850 (p < 0.0001) compared to CD39KO_Ctl. Normalized vessel area was significantly increased in CD39KO versus WT mice following US pressure of 400 kPa (p = 0.006) and 850 kPa (p = 0.005).
Vasodilation following UTMC treatment. A) Typical H&E staining on tumor samples collected 2 h after UTMC treatment. To better visualize vessel dilation, a section of vascularized section of tumor tissue is magnified on the bottom. B) Tumor volume in all the groups was similar (n > 5 per group). C) Normalized vessel area (vessel area/tissue area) in non-necrotic tissue significantly increased in WT_p = 850 compared to WT_Ctl group (p = 0.0003). In CD39KO group, the normalized vessel area was increased in CD39KO_p400 (p = 0.001) and CD39KO_p = 850 (p < 0.0001) compared to CD39KO_Ctl. Normalized vessel area was significantly increased in CD39KO versus WT mice following US pressure of 400 kPa (p = 0.006) and 850 kPa (p = 0.005). D) Mean of minimum and maximum vessel diameters (µm) are shown for each group. CD39KO: CD39 knock-out mice; CD39KO_Ctl: No US control group of CD39KO mice; eATP: extracellular ATP; US: ultrasound; UTMC: ultrasound targeted microbubble cavitation; WT_Ctl; No US control group of wild-type mice.
UTMC increases eATP in MC38 tumor of WT and CD39KO mice
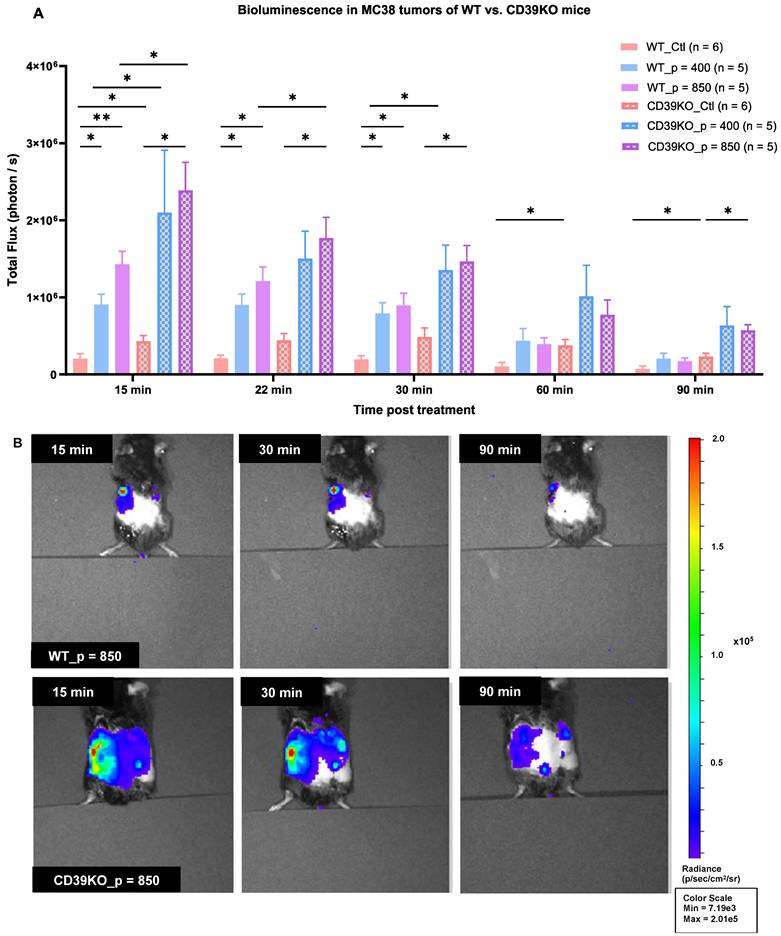
MB cavitation caused by UTMC has been shown to promote ATP release in mice muscle [44] and in tumors [45], but the effect of CD39 inhibition on ATP release was never studied. UTMC-treated and control tumors were imaged for bioluminescence. Our results showed that the baseline BLI signal is significantly higher in CD39KO than WT mice (p = 0.04, Figure 4A). The total flux (photon/sec) was also higher for the treated side in all the mice. ATP release was significantly higher in CD39KO compared to WT mice at 15 minutes post-UTMC at US pressures of 400 and 850 kPa (p = 0.02). At 22 and 30 minutes post-UTMC, the eATP levels were higher in CD39KO vs. WT only when treated at p = 850 kPa (p = 0.03 and 0.01, resp.). In WT mice, UTMC treatment at both US pressures enhanced ATP release compared to untreated controls up to 30 minutes post-UTMC. In CD39KO mice, UTMC enhanced ATP release at a pressure of 850 kPa compared to untreated control up to 90 minutes post-UTMC treatment (Figure 4B).
eATP levels in MC38 tumor in WT and CD39KO mice measured by bioluminescence. A) The baseline eATP signal in untreated control tumors was higher in CD39KO vs WT mice (p = 0.04, two-way ANOVA). UTMC treatment released more ATP in CD39KO than in WT mice (p = 0.002, two-way ANOVA). This difference was significant at both UTMC pressures at 15 min (p = 0.04 and 0.03, resp.). The increased eATP level was maintained longer in CD39KO_p = 850 until 90 min post-UTMC (p = 0.03). In the WT group, UTMC at 400 kPa and 850 kPa yielded a higher eATP signal compared to WT_Ctl until 30 minutes post-UTMC (p = 0.017 and 0.02). CD39KO_p = 850 had a higher eATP signal compared to CD39KO_Ctl up to 90 minutes post-UTMC (p = 0.011). B) Typical examples of BLI imaging representing local eATP released following UTMC treatment with 850 kPa in WT and CD39KO mice at 15, 30 and 90 minutes; Only left tumors received UTMC. BLI: bioluminescent imaging. CD39KO: CD39 knock-out mice; CD39KO_Ctl: No US control group in CD39KO mice; eATP: extracellular ATP; US: ultrasound; UTMC: ultrasound targeted microbubble cavitation; WT_Ctl; No US control group in wild-type mice.
UTMC induces tumoral vascular inflammation in CD39KO mice but not in WT mice
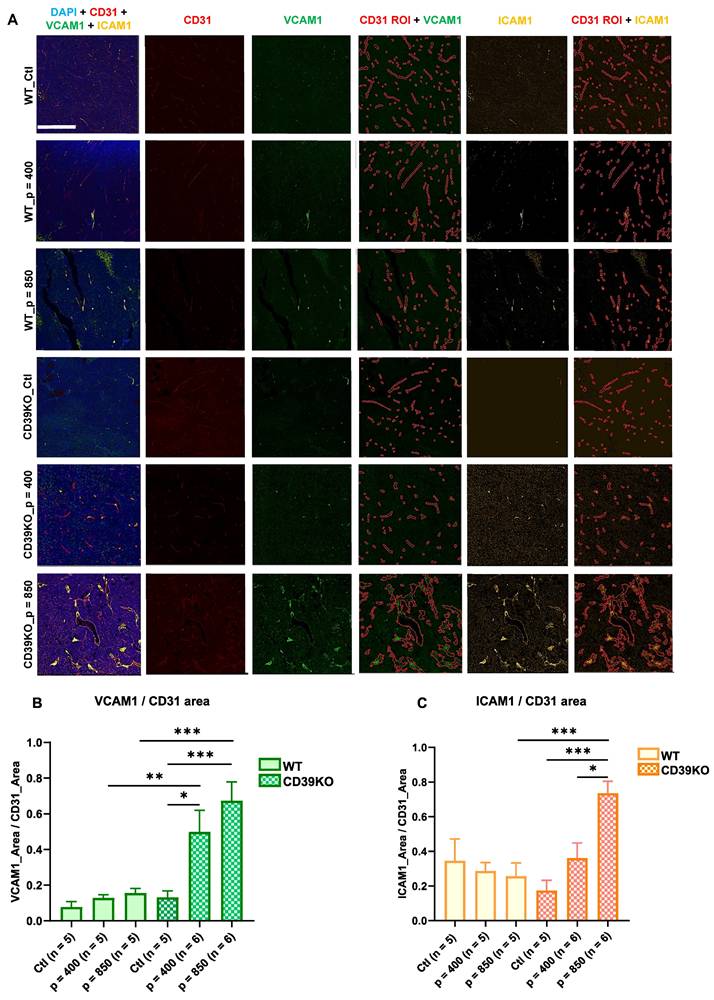
To identify inflammatory responses, the expression of endothelial ICAM-1 and VCAM-1 was assessed using histological analysis on tumors samples at 24 h (Figure 5). Immunofluorescence staining against CD31 was used to define the vasculature map, referred to as CD31 ROI. Subsequently, ICAM-1 and VCAM-1 expression within CD31 ROI was quantified. Our results showed that endothelial VCAM-1 expression significantly increased in CD39KO_p = 850 vs. CD39KO_Ctl and WT_p = 850 (p = 0.0004 and 0.0008, resp., Figure 5B). Similarly, VCAM1 expression was higher in CD39KO_p = 400 vs. CD39KO_Ctl and WT_p = 400 (p = 0.02 and 0.009, resp.). However, this increase was not observed in WT group. Additionally, endothelial ICAM-1 increased in CD39KO mice treated at 850 kPa compared to p = 400 (p = 0.02) and control group (p = 0.0006; Figure 5C). The difference between WT and CD39KO mice for ICAM-1 was significant only at p = 850 kPa UTMC (p = 0.0003).
Vascular inflammation markers following UTMC 24 h post-treatment. A) Typical multiplex immunofluorescence staining of CD31 (vascular endothelial marker, in red), VCAM-1 (green) and ICAM-1 (yellow) (vascular inflammatory markers). VCAM-1 and ICAM-1 are quantified within CD31 ROIs. The scale bar is 200 µm. B) VCAM-1 significantly increased in CD39KO_p = 850 vs. CD39KO_Ctl and WT_p = 850 (p = 0.0004 and 0.0008, resp.). Similarly, VCAM1 expression was higher in CD39KO_p = 400 vs. CD39KO_Ctl and WT_p = 400 (p = 0.02 and 0.009, resp.). C) ICAM1 expression in CD39KO_p = 850 was enhanced compared to CD39KO_p = 400 (p = 0.02), CD39KO_Ctl (p = 0.0006) and WT_p = 850 (p = 0.0003). CD39KO: CD39 knock out mice; CD39KO_Ctl: control group of CD39KO mice; ROI: region of interest; US: ultrasound; UTMC: ultrasound targeted microbubble cavitation; WT_Ctl; control group of wild-type mice.
UTMC induces cancer cell death and reduces tumor proliferation in WT and CD39KO mice
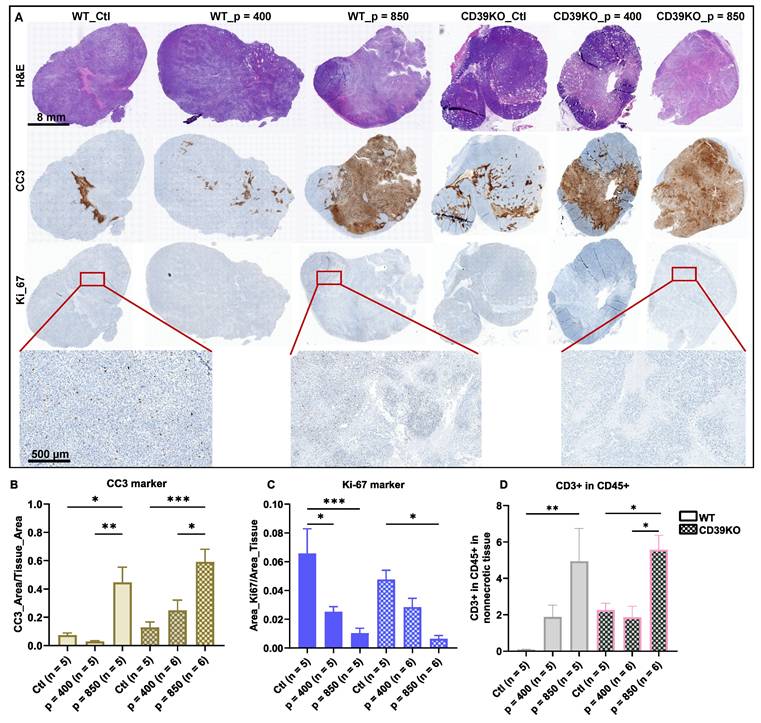
To investigate the downstream effect of ATP enhancement following UTMC treatment, we studied cancer cell death and proliferation in WT and CD39KO mice with US pressures of 400 and 850 kPa in MC38 tumors at 24 h (Figure 6A). IHC staining revealed a significant elevation in CC3 expression in both WT and CD39KO mice following UTMC treatment at 850 kPa compared to the control and 400 kPa groups (Figure 6B). While CC3 expression was higher in CD39KO versus WT mice (p = 0.02, two-way ANOVA), post-hoc multiple comparisons did not reveal significant differences at any US pressure. A notable reduction in Ki-67 expression was observed in WT mice following UTMC treatment at both 850 and 400 kPa compared to the control group (p < 0.0001 and 0.01, resp., Figure 6C). A similar pattern was detected in CD39KO mice, but significant only when treated with UTMC at 850 kPa (p = 0.003). Ki-67 expression was not significantly different in CD39KO mice compared to WT mice at any US pressure. Finally, IHC staining against the CD3 and CD45 markers was used to detect infiltrated T cells in tumor specimens. Our results showed that 24 h after UTMC, the ratio of CD3+ in CD45+ was significantly enhanced in WT mice at 850 kPa compared to the control group (p = 0.005; Figure 6D). In CD39KO mice the ratio of CD3+ in CD45+ cell was significantly increased in CD39KO_p = 850 compared to CD39KO_Ctl (p = 0.05) and CD39KO_p = 400 groups (p = 0.01). The ratio of CD3+ amongst CD45+ infiltrated immune cells was not significantly higher in CD39KO mice compared to WT mice with/without UTMC treatment (p = 0.15, two-way ANOVA).
Cancer cell death, cancer cell proliferation, and T cell infiltration following UTMC at 24 h. A) Typical H&E, CC3, and Ki-67 staining on sequential slides (scale bar = 8 mm). B) CC3 was highest in CD39KO_p = 850 and significantly increased compared to CD39KO_Ctl and CD39KO_p = 400 (p = 0.004 and 0.04, resp.). Differences in CC3 expression were not significant between CD39KO and WT at any UTMC pressure (p = 0.8, 0.4, 0.08, resp.). C) Ki-67 was lowest in the CD39KO_p = 850 and it was significantly lower than CD39KO_Ctl (p = 0.003). In the WT group, Ki-67 expression reduced at both US pressure 400 and 850 kPa (p = 0.01 and < 0.0001, resp.). Ki-67 expression was not different between WT vs. CD39KO mice at any UTMC pressure (p = 0.8, 0.4, 0.08, resp.). D) The ratio of CD3+ in CD45+ was significantly enhanced in WT_p = 850 compared to WT_Ctl (p = 0.005) and in CD39KO_p = 850 compared to CD39KO_Ctl and CD39KO_p = 400 (p = 0.05 and p = 0.01, resp.). Differences in the ratio of CD3+ in CD45+ was not significant between CD39KO and WT groups at any UTMC pressure (p = 0.19, 0.99, 0.93, resp.). H&E: hematoxylin and eosin; CC3: cleaved caspase 3; Ki-67: antigen Kiel 67; CD39KO_Ctl: control group of CD39 knock out mice; WT_Ctl: control group of wild-type mice.
Combination therapy of UTMC + aPDL1 + POM-1 reduced tumor growth better than monotherapies
Based on the previous acute findings, we selected 850kPa for the rest of the studies. We tested whether UTMC in combination with CD39 inhibition would improve aPDL1 efficacy in WT mice. Our data supported that combining UTMC with a low dose of aPDL1 (100 µg) and CD39 inhibition (250 µg POM-1) can synergize and effectively inhibit tumor growth. Our results indicate that neither UTMC nor aPDL1 monotherapy was sufficient to inhibit tumor growth. However, the combination significantly inhibited tumor growth compared to the control, aPDL1 alone, and MB without US (p < 0.0001, p = 0.017, 0.006, and 0.0008, resp.) (Figure 7A-C). This experiment was repeated to observe the effect of CD39 inhibition (Figure 7D-F). The combination of UTMC + aPDL1 + POM-1 resulted in the greatest tumor growth inhibition, starting as early as Day 3, compared to control and aPDL1 groups (Figure 7D and Table 1). One mouse in the UTMC + aPDL1 + POM1 completely rejected the tumor and did not develop tumor in the re-challenge experiment. This study indicates that ATP release following UTMC, in combination with pharmacological CD39 inhibition, improves the efficacy of aPDL1 at a low dose of 100 µg. Additionally, the combination of UTMC and aPDL1 improved mice survival compared to the aPDL1 and control groups (p = 0.03 and p = 0.04, resp., Mantel-Cox log-rank test, Figure S1). Three mice in the UTMC + aPDL1 + POM1 group developed clinical complications on Day 21-23 post-treatment. These complications included a 15-20% body weight loss, abnormal gait, and an enlarged gallbladder, likely due to the lack of food intake and dehydration, and were humanely euthanized upon observation. The combined treatment was further tested with a higher dosage of aPDL1 (200 μg), however we lost the improvement in the efficacy of the combination treatment, possibly because aPDL1 (200 μg) monotherapy was very efficacious in these models (Figure S2-S3).
Tumor growth inhibition following UTMC treatment with a low dose of aPDL1. A) Tumor growth inhibition following the combination or monotherapy of UTMC (850 kPa), MB and aPDL1 (100 µg). B & C, E & F) Individual tumor growth curve for each treatment. D) The greatest tumor growth inhibition effect was seen in the fully combined treatment group of UTMC + aPDL1 (100 µg) + POM1 (250 µg) compared to every other treatment. The data present means ± SEM (*P < 0.05, **P < 0.01, ****P < 0.0001, 2-way ANOVA test, multiple comparison test of Sidak). aPDL1: anti-programmed cell death ligand-1; POM-1: Sodium polyoxotungstate-1; UTMC: ultrasound targeted microbubble cavitation; WT: wild-type mice.
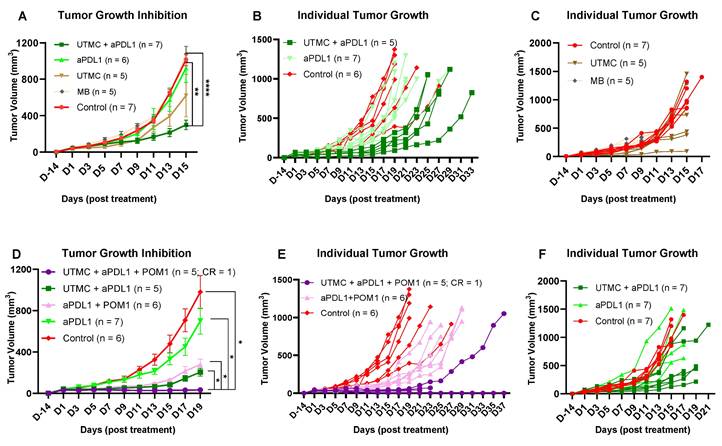
Statistical differences at different time points between treatment groups in Figure 7D
| Groups | aPDL1 + POM1 | UTMC + aPDL1 | UTMC + aPDL1 + POM1 | ||||||
|---|---|---|---|---|---|---|---|---|---|
| Dates | D3 | D7 | D19 | D3 | D7 | D19 | D3 | D7 | D19 |
| Control | 0.008 | 0.005 | 0.02 | 0.0021 | 0.001 | 0.01 | |||
| aPDL1 | 0.04 | 0.005 | 0.03 | 0.008 | 0.03 | 0.0002 | 0.0005 | 0.01 | |
| aPDL1 + POM1 | 0.02 | ||||||||
| UTMC + aPDL1 | 0.04 | ||||||||
UTMC-mediated eATP enhancement induced tumor infiltration of immune cells
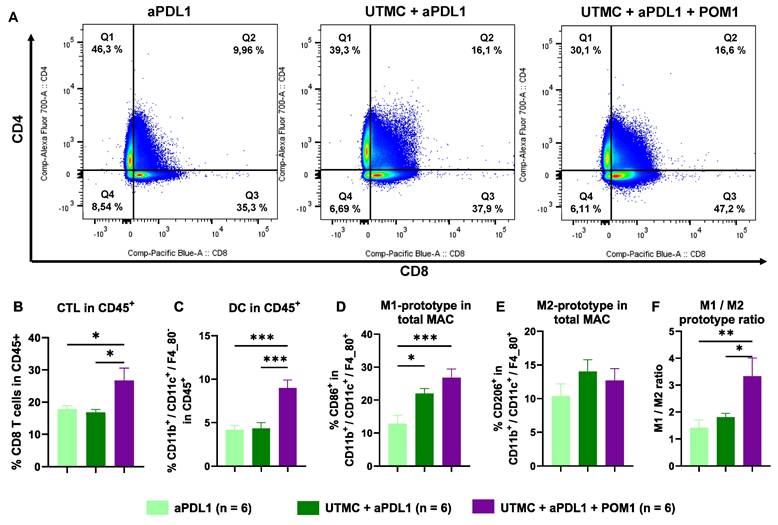
Flow cytometry analysis at D11 revealed that UTMC-mediated eATP enhancement shifted the immune cell response towards an inflamed state, with the most pronounced immune cell infiltration observed in the fully combined treatment (UTMC + aPDL1 + POM1) compared to UTMC + aPDL1 or aPDL1 monotherapy (Figure 8). The fully combined treatment group exhibited a lower percentage of immunosuppressive Tregs (CD4+/FoxP3+ T cells) versus aPDL1 monotherapy. Notably, this group showed a higher percentage of CTLs (CD8+ T cells) (Figure 8A-C), along with an increased CTL/Treg ratio (Figure 8D) compared to the other groups, indicating a shift toward a more cytotoxic TME.
eATP enhancement following UTMC in combination with aPDL1 induced anti-tumor immune responses. A) Flow cytometry analysis of the percentage of tumor infiltrated CTLs (Q3 represents CD8+ T cells) and CD4+ T cells in UTMC + aPDL1 + POM1 (n = 6), UTMC + aPDL1 (n = 6), and aPDL1 (n = 8) groups three days after last treatment. B) The fully combined treatment (UTMC + aPDL1 + POM1) reduced Tregs compared to aPDL1 monotherapy (p = 0.01). C) The fully combined treatment also showed a significant increase in the percentage of CTLs compared to UTMC + aPDL1 (p = 0.009) and aPDL1 (p = 0.001). D) The CTL/Treg ratio was enhanced in the fully combined treatment group compared to UTMC + aPDL1 (p = 0.02) and aPDL1 (p = 0.012). E) The percentage of DCs was increased in the fully combined treatment compared to UTMC + aPDL1 (p < 0.0001) and aPDL1 (p = 0.011). F) M1-prototype TAMs were increased in the fully combined treatment group compared to UTMC + aPDL1 (p = 0.015) and aPDL1 (p = 0.0008). G) Conversely, M2-prototype TAMs, typically associated with immunosuppression, were reduced in the fully combined treatment compared to aPDL1 (p = 0.02). H) The ratio of M1 to M2 prototype TAMs was significantly increased in the fully combined treatment compared to UTMC + aPDL1 (p = 0.04) and aPDL1 (p = 0.048). aPDL1: anti-programmed cell death ligand-1; CTL: cytotoxic T cells; DC: dendritic cells; POM-1: Sodium polyoxotungstate-1; TAM: tumor associated macrophages; UTMC: ultrasound targeted microbubble cavitation.
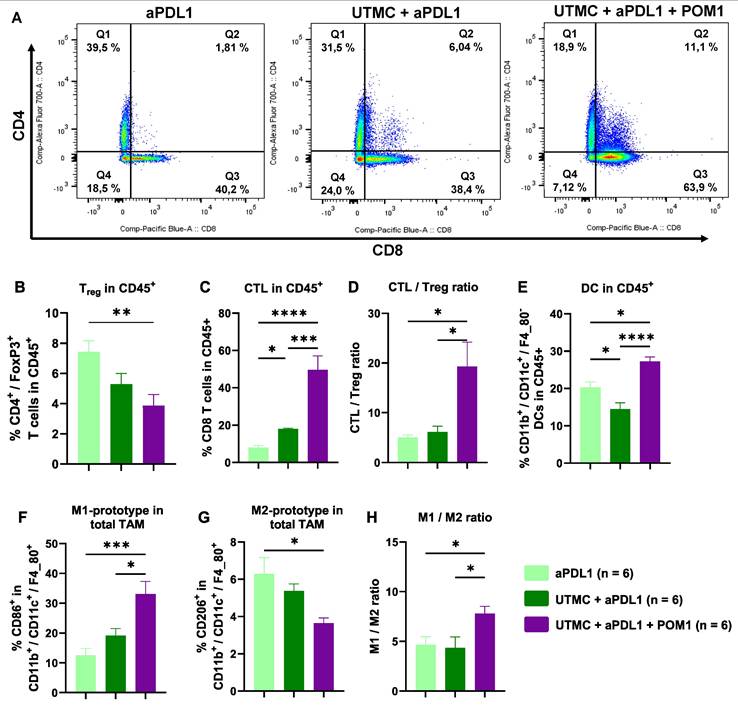
Moreover, the fully combined treatment group showed significant changes in the myeloid-derived immune cell subpopulations, with increased DCs and M1-prototype tumor-associated macrophages (TAMs), both associated with pro-inflammatory and anti-tumor activities. In contrast, the percentage of M2-prototype TAMs, which are typically linked to immunosuppression and tumor promotion, was reduced. (Figure 8G). Accordingly, the M2/M1 ratio was also reduced with the combined treatment (Figure 8H).
UTMC-mediated eATP enhancement increased immune cell trafficking to the TDLNs
Flow cytometry analysis of cells in the TDLNs highlight a higher percentage of CTLs following the full combination treatment compared to UTMC + aPDL1 (p = 0.005) and aPDL1 (p = 0.013) (Figure 9A-B). Interestingly, the percentage of DCs increased in UTMC + aPDL1 + POM1 vs. UTMC + aPDL1 (p = 0.004) and aPDL1 monotherapy (p = 0.0003) (Figure 9C). M1 macrophages also increased in the UTMC + aPDL1 + POM1 and UTMC + aPDL1 compared to aPDL1 (p = 0.001 and p = 0.046, resp.) (Figure 9D). We found no changes in M2 macrophages (Figure 9E), but did find an increase in the M1/M2 ratio in UTMC + aPDL1 + POM1 group compared to UTMC + aPDL1 (p = 0.03) and aPDL1 (p = 0.008) (Figure 9F).
eATP enhancement following UTMC in combination with aPDL1 increased immune cell trafficking to the TDLNs. A) Flow cytometry analysis of the percentage of CTLs (Q3 represents CD8+ T cells) and CD4+ T cells in TDLNs of UTMC + aPDL1 + POM1 (n = 7), UTMC + aPDL1 (n = 8), and aPDL1 (n = 8) groups three days after last treatment. B) The fully combined treatment increased the percentage of CTLs compared to UTMC + aPDL1 (p = 0.005) and aPDL1 (p = 0.013). C) The percentage of DCs was increased in the fully combined treatment group compared to UTMC + aPDL1 (p = 0.0004) and aPDL1 (p = 0.0003). D) M1-prototype macrophages were increased in the fully combined treatment group compared to UTMC + aPDL1 (p = 0.001) and aPDL1 (p = 0.046). E) However, M2-prototype macrophages did not show any differences across different groups. F) The ratio of M1 to M2 prototype TAMs was significantly increased in the fully combined treatment compared to UTMC + aPDL1 (p = 0.03) and aPDL1 (p = 0.008). aPDL1: anti-programmed cell death ligand-1; CTL: cytotoxic T cells; DC: dendritic cells; POM-1: Sodium polyoxotungstate-1; UTMC: ultrasound targeted microbubble cavitation.
Discussion
Understanding and exploiting purinergic signaling and ATP in immune checkpoint blockade therapy is an active area of research in immuno-oncology [12, 14, 15]. We recently identified that UTMC could release ATP locally in tumors [45] and postulated that this could be leveraged to improve ICB efficacy in combination with CD39 inhibition. In this study, in an MC38 colorectal carcinoma mouse model, we used non-ablative UTMC at two different US pressures 400 or 850 kPa to enhance tumoral ATP release, provoke immune responses, and improve aPDL1 therapeutic efficacy. Our pre and post UTMC perfusion cineloops support that our UTMC conditions did not cause vascular shutdown (Figure 2B) at either tested pressure. This is consistent with other studies exploring the combination of non-ablative UTMC with ICB treatment in pre-clinical models [36, 43, 46]. Note that UTMC can be adjusted to either shut down or preserve tumoral perfusion. Both ablative [47-49] and non-ablative [36, 46] UTMC have been shown to stimulate anti-tumor immune responses, thus turning cold TME into hot TME [5, 25, 36]. However, it remains unclear which regime (ablative vs non-ablative) is better, and if our results are applicable to ablative UTMC. Histologically, we then examined tissue samples collected 2 h post-UTMC treatment and observed notable vasodilation in all UTMC-treated, with a more pronounced effect at US pressure of 850 kPa in both WT and CD39KO models (Figure 3), compared to untreated controls. We observed enlarged blood vessels, at 2 h post UTMC, a histological confirmation of the ultrasound perfusion data, and suggesting an improvement in tumor vascularization, as also reported by others [36]. We compared ATP release in WT and CD39KO mice using bioluminescence imaging. In the CD39KO model, we found that UTMC with p = 850 kPa enhanced eATP release in MC38 tumors compared to the contralateral untreated control, and compared to WT, and remained higher at least for 90 minutes post-UTMC (Figure 4), supporting that CD39 inhibition could increase UTMC mediated ATP release. Since ATP is a pro-inflammatory molecule, we investigated downstream vascular inflammation markers, tumor cell viability and immune cell infiltration at 24 h after UTMC treatment using histological techniques. Interestingly, we observed that upon UTMC-mediated ATP release, vascular inflammation markers (ICAM-1/VCAM-1) were upregulated (Figure 5) with an increased response in the CD39KO model. Our data consistently showed increased cancer cell death (CC3 expression), and decreased cell proliferation (Ki-67) with increasing UTMC pressure (Figure 6).
In aggregate, our acute data supports that ATP released by UTMC causes vascular inflammation and helps recruit T-cells: since immune cells rely on vascular markers like ICAM-1 and VCAM-1 for adhesion and diapedesis, our findings support that vascular inflammation post-UTMC is a mechanism explaining the increased ratio of CD3+ cells found in tumors at 24 h. This finding is in line with previous reports describing UTMC-induced anti-tumor immune responses through the release of DAMPs [36, 43, 50]. Recently, UTMC was reported to induce HMGB1 [33, 43] and HSP70 expression and calreticulin translocation in MC38 tumors, indicating DAMPs' involvement in recruiting adaptive immune responses [43]. However, despite increased ATP and vascular inflammation in CD39KO mice, acute cell death (CC3) and cell proliferation (Ki-67) were not different in the CD39KO model compared to the WT at 24 h (Figure 6B). These findings are consistent with the increased ratio of CD3+ in CD45+ cells infiltrated in tumors treated with UTMC at p = 850 kPa (Figure 6) but without a significant effect with CD39 inhibition in the acute response.
The limited effectiveness of ICB therapies against solid tumors has drawn attention to the need for combining other therapeutic modalities with ICBs, including UTMC [5, 51, 52]. In this study, we combined ICB with non-ablative UTMC to maintain tumor permeability and promote an immune-stimulatory environment, thereby potentially improving the efficacy of aPDL1 in the MC38 model. Our longitudinal studies demonstrate that MB alone, or UTMC alone did not cause growth inhibition in our model (Figure 7A-C), supporting that MB toxicity or possible vascular damage was not a major driver in our UTMC conditions. Yet, with a 100 µg aPDL1 dose (a dose insufficient in monotherapy) we found a greater tumor growth inhibition following UTMC + aPDL1, consistent with several other studies that combined ICB with UTMC [36, 43, 46]. One mechanism often reported is an increase in mAb extravasation with UTMC, as described by us and others [36, 42, 46, 53]. Most interestingly, combining UTMC + aPDL1 + POM1 dramatically inhibited MC38 tumor growth (Figures 7D-F), and was significantly better than all other treatment combinations, including UTMC + aPDL1. Interestingly, aPDL1 + POM1 was also better than aPDL1 alone, as expected [11], which supports that UTMC can further improve the pharmacological inhibition of CD39, likely by increasing eATP. In the UTMC + aPDL1 + POM1 group, one mouse completely rejected the tumor, and upon re-challenge, it did not develop a tumor for up to 70 days.
Not surprisingly, we found that this synergistic effect was dose-dependent: in the supplementary material, we show that with an increased dose of aPDL1 (200 µg), we lost the improvement in efficacy of the combination treatment, possibly because monotherapy was very efficacious in this model (Figure S2-S3).
To further investigate the mechanisms of the treatment efficacy, we studied the cellular immune response in the tumors and TDLN at day 11. Flow cytometry results of tumoral immune cell infiltration indicate that UTMC-mediated eATP enhancement combined with POM1 and aPDL1 (100 µg), significantly shifted the immune landscape within the TME toward an inflamed state (Figure 8). The UTMC + aPDL1 + POM1 showed an enhanced tumoral immune cell infiltration compared to either UTMC + aPDL1 or aPDL1 monotherapy, with a higher percentage of CTLs and a reduced percentage of immunosuppressive Tregs. The increased CTL/Treg ratio highlights a more favorable immune environment for tumor clearance. Additionally, the combination treatment elevated pro-inflammatory myeloid-derived immune cell subpopulations, including DCs and M1-prototype TAMs, while reducing the immunosuppressive M2-prototype TAMs, all of which promote enhanced antigen presentation, immune activation, and immunogenic cancer cell death. Our results align with previous studies that underscore the importance of modulating the TME to improve ICB efficacy. For instance, Li et al. (2019) demonstrated that CD39 blockade is fully dependent on host lymphocytes, enhancing intratumoral T-cell activation and converting a cold, non-inflamed TME into a hot, inflamed one, thus making it more responsive to aPDL1 therapy [11]. Also, Li et al. (2021) showed that UTMC improved CTL infiltration and facilitated aPDL1 delivery [36]. Tang et al. (2023) further emphasized that ultrasound-based therapies depend on CTL-mediated immunity and DC-driven antigen presentation, which is consistent with our finding of increased DCs and M1-TAMs, essential for initiating CTL-driven anti-tumor immune responses [43]. Our findings are in line with those studies but additionally support the important role of ATP and CD39 inhibition in promoting immune reprogramming.
To further investigate the implication of the adaptive immune system in the anti-tumor response, we also analyzed the TDLNs. In TDLNs, the UTMC + aPDL1 + POM1 treatment also increased CTLs, DCs, and M1-prototype macrophages suggesting heightened immune activation, and antigen presentation (Figure 9), which indicated a possible immune activation at the systemic level. The higher M1/M2 macrophage ratio further underscores the anti-tumor effects of this combination treatment. TDLNs play a crucial role in DC-mediated antigen presentation to CTLs, thereby orchestrating and amplifying anti-tumor immune responses.
Altogether, our longitudinal data supports that a local UTMC treatment on the tumor, combined with CD39 inhibition, elicits a strong adaptive immune response that we could detect in the tumor and in the tumor draining lymph nodes. This response could dramatically improve the response to a low dose aPDL1 in our rodent model. Interestingly, our data were also consistent with previous findings, as the combination of CD39 blockade and aPDL1 [11] as well as UTMC and aPDL1 [36, 39], has been shown to enhance CTL infiltration and improve aPDL1-mediated anti-tumor immune responses. However, our results demonstrate even greater immune activation following the combination of UTMC, aPDL1, and the CD39 inhibitor (POM1). In addition to T cells, our data also supports the activation of myeloid-derived immune subsets in the combination therapy.
The safety of UTMC as a spatially targeted therapy has been largely demonstrated most notably in the brain where it is being clinically tested for BBB [42]. At the preclinical level, many groups have combined focused ultrasound and immunotherapy successfully and safely [36, 46, 47, 54, 55]. Nevertheless, the safety of UTMC and focused ultrasound in general depends on the ultrasound parameters used and the precise localisation of the ultrasound energy. Compared to HIFU or histotripsy or even ablative UTMC, our mild flow preserving US parameters are not expected to cause safety concerns. In terms of combining UTMC with ICB and CD39 inhibitions, the safety of the approach remains to be fully established.
Our data strongly supports that CD39 inhibition can increase ATP release by UTMC and improve the immune response in this model. Please note that we used a genetic knock out model in our acute studies and a small molecule systemic inhibitor in our longitudinal studies. The reason for this was that we could not measure bioluminescence in the presence of POM1. Please note that in the CD39KO model, we found an elevated ATP signal at baseline, which was expected. For the efficacy studies, the use of a pharmacological approach served three purposes: (1) it allowed a more accurate comparison between groups all composed of WT mice; (2) it allowed to demonstrate that CD39 is targetable with a small molecule; (3) it reduced chronic effects of CD39 knock down. The full physiological effects of CD39 inhibitions, which are beyond the scope of this paper, can be found here [56-58]. Further investigation is needed to elucidate the interactions between different cell types in the immune response and the respective roles of innate and adaptive immunity. The strength of the adaptive immune stimulation also remains to be studied in an abscopal model.
Conclusion
In conclusion, this study demonstrates that non-ablative UTMC increased extracellular ATP in our subcutaneous tumor model, particularly for CD39KO mice. Vascular inflammation, which also increased with UTMC and CD39 inhibition, is proposed as a mechanism induced by tumoral ATP release, contributing to anti-tumor immune responses. At 24 h post-treatment, UTMC at p = 850 kPa induced cancer cell death and reduced cancer cell proliferation, which could indicate an innate immune response induced by ATP at this time point. Most interestingly, the combination of UTMC + aPDL1 + POM1 caused dramatic MC38 tumor growth inhibition compared to all other combination therapies. At day 11, this treatment also increased cytotoxic T cells (CTL), the CTL/Treg ratio, dendritic cells, and M1-prototype tumor-associated macrophages, while reducing M2-prototype macrophages within the tumor. In the TDLNs, the fully combined treatment elevated CTLs, dendritic cells, and M1-prototype macrophages, with a concurrent reduction in M2-prototype macrophages. To the best of our knowledge, this is the first study to demonstrate the role of ATP in UTMC-mediated enhanced ICB efficacy, which paves the way for leveraging purinergic signaling in immune check point inhibition using ultrasound targeted image guided therapy.
Abbreviations
aPDL1: anti-programmed cell death ligand-1; BLI: bioluminescent imaging; CD3: cluster of differentiation 3; CD45: cluster of differentiation 45; CD39KO: CD39 knock out mice; CEUS: contrast enhanced ultrasonography; CTL: cytotoxic T cells; DAMP: danger associated molecular pattern; DC: dendritic cells; eATP: extracellular ATP; FUS: focused ultrasound; H&E: hematoxylin and eosin staining; HIFU: high intensity focused ultrasound; ICAM-1: intercellular adhesion molecule-1; IHC: immunohistochemistry; IF: immunofluorescent; MAC: macrophage MB: microbubble; MI: mechanical index; POM-1: sodium polyoxotungstate; ROI: region of Interest; TAM: tumor associated macrophage; TDLN: tumor-draining lymph node; TME: tumor microenvironment; Treg: regulatory T cells; UTMC: ultrasound targeted microbubble cavitation; VCAM-1: vascular cell adhesion molecule 1; WT: wild type mice.
Supplementary Material
Supplementary figures.
Acknowledgements
This work was funded by the Gaudet-Chartier fund and the Fondation du CHUM. S.J. and S.B received support from the University of Montreal and the Institut du Cancer de Montréal (Canderel scholarships). F.Y. received salary support from the FRQS-Chercheur Boursier.
The authors would like to extend their gratitude to the personnel of the Molecular Pathology Platform at CRCHUM for their valuable consultations and assistance with histological examinations particularly Dr. Feryel Azzi and Dr. Guillaume St-Jean. Special thanks are also due to the staff of the CRCHUM animal facility, particularly Melissa Marcoux, Dr. Maryse Boulay, and Dr. Etienne Blais, for their invaluable support throughout the in vivo studies. Illustrations were created using BioRender.
Author contributions
Sepideh Jahangiri: conceptualization, methodology, investigation, software analysis, data curation, writing original draft, formal analysis; Samuel Bourdages: UTMC treatment in ATP measurement experiment; Emma Skora: FACS data analysis validation. John Stagg: methodology, resources, supervision. Francois Yu: conceptualization, supervision, validation, resources, writing - review & editing, project administration, funding.
Competing Interests
The authors have declared that no competing interest exists.
References
1. Lara R, Adinolfi E, Harwood CA, Philpott M, Barden JA, Di Virgilio F. et al. P2X7 in cancer: from molecular mechanisms to therapeutics. Front Pharmacol. 2020;11:793
2. Galluzzi L, Buqué A, Kepp O, Zitvogel L, Kroemer G. Immunogenic cell death in cancer and infectious disease. Nat Rev Immunol. 2017;17:97-111
3. Di Virgilio F, Adinolfi E. Extracellular purines, purinergic receptors and tumor growth. Oncogene. 2017;36:293-303
4. McAllister SS, Weinberg RA. Tumor-host interactions: a far-reaching relationship. J Clin Oncol. 2010;28:4022-8
5. Jahangiri S, Yu F. Fundamentals and Applications of Focused Ultrasound-Assisted Cancer Immune Checkpoint Inhibition for Solid Tumors. Pharmaceutics. 2024;16:411
6. Xing S, Grol MW, Grutter PH, Dixon SJ, Komarova SV. Modeling interactions among individual P2 receptors to explain complex response patterns over a wide range of ATP concentrations. Front Physiol. 2016;7:294
7. Kepp O, Loos F, Liu P, Kroemer G. Extracellular nucleosides and nucleotides as immunomodulators. Immunol Rev. 2017;280:83-92
8. Di Virgilio F, Sarti AC, Falzoni S, De Marchi E, Adinolfi E. Extracellular ATP and P2 purinergic signalling in the tumour microenvironment. Nat Rev Cancer. 2018;18:601-18
9. Ghiringhelli F, Apetoh L, Tesniere A, Aymeric L, Ma Y, Ortiz C. et al. Activation of the NLRP3 inflammasome in dendritic cells induces IL-1β-dependent adaptive immunity against tumors. Nat Med. 2009;15:1170-8
10. Aswad F, Kawamura H, Dennert G. High sensitivity of CD4+ CD25+ regulatory T cells to extracellular metabolites nicotinamide adenine dinucleotide and ATP: a role for P2X7 receptors. J Immunol Res. 2005;175:3075-83
11. Li X-Y, Moesta AK, Xiao C, Nakamura K, Casey M, Zhang H. et al. Targeting CD39 in cancer reveals an extracellular ATP-and inflammasome-driven tumor immunity. Cancer Discov. 2019;9:1754-73
12. Allard B, Allard D, Buisseret L, Stagg J. The adenosine pathway in immuno-oncology. Nat Rev Clin Oncol. 2020;17:611-29
13. Mediavilla-Varela M, Castro J, Chiappori A, Noyes D, Hernandez DC, Allard B. et al. A novel antagonist of the immune checkpoint protein adenosine A2a receptor restores tumor-infiltrating lymphocyte activity in the context of the tumor microenvironment. Neoplasia. 2017;19:530-6
14. Allard B, Longhi MS, Robson SC, Stagg J. The ectonucleotidases CD 39 and CD 73: novel checkpoint inhibitor targets. Immunol Rev. 2017;276:121-44
15. Allard B, Beavis PA, Darcy PK, Stagg J. Immunosuppressive activities of adenosine in cancer. Curr Res Pharmacol Drug Discov. 2016;29:7-16
16. Stagg J, Divisekera U, Duret H, Sparwasser T, Teng MW, Darcy PK. et al. CD73-deficient mice have increased antitumor immunity and are resistant to experimental metastasis. Cancer Res. 2011;71:2892-900
17. Jackson SW, Hoshi T, Wu Y, Sun X, Enjyoji K, Cszimadia E. et al. Disordered purinergic signaling inhibits pathological angiogenesis in cd39/Entpd1-null mice. Am J Pathol. 2007;171:1395-404
18. Vultaggio-Poma V, Sarti AC, Di Virgilio F. Extracellular ATP: a feasible target for cancer therapy. Cells. 2020;9:2496
19. Sharma S, Kalra H, Akundi RS. Extracellular ATP mediates cancer cell migration and invasion through increased expression of cyclooxygenase 2. Front Pharmacol. 2021;11:617211
20. Liu Z, Liu X, Shen H, Xu X, Zhao X, Fu R. Adenosinergic axis and immune checkpoint combination therapy in tumor: A new perspective for immunotherapy strategy. Front Immunol. 2022;13:978377
21. du Rusquec P, de Calbiac O, Robert M, Campone M, Frenel JS. Clinical utility of pembrolizumab in the management of advanced solid tumors: an evidence-based review on the emerging new data. Cancer Manag Res. 2019:4297-312
22. Sonpavde GP, Grivas P, Lin Y, Hennessy D, Hunt JD. Immune-related adverse events with PD-1 versus PD-L1 inhibitors: a meta-analysis of 8730 patients from clinical trials. Future Oncol. 2021
23. Sonpavde GP, Grivas P, Lin Y, Hennessy D, Hunt JD. Immune-related adverse events with PD-1 versus PD-L1 inhibitors: a meta-analysis of 8730 patients from clinical trials. Taylor & Francis. 2021
24. Liu Y-T, Sun Z-J. Turning cold tumors into hot tumors by improving T-cell infiltration. Theranostics. 2021;11:5365
25. Joiner JB, Pylayeva-Gupta Y, Dayton PA. Focused ultrasound for immunomodulation of the tumor microenvironment. J Immunol. 2020;205:2327-41
26. Qu S, Worlikar T, Felsted AE, Ganguly A, Beems MV, Hubbard R. et al. Non-thermal histotripsy tumor ablation promotes abscopal immune responses that enhance cancer immunotherapy. JITC. 2020;8:e000200
27. Schade GR, Wang YN, D'Andrea S, Hwang JH, Liles WC, Khokhlova TD. Boiling Histotripsy Ablation of Renal Cell Carcinoma in the Eker Rat Promotes a Systemic Inflammatory Response. Ultrasound Med Biol. 2019;45:137-47
28. Snipstad S, Vikedal K, Maardalen M, Kurbatskaya A, Sulheim E, de Lange Davies C. Ultrasound and microbubbles to beat barriers in tumors: Improving delivery of nanomedicine. Adv Drug Deliv Rev. 2021;177:113847
29. Chowdhury SM, Abou-Elkacem L, Lee T, Dahl J, Lutz AM. Ultrasound and microbubble mediated therapeutic delivery: Underlying mechanisms and future outlook. J Control Release. 2020;326:75-90
30. Wu Y, Liu Y, Huang Z, Wang X, Jin Z, Li J. et al. Control of the activity of CAR-T cells within tumours via focused ultrasound. Nat Biomed Eng. 2021;5:1336-47
31. Sabbagh A, Beccaria K, Ling X, Marisetty A, Ott M, Caruso H. et al. Opening of the blood-brain barrier using low-intensity pulsed ultrasound enhances responses to immunotherapy in preclinical glioma models. Clin Cancer Res. 2021;27:4325-37
32. Jenkins RW, Barbie DA, Flaherty KT. Mechanisms of resistance to immune checkpoint inhibitors. Br J Cancer. 2018;118:9-16
33. Joiner JB, Kren NP, Durham PG, McRee AJ, Dayton PA, Pylayeva-Gupta Y. Low-Intensity Focused Ultrasound Produces Immune Response in Pancreatic Cancer. Ultrasound Med Biol. 2022;48:2344-53
34. Deprez J, Lajoinie G, Engelen Y, De Smedt S, Lentacker I. Opening doors with ultrasound and microbubbles: Beating biological barriers to promote drug delivery. Adv Drug Deliv Rev. 2021;172:9-36
35. Hendricks-Wenger A, Hutchison R, Vlaisavljevich E, Allen IC. Immunological effects of histotripsy for cancer therapy. Front Oncol. 2021;11:681629
36. Li N, Tang J, Yang J, Zhu B, Wang X, Luo Y. et al. Tumor perfusion enhancement by ultrasound stimulated microbubbles potentiates PD-L1 blockade of MC38 colon cancer in mice. Cancer Lett. 2021;498:121-9
37. Shan H, Zheng G, Bao S, Yang H, Shrestha UD, Li G. et al. Tumor perfusion enhancement by focus ultrasound-induced blood-brain barrier opening to potentiate anti-PD-1 immunotherapy of glioma. Transl Oncol. 2024;49:102115
38. Kim C, Lim M, Woodworth GF, Arvanitis CD. The roles of thermal and mechanical stress in focused ultrasound-mediated immunomodulation and immunotherapy for central nervous system tumors. J Neurooncol. 2022;157:221-36
39. Liu S, Zhang Y, Liu Y, Wang W, Gao S, Yuan W. et al. Ultrasound-targeted microbubble destruction remodels tumour microenvironment to improve immunotherapeutic effect. Br J Cancer. 2023;128:715-25
40. Michon S, Rodier F, Yu FT. Targeted anti-cancer provascular therapy using ultrasound, microbubbles, and nitrite to increase radiotherapy efficacy. Bioconjug Chem. 2022;33:1093-105
41. Sirsi SR, Borden MA. Advances in ultrasound mediated gene therapy using microbubble contrast agents. Theranostics. 2012;2:1208-22
42. Meng Y, Reilly RM, Pezo RC, Trudeau M, Sahgal A, Singnurkar A. et al. MR-guided focused ultrasound enhances delivery of trastuzumab to Her2-positive brain metastases. Sci Transl Med. 2021;13:eabj4011
43. Tang J, Tang J, Li H, Zhou J, Tang N, Zhu Q. et al. Mechanical destruction using a minimally invasive Ultrasound Needle induces anti-tumor immune responses and synergizes with the anti-PD-L1 blockade. Cancer Lett. 2023;554:216009
44. Belcik JT, Davidson BP, Xie A, Wu MD, Yadava M, Qi Y. et al. Augmentation of muscle blood flow by ultrasound cavitation is mediated by ATP and purinergic signaling. Circulation. 2017;135:1240-52
45. Grygorczyk R, Boudreault F, Ponomarchuk O, Tan JJ, Furuya K, Goldgewicht J. et al. Lytic Release of Cellular ATP: Physiological Relevance and Therapeutic Applications. Life (Basel). 2021;11:700
46. Sheybani ND, Breza VR, Paul S, McCauley KS, Berr SS, Miller GW. et al. ImmunoPET-informed sequence for focused ultrasound-targeted mCD47 blockade controls glioma. J Control Release. 2021;331:19-29
47. Bulner S, Prodeus A, Gariepy J, Hynynen K, Goertz DE. Enhancing Checkpoint Inhibitor Therapy with Ultrasound Stimulated Microbubbles. Ultrasound Med Biol. 2019;45:500-12
48. Goertz D, Cruz W, Bulner S, Wright A, Kerbel R. Abstract LB-079: Microbubble mediated focused ultrasound therapy enhances the antitumor potency and durability of anti-PD-L1 checkpoint blockade. AACR. 2020 p. LB-079
49. Hunt SJ, Gade T, Soulen MC, Pickup S, Sehgal CM. Antivascular ultrasound therapy: magnetic resonance imaging validation and activation of the immune response in murine melanoma. J Ultrasound Med. 2015;34:275-87
50. Curley CT, Stevens AD, Mathew AS, Stasiak K, Garrison WJ, Miller GW. et al. Immunomodulation of intracranial melanoma in response to blood-tumor barrier opening with focused ultrasound. Theranostics. 2020;10:8821-33
51. Yuan J, Ye D, Chen S, Chen H. Therapeutic ultrasound-enhanced immune checkpoint inhibitor therapy. Front Phys. 2021;9:636985
52. Zappasodi R, Merghoub T, Wolchok JD. Emerging concepts for immune checkpoint blockade-based combination therapies. Cancer cell. 2018;33:581-98
53. Amate M, Goldgewicht J, Sellamuthu B, Stagg J, Yu FTH. The effect of ultrasound pulse length on microbubble cavitation induced antibody accumulation and distribution in a mouse model of breast cancer. Nanotheranostics. 2020;4:256-69
54. Cohen G, Chandran P, Lorsung RM, Aydin O, Tomlinson LE, Rosenblatt RB. et al. Pulsed-focused ultrasound slows B16 melanoma and 4T1 breast tumor growth through differential tumor microenvironmental changes. Cancers. 2021;13:1546
55. Sheybani ND, Witter AR, Thim EA, Yagita H, Bullock TN, Price RJ. Combination of thermally ablative focused ultrasound with gemcitabine controls breast cancer via adaptive immunity. J Immunother Cancer. 2020 8
56. Jackson SW, Hoshi T, Wu Y, Sun X, Enjyoji K, Cszimadia E. et al. Disordered purinergic signaling inhibits pathological angiogenesis in cd39/Entpd1-null mice. Am J Pathol Res. 2007;171:1395-404
57. Kanthi YM, Sutton NR, Pinsky DJ. CD39: Interface between vascular thrombosis and inflammation. Curr Atheroscler Rep. 2014;16:1-8
58. Sun X, Cárdenas A, Wu Y, Enjyoji K, Robson SC. Vascular stasis, intestinal hemorrhage, and heightened vascular permeability complicate acute portal hypertension in cd39-null mice. Am J Physiol Gastrointest Liver Physiol. 2009;297:G306-G11
Author contact
![]() Corresponding author: francois.yuca.
Corresponding author: francois.yuca.