Impact Factor
- Issue 14; 2026
- Issue 13; 2026
- Issue 12; 2026
- Issue 11; 2026
- Issue 10; 2026
- Volume 16; 2026
- Advance Articles
- Past Issues
- Cover Images
- Cover Suggestion
- Index & Coverage
- Special Issues
Introduction
Results
Discussion
Conclusion
Materials and Methods
Supplementary Material
Acknowledgements
References
International Journal of Biological Sciences
International Journal of Medical Sciences
 Global reach, higher impact

Theranostics 2025; 15(10):4693-4707. doi:10.7150/thno.108479 This issue Cite
Research Paper
In vivo spatiotemporal mapping of proliferation activity in gliomas via water-exchange dynamic contrast-enhanced MRI
Ruiliang Bai1,2,3† ![]() , Yinhang Jia4,5†, Bao Wang6, Zejun Wang4, Guangxu Han4, Lijun Liang7, Lin Chen7, Yang Ming8, Guidong Zhu9, Yi-Cheng Hsu10, Peng Zhao7, Yi Zhang11, Zhiqiang Liu7, Chong Liu12, Zhaoqing Li13, Yingchao Liu7,14
, Yinhang Jia4,5†, Bao Wang6, Zejun Wang4, Guangxu Han4, Lijun Liang7, Lin Chen7, Yang Ming8, Guidong Zhu9, Yi-Cheng Hsu10, Peng Zhao7, Yi Zhang11, Zhiqiang Liu7, Chong Liu12, Zhaoqing Li13, Yingchao Liu7,14 ![]()
1. Interdisciplinary Institute of Neuroscience and Technology & Liangzhu Laboratory, Zhejiang University School of Medicine, Hangzhou, China.
2. Key Laboratory of Novel Targets and Drug Study for Neural Repair of Zhejiang Province, School of Medicine, Hangzhou City University, Hangzhou, China.
3. MOE Frontier Science Center for Brain Science and Brain-machine Integration, State Key Laboratory of Brain-machine Intelligence, Zhejiang University, Hangzhou, China.
4. Key Laboratory of Biomedical Engineering of Ministry of Education, College of Biomedical Engineering and Instrument Science, Zhejiang University, Hangzhou, China.
5. Lingang Laboratory, Shanghai, China.
6. Department of Radiology, Qilu Hospital of Shandong University, Jinan, China.
7. Department of Neurosurgery, Shandong Provincial Hospital Affiliated to Shandong First Medical University, Jinan, China.
8. Department of Neurosurgery, Affiliated Hospital of Southwest Medical University, Luzhou, China.
9. Department of Neurosurgery, The Second Hospital of Shandong University, Jinan, China.
10. MR Collaboration, Siemens Healthcare, Shanghai, China.
11. Department of Information, Shandong Provincial Maternal and Child Health Care Hospital Affiliated with Qingdao University, Jinan, China.
12. MOE Frontier Science Centre for Brain Science and Brain-machine Integration, School of Brain Science and Brain Medicine, Zhejiang University, Hangzhou, China.
13. Department of Physical Medicine and Rehabilitation of the Affiliated Sir Run Run Shaw Hospital AND Interdisciplinary Institute of Neuroscience and Technology, Zhejiang University School of Medicine, Hangzhou, China.
14. Shandong Institute of Brain Science and Brain-inspired Research, Shandong First Medical University, Jinan, China.
†These authors contributed equally to this work.
Received 2024-12-29; Accepted 2025-3-5; Published 2025-3-24
Abstract

Proliferation activity mapping is crucial for the guidance of first biopsy and treatment evaluation of gliomas due to the highly heterogenous nature of glioma tumor. Here we propose and demonstrate an ease-of-use way of in vivo spatiotemporal mapping of proliferation activity by simply tracking transmembrane water dynamics with magnetic resonance imaging (MRI). Specifically, we demonstrated that proliferation activity can accelerate the transmembrane water transport in glioma cells.
Method: The transmembrane water-efflux rate (kio) measured by water-exchange dynamic contrast-enhanced (DCE) MRI. Immunofluorescence, immunohistochemistry, and immunocytochemistry staining were used to validate results obtained from the in vivo imaging studies.
Results: In glioma cell cultures, kio precisely followed the dynamic changes of proliferation activity in growth cycles and response to temozolomide (TMZ) treatment. In both animal glioma model and human glioma, kio linearly and strongly correlated with the spatial heterogeneity of intra-tumoral proliferation activity. More importantly, proliferation activity predicted by the single MRI parameter kio is much more accurate than those predicted by state-of-the-art methods using multimodal standard MRIs and advanced machine learning. Upregulated aquaporin 4 (AQP4) expression were observed in most proliferating glioma cells and the knockout of AQP4 could largely slow down proliferation activity, suggesting AQP4 is the potential molecule connecting MRI-kio with proliferation activity.
Conclusion: This study provides an ease-of-use, accurate, and non-invasive imaging method for the spatiotemporal monitoring of proliferation activity in glioma.
Keywords: glioma, proliferation activity, water-exchange MRI, spatiotemporal monitoring
Introduction
The malignancy of gliomas is largely attributed to heterogeneous tumor proliferation [1]. In vivo mapping of the intratumoral heterogeneity of proliferation activity in gliomas is crucial for ensuring that the initial biopsy can accurately grade the tumor for precise treatment [2]. Spatiotemporal mapping of proliferation activity in gliomas also facilitates timely evaluation of the treatment response and supports glioma recurrence monitoring [3-5], since radiotherapy, chemotherapy (e.g., temozolomide [TMZ]), and the newly developed tumor treatment field of gliomas all target proliferative tumor cells, while silent, stem-like tumor cells often show treatment resistance and are believed to be the main sources of glioma recurrence [6,7].
Ki67 is the most widely used marker of cell proliferation in clinics [8]. However, the extent of Ki67 expression can only be determined after surgical resection or biopsy of the tumor, making it impossible to assess Ki67 expression in vivo. Furthermore, Ki67 expression in gliomas exhibits considerable spatial heterogeneity, the pathological specimen used for analysis represents only a portion of the tumor tissue, leaving the expression of Ki67 in other tumor subregions unknown. Magnetic resonance imaging (MRI), free from ionizing radiation, plays a crucial role in managing gliomas. However, the standard MRIs implemented for glioma management lack sensitivity and specificity in detecting proliferation activity. Therefore, a non-invasive and high spatial-resolution method for Ki67 mapping could greatly improve the accuracy of glioma diagnosis and treatment monitoring.
Here we propose and show proliferation activity can accelerate the transmembrane water transport in glioma cells, which opens a new window for spatiotemporal mapping of proliferation activity in glioma by using water-exchange dynamic contrast-enhanced (DCE) MRI (Fig 1). Proliferation activity is a metabolically demanding process that requires the upregulation of molecule/ion transport across cell membranes, including water transport to maintain isotonicity [9,10]. Water-exchange DCE-MRI, as with conventional DCE-MRI, which has been widely applied in pre-clinical and clinical studies, can be acquired via clinical widely used gadolinium-based contrast agents (CAs), e.g., gadoteridol, and be combined with contrast-enhanced MRI for glioma diagnosis without added costs [11]. Water-exchange DCE-MRI modifies the scan parameters of DCE-MRI to achieve higher sensitivity to transmembrane water exchange, and incorporates the shutter speed (SS) model in the analysis of DCE-MRI data, thus including transmembrane-water-exchange measurements into DCE-MRI [11-13].
Proliferation activity mapping of glioma via tracking water dynamics within MRI. A: Proliferating activity can accelerate the transmembrane transport of molecules including water, and AQP4 upregulation during proliferation is the potential mechanism. B: The water-exchange DCE-MRI parameter, kio, is proposed as a linear surrogate of the proliferation activity, i.e., Ki67 level.
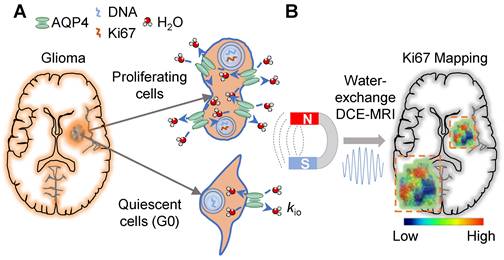
Specifically, we show that the intracellular-to-extracellular transmembrane water-efflux rate (kio) obtained from water-exchange DCE-MRI is a unique and sensitive biomarker of proliferation activity in glioma (Figure 1). The accuracy of kio as a surrogate of proliferation activity has been demonstrated by measurements of intertumoral heterogeneity of proliferation activity in both glioma animal models and human glioma with the help of stereotactic biopsy. Additionally, kio was highly sensitive in tracking the dynamic changes in proliferation activity of glioma cell cultures, following a proliferation cycle and in response to TMZ. More importantly, the proliferation activity index, Ki67, predicted by the single MRI parameter kio, was much more accurate than those predicted by state-of-the-art methods using multimodal standard MRIs and advanced machine learning [14]. Aquaporin 4 (AQP4) as the potential molecule connecting kio to proliferation activity was also explored.
Results
kio precisely captures the dynamic proliferation activity of glioma cells in a growth cycle and in response to TMZ treatment
To assess the reliability of water-exchange DCE-MRI-derived kio (MRI-kio) in monitoring the dynamic proliferation activity in glioma, water-exchange DCE-MRI measurements were performed on U87MG at different growth phases in which cells exhibit different proliferation status. In the depicted workflow (Figure 2A-C), we used the benchtop MRI system to measure cell pellets in vitro (Figure S1A) [11]. Water-exchange DCE-MRI and cellular-growth curve measurements were taken on U87MG cells every 24 hours following sub-culturing, until the U87MG cell count in the dish stopped increasing. We observed a typical proliferation curve that displays a sigmoid shape (Figure 2D, goodness of fit: r = 0.74) and can be divided into the Lag phase, where cells adapt to their new environment after reseeding and the growth is slow, the Logarithmic (Log) phase, characterized by exponential growth, and the Stationary (Sta) phase where growth nearly ceases. The Ki67 expression levels peaked in the Log phase (72-96h, 13.7% ± 1.9%, n = 13) and is decreased by 39.1% in Lag phase (24-48h, 8.4% ± 1.1%, n = 13, p = 0.0355) and by 51.1% in Sta phase (from 120h, 6.7% ± 1.2%, n = 8, p = 0.0139) (Figure 2E, F).
MRI-kio captures the dynamic proliferation activity of U87MG cells in a growth curve. A-C: Experimental workflow. A: Preparation of U87MG samples with varying proliferation rates for MRI measurement, including cell culturing, the preparation of cell suspensions, and the counting of cell numbers at cell growth stages. B: Benchtop MRI system for cell culture measurement. The MRI system was mounted on an anti-vibration table, and a customized chamber was built for cell culture measurements, together with temperature monitoring via fiber-optic probe. Cells were collected and prepared as cell pellet for MRI measurement. The MRI spectrometer is utilized to receive signals from cells. C: A representative image of diffusion-weighted MRI to localize cell pellet (red rectangle), and the same samples used in MRI were collected for further Ki67 fluorescence (immunocytochemistry, ICC) analysis. D: U87MG cellular-growth curve fitted with the logistic equation: Y = 3.13/(4.56*exp(-0.04*Tc) + 0.61), goodness of fit r = 0.74, where Y mean Number of cells (105/dish), Tc mean culture time (h). The data is shown as geometric mean (dots) with 95% confidence interval of mean. n = (10, 11, 8, 9, 8, 16). The right-hand Y-axis mean cell proliferation rate (red dots). Here the three proliferation phases were defined as Lag phase (24-48h), Log phase (72-96h), and Sta phase (from 120h). E: Ki67 expression in the samples after MRI during the Lag, Log and Sta phases for DAPI (blue, top) and Ki67 (red, bottom). F: Ki67 expressions in three phases, n = (13, 13, 8). one-way ANOVA tests *p < 0.05, N.s, non-significant. G: Demonstration of 2SX model fitting (continuous curve) on the normalized water-exchange DCE-MRI data at different CA concentrations and red dots for 5 mM. The black dashed curve is the result from a single-exponential fit, and its divergence from experimental data suggests that there is an intracellular water compartment with a longer T1 than the extracellular medium. H: kio in three phases, n = (9, 11, 16), one-way ANOVA tests, ****p < 0.0001. N.s, non-significant. I: The dynamic changes in cellular Ki67 expression (black dots, n = 8, 5, 5, 13, 8) and kio (red dots, n = 9, 8, 7, 11, 9) as functions of cell culture time. For F, H, I, the bar height and error bar width represent the mean and standard error of the mean (SEM), respectively. J: The correlation between kio and Ki67 in the U87MG cell cycle. “rfu” denotes the quantitative fluorescence abundance results, r = 0.98, p = 0.0004, n = 51, the data were obtained from U87MG cell samples cultured for durations ranging 24-120h. The solid line indicates the linear regression, while the area between the two dashed curves represents the 95% confidence interval.
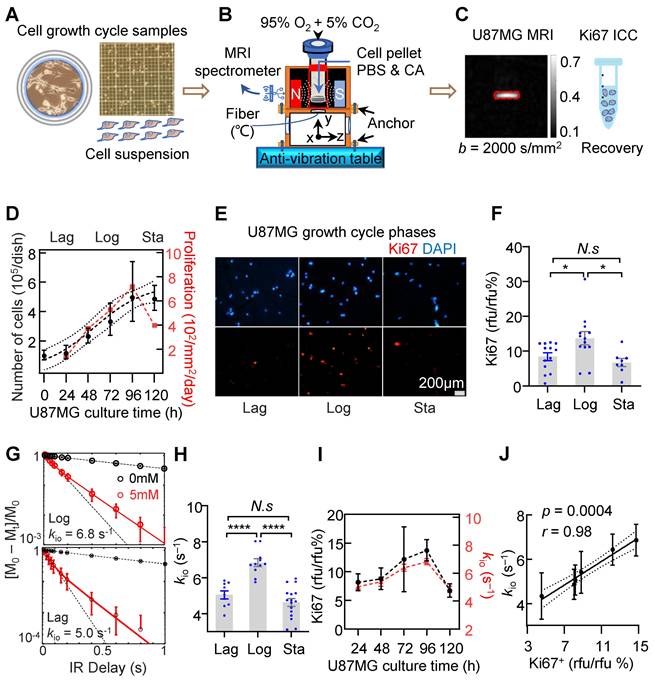
To accurately estimate kio, we followed the experimental procedures in Jia et al. [11]. Briefly, an inversion-recovery turbo spin echo (IR-TSE) sequence to quantitatively measure longitudinal relaxation time (T1) were acquired at two CA concentrations and a two-site (intracellular and extracellular) exchange (2SX) model was applied to estimate kio (Figure S1B). Here, a clinical routinely used Gd-based extracellular CA (Prohance, Bracco Diagnostics) was used to label the extracellular water with shorter T1. The 2SX model well described the IR-TSE signal in different phases and the obtained kio in the Log phase of samples are much larger than that in the Lag phase (Figure 2G). Statistically, kio in the Log phase (6.8 ± 0.7 s⁻¹, n = 11) is significantly larger than those in the Lag phase (5.0 ± 0.7s⁻¹, n = 9, p < 0.0001) and in the Sta phase (4.6 ± 0.9 s⁻¹, n = 16, p < 0.0001) (Figure 2H).
Interestingly but unsurprisingly, MRI-kio and Ki67 expression exhibited a similar trend across cell growth cycles (Figure 2I). Further analysis demonstrated a significant and strong correlation between Ki67 and MRI-kio using the data obtained from each day (Figure 2J, correlation coefficient r = 0.98, p = 0.0004). These results demonstrated that MRI-kio precisely captured the dynamic proliferation activity of glioma cell cultures in the cell growth cycles.
To further demonstrate the capability of water-exchange DCE-MRI in detecting the dynamic change of proliferation activity, TMZ treatment was performed by incubating the U87MG cell line with 100 μM TMZ dissolved in 0.1% dimethyl sulfoxide (DMSO). Time-lapse microscopy showed that TMZ successfully suppressed the growth of glioma cells in comparison to the control group (only 0.1% DMSO) (Figure 3A). The inhibitory effect of TMZ on the proliferation of U87MG glioma cells was quantified by measuring the number of cells per unit area. It showed a substantial decrease in the number of cells (Figure 3B). Notably, commencing from the 72h post-treatment, TMZ markedly reduced the number of cells within region of interest (ROI). The number of cells within the ROI under TMZ treatment (n = 11), with values of 472.2 ± 22.7 for 72h, 553.7 ± 19.3 for 96h, and 687.8 ± 29.1 for 120h, exhibited a significant decrease of 24.2% (p = 0.0012), 33.3% (p < 0.0001), and 46.5% (p < 0.0001) compared to the control group (586.7 ± 20.6, 738.4 ± 30.3, 1007.3 ± 11.8, n = 12), respectively. In Figure 3C, the growth speed of 0-day TMZ treatment (with samples derived from Log cells), was significantly higher than that observed on 2nd day, 4th day, and 6th day of TMZ treatment. The growth speed on 0-day (11.0% ± 0.3%, n = 8) increased significantly by 47.3% (p < 0.0001), 54.5% (p < 0.0001), and 49.0% (p < 0.0001) compared to the growth speed on 2nd day (5.8% ± 0.5%, n = 4), 4th day (5.0% ± 0.2%, n = 4), and 6th day (5.6% ± 0.2%, n = 4) of TMZ treatment (Figure 3C, black), respectively.
MRI-kio captures the dynamic proliferation activity of U87MG cells in response to TMZ treatment. A: Morphology of U87MG cells during TMZ treatment, with cells in brown color and culture dish marked with blue color, Scale bar, 100 μm. B: Growth curve of the U87MG cells with TMZ treatment (n = 11) and the control group (n = 12) were represented by green dots and black dots. ****p < 0.0001. C: The dynamic changes in cellular growth speed (right Y-axis, green dots, n = 8, 4, 4, 4) and kio (left Y-axis, block dots, n = 5, 8, 3, 3) as functions of TMZ culture time. Here, the X-axis starts at 0, representing the control group (untreated U87MG cells in Log growth phase), **p < 0.01, ***p < 0.001, ****p < 0.0001. For B and C two-way ANOVA Multiple comparisons results between Control and TMZ group. D: Correlation analysis between kio and cell growth speed, utilizing data from U87MG cells at various TMZ treatment durations (TMZ = 0, 2, 4, 6 days, n = 5, 8, 3, 3), r = 0.98, p = 0.013. The solid line indicates the linear regression, while the area between the two dashed curves represents the 95% confidence interval. For B, C and D, data are presented as mean ± SEM.
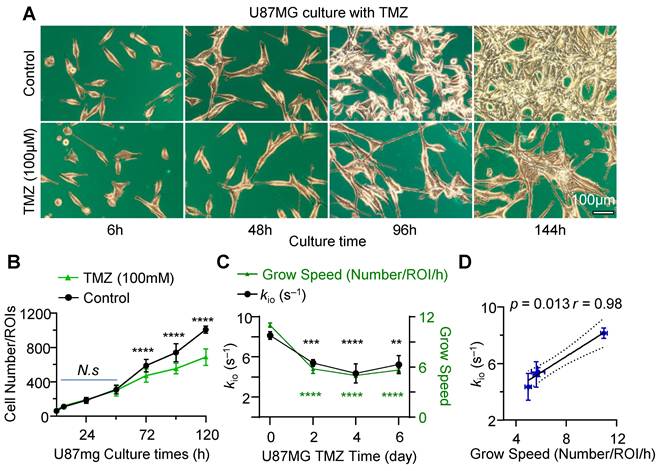
Further water-exchange DCE-MRI measurements revealed that kio on the TMZ 0-day (8.1 ± 0.4 s⁻¹, n = 5) was 24.2% (p = 0.0002) larger than that on the 2nd day (5.4 ± 0.3s⁻¹, n = 8) of TMZ, was also 33.3% larger (p = 0.0044) than that on the 4th day (4.4 ± 1.0 s⁻¹, n = 3) and 46.5% larger (p = 0.0125) than that on the 6th day (5.2 ± 0.9s⁻¹, n = 3) (Figure 3C, green). Additionally, a significant linear correlation was observed between kio and growth speed during TMZ treatment in both U87mg cells (Figure 3D, r = 0.98, p = 0.013) and rat glioma C6 cells (Figure S2, r = 0.99, p = 0.0003), suggesting MRI-kio as a biomarker for TMZ treatment efficacy.
MRI-kio precisely detects intratumoral and intertumoral heterogeneity of proliferation activity in rat glioma models
To explore the capability of water-exchange DCE-MRI in detecting the spatial distribution of proliferation inside and across glioma tumors, water-exchange DCE-MRI was performed in a Sprague-Dawley rat model of subcutaneous C6 cell glioma (Figure 4A-C) with the GRE (Gradient-Echo) sequence and a clinically used Gd-based CA (gadopentetate dimeglumine, Condun, Guangzhou, China). Following the injection of the CA, the tumor region was largely enhanced (Figure 4C and Supplementary Video). For the majority of pixels, the water-exchange DCE-MRI data showed good quality and the three-site two-exchange (3S2X) model specifically developed for glioma tumor DCE-MRI analysis in vivo (see Methods) showed excellent fitting to the time-course data (Figure 4D). The additional site comparing to the 2SX model used in cell culture measurements is the vascular component in vivo. The kio map (Figure 4E) and Ki67 expression of the corresponding slices showed similar spatial distributions on visual inspection, e.g., in Figure 4E, F higher kio together with greater Ki67 expression in the tumor margin (yellow rectangle) was observed and vice versa (green rectangle).
Water-exchange DCE-MRI precisely detected the intratumoral and intertumoral Ki67 expression heterogeneity in rat glioma model. A-C: Schematic of the experimental design; A, Rat glioma cells (C6) culture for in vivo models (B). C, water-exchange DCE-MRI raw images of a rat glioma model at Pre-CA (C1), post-CA 2 mins (C2), post-CA 10 minutes(C3), and the last frame (post-CA 24 minutes, C4) of the sequence, with the ROI of the tumor indicated in red. D: Representative results of the water-exchange DCE-MRI data fitted with the 3S2X model for tumor pixels (top, low kio = 1.9 s-1; bottom, high kio = 9.0 s-1). The raw data and fitting results are shown as dots and continuous curves, respectively. E: Top, the kio maps (left) and the immunohistochemistry (IHC) results (right) were overlaid on the same T2-weighted images (rat from C). Ki67+ and cell nuclei are in red and green, respectively. Bottom, six contour lines were used to divide the tumor slice into six concentric donut-shaped ROIs per rat. F: Enlarged kio results from different tumor pixel (yellow and green), whose positions are illustrated in E. G: Comparison of Ki67 results between low kio (≤ 4s-1) elliptical ROIs and high kio (> 4s-1) elliptical ROIs. n = (23, 25), unpair t-test, ****p < 0.0001. Data are presented as mean ± SEM. H: Linear correlation between the ROI-averaged kio and Ki67+ cell fractions of 48 total ROIs (six ROIs per rat, n = 48; data from the same rat are displayed with the same symbols), r = 0.85, p < 0.0001. I: A similar linear correlation was observed between the whole-tumor-averaged kio and the Ki67+ fractions (the same symbol was used for each rat as in H), r = 0.89, p = 0.0027, n = 8 (six ROIs per rat). For H, I, the solid line indicates the linear regression, while the area between the two dashed curves represents the 95% confidence interval.
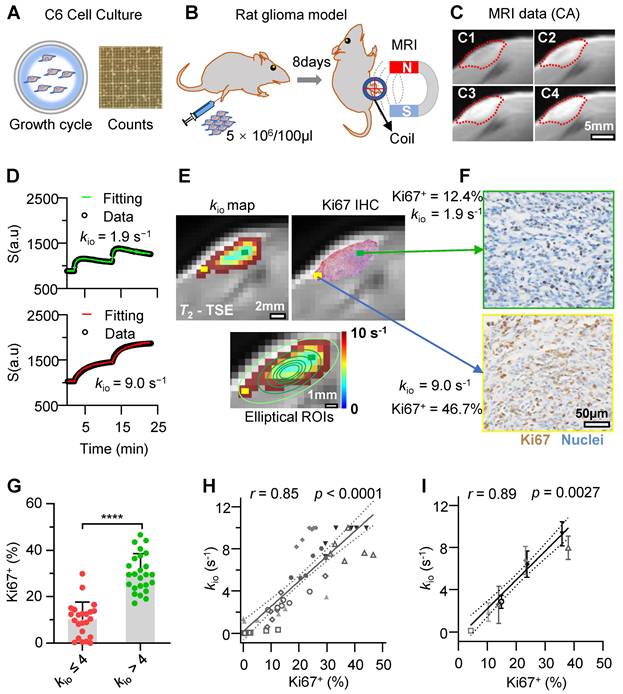
To quantitatively evaluate the accuracy of Ki67 detected by water-exchange DCE-MRI in vivo, we used a series of concentric donut-shaped ROIs to divide the whole tumor slice into six zones (Figure 4E, bottom). Then, the kio and the Ki67 positive fraction values (Ki67+) in histology were calculated for each corresponding ROI (calculation process shown in the Methods). Further statistical analysis revealed that elliptical ROI tissues with elevated kio values (> 4 s⁻¹) had significantly higher Ki67 expression than those in ROIs with kio ≤ 4 s⁻¹ (Figure 4G, 30.2% ± 8.2% vs 10.1% ± 7.5%, p < 0.0001, n = (23, 25)), suggesting a reliable association between kio and Ki67 expression throughout glioma progression. Further Pearson correlation analysis revealed that the kio had a significant and linear correlation with Ki67+ expression in rat gliomas, kio = 24 s-1 × Ki67+ % + 0.20s-1 (Figure 4H, r = 0.85, p < 0.0001). A similar linear relationship existed between Ki67 expression and kio (Figure 4I, r = 0.89, p = 0.0027) when the analysis was performed at the intertumoral level using the whole-tumor-averaged Ki67 expression and kio in each rat.
Human glioma biopsies with faster water-efflux rate exhibit more aggressive proliferation
Here, we further evaluated the ability of our exclusive water-exchange DCE-MRI to detect intratumoral heterogeneity of proliferation activity in human gliomas using point-to-point correlation analysis between the MRI-kio and histological Ki67 expression. Figure 5A shows the workflow. Between May 2019 and June 2023, patients with suspected primary or recurrent brain gliomas undergoing biopsies were enrolled. Written informed consent was obtained from each participant. Before biopsy, water-exchange DCE-MRI was performed following the protocol of Bai at al. and Jia et al. [11,12]. Briefly, the flip angle of DCE-MRI was optimized to improve the sensitivity to transmembrane water exchange and the widely used CA, 0.1 mmol pre-kg body weight, was used and injected at 8th frame of DCE-MRI. Intracellular water-efflux rate kio maps were generated by fitting the water-exchange DCE-MRI data with the 3S2X model [12]. This study was approved by our Institutional Review Board (LCYJ: NO. 2019-103). Overall, 79 biopsy samples from 34 participants (mean age, 52 years; age range, 12-76 years; 15 men) were included in this study (Table S1 and Figure S3). Tumor grading according to the 2021 WHO guidelines revealed that 7 participants had grade II glioma, 8 participants had grade III glioma, and 19 participants had grade IV glioma. Table S2 and Figure S3 provide further information about the patients and biopsy samples included in this study, in accordance with the STARD guidelines.
kio-guided stereotactic biopsy enables “point-to-point” comparison of MRI and histology. A: Experimental workflow (from left to right): water-exchange DCE-MRI, stereotactic biopsy procedure for human gliomas, radiographic-histopathological point-to-point paired data and downstream molecular analysis. B: Representative results of the water-exchange DCE-MRI data fitted with the 3S2X model (see methods) for tumor biopsies (top, high kio = 10.0 s-1; bottom, low kio = 0.11 s-1). The raw data and fitting results are shown as dots and continuous curves, respectively. C: Illustration of a kio map overlaid on the 70th DCE-MRI frame, guiding two biopsy points acquired using the same needle and high (D, top) and low (D, bottom) kio biopsies. D: On IHC, brown indicates Ki67+ cells; blue indicates nuclei; larger kio values showed greater Ki67 expression and vice versa. E-G: Comparison of biopsy Ki67 results between high kio (> 1 s-1) and low kio (≤ 1 s-1) points. Data are presented as mean ± SEM. E, Primary patients, n = (40,6); F, recurrent patients, n = (21,12). G, all patients (primary and recurrent), n = (61,18). nonparametric tests (Mann-Whitney U test), ****, p < 0.0001.
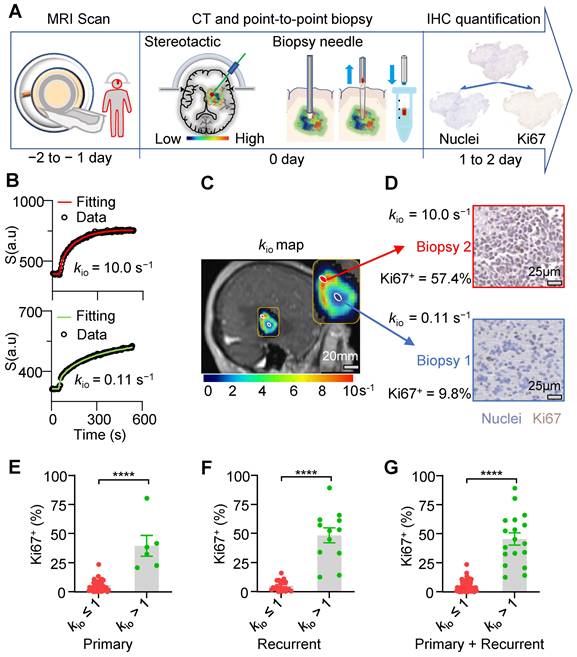
Most MRI pixels showed excellent fit (Figure 5B). We then merged the kio maps into structural images to guide stereotactic biopsy with varying kio values for each patient (Figure 5C). Values from different spatial biopsy points and paired IHC were then calculated. ROIs with higher kio consistently exhibited higher Ki67 expression in their corresponding biopsies. For example, biopsy samples displaying a kio of 10 s-1 exhibited largely higher Ki67+ (57.4% vs 9.8%) compared with samples displaying a kio of 0.11 s-1 in the same tumor (Figure 5D). Further statistical analysis revealed that biopsy tissues with elevated kio values (> 1 s⁻¹) had significantly increased Ki67+ in both primary (Figure 5E, 39.5% ± 8.9% vs 5.8% ± 0.76%, p < 0.0001, n = (40,6)) and recurrent (Figure 5F, 48.5% ± 6.4% vs 5.3% ± 0.97%, p < 0.0001, n = (21,12)) gliomas. This trend was consistent across all patient biopsies (Figure 5G, 45.5% ± 5.1% vs 5.6% ± 0.60%, p < 0.0001, n = 79).
A strong and linear correlation was evident between MRI-kio and histology-Ki67+ in both primary and recurrent human glioma
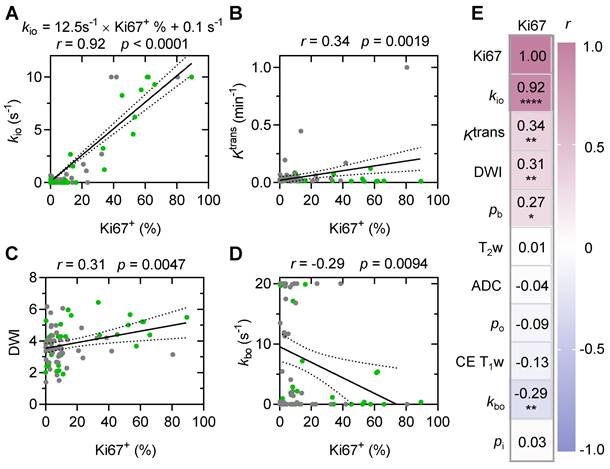
A strong and significant linear correlation (Figure 6A, r = 0.92, p < 0.0001) between MRI-kio and histology Ki67+ was observed in both the primary human glioma (n = 46) and the recurrent human glioma (n = 33). Among all other MRI metrics, only contrast agent extravasation rate constant (Ktrans) from DCE-MRI (Figure 6B, r = 0.34; p = 0.002), diffusion weighted imaging DWI intensity (Figure 6C, r = 0.31; p = 0.005), vascular water efflux rate constant kbo from DCE-MRI (Figure 6D, r = -0.29; p = 0.009), and vascular water mole fraction pb from DCE-MRI (Figure 6E, r = 0.27; p = 0.015) showed significant but weak correlations with Ki67+.
MRI-kio strongly and linearly correlates with biopsy Ki67+ in human gliomas. A: MRI-kio values and Ki67+ were linearly correlated in point-to-point biopsy samples (n = 79). The gray and green solid circles are biopsy data from the primary (n = 46) and recurrent gliomas (n = 33), respectively. B-D: Linear correlations of Ki67+ expression with Ktrans (B), DWI (C), and kbo (D). E: Visualized Pearson correlations between Ki67 and subsets of clinician-selected variables, * p < 0.05, ** p < 0.01, **** p < 0.0001. The solid line indicates the linear regression, while the area between the two dashed curves represents the 95% confidence interval. Gray and green solid circles represent biopsy data from primary and recurrent gliomas, respectively. Here, the water mole fractions for cells, blood and extracellular extravascular are defined as pi, pb, po, respectively. The steady-state water molecule extravasation was kbo. Ktrans denotes the contrast agent extravasation rate constant. CE T1w, contrast-enhanced T1-weighted images. T2w, T2-weighted images, ADC: apparent diffusion coefficient.
Comparison with standard MRI modalities in predicting stereotactic biopsy Ki67+
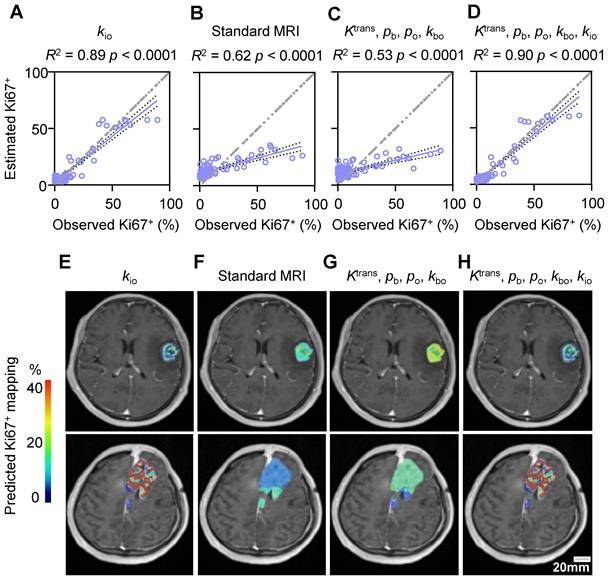
We further compared the performances of standard MRI with multiple modalities and water-exchange DCE-MRI in predicting Ki67+ using the stereotactic biopsy (n = 79) data. Across all tested machine learning algorithms, kio consistently performed the best, explaining 80% to 89% of the variance (Table S3). Among all machine learning models, the random forest model performed best in all datasets (Table S3). Utilizing this random forest model [2], the single parameter kio could effectively predict Ki67+ with an R² of 0.89 and a root mean square (RMS) error of 6.9% (Figure 7A, p < 0.0001). In contrast, standard MRI with multiple modalities (T2w, DWI, ADC, and CE T1w) could only predict histology-Ki67+ with an R² of 0.62 and an RMS error of 15.1% (Figure 7B, p < 0.0001). The other water-exchange DCE-MRI parameters (Ktrans, kbo, pb, and po) also could only predict histology-Ki67+ with an R² of 0.53 and an RMS error of 15.9% (Figure 7C, p < 0.0001). The combination of these other water-exchange DCE-MRI parameters with kio only slightly improved the performance in predicting Ki67+ compared with the single parameter kio (R2 from 0.89 to 0.90, RMS error from 6.9% to 6.7%, Table S3), highlighting the dominant role of kio in predicting Ki67+ (Figure 7A-D).
Comparison with standard MRI modalities in predicting stereotactic biopsy Ki67+. (A-D) Prediction results with a random forest model evaluated by five-fold cross validation of 79 stereotactic biopsy points using the MRI metric(s) of: single parameter kio (A), standard MRI (T2w, DWI, ADC, and CE T1w) (B), four DCE-MRI-derived pharmacokinetic parameters (Ktrans, kbo, pb, and po) (C), and five DCE-MRI-derived pharmacokinetic parameters (Ktrans, kbo, pb, po, and kio) (D). The solid line indicates the linear regression, while the area between the two dashed curves represents the 95% confidence interval. (E-H) Two examples of the predicted Ki67 expression map in patients with WHO III (up) and WHO IV (down) glioma using the respective prediction models displayed in A-D.
Predicted Ki67+ level maps in glioma tumors
Representative maps of the predicted Ki67+ using the random forest model with different MRI modalities were shown in Figure 7E-H. For subjective and visual assessment, kio-predicted Ki67+ maps exhibited spatial heterogeneity, whereas those predicted by standard MRIs and other water-exchange DCE-MRI-derived pharmacokinetic metrics showed a more homogeneous distribution within the tumor. Further quantitative analysis of high-grade glioma heterogeneity using the entropy metric revealed considerably higher intratumoral heterogeneity for Ki67+ maps predicted by kio (1.11 ± 0.31) than for those predicted by standard MRIs (0.05 ± 0.01, p = 0.009, n = 27) and other water-exchange DCE-MRI-derived pharmacokinetic metrics (0.05 ± 0.01, p = 0.009, n = 27). Additionally, the kio-predicted Ki67+ maps could also capture inter-tumoral proliferation heterogeneity. For instance, patients with WHO IV tumors showed substantially higher Ki67 expression than patients with WHO III tumors (Figure 7E, H). This difference became much smaller in Ki67+ maps predicted by standard MRIs (Figure 7F) and other water-exchange DCE-MRI-derived pharmacokinetic metrics (Figure 7G). No obvious differences were observed between the Ki67+ maps predicted by kio alone (Figure 7E) and those predicted by the combination of kio and other water-exchange DCE-MRI-derived pharmacokinetic metrics (Figure 7H).
AQP4 knockout (KO) largely slowed down the fraction of Ki67+ cells both in vitro and in vivo
To explore whether dynamic AQP4 regulation during the cell cycle is the potential molecule connecting MRI-kio with proliferation activity, we also stained AQP4 in human glioma biopsy sample and found that samples with higher Ki67 expression exhibited more pronounced AQP4 expression (Figure 8A). Pearson correlation analysis demonstrated a strong positive correlation between the quantitative Ki67+ and AQP4+ fractions (Figure 8B, r = 0.91, p < 0.0001). In the rat glioma model, we also found the positive linear correlation between the ROI-averaged AQP4+ and Ki67+ fractions (Figure S4A, B, r = 0.73, p < 0.0001). Furthermore, simultaneous fluorescence staining of AQP4 and Ki67 also revealed that Ki67+ cells are more likely to have upregulated AQP4 (Figure 8C). The percentage of AQP4+ cells was significantly greater than that of AQP4- cells (Figure 8D, 70.8% ± 3.6% vs. 29.2% ± 3.6%, p < 0.0001, n = 50), whereas the percentage of AQP4+ cells was much smaller in the Ki67- population than in the Ki67+ population (Figure 8D, 11.7% ± 1.8% vs. 70.8% ± 3.6%, p < 0.0001, n = 50).
Synchronous expression of Ki67 and AQP4 in glioma. A: Typical examples of AQP4 (up) and Ki67 (down) IHCs of the stereotactic biopsy tissues with high (left) and low (right) kio, respectively. B: A linear correlation is observed between Ki67+ and AQP4+ cells in 55 stereotactic biopsy points. The solid line reflects linear regression analysis and the two dashed curves denote 95% confidence intervals. r = 0.91, p < 0.0001. C: Multiplex IHC results (AQP4: green; Ki67: red; DAPI: blue). Dotted white lines indicate areas where both typical AQP4 and Ki67 were expressed. The region enclosed by a solid yellow line displays no Ki67 expression and weak AQP4 expression in arrested glioma cells. D: Quantitative analysis of synchronous Ki67 and AQP4 expression revealed the same trend (right, n = 50, ROIs from 13 glioma patients), mean ± SEM, **** p < 0.0001. E: AQP4 (green) synchronous changes with Ki67 (red) in U87MG cells. The arrowhead indicates that AQP4 and Ki67 were both expressed, and the arrow shows no Ki67 expression and no or weak AQP4 expression. F: Further quantitative analysis of Ki67 and AQP4 synchronous expression (60 ROIs from 7 dishes of cell cultures, unpair t-test, ****p < 0.0001). G: Ki67 expression in the normal C6 cell lines (Left, Control) and C6 AQP4-KO cell lines (Right, KO), Scale bar, 50 µm. H: AQP4-KO glioma Ki67+ were significantly lower than those of the control group. Unpaired t-test, n = 6, 16; ****p < 0.0001. Bar height and error bar width represent the mean and SEM, respectively.
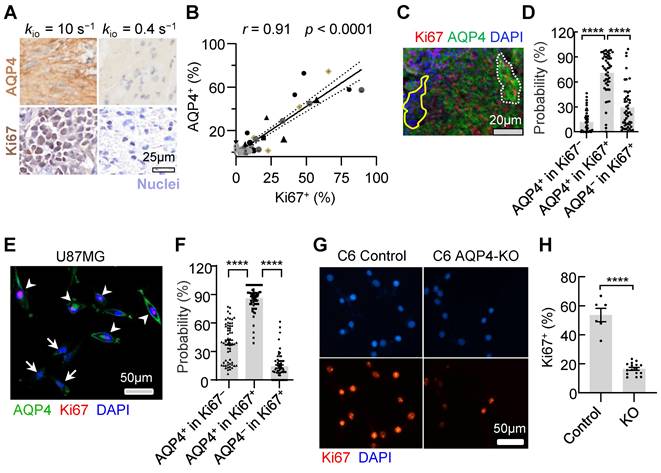
The upregulated AQP4 expression during proliferation was also observed in the U87MG cell cultures. Under confocal microscopy and using multiple fluorescence labeling (Figure 8E), the percentage of AQP4+ cells were significantly greater than that of AQP4- cells (Figure 8F, 85.9% ± 1.8% vs 13.0% ± 2.1%, n = 60, p < 0.0001) in the Ki67+ cells in U87MG cell cultures. In AQP4+ glioma cells, the percentage of Ki67+ cells were also significantly greater than that of Ki67- cells (Figure 8F, 85.9% ± 1.8% vs 39.4% ± 2.6%, p < 0.0001, n = 60).
To validate the involvement of AQP4 as a crucial molecule in regulating glioma proliferation, we created an AQP4-KO C6 cell line using a small guide RNA (sgRNA; Methods). Ki67 expression (Fig. 8G, H) were downregulated with C6 AQP4-KO groups (Ki67+ = 16.6% ± 1.0%, n = 16) compared with those of the control with normal C6 cell lines (Ki67+ = 53.6% ± 4.2%, n = 6, p < 0.0001). This trend was consistent in vivo. AQP4-KO significantly reduced Ki67 positivity (Ki67+) in rat glioma models (Figure S4 C, D, 4.4 ± 1.5% Vs 19.9 ± 3.8% p = 0.0007, n = 11, 9). Taken together, AQP4 expression were observed in most proliferating glioma cells and the knockout of AQP4 could largely slow down proliferation activity, suggesting AQP4 is the potential molecule connecting MRI-kio with proliferation activity.
Discussion
In vivo mapping of the intratumoral heterogeneity of proliferation activity is crucial for the precise diagnosis and treatment of glioma. In this study, we demonstrated that proliferation activity could largely accelerate the transmembrane water transport, and kio, a single variable derived from water-exchange DCE-MRI, can precisely detect the dynamic changes of proliferation activity in growth cycle and following TMZ treatment and reveal the intratumoral and intertumoral spatial heterogeneity of proliferation activity in both animal models and human glioma. Upregulated AQP4 expression were observed in most proliferating glioma cells and the knockout of AQP4 could largely slow down proliferation activity, suggesting AQP4 is the potential molecule connecting MRI-kio with proliferation activity. More importantly, in clinical practice, water-exchange DCE-MRI can be used together with conventional MRI protocols for glioma diagnosis by adding a water-exchange DCE-MRI sequence during contrast agent injection without additional financial or time costs, making it can be easily adapted for clinical research or application.
Several studies have attempted to predict Ki67 expression using MRI and machine-learning algorithms[15-18]. However, most of these studies compared their predictions with the Ki67 level of large surgical samples, indicating an inability to predict proliferation heterogeneity within tumors. A recent study used 52 stereotactic biopsies from glioma patients [2] and found that a combination of four MRI modalities (T2w, fractional anisotropy, cerebral blood flow, and Ktrans) with the random forest algorithm could predict the histology-Ki67+ with an R2 value of 0.75. In addition to achieving a much higher R2 (= 0.89) using the single parameter kio, our approach has several advantages. First, kio has a clear physiological mechanism directly linked to proliferation, whereas other MRI modalities lack such a clear mechanism. Specifically, unlike ADC or DWI, kio is insensitive to the cellular microstructure changes since the cell volume or density change has been independently characterized by another pharmacokinetic parameter, pi. Second, multimodality MRI is susceptible to substantial variability in MR image data across vendor platforms, sequence parameters, and institutions. In contrast, kio is a quantitative and physical parameter describing transmembrane water transport. Third, our method only requires the acquisition of DCE-MRI data; multimodality MRI requires three additional modalities (DCE, DTI, and ASL) except for standard MRI, which costs longer acquisition time.
The positive and strong correlation between MRI-kio and histology-Ki67+ is consistent with the biological premise that rapid cell division relies on increased transmembrane transport of water to maintain cellular homeostasis [9]. Using cell sorting, we previously found that human glioma subregions with faster transmembrane water-exchange rates contained more fast-cycling cells and fewer slow-cycling cells relative to subregions with slower transmembrane water-exchange rates [11]. In the present study, we confirmed that AQP4 was upregulated in proliferating glioma cells and explains the strong correlation between MRI-kio and histology-Ki67+. Similarly strong correlations between aquaporin expression and cellular proliferation have also been observed in other tumors (e.g., AQP1 in lung cancer [19] and AQP5 in breast cancer [20]).
In this study, we also observed a significant but weak correlation between DWI and Ki67 (r < 0.4). This is reasonable because DWI primarily reflects cell density [21], and rapid tumor cell proliferation typically leads to an initial increase in cell density. However, high cell density can also suppress cell proliferation when the tumor microenvironment cannot provide sufficient energy support. Furthermore, DWI is not specific to cell density and can be altered by other cellular factors, such as swelling or shrinking [22]. On the other hand, the steady-state cellular water efflux rate kio, a physical parameter characterizing the membrane permeability property of cells obtained from water-exchange DCE-MRI, is robust in the presence of variations in these microstructural parameters. Three other parameters in water-exchange DCE-MRI (Ktrans, pb, and kbo) reflecting vascular properties also were significantly but weakly correlated with histology-Ki67+. This relationship is expected because vascular proliferation and higher vascular leakage have been identified as biomarkers of malignant proliferating tumors [23,24], but the vessel regulation is heterogenous during tumor development [25]. The negative correlation between MRI-kbo and Ki67+ could potentially result from the redistribution of AQP4 from perivascular astrocytic end-feet to the cell membrane in gliomas [26,27].
Our proposed method could enable the visualization of Ki67 expression in vivo. This is particularly important for tumors such as gliomas, which exhibit heterogeneous Ki67 expression. Presurgical Ki67 mapping could help to locate “hot spots” of Ki67 expression, allowing surgeons to obtain optimal biopsies for accurate glioma diagnosis and grading, this would avoid random biopsy selection [28]. Additionally, Ki67 expression is potentially useful in predicting the treatment response. However, biopsy acquisition at each follow-up is clearly not feasible. Ki67 mapping could help monitor changes in spatial Ki67 expression in vivo during each follow-up tumor assessment. This method has the potential to provide clinicians with evidence-based treatment strategies.
Limitations
Our study had several limitations. First, the dataset size was small, although it still yielded statistically significant results and correlations. Second, water-exchange DCE-MRI offers the advantage of high spatial resolution but is limited to use in tissues with sufficient contrast agent leakage. A higher dosage of contrast agent administrated could result more accurate estimation of water exchange, whereas a lower dosage could result in a less accurate estimation. Diffusion-based measurements, such as diffusion exchange spectroscopy [29-31], are potential candidates for kio measurements with full-brain coverage. Lastly, the integration of kio with other imaging modalities, such as PET, could provide a comprehensive assessment of glioma biology, potentially enhancing the broader understanding of tumor heterogeneity and treatment response.
Conclusion
The strong correlation between kio and Ki67+ in the dynamic changes and spatial variations of proliferation activity, along with its predictive power in machine learning models, positions kio as a promising MRI biomarker for the non-invasive spatiotemporal assessment of glioma proliferation. The mechanism that underlies the potential for kio to serve as a direct and accurate biomarker for Ki67 involves the upregulation of AQP4 expression during glioma cell proliferation.
Materials and Methods
Water-exchange DCE-MRI measurements of cell cultures with benchtop MRI system
U87MG or C6 cell lines were obtained from the American Type Culture Collection and routinely cultured in Dulbecco's modified Eagle's medium (Sigma-Aldrich, ShangHai D6429-500ML) supplemented with 10% fetal bovine serum (Biological Industries, Israel, 04-002-1A) and 1% penicillin and streptomycin (Gibco, Thermo Fisher Scientific, 10378016) in a humidified incubator. U87MG cells were disassociated with 0.25% trypsin-EDTA solution immediately before MRI scanning, then resuspended in 0.2 mL of phosphate-buffered saline (PBS; or PBS supplemented with 5 mM gadoteridol) in an MRI tube. We then centrifuged the MR tubes at 300 ×g at 4°C for 2 min before performing MRI scans. Living cell pellet cultures from the incubator were kept in PBS in a 5% CO2 + 95% O2 environment to ensure a high cell survival rate. The sample cell pellets from the tubes were mounted into the center of the 0.5 T benchtop MRI system (Pure Devices GmbH) with a fine-thread adjustable rubber ring.
The detailed water-exchange DCE-MRI measurements of the cell cultures are provided by Jia et al. [11]. Briefly, DWI was initially conducted to localize the cell layer presenting lower apparent diffusivity with a single-slice acquisition, a slice thickness of 5 mm, field of view (FOV) 12.8 × 12.8 mm2, matrix size 64 × 64, 16 averages, and two b values at 10 s/mm2 and 2000 s/mm2. For the water-exchange DCE-MRI, an inversion-recovery prepared turbo-spin-echo (IR-TSE) sequence was utilized with an extracellular Gd-based contrast agent. The scanning parameters included echo time (TE) 3ms, turbo factor 16, FOV 12.8 × 12.8 mm2, and matrix size 32 × 32. The water-exchange DCE-MRI utilized two CA concentrations (0 and 5 mM) with IR delays and repetition time (TR) adjusted accordingly. The normalized IR-TSE signal was analyzed using a two-site-exchange (2SX) model[13], accounting for the mole fraction of water in intra- and extracellular compartments and the steady-state intracellular water-efflux rate kio (Details are provided in Supplementary Methods). After the MRI scans were complete, the samples were immediately fixed with 4% paraformaldehyde for Ki67 immunofluorescence analysis. The growth speed was calculated using the following formula: growth speed (ct) = [Num (ct) - Num (ct-1)]/Dt, where ct is time point of cell counting and ct - 1 is the previous time point of cell counting, and Num(ct) is the number of cells in the time point, Dt is time gap between the ct and ct - 1 (hours). To obtain the number of cells (Num), we averaged the results from three randomly selected field of view near the center of the culture dish.
Rat models of glioma and MRI scan
The local Internal Evaluation Committee for Animal Welfare and Rights approved all animal experimental protocols. C6 glioma cells were implanted under the loose skin the right thighs of male Sprague-Dawley rats (8 weeks old). During glioma cell introduction, the rats were anesthetized with a mixture of 2% (v/v) isoflurane in air (R500IE, RWD Life Science Co., Ltd.), and 100 μL PBS containing 5 × 10⁶ C6 cells was subsequently injected into the right leg. Seven to nine days after tumor implantation, the rats underwent MRI scanning on a MAGNETOM 7T system (Siemens Healthcare, Erlangen, Germany) equipped with a surface coil for small-animal imaging. Anesthesia was maintained using a breathing mask within a customized chamber to minimize motion artifacts. Prior to water-exchange DCE-MRI, quantitative T1 and B1 field maps were acquired with specific imaging parameters, T1 mapping was performed using an inversion recovery prepared fast spin-echo (FSE) sequence with: slice thickness 1.5 mm, matrix size 128 × 64, resolution 0.5 × 0.5 mm, and seven IR delays (60, 100, 300, 700, 900, 1200, 1500 ms) with TR = 5000 ms and TE = 8.2 ms was employed. B1 Field Map: Estimated using a multi-flip-angle multi-echo gradient echo (MGE) sequence with TR = 101 ms, TE = 2.8, 6.2, 10.2 ms, and flip angles (FA) = 5°, 7°, 10°, 15°, 20°, 40°, 60°, 70°, 80°, 90°.
The water-exchange DCE-MRI was performed using an MGE sequence with the same spatial settings as the T1 and B1 mapping, with TE = 2.8, 6.2 and 10.2 ms, TR = 101 ms. FA = 20° was used. A total of 220 frames were acquired over 23.7 minutes. A dual-bolus intravenous injection protocol (0.25 mmol/kg at the 20th and 120th frames) was employed to enhance sensitivity to kio. We utilized the same 3S2X model as the glioma patients to fit the water-exchange DCE-MRI data in rat. This analysis yielded five key parameters: pb, po, Ktrans, kbo, and kio (pharmacokinetic interpretation sees Methods, Glioma Patients and MRI scan). The detailed water-exchange DCE-MRI analysis of the rats are provided by Supplementary Methods and Jia et al. [11]. The tumors were quickly removed and fixed for IHC after MRI. The maximal tumour size permitted by the institutional review board is 4000 mm3 and this limit was not exceeded in this study. All experimental protocols for animal studies were approved by the Animal Experimentation Committee of Zhejiang University (approval number: ZJU20200151).
Region of interest (ROI) selection for rat glioma model
As most subcutaneous glioma tumours show a ring-shape of high-Ki67 expression, we used concentric donut-shape ROIs to divide both the MRI tumour regions and the corresponding histology images into six ROIs. Then the ROI-averaged kio values and Ki67-positive (Ki67+) fraction were calculated for each ROI. First, we found the minimum rectangle enclosing the entire tumour and determined the rectangle centre coordinates (XR, YR), length LR, and width WR. Second, a series of concentric oval curves dividing the tumour into six ROIs were automatically drawn.
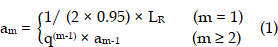
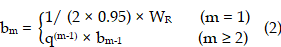
where m was the serial number of each curve (increasing in value from the outer (m = 1)) to the inner (m = 6) and q = 0.75.
Glioma patients and MRI scan
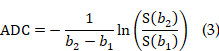
This was an observational, institutional review board-approved clinical trial, compliant with the Declaration of Helsinki principles (NSFC: NO. 2021-012). Table S2 provides the information on the adult patients included in this study, according to the STARD guidelines. One or two days before the stereotactic biopsy procedure, MRI data were acquired for each participant using a 3.0 T MRI scanner (Magnetom Skyra, Siemens Healthcare, Erlangen, Germany) equipped with a 20-channel transmit/receive head and neck combined RF coil. The standard MRI protocol included T2-weighted (T2w) three-dimensional (3D) imaging, DWI, and CE T1w MRI. More details of these standard MRI protocol was provided in Table S4. The DWI and ADC map was acquired using the RESOVLE sequence with parameters: FOV = (230 mm)2, slice thickness = 5 mm, 19 axial slices, in-plane resolution 1.4 × 1.4 mm2, δ/Δ = 12 ms/32 ms, TE/TR= 66 ms/4020 ms, b = 0 s/mm2 (single acquisition) and 1000 s/mm2 (three or six directions, single acquisition in each direction). DWI was calculated by averaging all images of six directions and ADC was calculated using b = 0 s/mm2 images and averaged images of b = 1000 s/mm2 across all directions by using the following formula (b1 = 0 s/mm2, and b2 = 1000 s/mm2).
Water-exchange DCE-MRI data were acquired using a gradient echo sequence with a 3D CAIPIRINHA-Dixon-TWIST, volume-interpolated technique with a temporal resolution of 4.5 s and voxel size of 0.9 × 0.9 × 1.5 mm3. The flip angle (FA = 10°) was optimized to enhance the sensitivity of the water-exchange DCE-MRI signal to transmembrane water exchange [12]. 0.1 mmol/kg Gd-DTPA was administered over 48 s, followed by a 15-mL saline flush with an injection velocity of 2.0 mL/s. Prior to water-exchange DCE-MRI, a double FA MRI sequence [32] was acquired to obtain the pre-contrast T1 map, which used the same sequence and setups as water-exchange DCE-MRI except for the flip angles (FA = 3o and 15o). The water-exchange DCE-MRI protocol scan time was approximately 8.7 min. Details are provided in Table S4 and Table S5.
The ROI-averaged water-exchange DCE-MRI data was further analyzed using the three-site two-exchange (3S2X) model [12], which was specifically developed for brain tumors to calculate the cellular water efflux rate constant (kio) and other pharmacokinetic parameters. The 3S2X model considers each tissue voxel to be composed of three compartments: blood (b), extracellular extravascular (o), and intracellular (i) spaces and water exchange happens between blood and extracellular space, and between extracellular and intracellular space. This model has five independent physiological parameters: pb and po (water mole fraction for blood and extracellular extravascular space), kbo (steady-state water molecule extravasation), kio, and Ktrans (contrast agent extravasation rate constant).
Stereotactic biopsy procedure and paired matching between MRI metrics and biopsy histology
This study was approved by our Institutional Review Board (LCYJ: NO. 2019-103). The stereotactic biopsy was performed by two experienced neurosurgeons within the Leksell Stereotactic System (Elekta, Stockholm, Sweden). A high-resolution CT scan (PHILIPS, Ingenuity Core128) was performed on the patients with the stereotactic head frame fitted. The region of interest (ROI) for each biopsy—a cylinder with a diameter of 2 mm and height of 10 mm was precisely marked on each CT image. Next, CT images were registered to the baseline water-exchange DCE-MRI 3D data via rigid transformation with FLIRT in FSL software [33]. The ROI of each biopsy was then converted to water-exchange DCE-MRI space. Within each ROI, the water-exchange DCE-MRI signal intensity was averaged, then subjected to pharmacokinetic modeling and analysis, other MRI metrics was also averaged. This post-processing step allowed for a "point-to-point" comparison between the MRI metrics and the histological Ki67 index obtained from immunohistochemistry (IHC) (Figure 5A, C).
Histopathological and IHC quantification of proliferation
IHC staining of the biopsies was performed using paraffin-embedded sections that had been serially sectioned at 4-μm intervals. Tissue slide images were fully scanned at 20× magnification using a Virtual Microscopy Slide Scanning System (VS120, Olympus, Japan). The scanned images were assessed using ImageJ [34], then analyzed using MATLAB 2019a to remove background signals and quantify both the number of nuclei and the percentage of positive Ki67 or AQP4 staining. Three investigators, blinded to the MRI results, independently quantified the fraction of Ki67-positive cells (Ki67+) on IHC images. IHC antibody information is provided in Table S6.
Machine learning models of predicting Ki67 expression in human glioma
Several popular machine-learning algorithms, including the linear and multiple linear regression, regression trees, support vector machines and random forest, were tested. A five-fold cross-validation strategy was used [14], which partitioned the 79-biopsy dataset almost equally into five subsets. The models were trained on a combination of four subsets and validated on the remaining one, a cycle that was repeated five times to ensure each subset was used for validation once. This methodology enabled us to gauge the models' ability to generalize and their sensitivity to how the data was divided. The analyses were conducted using MATLAB 2019a Regression Learning Toolbox.
Ki67 prediction mapping
To generate quantitative maps estimating Ki67 expression, we utilized the results based on random forests (the most effective approach in our dataset) trained from four different dataset. The prediction variable sets comprised a single variable, kio; a 4-variable set of standard MRIs; a comprehensive 5-variable water-exchange DCE-MRI set, encompassing all parameters (pb, po, Ktrans, kbo, and kio); and a 4-variable set of water-exchange DCE-MRI parameters, excluding kio. We estimated Ki67 expression for each voxel within tumor using a leave-one-patient-out cross-validation scheme [2]. This approach most closely simulates a clinical implementation of the algorithm while ensuring the independence of the resulting maps, thereby utilizing all available data.
Statistics
Statistical analysis was performed with MATLAB 2019a and GraphPad Prism 8.0.2 (GraphPad Software). For comparisons involving multiple groups, ANOVA with Tukey's multiple comparisons test was employed to determine significant differences among groups. For comparisons between two independent groups, unpaired Student's t-tests were used. If the data did not exhibit a gaussian distribution, nonparametric tests were employed instead. Correlation analysis was performed with Pearson's correlation analysis. p < 0.05 was considered statistically significant. No animals or data points were excluded from the analyses unless specifically mentioned. Investigators were blinded to group allocation during the experiments and MRI data processing. Careful randomization was conducted when two or more groups were compared. The entropy of the predicted Ki67+ imagery, assessed using MATLAB 2019a toolbox (the imhist function), serves as a metric to quantify the heterogeneity present within the Ki67+ maps.
Supplementary Material
Supplementary figures and tables.
Acknowledgements
This work was supported in part by Key R&D Program of Zhejiang Province (2024SSYS0019), National Natural Science Foundation of China (NSFC) (Grant Nos. 82222032, 82473485 and 82172050), the STI2030-Major Projects of China (Grant No. 2022ZD0206000), the Taishan Scholars Program (No. Tstp20231252), technical innovation of project of Jinan science and technology bureau (202225007).
Data availability
The main data supporting the results in this study are available within the paper and its Supplementary Information. The raw and analyzed datasets generated during the study are too large to be publicly shared, yet they are available for research purposes from the corresponding authors on reasonable request. The raw patient data are available from the authors, subject to approval from the IRB of the Shandong Provincial Hospital affiliated to Shandong First Medical University. Source data are provided with this paper.
Ethics approval statement
All experimental protocols for animal studies were approved by the Animal Experimentation Committee of Zhejiang University (approval number: ZJU20200151).
This was an observational, institutional review board-approved clinical trial, compliant with the Declaration of Helsinki principles (NSFC: NO. 2021-012). This study was approved by our Institutional Review Board (LCYJ: NO. 2019-103). All participants provided written informed consent for the use of their data in this study, ensuring confidentiality and adherence to ethical standards.
All study participants provided informed consent, and the study design was approved by the appropriate ethics review board. All authors have reviewed and consented to the submission of this manuscript to Theranostics.
Competing Interests
The authors have declared that no competing interest exists.
References
1. Jung E, Osswald M, Ratliff M, Dogan H, Xie R, Weil S. et al. Tumor cell plasticity, heterogeneity, and resistance in crucial microenvironmental niches in glioma. Nat Commun. 2021;12:1014
2. Gates EDH, Lin JS, Weinberg JS, Hamilton J, Prabhu SS, Hazle JD. et al. Guiding the first biopsy in glioma patients using estimated Ki-67 maps derived from MRI: conventional versus advanced imaging. Neuro Oncol. 2019;21:527-36
3. Shirono K, Hattori T, Takatsuki K. Prognostic usefulness of Ki-67 antigen expression in adult T-cell leukaemia. Lancet. 1989;2:8670
4. Alexiou GA, Tsiouris S, Kyritsis AP, Argyropoulou MI, Voulgaris S, Fotopoulos AD. Assessment of glioma proliferation using imaging modalities. J Clin Neurosci. 2010;17:1233-8
5. Tavernari D, Battistello E, Dheilly E, Petruzzella AS, Mina M, Sordet-Dessimoz J. et al. Nongenetic evolution drives lung adenocarcinoma spatial heterogeneity and progression. Cancer Discov. 2021;11:1490-507
6. Srikanth M, Das S, Berns EJ, Kim J, Stupp SI, Kessler JA. Nanofiber-mediated inhibition of focal adhesion kinase sensitizes glioma stemlike cells to epidermal growth factor receptor inhibition. Neuro Oncol. 2013;15:319-29
7. Muthukrishnan SD, Kawaguchi R, Nair P, Prasad R, Qin Y, Johnson M. et al. P300 promotes tumor recurrence by regulating radiation-induced conversion of glioma stem cells to vascular-like cells. Nat Commun. 2022;13:6202
8. Burger PC, Shibata T, Kleihues P. The use of the monoclonal antibody Ki-67 in the identification of proliferating cells: Application to surgical neuropathology. Am J Surg Pathol. 1986;10:611-7
9. Zhu J, Thompson CB. Metabolic regulation of cell growth and proliferation. Nat Rev Mol Cell Biol. 2019;20:436-50
10. Petit M, Leclercq M, Pierre S, Ruggiero MR, El Atifi M, Boutonnat J. et al. Fast-field-cycling NMR at very low magnetic fields: water molecular dynamic biomarkers of glioma cell invasion and migration. NMR Biomed. 2021;35:e4677
11. Jia Y, Xu S, Han G, Wang B, Wang Z, Lan C. et al. Transmembrane water-efflux rate measured by magnetic resonance imaging as a biomarker of the expression of aquaporin-4 in gliomas. Nat Biomed Eng. 2022;7:236-52
12. Bai R, Wang B, Jia Y, Wang Z, Springer CSJ, Li Z. et al. Shutter-Speed DCE-MRI Analyses of Human Glioblastoma Multiforme (GBM) Data. J Magn Reson Imaging. 2020;52:850-63
13. Bai R, Springer CS, Plenz D, Basser PJ. Fast, Na+/K+ pump driven, steady-state transcytolemmal water exchange in neuronal tissue: A study of rat brain cortical cultures. Magn Reson Med. 2018;79:3207-17
14. Parmar C, Grossmann P, Bussink J, Lambin P, Aerts HJ. Machine learning methods for quantitative radiomic biomarkers. Sci Rep. 2015;5:13087
15. Gao A, Zhang H, Yan X, Wang S, Chen Q, Gao E. et al. Whole-Tumor Histogram Analysis of Multiple Diffusion Metrics for Glioma Genotyping. Radiology. 2022;302:652-61
16. Xie S hui, Lang R, Li B, Zhao H, Wang P, He J long. et al. Evaluation of diffuse glioma grade and proliferation activity by different diffusion-weighted-imaging models including diffusion kurtosis imaging (DKI) and mean apparent propagator (MAP) MRI. Neuroradiology. 2023;65:55-64
17. Ni J, Zhang H, Yang Q, Fan X, Xu J, Sun J. et al. Machine-Learning and Radiomics-Based Preoperative Prediction of Ki-67 Expression in Glioma Using MRI Data. Acad Radiol. 2024;31:3397-405
18. Sun Y, Su C, Deng K, Hu X, Xue Y, Jiang R. Mean apparent propagator-MRI in evaluation of glioma grade, cellular proliferation, and IDH-1 gene mutation status. Eur Radiol. 2022;32:3744-54
19. Hu J, Verkman AS, Hu J, Verkman AS. Increased migration and metastatic potential of tumor cells expressing aquaporin water channels. FASEB J. 2006;20:1892-4
20. Jung HJ, Park JY, Jeon HS, Kwon TH. Aquaporin-5: a marker protein for proliferation and migration of human breast cancer cells. PLoS One. 2011;6:e28492
21. Gupta RK, Cloughesy TF, Sinha U, Garakian J, Lazareff J, Rubino G. et al. Relationships between choline magnetic resonance spectroscopy, apparent diffusion coefficient and quantitative histopathology in human glioma. J Neurooncol. 2000;50:215-26
22. Koh DM, Collins DJ. Diffusion-weighted MRI in the body: Applications and challenges in oncology. AJR Am J Roentgenol. 2007;188:1622-35
23. Dubois LG, Campanati L, Righy C, D'Andrea-Meira I, e Spohr TCL de S, Porto-Carreiro I. et al. Gliomas and the vascular fragility of the blood brain barrier. Front Cell Neurosci. 2014;12:418
24. Patankar TF, Haroon HA, Mills SJ, Balériaux D, Buckley DL, Parker GJM. et al. Is Volume Transfer Coefficient (Ktrans) Related to Histologic Grade in Human Gliomas? AJNR Am J Neuroradiol. 2005;26:2455
25. Bergers G, Benjamin LE. Tumorigenesis and the angiogenic switch. Nat Rev Cancer. 2003;3:401-10
26. Montgomery MK, Kim SH, Dovas A, Zhao HT, Goldberg AR, Xu W. et al. Glioma-Induced Alterations in Neuronal Activity and Neurovascular Coupling during Disease Progression. Cell Rep. 2020;31:107500
27. Warth A, Mittelbronn M, Wolburg H. Redistribution of the water channel protein aquaporin-4 and the K+ channel protein Kir4.1 differs in low- and high-grade human brain tumors. Acta Neuropathol. 2005;109:418-26
28. Parker NR, Khong P, Parkinson JF, Howell VM, Wheeler HR. Molecular heterogeneity in glioblastoma: potential clinical implications. Front Oncol. 2015;5:55
29. Callaghan PT, Furó I. Diffusion-diffusion correlation and exchange as a signature for local order and dynamics. J Chem Phys. 2004;120:4032-8
30. Bai R, Li Z, Sun C, Hsu Y-C, Liang H, Basser P. Feasibility of filter-exchange imaging (FEXI) in measuring different exchange processes in human brain. Neuroimage. 2020;219:117039
31. Schilling F, Ros S, Hu D-E, D'Santos P, McGuire S, Mair R. et al. MRI measurements of reporter-mediated increases in transmembrane water exchange enable detection of a gene reporter. Nat Biotechnol. 2017;35:75-80
32. Yuan J, Chow SKK, Yeung DKW, Ahuja AT, King AD. Quantitative evaluation of dual-flip-angle T1 mapping on DCE-MRI kinetic parameter estimation in head and neck. Quant Imaging Med Surg. 2012;2:245-53
33. Smith SM, Jenkinson M, Woolrich MW, Beckmann CF, Behrens TEJ, Johansen-Berg H. et al. Advances in functional and structural MR image analysis and implementation as FSL. Neuroimage. 2004;23:S208-19
34. Landini G, Martinelli G, Piccinini F. Colour deconvolution: Stain unmixing in histological imaging. Bioinformatics. 2021;37:1485-7
Author contact
![]() Corresponding authors: ruiliangbaiedu.cn, yingchaoliusdu.edu.cn.
Corresponding authors: ruiliangbaiedu.cn, yingchaoliusdu.edu.cn.