Impact Factor
 Global reach, higher impact
Theranostics 2024; 14(15):5853-5868. doi:10.7150/thno.97276 This issue Cite
Research Paper
Hepatocyte-specific Smad4 deficiency inhibits hepatocarcinogenesis by promoting CXCL10/CXCR3-dependent CD8+- T cell-mediated anti-tumor immunity
Xin Xin1#, Zhao Li2#, Xuanxuan Yan1#, Ting Liu3, Zuyin Li2, Zhuomiaoyu Chen2, Xinlong Yan4, Fanxin Zeng5, Lingling Hou1 ![]() , Jinhua Zhang1
, Jinhua Zhang1 ![]()
1. The College of Life Science and Bioengineering, Beijing Jiaotong University, Beijing, China.
2. Department of Hepatobiliary Surgery, Peking University People's Hospital, Beijing, China.
3. School of Life Science and Technology, Jinan University, Guangzhou, Guangdong province, China.
4. Faculty of Environmental and Life Sciences, Beijing University of Technology, Beijing, China.
5. Department of Clinical Research Center, Dazhou Central Hospital, Dazhou, Sichuan province, China.
# Authors contributed equally to this work.
Received 2024-4-12; Accepted 2024-8-18; Published 2024-9-9
Abstract

Rationale: Sma mothers against decapentaplegic homologue 4 (Smad4) is a key mediator of the transforming growth factor β (TGF-β) pathway and plays complex and contradictory roles in hepatocellular carcinoma (HCC). However, the specific role of Smad4 in hepatocytes in regulating hepatocarcinogenesis remains poorly elucidated.
Methods: A diethylnitrosamine/carbon tetrachloride-induced HCC model was established in mice with hepatocyte-specific Smad4 deletion (AlbSmad4-/-) and liver tumorigenesis was monitored. Immune cell infiltration was examined by immunofluorescence and fluorescence activated cell sorting (FACS). Cytokine secretion, glycolysis, signal pathway, and single-cell RNA sequencing were analysed for mechanism.
Results: AlbSmad4-/- mice exhibited significantly fewer and smaller liver tumor nodules, less fibrosis, reduced myeloid-derived suppressor cell infiltration and increased CD8+ T cell infiltration. Smad4 deletion in hepatocytes enhanced C-X-C motif ligand 10 (CXCL10) secretion, promoting tumor necrosis factor-α (TNF-α) production in CD8+ T cells. The loss of Smad4 activated the CXCL10/mammalian target of rapamycin (mTOR)/lactate dehydrogenase A (LDHA) pathway, which increased glycolytic activity in CD8+ T cells. HCC patients with high Smad4 expression exhibited decreased CD8+ T cell infiltration and altered glycolysis.
Conclusion: Our results demonstrate that Smad4 in hepatocytes promotes hepatocarcinogenesis and is a potential and candidate target for the prevention and therapy of HCC.
Keywords: hepatocyte, Smad4, hepatocellular carcinoma, CXCL10, aerobic glycolysis
Introduction
Hepatocellular carcinoma (HCC) is the most prevalent primary liver cancer, accounting for approximately 90% of all cases, and is a leading cause of cancer-related deaths worldwide [1]. Emerging evidence suggests that the aetiology of HCC is multifactorial. HCC most commonly occurs in people with chronic liver diseases, such as inflammation, fibrosis and cirrhosis caused by hepatitis B virus (HBV) or hepatitis C virus (HCV) infection, alcohol consumption, and metabolic syndrome [2, 3]. The approval of new drugs, and the establishment of therapies based on immune checkpoint blockade, provide multiple treatment options for patients [4]. Unfortunately, HCC remains a lethal malignancy with a five-year survival rate of only 21% [5]. Therefore, it is important to better understand the signaling mechanisms in the HCC tumor microenvironment (TME) and to identify new targets for clinical anti-tumor therapy.
The HCC TME is a complex niche composed of tumor cells, infiltrating immune cells, cytokines, and chemokines, which collectively contribute to the immunosuppressive effects that in turn prompt HCC proliferation, invasion, and metastasis [6, 7]. Within this environment, the interaction between tumor and immune cells, particularly CD8+ T cells, is critical for determining tumor progression and the response to therapy [8]. Tumor cells produce many chemokines that recruit immune cells into the TME via specific chemokine receptors [6, 9]. Metabolic reprogramming within the TME, including alterations in aerobic glycolysis, has been shown to be a key factor in regulating immune cell function and tumor progression [10].
The TGF-β signaling pathway plays important roles in cell proliferation, apoptosis, differentiation, migration, and anti-tumor immunity, and naturally plays a pivotal regulatory role in HCC progression [11-13]. Smad4, the central mediator of TGF-β signaling, is also involved in key development processes of liver inflammation [14], fibrosis [15], fatty liver [16], and liver cancer [17]. Although Smad4 is ubiquitously expressed across various cell types, its functional role is distinctly specific to each cell type. Smad4 in hepatocytes promotes inflammation and collagen deposition during the progression of non-alcoholic steatohepatitis (NASH) [14]. We recently found that Smad4 deletion in hepatocytes alleviates liver fibrosis via the p38/p65 pathway [15]. Smad4 deficiency in stellate cells has also been found to significantly reduce the expression level of fibrotic genes [18]. Additionally, Smad4 upregulates the expression of genes that encode T-cell receptor (TCR) complex components and cytotoxic effector molecules in CD8+ T cells [19, 20]. Smad4 deletion in natural killer (NK) cells leads to the impairment of NK cell maturation and homeostasis [21]. In recent studies Smad4 expression was found to be upregulated in human HCC tumors and was correlated with poor postoperative prognosis in patients with HCC [22, 23]. Conversely, a previous study has reported the presence of a lower protein level of Smad4 in HCC tissue compared with adjacent liver tissue in an Asian HCC cohort [24]. To date, the role of Smad4 in hepatocytes during HCC development remains unclear.
In this study, we explored the role of Smad4 in hepatocytes during fibrosis-related hepatocarcinogenesis using hepatocyte-specific Smad4 knockout (AlbSmad4-/-) mice. The study demonstrated that hepatocyte-specific Smad4 deletion reduced tumor incidence after diethylnitrosamine (DEN) and carbon tetrachloride (CCl4) treatment. Moreover, Smad4 deletion in hepatocytes increased the secretion of C-X-C motif ligand 10 (CXCL10), which promoting tumor necrosis factor-α (TNF-α) production and glycolysis in CD8+ T cells.
Methods
Some detailed information was provided in supplementary data. The details of RT-qPCR primers are described in supplementary material, Table S1.
Tissue microarray immunohistochemistry staining
Tissue microarrays (TMAs) consist of 20 HCC specimens, 20 intrahepatic cholangiocarcinoma (ICC) specimens, 5 metastatic cancer specimens, 14 cirrhosis specimens, 11 hepatitis specimens, and 5 healthy liver control specimens (Taibsbio Technology, Xi'an, China). Smad4 expression was determined by immunohistochemistry (IHC) using a rabbit anti-Smad4 antibody (Affinity Biosciences, Cincinnati, OH, USA). The evaluation of Smad4 staining was carried out according to a method described in a previous study [25]. The intensity of Smad4 expression was scored as follows: 0, negative; 1, weak; 2, moderate; 3, strong. The extent of staining was scored as follows: 1, 0 to <25%; 2, 25 to <50%; 3, 50 to <75%; or 4, 75 to <100%. Five randomly selected fields were observed under a light microscope. The final score was determined by multiplying the intensity scores by the extent of staining. Sums from 0 to 5 were defined as negative for Smad4; sums from >5 to 35 were defined as low expression of Smad4; and sums from >35 to 60 were defined as high expression of Smad4.
Mice
Albumin-Cre (Alb-Cre) and Smad4 flox/flox (Smad4fl/fl) mice on a C57BL/6 background were purchased from Jackson Laboratory (Bar Harbor, ME, USA) [26]. Mice with a conditional knockout of Smad4 in albumin-expressing hepatocytes (AlbSmad4-/-) were generated by crossing Smad4 flox/flox and Alb-cre mice. Cre-negative littermates were used as control mice. All mice were maintained in specific pathogen-free and humidity-and temperature-controlled microisolator cages with a 12-h light/dark cycle at the Institute of Biophysics, Chinese Academy of Sciences. All animal studies were performed after being approved by the Institutional Laboratory Animal Care and Use Committee of Beijing Jiaotong University.
DEN/CCl4-induced HCC model
The mice were first treated with an intraperitoneal (i.p.) injection of 50 μg/g DEN (Sigma-Aldrich, St. Louis, MO, USA) at the age of 15 days. At the age of 8 weeks, mice were then treated with 0.5 μl/g body weight of CCl4, diluted (1:9) in corn oil by i.p. injection twice weekly for 6 weeks. Tumor development was monitored at 30 weeks as described previously [25].
Histochemistry and immunostaining
Preparation of paraffin and cryostat tissue sections was performed as described previously [27]. The sliced liver paraffin sections were then stained with hematoxylin and eosin (H&E) and sirius red. For immunohistochemistry, paraffin sections were incubated with primary antibodies (rabbit anti-Smad4, Affinity Biosciences, Cincinnati, OH, USA) followed by incubation with horseradish peroxidase (HRP)-conjugated secondary antibodies. For immunofluorescence detection, paraffin sections were incubated with anti-PCNA primary antibodies (Santa Cruz Biotechnology, Shanghai, China), while cryostat sections were incubated with anti-F4/80, anti-CD11b, and anti-Gr-1 primary antibodies (BD Pharmingen, San Diego, CA, USA), respectively, and followed by incubation with Alexa Fluor 488- or 594-conjugated secondary antibodies (Invitrogen, Carlsbad, CA, USA). Cell nuclei were stained with DAPI. Sections were evaluated under a microscope (DP71, Olympus, Tokyo, Japan) for bright-field and fluorescence microscopy.
Isolation and activation of naïve CD8+ T lymphocytes
Naïve CD8+ T lymphocytes were isolated from mouse spleens by negative selection using the Naïve CD8+ T Cell Isolation Kit (BioLegend, USA). Following isolation, naïve CD8+ T lymphocytes were activated with plate-bound 2 µg/mL anti-CD3 (BioLegend, USA) and 1 µg/mL anti-CD28 (BioLegend, USA) and cultured in RPMI-1640 medium supplemented with 10% heat-inactivated FBS (Gibco, Grand Island, NY, USA), 10 mM HEPES (BI, Israel), 0.05 mM β-mercaptoethanol (BI, Israel), and 1% penicillin-streptomycin. For intracellular cytokine staining, CD8+ T cells were stimulated with PMA/ionomycin mixture (Multisciences Biotech, Co., Ltd., Hangzhou, China) and BFA/monensin mixture (Multisciences Biotech, Co., Ltd., Hangzhou, China) for 6 h.
Seahorse assays
Extracellular acidification rate (ECAR) and oxygen consumption rate (OCR) were measured with a XFe96 Extracellular Flux Analyzer (Agilent Technologies) following protocols recommended by the manufacturer. CD8+ T cells were isolated from the spleens and activated with 2 μg/mL anti-CD3 and 1 μg/mL anti-CD28 for 48 h. CXCL10 treated CD8+ T cells with or without AMG487 were seeded on XFe96 microplates that had been pre-coated with Cell-Tak adhesive (BD Biosciences). The plates were quickly centrifuged to immobilize cells. Cells were rested in a non-buffered assay medium for 30 min before starting the assay. Glycolysis or oxidative phosphorylation (OXPHOS) associated parameters were measured by Seahorse XFe Glycolysis Stress test kit (Agilent Technologies). In a glycolysis assay, three compounds are injected separately: 10 mM glucose, 1 μM oligomycin, and 50 mM 2-deoxyglucose (2-DG). In an OXPHOS assay, three compounds are injected separately: 2 μM oligomycin, 2 μM carbonyl cyanide p-(trifluoromethoxy) phenylhydrazone (FCCP), and a combination of 1 μM antimycin A and 1 μM rotenone.
Single-cell RNA sequencing analysis
Eighty samples of human HCC were analyzed by single-cell RNA sequencing (scRNA-seq), The scRNA-seq approach utilized in this study was previously described in detail [28]. Patients were then ranked based on the mean expression level of Smad4 in their tumor cells and divided into two groups: Smad4-high and Smad4-low.
Statistical analysis
All data were showed as the mean ± SEM and analyzed using GraphPad Prism V8.0.2 software. Differences between two groups were compared using two-tailed unpaired Student's t-test analysis. Two-way ANOVA was used for multiple comparisons. P < 0.05 was considered statistically significant.
Results
Smad4 is highly expressed in fibrosis-related HCC
We previously demonstrated that Smad4 deficiency in hepatocytes alleviated CCl4-treated liver fibrosis [15]. In human tissue microarray (TMA) analysis, Smad4 expression significantly increased in cirrhosis and HCC specimens compared with healthy liver specimens (Figure S1A-B). Interestingly, HCC liver exhibited a significantly higher percentage of nuclear positive Smad4 compared with healthy, hepatitis and cirrhotic livers (Figure S1C). To further detect Smad4 expression in fibrosis-related HCC, TMAs from 20 patients with HCC were used for immunohistochemical staining (Figure 1A), and approximately 10% of the cases were negative for Smad4, and 30% and 60% had low or high Smad4 expression respectively (Figure 1B). There was a positive correlation between the increased Smad4 expression and tumor grades, indicating that the Smad4 expression was higher in patients with advanced HCC (Figure 1B). Furthermore, patients with high Smad4 expression had a significantly larger tumor diameter (Figure 1B). Subsequent double immunofluorescence staining revealed that Smad4 was highly expressed in albumin+ cells in HCC tissues (Figure 1C-D). In addition, HCC patients with high Smad4 expression had shorter survival time by analysis of the GEO database (Figure 1E-F).
Smad4 expression is upregulated in human HCC and DEN/CCl4 -induced mouse HCC. (A-E) Immunohistochemical staining for Smad4 in HCC patients. (A) Representative IHC images of Smad4 in a tissue microarray from 20 HCC patients. Scale bar: 50 μm. (B) Percentage of the cases expressing Smad4 in carcinoma tissues (left), percentage of tissues with negative, low, and high Smad4 expression with different tumor grades (middle) and average tumor diameter of different Smad4 protein levels in HCC patients (right). *P < 0.05. (C-D) Representative double staining of albumin (green) and Smad4 (red) in adjacent non-tumor tissues (ANT) and tumor tissues from human HCC. Scale bar: 50 μm. (E) GSE 76427 dataset was used to analyze the difference in Smad4 expression between ANT and tumor tissues. (F) Kaplan-Meier survival analysis of the Smad4 low and high expression in the GSE 76427 datasets. (G) Schematic representation of the DEN/CCl4-induced liver fibrosis-related HCC model. (H-I) Western blot analysis of Smad4 protein levels in HCC tissues. Smad4 expression was normalized to the Normal GAPDH. **P < 0.01. (J-K) Representative immunohistochemical staining for Samd4 in mice normal liver and HCC tissues. Scale bar: 50 μm. ***P < 0.001.
To further explore the role of Smad4 in HCC, we established a mouse fibrosis related liver cancer model using DEN/CCl4 treatment (Figure 1G). Immunohistochemical and western blot analysis demonstrated that Smad4 expression in tumor tissues was significantly higher than in normal tissues (Figure 1H-K). Consistently, double immunofluorescence staining indicated that Smad4 was highly expressed in albumin+ hepatocytes in mouse HCC tumor tissues (Figure S1D). These results demonstrated that Smad4 expression was closely correlated with fibrosis-related HCC.
Hepatocyte-specific Smad4 deletion alleviates DEN/CCl4-induced fibrosis-related hepatocarcinogenesis
To investigate the function of Smad4 in hepatocytes in HCC, transgenic mice expressing Cre recombinase from the albumin promoter were crossed with Smad4fl/fl mice to establish hepatocyte-specific Smad4 knockout mouse (AlbSmad4-/-). Smad4 deletion in hepatocytes from AlbSmad4-/- mice was confirmed by double immunofluorescence staining of albumin and Smad4 (Figure S1E). AlbSmad4-/- and Smad4fl/fl mice were given a single intraperitoneal injection of DEN, followed by CCl4 treatment twice weekly for 6 weeks, and liver tumorigenesis was monitored for 30 weeks. The tumor morphology and H&E staining indicated the successful induction of HCC by DEN/CCl4 (Figure 2A). All Smad4fl/fl mice developed liver tumors within 30 weeks. However, AlbSmad4-/- mice showed obvious resistance to hepatocarcinogenesis (Figure 2A). Hepatocyte-specific Smad4 deletion significantly decreased the number and size of HCC tumors (Figure 2B-E). Cell proliferation was also significantly weakened in Smad4-deficient tumors by proliferating cell nuclear antigen (PCNA) staining (Figure 2F). Moreover, Sirius red staining and α-smooth muscle actin (α-SMA) immunofluorescence staining revealed an attenuated fibrosis level in AlbSmad4-/- mice (Figure 2G-H). To further confirm the role of Smad4 in liver tumor development, we detected the Smad4 expression in different human and murine HCC cell lines and found that Smad4 was expressed in these cell lines (Figure 2I). Then Smad4 expression in Hepa1-6 cells was knocked down by a Smad4-targeting lentiviral vector and the level of Smad4 was assessed by western blot (Figure 2J). Negative control (sh-NC) and sh-Smad4 Hepa1-6 cells were transplanted into C57BL/6 mice and Hepa1-6 cells with Smad4 deficiency developed smaller tumors than the sh-NC group (Figure 2K-L). In vitro, 3-(4,5-dimethylthiazol-2-yl)-2,5-diphenyltetrazolium bromide (MTT), wound-healing assays and western blot analysis of PCNA also showed that Smad4 deletion remarkably inhibited Hepa1-6 proliferation and migration (Figure 2M-N, Figure S2A). These results demonstrated that Samd4 in hepatocytes promoted fibrosis-related HCC development.
Smad4 deletion in hepatocytes alleviates DEN/CCl4-induced hepatocarcinogenesis and tumor cell proliferation. (A-E) Groups of Smad4fl/fl and AlbSamd4-/- mice (n = 8 per group) were used for the DEN/CCl4-induced HCC model. (A) Gross morphology (top) and H&E staining (bottom) of the livers of the Smad4fl/fl and AlbSamd4-/- mice. N, normal liver tissue. T, liver tumor area. Scale bar: 50 μm. (B) Liver weight per mouse, (C) number of tumors per mouse, (D) size of the tumors, and (E) number of >3mm tumors per mouse in Smad4fl/fl and AlbSamd4-/- mice are shown. **P < 0.01 and ***P < 0.001. (F) Representative staining of PCNA in HCC tissues (Scale bars: 50 μm) and statistical analysis. ***P < 0.001. (G) Sirius red staining of liver tissues in Smad4fl/fl and AlbSamd4-/- mice (Scale bars: 100 μm, zoom in: 50 μm), quantification of stained areas and statistical analysis. *P < 0.05. (H) Immunofluorescence staining of α-SMA in HCC tissues (Scale bars: 50 μm) and statistical analysis. ***P < 0.001. (I) Western blot analysis of Smad4 protein levels in Hepa1-6, HepG2, Huh7 and BEL-7402 cell lines. (J) The characterization of Smad4 in sh-NC and sh-Smad4 Hepa1-6 cells by western blot. (K) Ex vivo images of resected tumors (Scale bars: 1 cm). (n = 6 per group). (L) growth curves of tumor volume formed by subcutaneous injection of Hepa1-6 cells (n = 6 per group). ***P < 0.001. (M) The proliferation ability of Hepa1-6 cells at 24 h, 48 h and 72 h. **P < 0.01. (N) Representative photographs of wound-healing assay and statistical analysis. Hepa1-6 cells were scratched using pipet tips for 72 h. The migration ability of Hepa1-6 cells was evaluated. **P < 0.01.
Samd4 deletion in hepatocytes reduces MDSC infiltration and enhances CD8+ T cell infiltration in HCC
To examine whether Smad4 is involved in immune cell infiltration in the TME, we analyzed immunocyte profiles in CCl4-induced liver fibrosis and DEN/CCl4-induced HCC tissues. Fluorescence-activated cell sorting (FACS) analysis showed that the percentages of myeloid-derived suppressor cells (MDSC) decreased significantly in CCl4-treated AlbSmad4-/- mice (Figure 3A). Consistently, CD11b+, Gr1+ and F4/80+ cell infiltration was prominently reduced in liver tissues of AlbSmad4-/- mice compared to Smad4fl/fl mice in the DEN/CCl4-induced HCC model (Figure 3B-C). In addition, the number of CD11b+ /Gr1+ cells also decreased in AlbSmad4-/- mice detected by double immunofluorescence staining (Figure S2B). Moreover, an increased CD8+ T cell infiltration in AlbSmad4-/- mice liver (Figure 3D-F) was detected by FACS and immunofluorescence, suggesting that Smad4 deletion changed the immune microenvironment. However, there were no significant differences in the number of CD4+ T cells between the fibrotic liver tissues of AlbSmad4-/- and Smad4fl/fl.
Smad4 deletion in hepatocytes enhances the CD8+ T cell infiltration in HCC. (A-F) Groups of Smad4fl/fl and AlbSamd4-/- mice were used for the CCl4-induced liver fibrosis model (n = 6 per group) and DEN/CCl4-induced HCC model (n = 8 per group). (A) Isolation of liver lymphocytes from CCl4-induced Smad4fl/fl and AlbSamd4-/- mice and flow cytometry analysis of the proportion of CD11b+ Gr-1+ MDSC in the livers. **P < 0.01. (B-C) Representative staining and statistical analysis of CD11b+, F4/80+, and Gr-1+ cells in DEN/CCl4-induced HCC tissues. Scale bars: 50 μm. **P < 0.01. (D) Representative image of CD4+ and CD8+ proportion in fibrotic liver tissues analyzed by FACS and statistical analysis, respectively. **P < 0.01. (E-F) Representative staining of CD4+ and CD8+ cells in HCC liver tissues and statistical analysis, respectively. (Scale bars: 50 μm). **P < 0.01. (G) Representative images of FACS and statistical analysis for MDSC and TAMs cells proportion in Hepa1-6 transplanted tumors, sh-Smad4 vs. sh-NC. **P < 0.01. (H) Representative images of FACS and statistical analysis for CD4+ and CD8+ T cells proportion in Hepa1-6 transplanted tumors, sh-Smad4 vs. sh-NC. *P < 0.05. (I-J) Immunofluorescence detection and statistical analysis of CD4+ and CD8+ cells in Hepa1-6 transplanted tumors, sh-Smad4 vs. sh-NC, respectively. **P < 0.01.
To investigate the role of Smad4 in anti-tumor T-cell responses, Hepa1-6 cells treated with sh-Smad4 or sh-NC were subcutaneously into C57BL/6 mice, and the immune cells in transplanted tumors were detected by FACS. MDSC infiltration was significantly reduced in tumors with Smad4 knockdown. There were no significant differences in tumor-associated macrophages (TAMs) infiltration between the sh-NC and sh-Smad4 groups (Figure 3G). Meanwhile, FACS analysis also showed that the proportion of CD4+ and CD8+ T cells increased in the sh-Samd4 group compared with sh-NC group (Figure 3H). Consistently, immunofluorescence staining also revealed similar results (Figure 3I-J). Furthermore, sh-NC and sh-Smad4 Hepa1-6 cells were inoculated subcutaneously in nude mice and Smad4 deficiency in Hepa1-6 cells didn't inhibit tumor growth compared with the sh-NC group, indicating that the anti-tumor effects of Smad4 mainly depended on the host's T cells, but not tumor cells (Figure S2C-D). Taken together, Smad4 deficiency in hepatocytes promotes the infiltration of CD8+ T cell along with the decrease of MDSCs in transplanted tumors, DEN/CCl4-induced HCC tumors and CCl4-induced fibrotic livers, suggesting that Smad4 promotes immune suppression in the HCC TME.
Hepatocyte-derived CXCL10 was critical for TNF-α production of CD8+ T cells
Hepatocytes in the TME secrete an array of chemokines to recruit immune cells, thereby promoting or suppressing tumor growth [29, 30]. Chemokines chemokine C-C motif ligand (CCL) 9 (CCL9), CCL17, CCL20, CXCL5, CXCL9, and CXCL10 secreted by hepatocytes regulated tumor progression by acting on CD8+ T cells [31]. To investigate the effects of Smad4 on chemokine secretion in hepatocytes, we detected the expression of CCL9, CCL17, CCL20, CXCL5, CXCL9 and CXCL10 in liver tissues from Smad4fl/fl and AlbSmad4-/- HCC mice by RT-qPCR. Results demonstrated that Smad4 knockout significantly increased the mRNA level of chemokine CXCL10, whereas CCL9, CCL17, CCL20, and CXCL5 levels were significantly reduced. There was no significant difference in CXCL9 expression (Figure 4A). Consistent with this, CXCL10 expression in hepatocytes was upregulated in DEN/CCl4-induced AlbSmad4-/- mice by double immunofluorescence staining (Figure 4B). In vitro, the mRNA and protein levels of CXCL10 were further confirmed by RT-qPCR and ELISA. Smad4 knockdown in Hepa1-6 cells significantly facilitated the CXCL10 expression (Figure 4C-D). Consistent with the above results, the CXCL10 level was also increased significantly in sh-Smad4 Hepa1-6 transplanted tumors (Figure 4E-F). Additionally, we analyzed the correlation between Smad4 and CXCL10 expression in HCC using the GEO database (GSE 14520). As predicted, Smad4 expression negatively correlated with CXCL10 (Figure 4G).
Hepatocyte-derived CXCL10 was critical for TNF-α secretion in CD8+ T cells. (A) The mRNA levels of CCL9, CCL17, CCL20, CXCL5, CXCL9 and CXCL10 in HCC tissues from Smad4fl/fl and AlbSamd4-/- mice were measured using RT-qPCR. **P < 0.01 and ***P < 0.001. (B) Groups of Smad4fl/fl and AlbSamd4-/- mice (n = 8 per group) were used as DEN/CCl4 HCC models. Representative double staining for albumin (green) and CXCL10 (red) in liver specimens. (Scale bar: 50 μm). (C) The mRNA levels of CXCL10 in Hepa1-6 cells with sh-Smad4 vs. sh-NC. ***P < 0.001. (D) Hepa1-6 cells were treated with IFN-γ (1 μg/ml) for 24 h. ELISA was performed to examine the levels of CXCL10. **P < 0.01. (E-F) Immunofluorescence staining of CXCL10 in Hepa1-6 tumor tissues (Scale bars: 50 μm) and statistical analysis. **P < 0.01. (G) Scatter plots show the negative correlation between Smad4 and CXCL10 mRNA expression in HCC GEO dataset (GSE 14520). Pearson's coefficient tests are performed to assess statistical significance. (H) Intracellular TNF-α levels of CD8+ T cells stimulated with PMA/Ionomycin and BFA/Monensin mixtures for 6 h in the presence of CXCL10 (100 ng/ml) and statistical analysis. *P < 0.05. (I) Hepa1-6 cells were co-cultured with pretreated CD8+ T cells at 1:3 in the absence or presence of an anti-CXCL10 neutralizing antibody (20 μg/ml) or control antibody in 24-well plates for 24 hours. The TNF-α levels in CD8+ T cells were identified by FACS. ***P < 0.001.
CD8+ T cells are the main component of the anti-tumor immune response, eliminating target cells through exocytosis of effector cytokines such as granzyme B (Gzmb), interferon (IFN)-γ and TNF-α [32]. To assess the effects of CXCL10 on anti-tumor immunity, we examined the effects of CXCL10 on the production of cytotoxic proteins and effector cytokines in mouse CD8+ T cells. CD8+ T cells were purified from naïve mouse spleens and stimulated with PMA/Ionomycin and BFA/Monensin mixtures in the presence of 100 ng/ml CXCL10 recombinant protein [33], and the production of TNF-α, IFN-γ, Gzmb, IL-2 was detected. FACS validated that the proportion of TNF-α in CD8+ T cells was significantly increased in the recombinant CXCL10 treatment group, but there was no difference in the levels of IFN-γ, Gzmb and IL-2 (Figure 4H, Figure S3A-C). However, these differences were not observed in CD4+ T cells (Figure S3D-F). Similarly, when CD8+ T cells were co-cultured with sh-Smad4 Hepa1-6 cells, the anti-CXCL10 neutralizing antibody significantly decreased TNF-α production in CD8+ T cells (Figure 4I). Thus, Smad4 in hepatocytes regulated CD8+ T cell TNF-α production through CXCL10.
CXCL10 increases glycolysis in CD8+ T cells
Accumulating evidence has shown that glycolytic metabolism plays a crucial role in the effector phase of CD8+ T cells [34]. Therefore, we investigated whether CXCL10 affects the anti-tumor effects of CD8+ T by regulating their glycolytic metabolism. CD8+ T cells were purified from the spleen and stimulated with exogenous CXCL10 with or without AMG487 (CXCL10 receptor inhibitor (CXCR3)). To assess their metabolic functions, extracellular acidification rate (ECAR) and oxygen consumption rate (OCR) were measured for glycolysis and oxidative phosphorylation (OXPHOS), respectively, by a seahorse assay. Results demonstrated that CD8+ T cells treated by CXCL10 exhibited higher ECAR than untreated CD8+ T cells, evidenced by increased glycolytic capacity and reserve in CXCL10-stimulated CD8+ T cells. Blocking the effects of CXCL10 through receptor inhibitors significantly suppressed this phenomenon (Figure 5A-B). In contrast, the basal OCR, maximal respiration, and spare respiratory capacity of CD8+ T cells treated by CXCL10 were lower than those of the control group (Figure 5C-D). Furthermore, recombinant CXCL10 promoted glucose consumption, lactate and ATP production in CD8+ T cells (Figure 5E).
CXCL10 promotes glycolysis and inhibits OXPHOS in CD8+ T cells. CD8+ T cells were purified from naïve mouse spleens and cultured in anti-CD3/CD28-coated plates in the presence of CXCL10 (100 ng/ml) with or without AMG487 (5 μM) for 48 h. (A-B) Splenic CD8+ T cells were treated with anti-CD3 and anti-CD28 in the presence of CXCL10 (100 ng/ml) with or without AMG487 (5 μM) for 48 h, and a glycolytic stress test kit was used to measure the key parameters of glycolysis, and the extracellular acidification rate (ECAR) profile, glycolysis, glycolytic capacity, and glycolytic reserve were quantified. *P < 0.05 and ***P < 0.001. (C-D) Splenic CD8+ T cells were treated with anti-CD3 and anti-CD28 in the presence of CXCL10 (100 ng/ml) with or without AMG487 (5 μM) for 48 h, and a cell mito stress test kit was used to measure the key parameters, and the oxygen consumption rate (OCR) profile, basal respiration, maximal respiration, and spare respiratory capacity were quantified. *P < 0.05, **P < 0.01 and ***P < 0.001. (E) Relative glucose consumption, lactate production ratio and ATP levels of CD8+ T cells after a 48 h-long treatment with 100 ng/ml CXCL10, and with or without AMG487 (5 μM). *P < 0.05 and **P < 0.01. (F) RT-qPCR analysis of GLUT1, HK2, PKM2, LDHA and GAPDH expression in CD8+ T cells after a 48 h treatment with CXCL10 (100 ng/ml) and with or without AMG487 (5 μM). Data are presented as the means ± SEM from three independent experiments. Data in RT-qPCR analysis is normalized to control CD8+ T cells. **P < 0.01 and ***P < 0.001. (G) Schematic of LDH reaction. (H) Relative NAD+/NADH ratio of CD8+ T cells after a 48 h treatment with 100 ng/ml CXCL10, and with or without AMG487 (5 μM). *P < 0.05 and **P < 0.01. (I) Left, mitochondrial membrane potential as assessed by TMRE fluorescence in CD8+ T cells treated with 100 ng/ml CXCL10, 5 μM AMG487, or control for 48 h. Right, quantification of mean fluorescence intensity for TMRE. ***P < 0.001.
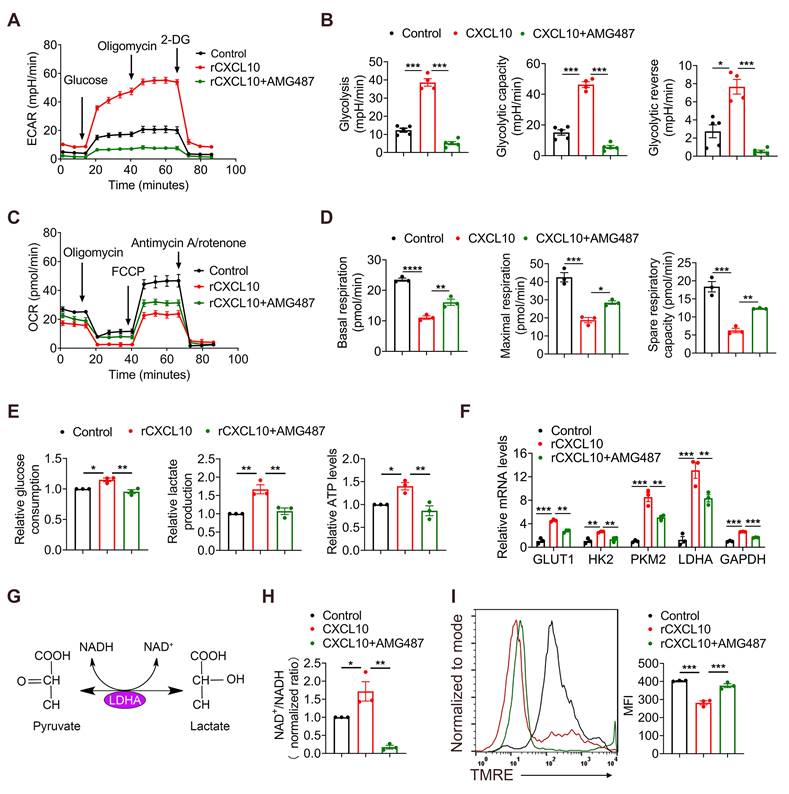
Glycolysis can enhance the conversion of pyruvate to lactate in glucose-rich conditions, resulting in increased glycolytic enzymes expression and NAD+ regeneration [35]. We next examined the transcriptional profile of CD8+ T cells after CXCL10 stimulation using RT-qPCR. Consistently, the expression of key glycolysis genes, such as glucose transporter type 1 (GLUT1), hexokinase 2 (HK2), pyruvate kinase muscle isoenzyme 2 (PKM2), lactate dehydrogenase A (LDHA) and glyceraldehyde-3-phosphate dehydrogenase (GAPDH), was increased in CXCL10-treated CD8+ T cells compared to control cells, and AMG487 significantly suppressed this phenomenon (Figure 5F). Interestingly, the expression of LDHA increased the most. Studies have shown that LDHA can catalyze the interconversion of pyruvate to lactate and is accompanied by NAD+ regeneration [36, 37] (Figure 5G). We found that the NAD+/NADH ratio increased after treating CD8+ T cells with recombinant CXCL10, suggesting that LDHA activity was increased (Figure 5H). LDHA activation leads to less NADH accumulation in the cytoplasm, and NADH can enter the mitochondria and alter mitochondrial membrane potential (MMP) [38]. Therefore, mitochondrial function was further detected by measuring MMP. A significant decrease of MMP was found in the CXCL10-stimulated group compared to control CD8+ T cells by measuring the fluorescence intensity of tetramethylrhodamine ethyl ester (TMRE) using FACS (Figure 5I). Thus, our results indicated that CXCL10 promoted LDHA activity in CD8+ T cells, resulting in altered glycolytic flux and NAD(H) balance.
Mammalian target of rapamycin (mTOR) and LDHA inhibition reverses the effects of CXCL10 on CD8+ T cell metabolism and TNF-α production
The mTOR pathway provides a critical link between metabolism and function of T cells [39-42], and LDHA is the key player in this metabolic programming [41]. Therefore, we speculated that CXCL10 secreted by hepatocytes plays a role in regulating CD8+ T cell glycolysis process through mTOR and LDHA signaling. LDHA is a key enzyme in NAD+ and NADH transformation. Therefore, we detected the NAD+/NADH ratio after inhibiting mTOR with the mTOR inhibitor Rapamycin (Rapa) (Figure 6A). Results demonstrated that in the presence of CXCL10, NAD+/NADH ratio decreased in Rapa-treated CD8+ T cells (Figure 6B), suggesting that mTOR inhibition directly affected the role of LDHA in glycolysis process.
mTOR and LDH inhibition recapitulates the effects of CXCL10 on CD8+ T cell metabolism and TNF-α production. CD8+ T cells were purified from naïve mouse spleens and cultured in anti-CD3/CD28-coated plates in the presence of CXCL10 (100 ng/ml) with or without AMG487 (5 μM), Rapamycin (25 nM), and GSK2837808A (10 μM) for 48h. (A) Schematic of targets of CXCR3, mTOR, and LDHA. (B) NAD+/NADH ratio in CD8+ T cells treated with 100 ng/ml CXCL10, 25 nM Rapamycin, 10 μM GSK2837808A, or left untreated for 48 h. *P < 0.05 and **P < 0.01. (C) Relative glucose consumption (D) lactate production in CD8+ T cells treated with 100 ng/ml CXCL10, 25 nM Rapamycin, 10 μM GSK2837808A, or left untreated for 48 h. **P < 0.01, ***P < 0.001 and ****P < 0.0001. (E) Left, mitochondrial membrane potential as assessed by TMRE fluorescence in CD8+ T cells treated with 100 ng/ml CXCL10, 25 nM Rapamycin, 10 μM GSK2837808A, or Control for 48 h. Right, quantification of mean fluorescence intensity for TMRE. *P < 0.05, **P < 0.01 and ***P < 0.001 (F) TNF-α proportion in CD8+ T cells after intracellular cytokine staining of CD8+ T cells activated with PMA/Ionomycin and BFA/Monensin mixtures for 6 h in the presence of 100 ng/ml CXCL10, 25 nM Rapamycin, 10 μM GSK2837808A, or left untreated. *P < 0.05 and **P < 0.01. (G) Ex vivo images of resected tumors (left) and growth curves of tumor volume (right) formed by subcutaneous injection of Hepa1-6 cells with or without 100 μg anti-CXCL10 neutralizing antibody (n = 6 per group). (Scale bar: 1 cm). *P < 0.05 and **P < 0.01.
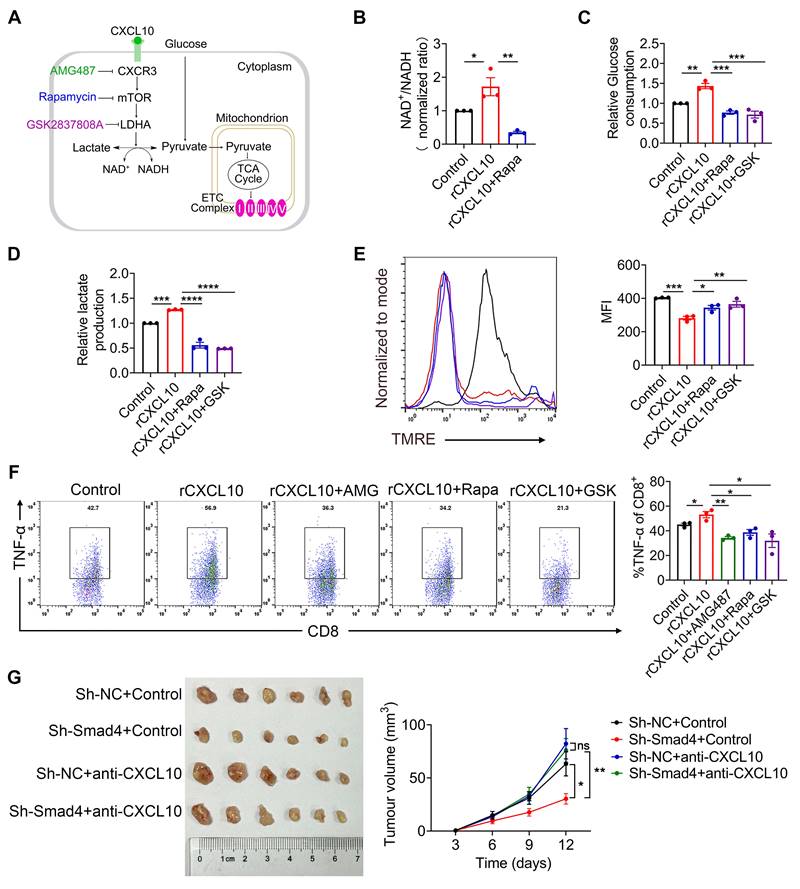
Rapa and LDHA inhibitor GSK2837808A (GSK) were used to investigate whether the inhibition of mTOR and LDHA affected the glycolysis process regulated by CXCL10 (Figure 6A). Results demonstrated that CD8+ T cells treated with mTOR and LDHA inhibitor significantly reduced CXCL10-induced glucose consumption and lactate production (Figure 6C-D). Furthermore, we evaluated the OXPHOS metabolic activities in CXCL10-treated CD8+ T cells after using Rapa and GSK. TMRE analysis revealed that in the presence of Rapa and GSK, severely dampened MMP was partially recovered in CXCL10-treated CD8+ T cells (Figure 6E). Overall, these data indicated that mTOR and LDHA inhibition are sufficient to decrease CXCL10-induced glycolysis. To clarify whether mTOR and LDHA inhibition are also sufficient to cause immune phenotype changes promoted by CXCL10, we tested the effects of Rapa and GSK on the expression of TNF-α. As shown in Figure 6F, mTOR and LDHA inhibition decreased TNF-α production stimulated by CXCL10.
Furthermore, sh-NC and sh-Smad4 Hepa1-6 cells were inoculated subcutaneously in C57BL/6 mice and CXCL10 was blocked by CXCL10-neutralizing antibody. Control animals were administered with an isotype control antibody. Notably, we found that neutralizing CXCL10 abolished the tumor-suppressive effects of Smad4 knockdown, indicating that CXCL10 inhibition by Smad4 was crucial for its oncogenic activity (Figure 6G). Moreover, anti-CXCL10 antibody significantly decreased the expression of mTOR, LDHA, and TNF-α in CD8+ T cells in tumors detected by immunofluorescence (Figure S3G).
HCC patients with Smad4-high expression exhibit decreased CD8+ T cells infiltration and altered glycolysis
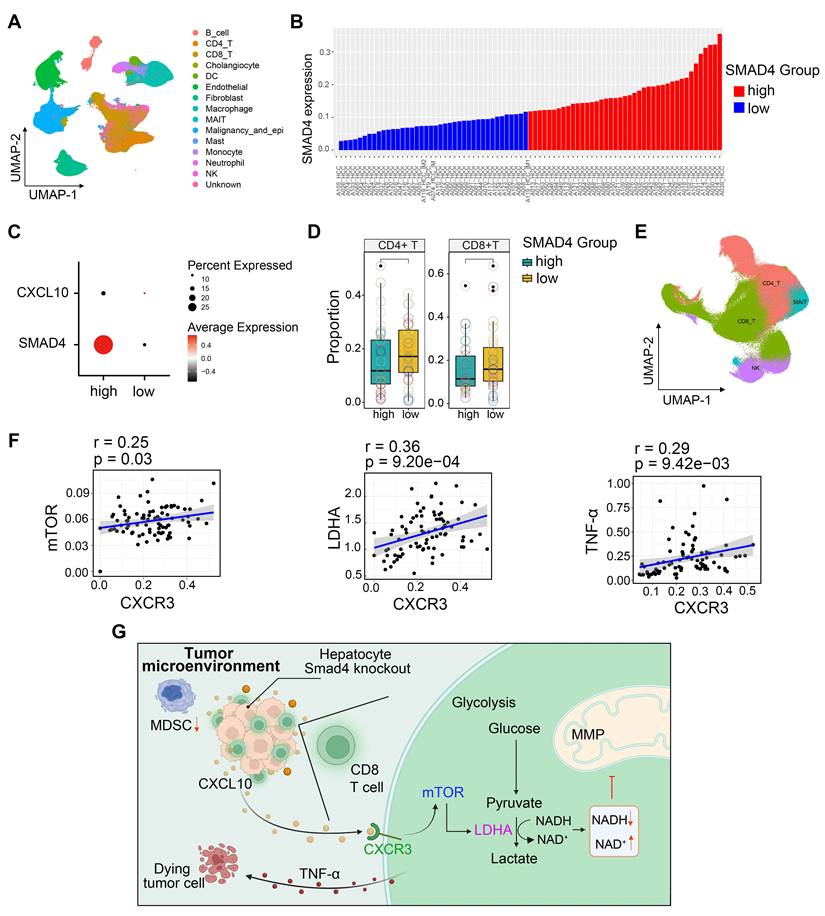
To extend our findings to human HCC cases, we performed single-cell RNA sequencing (scRNA-seq) analysis of 80 HCC samples to further delineate the functional role of Smad4 in human HCC tumors [28]. Single-cell transcriptome profiles of 80 patients with HCC were included. Integrative analysis across this scRNA-seq cohort identified distinct clusters corresponding to canonical markers of indicated cell type (Figure 7A). We used the median Smad4 gene expression level as a cutoff value to split the enrolled patients into Smad4-high and Smad4-low groups (Figure 7B). Results demonstrated that CXCL10 exhibited low expression in tumor cells with Smad4 high expression group, showing a negative correlation between Smad4 and CXCL10 expression (Figure 7C). Additionally, results revealed that patients exhibiting high Smad4 expression within their tumors had a comparatively reduced presence of CD8+ and CD4+ T cells, suggesting that elevated Smad4 expression promotes a pro-tumoral immune environment (Figure 7D), consistent with conclusions observed in our mouse experiments. Furthermore, we explored the correlation between the CXCL10 receptor CXCR3 and mTOR, LDHA, and TNF-α expression in CD8+ T cells. Results demonstrated a significantly positive association between CXCR3 expression and mTOR, LDHA and TNF-α, within CD8+ T cells (Figure 7E-F). These findings indicated a diminished anti-tumor immune response in HCC patients with high Smad4 expression and highlighted a positive correlation between the CXCL10/CXCR3 and glycolysis and TNF-α production in CD8+ T cells.
HCC patients with Smad4-high expression exhibit decreased CD8+ T cells infiltration and altered glycolysis. (A) Uniform manifold approximation and projection (UMAP) plot of broad cell types from all HCC samples (n = 80). (B) The average expression of Smad4 in tumor cells. They were divided into high Smad4 expression group and low Smad4 expression group. (C) Dot plots show the expression of Smad4 and CXCL10 in HCC tumor cells. Dot size indicates the fraction of expressing cells and was coloured according to Z score normalized expression levels. (D) Proportions of CD4+ and CD8+ T cells in two subgroups (Smad4-high and Smad4-low). (E) UMAP plot of T/NK cell subclusters identified. (F) Correlation between the mRNA levels of CXCR3 and mTOR, LHDA, TNF-α in CD8+ T cells. (G) In HCC, Smad4 deletion in hepatocytes leads to increased CXCL10 secretion, thereafter upregulated TNF-α expression and glycolysis in CD8+ T cells via the CXCL10/mTOR/LDHA axis.
Discussion
Our previous study revealed that hepatocyte-specific Smad4 deletion attenuated CCl4-induced liver fibrosis by suppressing hepatocyte proliferation and epithelial-mesenchymal transition (EMT) [15]. In the present study, our data further demonstrated that Smad4 deficiency in hepatocytes suppressed hepatocarcinogenesis by increasing of CD8+ T cell infiltration. This immunogenic reprogramming was driven by enhanced CXCL10 secretion in hepatocytes, facilitating TNF-α production in CD8+ T cells. The specific mechanism involves the promotion of CD8+ T cell glycolytic metabolism by CXCL10 through the CXCR3/mTOR/LDHA signaling pathway. A schematic illustration indicated the proposed model of inherent connections between hepatocytes and CD8+ T cells in HCC (Figure 7G). These findings demonstrated an important role of Smad4/CXCL10/CXCR3 signaling in fibrosis-related HCC.
Smad4 is a key mediator of the TGF-β pathway and plays complex and contradictory roles during tumorigenesis. Our data revealed that Smad4 was overexpressed in liver tissues of HCC (Figure 1), and that hepatocyte-specific Smad4 deficient mice developed fewer and smaller tumors than control mice. Smad4 knockout could also inhibit the growth of subcutaneous transplanted tumors (Figure 2). Consistent with these findings, Wang et al. demonstrated that Smad4 was highly expressed in HBV‑positive HCC patient samples and was associated with poor prognosis [43]. Hernanda et al. also reported that silencing Smad4 in the human Huh7 cell line decelerated cell proliferation and migration and suppressed implantation tumor growth [22]. Furthermore, in the context of HCC bone metastasis, the weakened inhibition of miR-34a on Smad4 promoted the expression of downstream bone metastasis-related genes such as connective tissue growth factor (CTGF) and interleukin-11 (IL-11) [44]. However, Smad4 was initially identified as a candidate tumor suppressor gene, whose inactivation may lead to pancreatic cancer (PDAC) [45]. Similar situations have also been shown to occur in colorectal and prostate cancers [46, 47]. Consequently, the function of Smad4 in regulating tumor progression may be dependent on tumor type, cell type and TEM.
In the TME, Smad4 acts indirectly on anti-tumor immune response by regulating the transcription of multiple chemokines. Our study showed that Smad4 deletion in hepatocytes enhances TNF-α production and glycolysis of CD8+ T cells via CXCL10 secretion (Figure 3). Similar to this study, Smad4 silencing in epithelial cells promoted the expression of CCL20, thereby enabling susceptibility to colitis-associated cancer [48]. Another study showed that epithelial Smad4 deficiency increased the stemness of gastric cancer cells via CXCL1, which functionally suppressed the function of dendritic cells (DC) and altered the expression of immune checkpoint molecules 4-1BB ligand (4-1BBL) and programmed death-ligand 1 (PD-L1) [49].
CXCL10 derived from tumor provides a key link between tumor cells and CD8+ T cells [50, 51] and promotes anti-tumor immune responses [52]. Inhibition of lysine-specific demethylase 4C (KDM4C) augments CD8+ T cell-mediated antitumor immunity in lung carcinoma by activating CXCL10 transcription [53]. Interferon regulatory factor 1 (IRF-1) derived from tumor recruits and activates immune cells to exert an anti-tumor effect on HCC through CXCL10/CXCR3 axis [50]. Our study provides direct evidence that Smad4 deletion in hepatocytes regulates CD8+ T cell infiltration and activity by increasing CXCL10 secretion (Figure 4). Consistent with this, our further research showed that CXCL10 derived from hepatocytes facilitates glucose metabolism in CD8+ T cells, as reflected in higher glycolytic capacity, glucose consumption, lactate production and ATP levels compared with the control group (Figure 5).
Glucose metabolism plays a pivotal role in the regulation of CTL responses. Because effector CD8+ T cells undergo extensive proliferation upon antigen stimulation, they require a high glycolytic flux to sustain the bioenergetic demands and provide building blocks for cellular biomass [54]. Moreover, glucose metabolism is closely linked to mTOR signaling [39] and T cell cytotoxicity [38]. Our results indicated that CXCL10-treated CD8+ T cells showed an increase in glycolysis and TNF-α expression, and mTOR and LDHA inhibitors significantly reversed this increasing trend (Figure 6). Although the chemotaxis and differentiation effects of CXCL10 on CD8+ T cells have been reported previously [50, 55, 56], this study revealed a previously unknown role of CXCL10 in regulating CD8+ T cell effects and metabolic reprogramming. Future studies are required to investigate the in vivo immunotherapeutic relevance of the proposed mechanism and determine whether Smad4 inhibition on CXCL10 expands beyond CD8+ T cells in vivo, affecting other cells within the TME.
In conclusion, this study demonstrated that Smad4 expression in hepatocytes plays a crucial role in HCC. Smad4 deletion in hepatocytes alleviates fibrosis-related hepatocarcinogenesis and increases CD8+ T cell infiltration by stimulating CXCL10 secretion, thereby inhibiting HCC progression. Collectively, Smad4 may represent a potential candidate target for the prevention and targeted therapy of HCC, consolidating the preclinical foundation for HCC therapeutic strategies.
Abbreviations
HCC: hepatocellular carcinoma; DEN: diethylnitrosamine; CCl4: carbon tetrachloride; OXPHOS: oxidative phosphorylation; ECAR: extracellular acidification rate; OCR: oxygen consumption rate; TCA: tricarboxylic acid; ETC: mitochondrial electron transport chain.
Supplementary Material
Supplementary materials and methods, figures and table.
Funding
This work was supported by the National Natural Science Foundation of China (81972689), the Natural Science Foundation of Beijing (7232102) and Capital Health Development Research Project (2022-2-4084).
Author contributions
Jinhua Zhang designed this study. Xin Xin, Xuanxuan Yan and Ting Liu conducted experiments. Xin Xin, Jinhua Zhang and Lingling Hou performed data analysis and wrote the manuscript. Xinlong Yan and Fanxin Zeng performed public datasets analysis. Zhao Li, Zuyin Li and Zhuomiaoyu Chen provided the clinical samples and performed single-cell sequencing data analysis.
Data availability statement
All data generated or analyzed during this study are included in this article and its online supplementary material. Further inquiries can be directed to the corresponding author.
Competing Interests
The authors have declared that no competing interest exists.
References
1. Sung H, Ferlay J, Siegel RL, Laversanne M, Soerjomataram I, Jemal A. et al. Global Cancer Statistics 2020: GLOBOCAN Estimates of Incidence and Mortality Worldwide for 36 Cancers in 185 Countries. CA Cancer J Clin. 2021;71:209-49
2. Åberg F, Byrne CD, Pirola CJ, Männistö V, Sookoian S. Alcohol consumption and metabolic syndrome: Clinical and epidemiological impact on liver disease. J Hepatol. 2023;78:191-206
3. Huang DQ, Mathurin P, Cortez-Pinto H, Loomba R. Global epidemiology of alcohol-associated cirrhosis and HCC: trends, projections and risk factors. Nat Rev Gastroenterol Hepatol. 2023;20:37-49
4. Feng M, Pan Y, Kong R, Shu S. Therapy of Primary Liver Cancer. Innovation (Camb). 2020;1:100032
5. Siegel RL, Miller KD, Wagle NS, Jemal A. Cancer statistics, 2023. CA Cancer J Clin. 2023;73:17-48
6. Galon J, Bruni D. Tumor Immunology and Tumor Evolution: Intertwined Histories. Immunity. 2020;52:55-81
7. Hao X, Sun G, Zhang Y, Kong X, Rong D, Song J. et al. Targeting Immune Cells in the Tumor Microenvironment of HCC: New Opportunities and Challenges. Front Cell Dev Biol. 2021;9:775462
8. Hossain MA, Liu G, Dai B, Si Y, Yang Q, Wazir J. et al. Reinvigorating exhausted CD8(+) cytotoxic T lymphocytes in the tumor microenvironment and current strategies in cancer immunotherapy. Med Res Rev. 2021;41:156-201
9. Nagarsheth N, Wicha MS, Zou W. Chemokines in the cancer microenvironment and their relevance in cancer immunotherapy. Nat Rev Immunol. 2017;17:559-72
10. Aki S, Nakahara R, Maeda K, Osawa T. Cancer metabolism within tumor microenvironments. Biochim Biophys Acta Gen Subj. 2023;1867:130330
11. Rao S, Mishra L. Targeting Transforming Growth Factor Beta Signaling in Liver Cancer. Hepatology. 2019;69:1375-8
12. Gough NR, Xiang X, Mishra L. TGF-β Signaling in Liver, Pancreas, and Gastrointestinal Diseases and Cancer. Gastroenterology. 2021;161:434-52.e15
13. Batlle E, Massagué J. Transforming Growth Factor-β Signaling in Immunity and Cancer. Immunity. 2019;50:924-40
14. Qin G, Wang GZ, Guo DD, Bai RX, Wang M, Du SY. Deletion of Smad4 reduces hepatic inflammation and fibrogenesis during nonalcoholic steatohepatitis progression. J Dig Dis. 2018;19:301-13
15. Wei M, Yan X, Xin X, Chen H, Hou L, Zhang J. Hepatocyte-Specific Smad4 Deficiency Alleviates Liver Fibrosis via the p38/p65 Pathway. Int J Mol Sci. 2022;23:11696
16. Ma Z, Chen Y, Qiu J, Guo R, Cai K, Zheng Y. et al. CircBTBD7 inhibits adipogenesis via the miR-183/SMAD4 axis. Int J Biol Macromol. 2023;253:126740
17. Zhao M, Mishra L, Deng CX. The role of TGF-beta/SMAD4 signaling in cancer. Int J Biol Sci. 2018;14:111-23
18. Khanizadeh S, Ravanshad M, Hosseini S, Davoodian P, Nejati Zadeh A, Sarvari J. Blocking of SMAD4 expression by shRNA effectively inhibits fibrogenesis of human hepatic stellate cells. Gastroenterol Hepatol Bed Bench. 2015;8:262-9
19. Liu X, Hao J, Wei P, Zhao X, Lan Q, Ni L. et al. SMAD4, activated by the TCR-triggered MEK/ERK signaling pathway, critically regulates CD8(+) T cell cytotoxic function. Sci Adv. 2022;8:eabo4577
20. Gu AD, Zhang S, Wang Y, Xiong H, Curtis TA, Wan YY. A critical role for transcription factor Smad4 in T cell function that is independent of transforming growth factor β receptor signaling. Immunity. 2015;42:68-79
21. Wang Y, Chu J, Yi P, Dong W, Saultz J, Wang Y. et al. SMAD4 promotes TGF-β-independent NK cell homeostasis and maturation and antitumor immunity. J Clin Invest. 2018;128:5123-36
22. Hernanda PY, Chen K, Das AM, Sideras K, Wang W, Li J. et al. SMAD4 exerts a tumor-promoting role in hepatocellular carcinoma. Oncogene. 2015;34:5055-68
23. Hiwatashi K, Ueno S, Sakoda M, Kubo F, Tateno T, Kurahara H. et al. Strong Smad4 expression correlates with poor prognosis after surgery in patients with hepatocellular carcinoma. Ann Surg Oncol. 2009;16:3176-82
24. Yao L, Li FJ, Tang ZQ, Gao S, Wu QQ. Smad4 expression in hepatocellular carcinoma differs by hepatitis status. Asian Pac J Cancer Prev. 2012;13:1297-303
25. Yuan Q, Zhang J, Liu Y, Chen H, Liu H, Wang J. et al. MyD88 in myofibroblasts regulates aerobic glycolysis-driven hepatocarcinogenesis via ERK-dependent PKM2 nuclear relocalization and activation. J Pathol. 2022;256:414-26
26. Postic C, Shiota M, Niswender KD, Jetton TL, Chen Y, Moates JM. et al. Dual roles for glucokinase in glucose homeostasis as determined by liver and pancreatic beta cell-specific gene knock-outs using Cre recombinase. J Biol Chem. 1999;274:305-15
27. Li Y, Wei M, Yuan Q, Liu Y, Tian T, Hou L. et al. MyD88 in hepatic stellate cells promotes the development of alcoholic fatty liver via the AKT pathway. J Mol Med (Berl). 2022;100:1071-85
28. Xue R, Zhang Q, Cao Q, Kong R, Xiang X, Liu H. et al. Liver tumour immune microenvironment subtypes and neutrophil heterogeneity. Nature. 2022;612:141-7
29. Cao S, Liu M, Sehrawat TS, Shah VH. Regulation and functional roles of chemokines in liver diseases. Nat Rev Gastroenterol Hepatol. 2021;18:630-47
30. Tokunaga R, Zhang W, Naseem M, Puccini A, Berger MD, Soni S. et al. CXCL9, CXCL10, CXCL11/CXCR3 axis for immune activation - A target for novel cancer therapy. Cancer Treat Rev. 2018;63:40-7
31. Marra F, Tacke F. Roles for chemokines in liver disease. Gastroenterology. 2014;147:577-94.e1
32. Raskov H, Orhan A, Christensen JP, Gögenur I. Cytotoxic CD8(+) T cells in cancer and cancer immunotherapy. Br J Cancer. 2021;124:359-67
33. Chen X, He H, Xiao Y, Hasim A, Yuan J, Ye M. et al. CXCL10 Produced by HPV-Positive Cervical Cancer Cells Stimulates Exosomal PDL1 Expression by Fibroblasts via CXCR3 and JAK-STAT Pathways. Front Oncol. 2021;11:629350
34. Reina-Campos M, Scharping NE, Goldrath AW. CD8(+) T cell metabolism in infection and cancer. Nat Rev Immunol. 2021;21:718-38
35. Liberti MV, Locasale JW. The Warburg Effect: How Does it Benefit Cancer Cells? Trends Biochem Sci. 2016;41:211-8
36. Boudreau A, Purkey HE, Hitz A, Robarge K, Peterson D, Labadie S. et al. Metabolic plasticity underpins innate and acquired resistance to LDHA inhibition. Nat Chem Biol. 2016;12:779-86
37. Lunt SY, Vander Heiden MG. Aerobic glycolysis: meeting the metabolic requirements of cell proliferation. Annu Rev Cell Dev Biol. 2011;27:441-64
38. Notarangelo G, Spinelli JB, Perez EM, Baker GJ, Kurmi K, Elia I. et al. Oncometabolite d-2HG alters T cell metabolism to impair CD8(+) T cell function. Science. 2022;377:1519-29
39. Salmond RJ. mTOR Regulation of Glycolytic Metabolism in T Cells. Front Cell Dev Biol. 2018;6:122
40. Chen L, Li X, Deng Y, Chen J, Huang M, Zhu F. et al. The PI3K-Akt-mTOR pathway mediates renal pericyte-myofibroblast transition by enhancing glycolysis through HKII. J Transl Med. 2023;21:323
41. Wu Z, Jia J, Xu X, Xu M, Peng G, Ma J. et al. Human herpesvirus 6A promotes glycolysis in infected T cells by activation of mTOR signaling. PLoS Pathog. 2020;16:e1008568
42. Liang Y, Wang X, Wang H, Yang W, Yi P, Soong L. et al. IL-33 activates mTORC1 and modulates glycolytic metabolism in CD8(+) T cells. Immunology. 2022;165:61-73
43. Chaomin W, Wenhao N, Jialei H, Ting Z, Honglei F, Zhuang H. et al. Spatiotemporal modulation of SMAD4 by HBx is required for cellular proliferation in hepatitis B-related liver cancer. Cell Oncol (Dordr). 2022;45:573-89
44. Zhang L, Niu H, Ma J, Yuan BY, Chen YH, Zhuang Y. et al. The molecular mechanism of LncRNA34a-mediated regulation of bone metastasis in hepatocellular carcinoma. Mol Cancer. 2019;18:120
45. Xiong W, He W, Wang T, He S, Xu F, Wang Z. et al. Smad4 Deficiency Promotes Pancreatic Cancer Immunogenicity by Activating the Cancer-Autonomous DNA-Sensing Signaling Axis. Adv Sci (Weinh). 2022;9:e2103029
46. Voorneveld PW, Kodach LL, Jacobs RJ, Liv N, Zonnevylle AC, Hoogenboom JP. et al. Loss of SMAD4 alters BMP signaling to promote colorectal cancer cell metastasis via activation of Rho and ROCK. Gastroenterology. 2014;147:196-208.e13
47. Ding Z, Wu CJ, Chu GC, Xiao Y, Ho D, Zhang J. et al. SMAD4-dependent barrier constrains prostate cancer growth and metastatic progression. Nature. 2011;470:269-73
48. Hanna DN, Smith PM, Novitskiy SV, Washington MK, Zi J, Weaver CJ. et al. SMAD4 Suppresses Colitis-associated Carcinoma Through Inhibition of CCL20/CCR6-mediated Inflammation. Gastroenterology. 2022;163:1334-50.e14
49. An HW, Seok SH, Kwon JW, Choudhury AD, Oh JS, Voon DC. et al. The loss of epithelial Smad4 drives immune evasion via CXCL1 while displaying vulnerability to combinatorial immunotherapy in gastric cancer. Cell Rep. 2022;41:111878
50. Yan Y, Zheng L, Du Q, Yazdani H, Dong K, Guo Y. et al. Interferon regulatory factor 1(IRF-1) activates anti-tumor immunity via CXCL10/CXCR3 axis in hepatocellular carcinoma (HCC). Cancer Lett. 2021;506:95-106
51. Shigeta K, Matsui A, Kikuchi H, Klein S, Mamessier E, Chen IX. et al. Regorafenib combined with PD1 blockade increases CD8 T-cell infiltration by inducing CXCL10 expression in hepatocellular carcinoma. J Immunother Cancer. 2020;8:e001435
52. Reschke R, Yu J, Flood B, Higgs EF, Hatogai K, Gajewski TF. Immune cell and tumor cell-derived CXCL10 is indicative of immunotherapy response in metastatic melanoma. J Immunother Cancer. 2021;9:e003521
53. Jie X, Chen Y, Zhao Y, Yang X, Xu Y, Wang J. et al. Targeting KDM4C enhances CD8(+) T cell mediated antitumor immunity by activating chemokine CXCL10 transcription in lung cancer. J Immunother Cancer. 2022;10:e003716
54. Geltink RIK, Kyle RL, Pearce EL. Unraveling the Complex Interplay Between T Cell Metabolism and Function. Annu Rev Immunol. 2018;36:461-88
55. Shang S, Yang YW, Chen F, Yu L, Shen SH, Li K. et al. TRIB3 reduces CD8(+) T cell infiltration and induces immune evasion by repressing the STAT1-CXCL10 axis in colorectal cancer. Sci Transl Med. 2022;14:eabf0992
56. Ozga AJ, Chow MT, Lopes ME, Servis RL, Di Pilato M, Dehio P. et al. CXCL10 chemokine regulates heterogeneity of the CD8(+) T cell response and viral set point during chronic infection. Immunity. 2022;55:82-97.e8
Author contact
![]() Corresponding authors: Jinhua Zhang, PhD, College of Life Science and Bioengineering, Beijing Jiaotong University, No.3 Shangyuancun Road, Beijing, 100044, China. Tel/Fax: 86-10-51684351; E-mail: zhangjhedu.cn. Lingling Hou, PhD, College of Life Science and Bioengineering, Beijing Jiaotong University, No.3 Shangyuancun Road, Beijing, 100044, China. Tel/Fax: 86-10-51688577; E-mail: llhouedu.cn
Corresponding authors: Jinhua Zhang, PhD, College of Life Science and Bioengineering, Beijing Jiaotong University, No.3 Shangyuancun Road, Beijing, 100044, China. Tel/Fax: 86-10-51684351; E-mail: zhangjhedu.cn. Lingling Hou, PhD, College of Life Science and Bioengineering, Beijing Jiaotong University, No.3 Shangyuancun Road, Beijing, 100044, China. Tel/Fax: 86-10-51688577; E-mail: llhouedu.cn