Impact Factor
- Issue 14; 2026
- Issue 13; 2026
- Issue 12; 2026
- Issue 11; 2026
- Issue 10; 2026
- Volume 16; 2026
- Advance Articles
- Past Issues
- Cover Images
- Cover Suggestion
- Index & Coverage
- Special Issues
Introduction
Results
Discussion
Materials and Methods
Abbreviations
Supplementary Material
Acknowledgements
References
International Journal of Biological Sciences
International Journal of Medical Sciences
 Global reach, higher impact

Theranostics 2023; 13(3):1076-1090. doi:10.7150/thno.79434 This issue Cite
Research Paper
Hepatic PTP4A1 ameliorates high-fat diet-induced hepatosteatosis and hyperglycemia by the activation of the CREBH/FGF21 axis
Byungtae Hwang1*, Min-Gi Kwon1,4*, Min Ji Cho1, Nam-Kyung Lee1, Jangwook Lee1, Jeong Woong Lee1, Kyoung-Jin Oh2, Kwang-Hee Bae2, Jung Hwan Hwang3, Jeong-Ki Min1,4 ![]() , Jong-Gil Park1,4
, Jong-Gil Park1,4 ![]()
1. Biotherapeutics Translational Research Center, Korea Research Institute of Bioscience & Biotechnology (KRIBB), 125 Gwahak-ro, Yuseong-gu, Daejeon 34141, Republic of Korea.
2. Metabolic Regulation Research Center, Korea Research Institute of Bioscience & Biotechnology (KRIBB), 125 Gwahak-ro, Yuseong-gu, Daejeon 34141, Republic of Korea.
3. Laboratory Animal Resource Center, Korea Research Institute of Bioscience & Biotechnology (KRIBB), 125 Gwahak-ro, Yuseong-gu, Daejeon 34141, Republic of Korea.
4. Department of Bioscience, KRIBB School of Bioscience, Korea University of Science and Technology (UST), 125 Gwahak-ro, Yuseong-gu, Daejeon 34141, Republic of Korea.
* These authors contributed equally to this work.
Received 2022-9-30; Accepted 2023-1-18; Published 2023-1-22
Abstract

Precise regulation of kinases and phosphatases is crucial for human metabolic homeostasis. This study aimed to investigate the roles and molecular mechanisms of protein tyrosine phosphatase type IVA1 (PTP4A1) in regulating hepatosteatosis and glucose homeostasis.
Method: Ptp4a1-/- mice, adeno-associated virus encoding Ptp4a1 under liver-specific promoter, adenovirus encoding Fgf21, and primary hepatocytes were used to evaluate PTP4A1-mediated regulation in the hepatosteatosis and glucose homeostasis. Glucose tolerance test, insulin tolerance test, 2-deoxyglucose uptake assay, and hyperinsulinemic-euglycemic clamp were performed to estimate glucose homeostasis in mice. The staining, including oil red O, hematoxylin & eosin, and BODIPY, and biochemical analysis for hepatic triglycerides were performed to assess hepatic lipids. Luciferase reporter assays, immunoprecipitation, immunoblots, quantitative real-time polymerase chain reaction, and immunohistochemistry staining were conducted to explore the underlying mechanism.
Results: Here, we found that deficiency of PTP4A1 aggravated glucose homeostasis and hepatosteatosis in mice fed a high-fat (HF) diet. Increased lipid accumulation in hepatocytes of Ptp4a1-/- mice reduced the level of glucose transporter 2 on the plasma membrane of hepatocytes leading to a diminution of glucose uptake. PTP4A1 prevented hepatosteatosis by activating the transcription factor cyclic adenosine monophosphate-responsive element-binding protein H (CREBH)/fibroblast growth factor 21 (FGF21) axis. Liver-specific PTP4A1 or systemic FGF21 overexpression in Ptp4a1-/- mice fed an HF diet restored the disorder of hepatosteatosis and glucose homeostasis. Finally, liver-specific PTP4A1 expression ameliorated an HF diet-induced hepatosteatosis and hyperglycemia in wild-type mice.
Conclusions: Hepatic PTP4A1 is critical for regulating hepatosteatosis and glucose homeostasis by activating the CREBH/FGF21 axis. Our current study provides a novel function of PTP4A1 in metabolic disorders; hence, modulating PTP4A1 may be a potential therapeutic strategy against hepatosteatosis-related diseases.
Keywords: PTP4A1, hepatosteatosis, glucose homeostasis, CREBH, FGF21
Introduction
The protein tyrosine phosphatase type IVA 1/phosphatase of regenerating liver-1 (PTP4A1/PRL-1), which belongs to dual-specificity phosphatases, is localized in the nucleus, peri-nucleus, and plasma membrane involved in various intracellular signaling [1-4]. PTP4A1 consists of phosphatase site, polybasic region, and prenylation motif and promotes cell proliferation, migration, and invasion through regulating the expression and/or activity of cell cycle regulators, p53, focal adhesion complex proteins, Rho and extracellular signal-regulated kinase signaling cascades [5-7]. PTP4A1 directly interacts with some molecules, including phospholipids, activating transcription factor 5/7 (ATF5/7), and p115 Rho GTPase activating protein for regulating their activities [6, 8]. Initially, PTP4A1 has identified as an immediate-early gene because PTP4A1 is highly expressed during liver regeneration [9]. Hepatic PTP4A1 deficiency delays liver mass restoration after partial hepatectomy through the impaired phosphoinositide 3-kinase/protein kinase B (PKB, also known as Akt) signaling in PTP4A1 mutant mice [10]. However, it remains to be elucidated whether PTP4A1 directly regulates hepatic metabolic diseases, including hepatosteatosis and glucose homeostasis.
Hepatosteatosis is a metabolic disorder with an accumulation of fat in the liver of at least 5% more, which is a clinical hallmark of non-alcoholic fatty liver disease (NAFLD) [11, 12]. NAFLD is the most common liver disorder worldwide and is an expanding health problem estimating a global prevalence of 25% [13]. NAFLD is categorized into non-alcoholic fatty liver and non-alcoholic steatohepatitis, which are histologically distinguished by inflammation with hepatocyte ballooning injury [14]. As the liver is an essential organ for maintaining glucose homeostasis, NAFLD is closely associated with the dysregulation of glucose uptake and utilization by the liver, accompanying the augmentation of gluconeogenesis and impairment of hepatic glucose transporter 2 (GLUT2) translocation to the plasma membrane [15-18]. Previous studies prove that NAFLD is associated with liver-related mortality or morbidity and an increased risk of extrahepatic diseases; however, there are currently no approved therapeutics [19]. Early development of therapeutics for NAFLD has been focused on preventing the pathogenesis of fibrosis, which is closely linked to the progression of NAFLD to cirrhosis and hepatocellular carcinoma [20]. Because of limited clinical efficacy in anti-fibrotic therapeutics, the approaches for developing therapeutics against NAFLD have been replaced with the repression of hepatosteatosis [21, 22]. Fibroblast growth factor 21 (FGF21), a hormone expressed primarily by the liver, has been considered a promising therapeutic agent in decreasing hepatosteatosis and hepatocyte injury [21, 23]. Administration of FGF21 protein, FGF21 analogs, or delivery of FGF21 by adenovirus into rodent models of NAFLD prevented hepatosteatosis with the suppression of de novo lipogenesis and the increased fat oxidation in the liver [24-27]. In addition, FGF21, as an endocrine factor, exerts inhibitory effects against NAFLD by regulating diverse extrahepatic tissues, including adipose tissue, pancreas, and skeletal muscle [24-28]. FGF21 expression is regulated by changes in a nutritional state, including fasting, high-carbohydrate diets, or low-protein diets through the activation of peroxisome proliferator-activated receptor (PPAR) α and/or cyclic adenosine monophosphate-responsive element-binding protein H (CREBH) [27, 29].
Here, we identified PTP4A1 as a negative regulator in the pathogenesis of hepatic steatosis through activation of the CREBH/FGF21 axis. Deficiency of PTP4A1 in mice accelerates hepatic steatosis in mice fed a high-fat (HF) diet and leads to the disruption of glucose homeostasis with the reduction of GLUT2 on the plasma membrane of hepatocytes. PTP4A1 prevented hepatosteatosis through the activation of the transcription factor CREBH/FGF21 axis. Liver-specific PTP4A1 or systemic FGF21 overexpression in Ptp4a1-/- mice fed an HF diet restored PTP4A1 deficiency-mediated upregulation of hepatosteatosis and blood glucose. In addition, liver-specific PTP4A1 expression ameliorated HF diet-induced hepatosteatosis and hyperglycemia in wild-type (WT) mice. Therefore, controlling PTP4A1 may be a potential candidate for therapeutic strategy against hepatosteatosis-related diseases.
Results
The deficiency of PTP4A1 in mice exacerbates HF diet-induced hyperglycemia and NAFLD
The mRNA levels of Ptp4a1, but not other isoforms, were significantly increased in the liver of mice fed an HF diet compared to those of mice fed a normal chow (NC) diet (Figure S1A). Also, the alteration of hepatic fat contents by fasting and refeeding increased the Ptp4a1 mRNA levels in mice fed an NC diet (Figure S1B). Consistent with mouse data, human hepatoma cells treated with bovine serum albumin-oleic acid (BSA-OA) tended to increase PTP4A1 mRNA levels compared to controls (Figure S1C). In addition, we identified that the levels of PTP4A1 expression were significantly increased in human NASH samples than in healthy controls in the dataset (GSE63067) from the Gene Expression Omnibus database (Figure S1D).
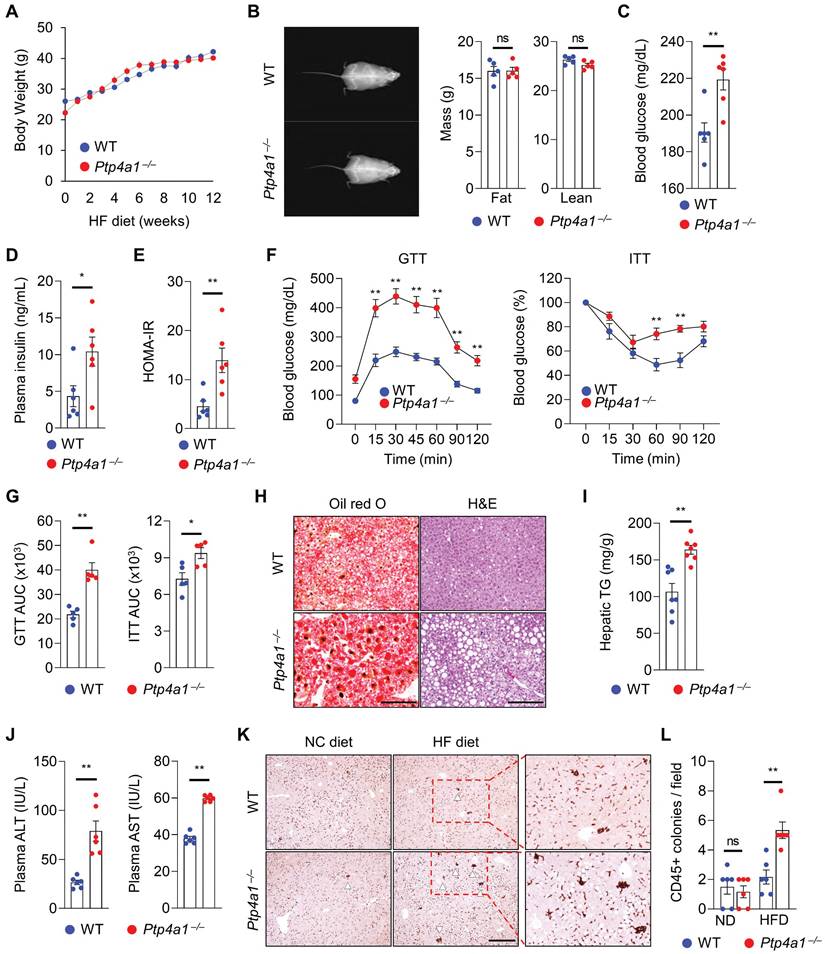
To evaluate whether PTP4A1 affects the regulation of obese-mediated metabolic diseases such as type 2 diabetes and NAFLD, we generated Ptp4a1-/- mice by CRISPR/Cas9 system (Figure S2) and placed Ptp4a1-/- mice and WT littermates on an HF diet for 12 weeks. Body weight (BW) gain and food intake were comparable between the two groups on an HF diet for 12 weeks (Figure 1A and S3A). Dual-energy X-ray absorptiometry (DEXA) revealed that both lean and fat mass were similar between the two groups (Figure 1B), and the ratio of epididymal white adipose tissue (eWAT) mass to BW was also comparable between the two groups (Figure S3B). However, the blood glucose levels in Ptp4a1-/- mice were significantly higher than in WT mice in a postprandial state after 12 weeks of an HF diet feeding (Figure 1C). Concomitantly, plasma insulin levels were markedly increased in Ptp4a1-/- mice compared to WT mice fed an HF diet (Figure 1D). In fasting conditions, homeostatic model assessment-insulin resistance (HOMA-IR) was significantly increased in Ptp4a1-/- mice compared to WT mice after an HF diet (Figure 1E). Glucose tolerance test (GTT) and insulin tolerance test (ITT) revealed that deficiency of PTP4A1 in mice fed an HF diet exacerbated glucose tolerance and reduced insulin sensitivity (Figure 1F-G). After an HF diet for 12 weeks, Ptp4a1-/- mice showed an increase in fat accumulation in the liver compared to those of WT mice, which was proved by oil red O staining, hematoxylin and eosin (H&E) staining, and hepatic triglyceride (TG) analysis (Figure 1H-I). In addition, Ptp4a1-/- mice increased the levels of alanine aminotransferase (ALT) and aspartate transaminase (AST) in plasma compared to those of WT mice fed an HF diet (Figure 1J). By immunohistochemistry assay for cluster of differentiation 45 (CD45), we verified the enhanced immune cell accumulation in the liver of Ptp4a1-/- mice compared to WT mice fed an HF diet (Figure 1K-L). Consistently, inflammatory markers, including F4/80, Mcp1, and Mip1a, but not Cd11c and KC, were significantly increased in the liver of Ptp4a1-/- mice compared to WT mice fed an HF diet (Figure S3C).
Lacking PTP4A1 in mice exacerbates a high-fat (HF) diet-induced hyperglycemia and NAFLD. (A) Body weight (BW) gain of Ptp4a1-/- mice and wild-type (WT) littermates on an HF diet for 12 weeks (n = 7). (B) Representative images and the graphs for fat and lean mass in dual-energy X-ray absorptiometry analysis (n = 5). (C and D) The levels of blood glucose (C) and plasma insulin (D) of WT and Ptp4a1-/- mice fed an HF diet for 12 weeks (n = 6). (E) Homeostatic model assessment-insulin resistance (HOMA-IR) of WT and Ptp4a1-/- mice in fasting conditions (n = 6). (F) Glucose tolerance test (GTT) and insulin tolerance test (ITT) of WT and Ptp4a1-/- mice fed an HF diet for 12 weeks (n = 5). (G) The area under the curve (AUC) of GTT and ITT (n = 5). (H) The representative images for oil-red O and hematoxylin & eosin (H&E) staining in the livers from WT and Ptp4a1-/- mice fed an HF diet for 12 weeks (n = 7). Scale bar, 200 μm. (I) Hepatic triglyceride (TG) levels of WT and Ptp4a1-/- mice fed an HF diet for 12 weeks (n = 7). (J) The levels of alanine aminotransferase (ALT) and aspartate transaminase (AST) in plasma of WT and Ptp4a1-/- mice fed an HF diet for 12 weeks (n = 6). (K) The representative images for CD45 positive cells in the liver of WT and Ptp4a1-/- mice fed a normal chow (NC) or an HF diet (n = 6). Scale bar, 300 μm. The magnified images in the red dot boxes are presented on the right. (L) The quantitative graph for CD45 positive colonies per field in the liver of WT and Ptp4a1-/- mice fed an HF diet for 12 weeks (n = 6). Data are presented as the mean ± standard error of the mean. *P < 0.05, **P < 0.01, n.s., not significant (Mann-Whitney U test for B-E, G, I, and J, two-way ANOVA for F and L).
Lack of PTP4A1 reduces glucose uptake by decreasing GLUT2 on the plasma membrane in hepatocytes
To verify whether the alteration of gluconeogenesis contributes to an increase in blood glucose in Ptp4a1-/- mice fed an HF diet compared to controls, we performed the pyruvate tolerance test (PTT) and glycerol tolerance test (GlyTT) in WT and Ptp4a1-/- mice fed an HF diet. After starvation, both groups were injected with pyruvate or glycerol as a substrate for glucose production. The blood glucose levels were comparable between the two groups in PTT and GlyTT analyses (Figure S4A-B). In addition, the mRNA levels of gluconeogenesis, including Foxo1, Pck1, and G6pc, were comparable between the two groups (Figure S4C). Next, we performed the hyperinsulinemic-euglycemic clamp study and 2-deoxyglucose (2-DG) uptake assay in WT and Ptp4a1-/- mice fed an HF diet. Basal hepatic glucose production (HGP), clamp HGP, and glucose infusion rate were comparable between the two groups; however, glucose uptake tended downward in Ptp4a1-/- mice compared to WT fed an HF diet in the hyperinsulinemic-euglycemic clamp study (Figure S4D). In the 2-DG uptake assay, we verified that deficiency of PTP4A1 in mice fed an HF diet decreased the levels of 2-DG in livers but not in eWATs and skeletal muscles (Figure 2A).
The deficiency of PTP4A1 in mice fed a high-fat (HF) diet reduces glucose uptake by a decrease in GLUT2 on the plasma membrane in hepatocytes. (A) The assay of 2-deoxyglucose (2-DG) uptake in the livers, epididymal white adipose tissues (eWAT), and gastrocnemius muscles of wild-type (WT) and Ptp4a1-/- mice fed an HF diet for 12 weeks (n = 5). (B) FACS analysis after staining BODIPY on primary hepatocytes (PH) of WT and Ptp4a1-/- mice fed an HF diet. Data represent three independent experiments. (C) FACS analysis after staining glucose transporter 2 (GLUT2)-APC and asialoglycoprotein receptor 1 (ASGR1)-Alexa 488 on PH of WT and Ptp4a1-/- mice fed a normal chow (NC) or an HF diet. ASGR1 was used as a marker for hepatocytes. Data represent three independent experiments. (D) FACS analysis of the 2-NBDG glucose uptake assay on the PH of WT and Ptp4a1-/- mice fed an HF diet. Data represent three independent experiments. (E) FACS analysis after staining BODIPY on Hep3B expressing mock or PTP4A1 treated with bovine serum albumin-oleic acid (BSA-OA). Data represent three independent experiments. (F) The 2-NBDG uptake assay after incubation of BSA-OA on Hep3B transfected by PTP4A1-expressing vector or control vector. Representative images (left) and quantification for relative fluorescence intensity (RFI, right) (n = 4). Scale bar, 500 μm. Data are presented as the mean ± standard error of the mean. **P < 0.01, n.s., not significant (Mann-Whitney U test for A; two‐tailed Student's t‐test for F).
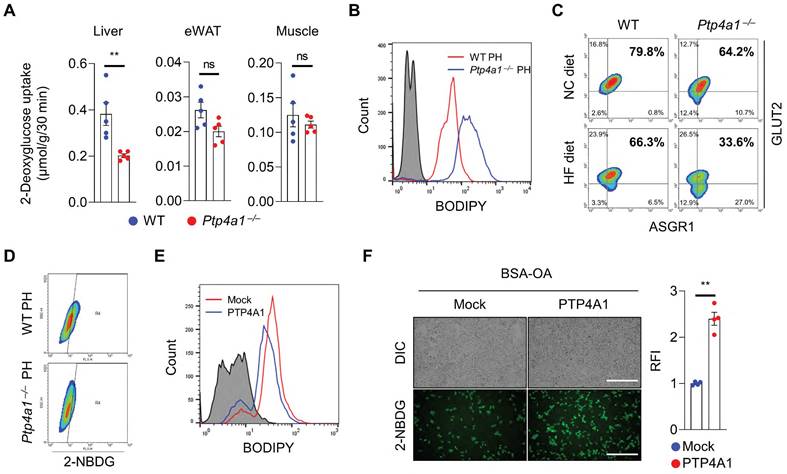
As hepatic steatosis induces a decrease in plasma membrane GLUT2 levels in the liver of mice fed an HF diet has been reported [16], we verified whether the levels of GLUT2 on the plasma membrane of hepatocytes were reduced by feeding an HF diet compared to an NC diet in mice. Primary hepatocytes revealed that plasma membrane GLUT2 was markedly decreased in the hepatocytes of mice fed an HF diet compared to those fed an NC diet (Figure S4E). In line with increased hepatic TG levels in Ptp4a1-/- mice fed an HF diet, isolated primary hepatocytes of Ptp4a1-/- mice showed a higher lipid accumulation than those of WT mice after feeding an HF diet (Figure 2B and S4F). Along with the increased lipid accumulation, deficiency of PTP4A1 in hepatocytes of mice fed an HF diet lessened the levels of GLUT2 on the plasma membrane (Figure 2C and S4F) and the uptake of 2-(N-(7-Nitrobenz-2-oxa-1,3-diazol-4-yl)Amino)-2-Deoxyglucose (2-NBDG), a fluorescent glucose analog (Figure 2D). In addition, an inverse correlation between fat accumulation and surface GLUT2 levels in hepatocytes was verified (Figure S4G). Overexpression of PTP4A1 in Hep3B reduced the lipid accumulation after incubation with BSA-OA compared to controls, leading to augmentation of the uptake of 2-NBDG more than controls (Figure 2E-F). In contrast, PTP4A1 down-regulation in Hep3B by PTP4A1-specific short hairpin RNA (shRNA)-expressing lentivirus decreased the uptake of 2-NBDG after incubation with BSA-OA compared to controls (Figure S4H).
PTP4A1 regulates the expression of FGF21 through an increase in CREBH activity
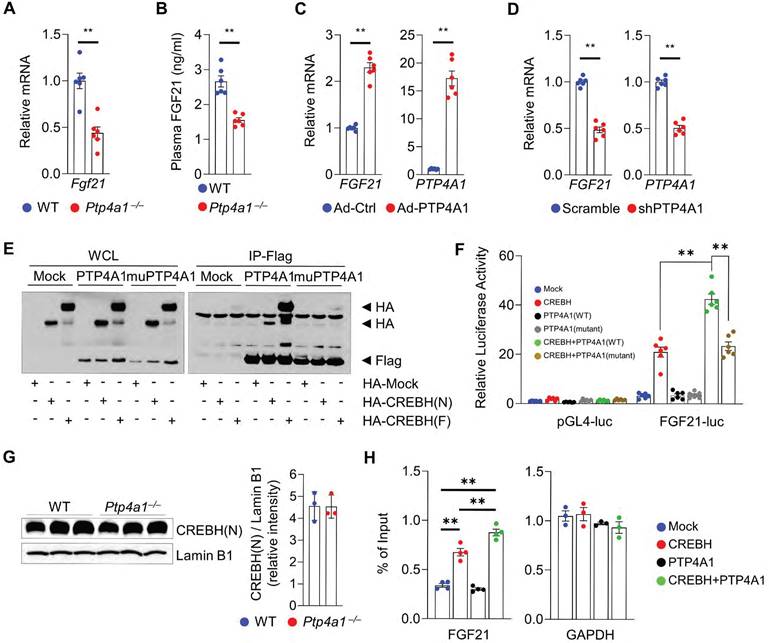
To investigate how PTP4A1 deficiency in mice induces hepatic steatosis, we analyzed the levels of transcripts involved in lipid metabolisms. The mRNA levels involved in fatty acids oxidation-related genes such as Pparα, Acox1, Cpt1a, Cpt2, Acadvl, and Acadm were significantly decreased; however, the mRNA levels associated with lipogenic genes were not increased in the liver of Ptp4a1-/- mice fed an HF diet compared to controls (Figure S5A-B). Interestingly, the mRNA levels of Fgf21 in the liver of Ptp4a1-/- mice fed an HF diet were significantly mitigated, and plasma FGF21 levels were also diminished in Ptp4a1-/- mice fed an HF diet compared to WT mice (Figure 3A-B). Adenoviral overexpression of PTP4A1 in human hepatoma cells increased the mRNA levels of FGF21 compared to controls (Figure 3C), and shRNA-mediated PTP4A1 knock-down in human hepatoma cells reduced the mRNA levels of FGF21 compared to controls (Figure 3D). As FGF21 expression is regulated by transcription factor PPARα and/or CREBH, we tested whether PTP4A1 physically interacts with PPARα or CREBH in human embryonic kidney 293T (HEK293T) cells. By co-immunoprecipitation, we identified that PTP4A1 physically interacted with the active form of CREBH (CREBH(N)) and the inactive form of CREBH (CREBH(F)) but not PPARα (Figure 3E and S5C). PTP4A1 synergistically increased CREBH-mediated luciferase activity in an FGF21-luciferase reporter assay (Figure 3F). However, mutation of PTP4A1 at the residues of 72 (D to A) and 104 (C to S) amino acids did not increase CREBH-mediated luciferase activity in an FGF21-luciferase reporter assay because mutant of PTP4A1 failed to interact with CREBH (Figure 3E-F). To verify the molecular mechanism for the modulatory role of PTP4A1 in the CREBH-FGF21 axis, we first confirmed the levels of CREBH in the liver of WT and Ptp4a1-/- mice. The mRNA levels of the Creb3l3 gene (encoding CREBH) were comparable between the liver of WT and Ptp4a1-/- mice (Figure S5D). To confirm the protein levels of CREBH(N) in the liver, we isolated the nuclear fraction and identified the similar levels of CREBH(N) between the two groups (Figure 3G). Next, we tested whether PTP4A1 may increase the CREBH binding activity on the FGF21 promoter region by chromatin immunoprecipitation (ChIP) assay. Consistent with the luciferase reporter gene assay, we verified that PTP4A1 could enhance the activity of CREBH on the FGF21 gene expression (Figure 3H).
PTP4A1 regulates the expression of FGF21 via the activation of transcription factor CREBH. (A) The mRNA levels of Fgf21 in the liver of wild-type (WT) and Ptp4a1-/- mice fed an HF diet for 12 weeks (n = 6). (B) Plasma FGF21 levels in WT and Ptp4a1-/- mice fed an HF diet for 12 weeks (n = 6). (C) The mRNA levels of FGF21 and PTP4A1 in Hep3B infected by adenovirus (Ad)-Control (Ctrl) or Ad-PTP4A1 (n = 6). (D) The mRNA levels of FGF21 and PTP4A1 in Hep3B infected by lentivirus expressing-shPTP4A1 or -scramble control (n = 6). (E) Co-immunoprecipitation assay in HEK 293T transfected by HA-Mock, HA-CREBH(N), or HA-CREBH(F) with Flag-Mock, Flag-PTP4A1, or Flag-mutant PTP4A1 (D74A/C104S). Flag antibody was used for immunoprecipitation. Data represent three independent experiments. (F) FGF21-luciferase reporter assay in HEK293T transfected by Mock, CREBH(N), PTP4A1, mutant PTP4A1, CREBH(N)+PTP4A1, or CREBH(N)+mutant PTP4A1. (G) Western blot analysis for the CREBH(N) in the nuclear fraction of liver from WT and Ptp4a1-/- mice fed an HF diet. Lamin B1 was used for loading control. The quantification graph is presented on the right (n = 3). (H) Chromatin immunoprecipitation assay (n = 4). The FGF21 gene was amplified by specific primers after immunoprecipitation by an anti-HA antibody in mock-, HA-CREBH-, PTP4A1-, or HA-CREBH+PTP4A1-treated Hep3B. GAPDH was used as an internal control after immunoprecipitation by an anti-RNA polymerase II antibody. Data represent three independent experiments. Data are presented as the mean ± standard error of the mean. **P < 0.01 (two‐tailed Student's t‐test for A, C, D, and G; Mann-Whitney U test for B; two-way ANOVA for F; one-way ANOVA for H).
PTP4A1 deficiency in mice disturbs FGF21 expression, blood glucose, and hepatic TG in fasting conditions
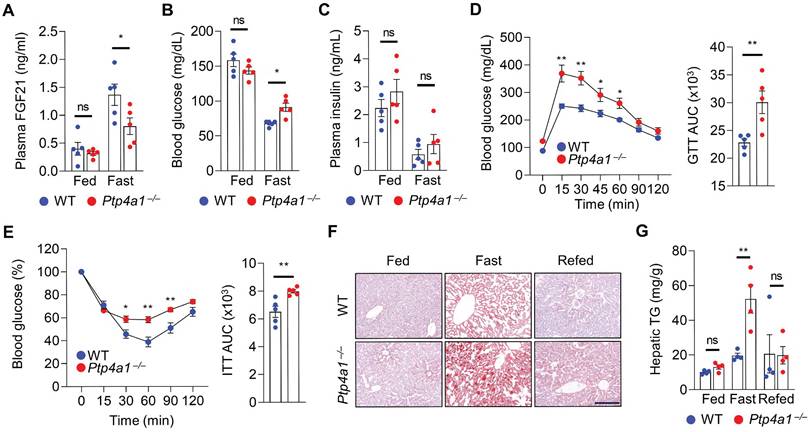
As FGF21 expression is induced by fasting, we investigated the levels of FGF21 in WT and Ptp4a1-/- mice after feeding and fasting. The plasma FGF21 levels were comparable between two groups fed an NC diet; however, those were significantly mitigated in Ptp4a1-/- mice after fasting compared to WT mice (Figure 4A). The blood glucose levels were higher in Ptp4a1-/- mice than WT mice after fasting but not fed an NC diet (Figure 4B). However, plasma insulin levels of the two groups were comparable (Figure 4C). After fasting, Ptp4a1-/- mice revealed impaired glucose tolerance and insulin sensitivity by GTT and ITT, respectively (Figure 4D-E). Consistently, the levels of hepatic TG were significantly augmented in Ptp4a1-/- mice compared to WT mice by fasting; however, those were comparable between the two groups after feeding and refeeding an NC diet (Figure 4F-G). During feeding an NC diet from 8 to 22 weeks old, the BW of WT and Ptp4a1-/- mice were comparable, and the ratios of eWAT/BW and liver/BW were not different (Figure S6A-C).
Lacking PTP4A1 in mice increases blood glucose and NAFLD by the down-regulation of FGF21 expression in fasting conditions. (A) Plasma FGF21 levels in wild-type (WT) and Ptp4a1-/- mice on a normal chow (NC) diet in feeding and fasting conditions (n = 5). (B and C) The blood glucose levels (B) and plasma insulin levels (C) in WT and Ptp4a1-/- mice on an NC diet in feeding and fasting conditions (n = 5). (D) Glucose tolerance test (GTT) and the area under the curve (AUC) of GTT in WT and Ptp4a1-/- mice fed an NC diet (n = 5). (E) Insulin tolerance test (ITT) and the AUC of ITT in WT and Ptp4a1-/- mice fed an NC diet (n = 5). (F) The representative images for oil red O staining in the liver sections of WT and Ptp4a1-/- mice fed an NC diet in feeding, fasting, and refeeding conditions (n = 4). Scale bar, 200 μm. (G) Hepatic triglyceride (TG) of WT and Ptp4a1-/- mice fed an NC diet in feeding, fasting, and refeeding conditions (n = 4). Data are presented as the mean ± standard error of the mean. *P < 0.05, **P < 0.01, n.s., not significant (two-way ANOVA for A-C, D (left), E (left) and G; Mann-Whitney U test for D (right) and E (right)).
Liver-specific PTP4A1 or systemic FGF21 overexpression ameliorates hyperglycemia and NAFLD in Ptp4a1-/- mice fed an HF diet
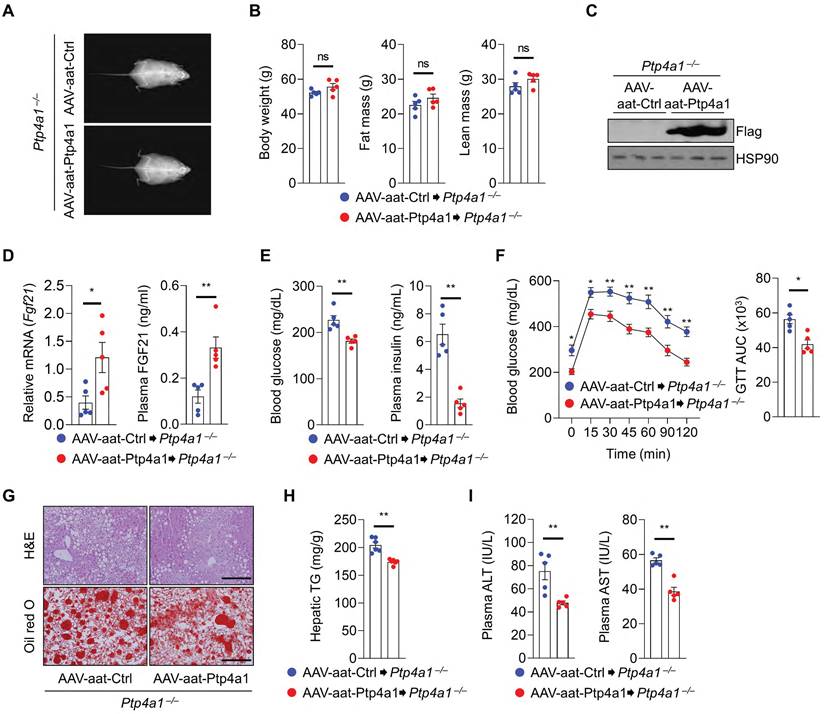
To evaluate the role of PTP4A1 in the liver tissue, Ptp4a1-/- mice were administrated with adeno-associated virus (AAV)-aat-control (Ctrl) or AAV-aat-Ptp4a1 under the control of the liver-specific promoter alpha-1-antitrypsin (aat) and were fed an HF diet for 12 weeks (Figure S7A). The liver-specific expression of PTP4A1 in mice injected by AAV-aat-Ptp4a1 was validated by western blot analysis for Flag-tag (Figure S7B). After an HF diet for 12 weeks, Ptp4a1-/- mice injected AAV-aat-Ctrl and AAV-aat-Ptp4a1 showed similar BW, fat mass, and lean mass (Figure 5A-B). PTP4A1 in the liver of Ptp4a1-/- mice injected with AAV-aat-Ptp4a1 was highly expressed (Figure 5C), and the mRNA levels of hepatic Fgf21 and plasma FGF21 levels were increased (Figure 5D). AAV-aat-Ptp4a1 administration diminished blood glucose and plasma insulin levels compared to AAV-aat-Ctrl in Ptp4a1-/- mice fed an HF diet for 12 weeks (Figure 5E). The glucose tolerance was markedly improved, and the insulin sensitivity was slightly enhanced by administration of AAV-aat-Ptp4a1 in Ptp4a1-/- mice fed an HF diet (Figure 5F and S7C). By histological analyses, we verified that AAV-aat-Ptp4a1 significantly reduced lipid accumulation in the liver of Ptp4a1-/- mice fed an HF diet (Figure 5G-H). Finally, the decreased levels of ALT and AST in plasma of Ptp4a1-/- mice injected with AAV-aat-Ptp4a1 were identified compared to controls after feeding an HF diet for 12 weeks (Figure 5I).
Liver-specific PTP4A1 overexpression ameliorates hyperglycemia and NAFLD in Ptp4a1-/- mice fed a high-fat (HF) diet. (A and B) Representative images (A) and the graphs (B) for body weight, fat, and lean mass of Ptp4a1-/- mice administrated with adeno-associated virus (AAV)-aat-control (Ctrl) or AAV-aat-Ptp4a1 after feeding an HF diet for 12 weeks in dual-energy X-ray absorptiometry analysis (n = 5). (C) Immunoblot analysis in the liver lysates of Ptp4a1-/- mice administrated with AAV-aat-Ctrl or AAV-aat-Ptp4a1. HSP90 was used as a loading control. (D) The levels of Fgf21 mRNA in the liver and FGF21 in plasma of Ptp4a1-/- mice administrated with AAV-aat-Ctrl or AAV-aat-Ptp4a1 after feeding an HF diet (n = 5). (E) Blood glucose levels (left) and plasma insulin levels (right) in Ptp4a1-/- mice administrated with AAV-aat-Ctrl or AAV-aat-Ptp4a1 after feeding an HF diet (n = 5). (F) Glucose tolerance test (GTT) and the area under the curve (AUC) of GTT in Ptp4a1-/- mice administrated with AAV-aat-Ctrl or AAV-aat-Ptp4a1 after feeding an HF diet (n = 5). (G) The representative images for hematoxylin&eosin (H&E) staining and oil red O staining in the liver sections of Ptp4a1-/- mice administrated with AAV-aat-Ctrl or AAV-aat-Ptp4a1 after feeding an HF diet (n = 4). Scale bar, 200 μm. (H) Hepatic triglyceride (TG) levels in Ptp4a1-/- mice administrated with AAV-aat-Ctrl or AAV-aat-Ptp4a1 after feeding an HF diet (n = 6). (I) The levels of alanine aminotransferase (ALT) and aspartate transaminase (AST) in plasma of Ptp4a1-/- mice administrated with AAV-aat-Ctrl or AAV-aat-Ptp4a1 after feeding an HF diet (n = 5). Data are presented as the mean ± standard error of the mean. *P < 0.05, **P < 0.01, n.s., not significant (Mann-Whitney U test for B, D (right), E, F (right), H, and I; two‐tailed Student's t‐test for D (left); two-way ANOVA for F (left)).
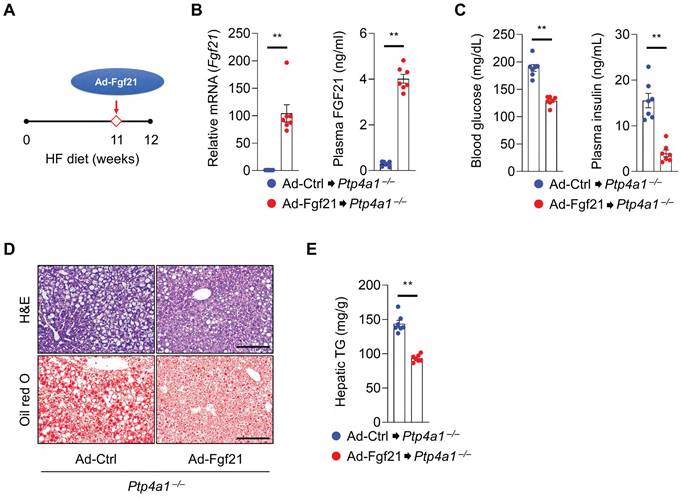
Next, we tested whether FGF21 overexpression in Ptp4a1-/- mice could ameliorate an HF diet-induced hyperglycemia and NAFLD. Ptp4a1-/- mice fed an HF diet for 11 weeks were administrated with adenovirus (Ad)-Ctrl or Ad-Fgf21 through the tail vein and kept both groups on an HF diet for an additional one week (Figure 6A). The levels of hepatic Fgf21 mRNA and plasma FGF21 were markedly increased in the Ad-Fgf21 group compared to the Ad-Ctrl group (Figure 6B). Overexpression of FGF21 reduced blood glucose levels and plasma insulin levels in Ptp4a1-/- mice fed an HF diet (Figure 6C). In addition, Ad-Fgf21 administration decreased the accumulation of lipids in the liver (Figure 6D-E).
FGF21 overexpression in Ptp4a1-/- mice decreases a high-fat (HF) diet-induced hyperglycemia and NAFLD. (A) The experimental design for administering adenovirus on HF diet-fed Ptp4a1-/- mice. (B) The levels of Fgf21 mRNA in the liver and FGF21 in plasma of Ptp4a1-/- mice administrated with Ad-Ctrl or Ad-Fgf21 after feeding an HF diet (n = 7). (C) Blood glucose levels (left) and plasma insulin levels (right) in Ptp4a1-/- mice administrated with Ad-Ctrl or Ad-Fgf21 after feeding an HF diet (n = 7). (D) The representative images for hematoxylin&eosin (H&E) staining and oil red O staining in the liver sections of Ptp4a1-/- mice administrated with Ad-Ctrl or Ad-Fgf21 after feeding an HF diet (n = 7). Scale bar, 200 μm. (E) Hepatic triglyceride (TG) levels in Ptp4a1-/- mice administrated with Ad-Ctrl or Ad-Fgf21 after feeding an HF diet (n = 7). Data are presented as the mean ± standard error of the mean. **P < 0.01 (two‐tailed Student's t‐test for B (left); Mann-Whitney U test for B (right), C, and E).
AAV-aat-Ptp4a1 delivery ameliorates HF diet-induced hyperglycemia and NAFLD in WT mice
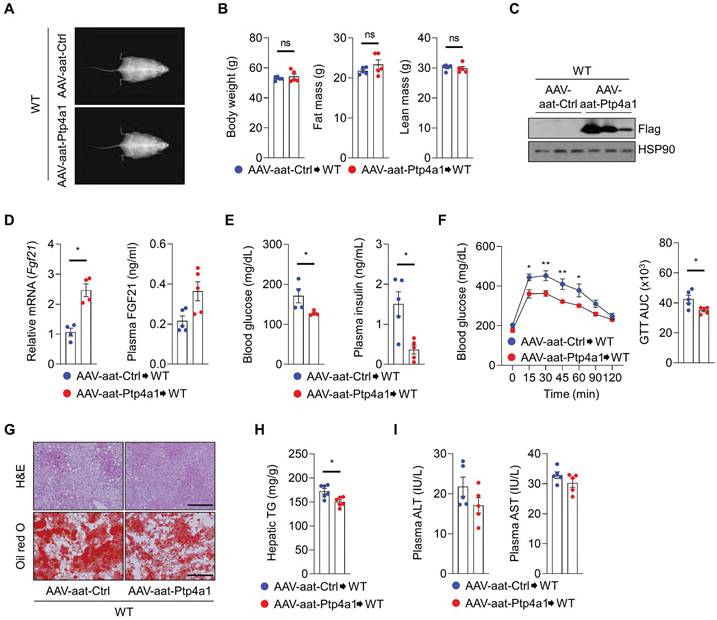
Next, we investigated whether hepatic PTP4A1 overexpression by AAV-aat-Ptp4a1 could reveal metabolic benefits, including improved glucose homeostasis and NAFLD in WT mice fed an HF diet. After an HF diet for 12 weeks, DEXA analysis revealed that WT mice injected with AAV-aat-Ctrl and AAV-aat-Ptp4a1 showed similar BW, fat mass, and lean mass (Figure 7A-B). AAV-aat-Ptp4a1 administration highly expressed Flag-PTP4A1 in the liver tissue in WT mice fed an HF diet for 12 weeks (Figure 7C). Hepatic PTP4A1 overexpression increased mRNA levels of hepatic Fgf21 and plasma FGF21 (Figure 7D). AAV-aat-Ptp4a1 administration diminished blood glucose and plasma insulin levels compared to AAV-aat-Ctrl in WT mice after feeding an HF diet for 12 weeks (Figure 7E). Improved glucose tolerance was identified in AAV-aat-Ptp4a1 injected WT mice compared to AAV-aat-Ctrl injected mice; however, the insulin sensitivity was comparable between the two groups (Figure 7F and S8). AAV-aat-Ptp4a1 significantly reduced lipid accumulation in the liver of WT mice fed an HF diet without the difference in the levels of plasma ALT and AST (Figure 7G-I).
Liver-specific PTP4A1 overexpression reduces hyperglycemia and NAFLD after feeding a high-fat (HF) diet in wild-type (WT) mice. (A and B) Representative images (A) and the graphs (B) for body weight, fat, and lean mass of WT mice administrated with adeno-associated virus (AAV)-aat-control (Ctrl) or AAV-aat-Ptp4a1 after feeding an HF diet for 12 weeks in dual-energy X-ray absorptiometry analysis (n = 5). (C) Immunoblot analysis in the liver lysates of WT mice administrated with AAV-aat-Ctrl or AAV-aat-Ptp4a1. HSP90 was used as a loading control. (D) The levels of Fgf21 mRNA in the liver (n = 4) and FGF21 in plasma (n = 5) of WT mice administrated with AAV-aat-Ctrl or AAV-aat-Ptp4a1 after feeding an HF diet. (E) Blood glucose levels (left, n = 4) and plasma insulin levels (right, n = 5) in WT mice administrated with AAV-aat-Ctrl or AAV-aat-Ptp4a1 after feeding an HF diet. (F) Glucose tolerance test (GTT) and the area under the curve (AUC) of GTT in WT mice administrated with AAV-aat-Ctrl or AAV-aat-Ptp4a1 after feeding an HF diet (n = 5). (G) The representative images for hematoxylin&eosin (H&E) staining and oil red O staining in the liver sections of WT mice administrated with AAV-aat-Ctrl or AAV-aat-Ptp4a1 after feeding an HF diet (n = 4). Scale bar, 200 μm. (H) Hepatic triglyceride (TG) levels in WT mice administrated with AAV-aat-Ctrl or AAV-aat-Ptp4a1 after feeding an HF diet (n = 6). (I) The levels of alanine aminotransferase (ALT) and aspartate transaminase (AST) in plasma of WT mice administrated with AAV-aat-Ctrl or AAV-aat-Ptp4a1 after feeding an HF diet (n = 5). Data are presented as the mean ± standard error of the mean. *P < 0.05, n.s., not significant (Mann-Whitney U test for B, D (right), E, F (right), H, and I; two‐tailed Student's t‐test for D (left); two-way ANOVA for F (left)).
Discussion
NAFLD is, to date, the most common chronic liver disease leading to a significant health problem worldwide, which affects up to 30% of adults in the general population and 70% of patients with type 2 diabetes [30, 31]. Despite understanding the epidemiology and the pathogenic mechanisms in the progress of NAFLD, there are no approved pharmacological therapies for NAFLD [32], providing the need for a novel therapeutic target for the treatment of NAFLD. In the present study, we provided PTP4A1 as a novel regulator in the pathogenesis of NAFLD. PTP4A1 ameliorated hepatosteatosis through the activation of the transcription factor CREBH/FGF21 axis. Liver-specific PTP4A1 expression, followed by augmentation of FGF21 levels, reduced HF diet-induced hepatosteatosis and hyperglycemia in WT mice. Thus, controlling PTP4A1 may be a potential candidate for therapeutic strategy against hepatosteatosis-related diseases.
Protein tyrosine kinases and phosphatases control the phosphorylation of tyrosine residues within proteins that regulate physiological signaling cascades in cells [33]. Disruption of the regulation of protein phosphorylation is closely associated with various diseases, including cancers, autoimmune diseases, cardiovascular diseases, and metabolic diseases [34, 35]. Recently, protein tyrosine phosphatase 1B (PTP1B), a classical non-transmembrane tyrosine phosphatase, is emerging as a critical regulator in type 2 diabetes, obesity, and liver diseases, suggesting a promising therapeutic target in metabolic disorders [36]. PTP1B-null mice resisted Fas-induced extensive hepatocyte apoptosis and promoted hepatocyte proliferation in response to liver damage [36]. Thus, PTP1B deficiency in mice revealed a rapid and synchronized compensatory liver regeneration after partial hepatectomy [37]. In contrast, PTP4A1 is significantly induced during liver regeneration and is required for proper timing of liver regeneration after partial hepatectomy with modulating expression of cell cycle regulators [10]. PTP4A1 constitutes a unique subfamily of protein tyrosine phosphatases and plays a pivotal role during cell development and tissue regeneration [33]. Interestingly, both PTP1B and PTP4A1 localized to the endoplasmic reticulum (ER) in non-mitotic cells [38]. Based on the opposite phenotype and co-localization in the subcellular compartment between PTP1B and PTP4A1, the beneficial potential of PTP4A1 in metabolic disorders such as NAFLD might be considerable. It may be necessary to test whether PTP4A1 could antagonize PTP1B in various cellular responses.
A previous report verified that PTP4A1 physically interacted with the ATF5/7 containing a basic helix-loop-helix leucine zipper (bZIP) domain [8]. In the current study, we proved that PTP4A1 physically interacted with CREBH, a transcription factor containing the bZIP domain, and enhanced the transcriptional activity of CREBH on the Fgf21 gene. PTP4A1, but not in mutant PTP4A1, synergistically increased CREBH-mediated luciferase activity in an FGF21-luciferase reporter assay. A previous report revealed that proteolytic cleavage of CREBH was modulated by glycogen synthase kinase 3β-mediated phosphorylation [39]. As PTP4A1 is localized in ER, plasma membrane, and nucleus, PTP4A1 may enhance both the transcriptional activity of CREBH in the nucleus and proteolytic cleavage of CREBH in ER. Indeed, we verified the synergistic effects in CREBH(N) or CREBH(F) (data not shown) with PTP4A1 in the FGF21 luciferase assay and confirmed interaction in CREBH(N) or CREBH(F) with PTP4A1. Consistent with a previous report [40], a decreased CREBH activity in Ptp4a1-/- mice may result in the down-regulation of fatty acid oxidation-related gene expressions, including Pparα and Cpt1a. In a future study, the identification of the PTP4A1-mediated dephosphorylation site of CREBH would be evaluated to understand detailed mechanisms.
FGF21 is an inducible metabolic hormone by fasting or stress, produced mainly in the liver, and regulates glucose and lipid homeostasis via a heterodimeric receptor complex, FGF receptor 1 and β-klotho [41]. FGF21 derivatives or FGF21 receptor agonists have been tried as therapeutic agents for various metabolic diseases, including type 2 diabetes, obesity, and NAFLD, for the past decade [21]. However, the limitations of FGF21 as a clinically valuable medicine include its poor pharmacokinetics and biophysical properties [41]. The current study provided an option to adopt FGF21 therapy in metabolic diseases. Although the oncogenic property of PTP4A1 overexpression and the restricted beneficial effects of PTP4A1-mediated FGF21 remain a hurdle to developing a therapeutic target, PTP4A1-mediated CREBH activation might be considered one of the strategies to elevate FGF21 levels in metabolic disorders, including NAFLD.
In the current study, we identified that Ptp4a1-/- mice fed an HF diet revealed hyperglycemia and fatty liver compared to controls. In GTT and ITT analysis, Ptp4a1-/- mice fed an HF diet showed impaired glucose tolerance and insulin sensitivity. However, hepatic glucose output in the clamp study and glucose productions in the pyruvate and glycerol tolerance test were similar between WT and Ptp4a1-/- mice after feeding an HF diet. The mRNA levels of gluconeogenic genes were not different between the two groups. In addition, glucose uptakes by skeletal muscle and eWAT in the 2-DG uptake assay were similar between the two groups. The levels of phosphorylated Akt in the liver, skeletal muscle, and eWAT were comparable between the two groups (data not shown). Therefore, we could not conclude that PTP4A1 depletion in mice fed an HF diet develops insulin resistance. Instead of insulin resistance, we guessed that PTP4A1 deficiency in mice induced fat accumulation in the liver by feeding an HF diet or fasting, followed by decreased GLUT2 translocation on the hepatocyte surface, leading to hyperglycemia.
Previous reports have shown an HF diet-induced GLUT2 internalization in rat and mouse hepatocytes [16, 42]. Also, hepatic GLUT2 location is regulated by feeding states; GLUT2 levels with the insulin receptor in plasma membrane fractions from rat livers are down-regulated after feeding [43]. In the current study, we also verified that increased fat accumulation in hepatocytes reduced the levels of GLUT2 on the plasma membrane. Primary hepatocytes from Ptp4a1-/- mice revealed significant differences in fat accumulation and surface GLUT2 levels compared to WT controls. Although increased fat content is inversely correlated with surface GLUT2 levels in hepatocytes, the detailed mechanism of down-regulating the GLUT2 levels on the plasma membrane of hepatocytes by PTP4A1 deficiency will be clarified in a further study.
In summary, our results establish hepatic PTP4A1-mediated activation of the CREBH/FGF21 axis as a novel therapeutic strategy in NAFLD and hyperglycemia. Lacking PTP4A1 in mice fed an HF diet exhibited hepatosteatosis and hyperglycemia, which were recovered by liver-specific PTP4A1 or systemic FGF21 overexpression. Finally, we proved that liver-specific PTP4A1 expression ameliorated HF diet-induced hepatosteatosis and hyperglycemia in WT mice. Therefore, modulating hepatic PTP4A1 may be a potential therapeutic target against hepatosteatosis-related diseases.
Materials and Methods
Animal experiments
This study followed the Guidelines on the Care Use of Laboratory Animals (National Institutes of Health Publication no. 85-23, revised 1996). Animal study protocols were approved by the Institutional Animal Care and Committee of the Korea Research Institute of Bioscience and Biotechnology (KRIBB-AEC-18203). Ptp4a1-/- mice were generated using the CRISPR/Cas9 system and backcrossed onto a C57BL/6 background. The primers used for Ptp4a1 genotyping were as follows: forward 5'-TCCGCAGGCTGCCTCCTCTC-3' and reverse 5'-CAGAACAGTAGCAACAAAAT-3'. Mice were kept in a controlled environment with a 12-hour light/dark cycle in a specific pathogen-free facility and fed an NC diet and water for the study. To investigate the effects of PTP4A1 on hepatic steatosis, 8-week-old male mice were given an HF diet (60% calories from fat; D12492, Research DIET) for 12 weeks. Mouse body composition was identified using DEXA (Lunar, GE Lunar Corp.). Body fat and the bone area were demonstrated with a DEXA scan using a dedicated densitometer. After the study, animals were anesthetized using isoflurane inhalation (3%) plus 1 L/min O2 and euthanized by exsanguination.
Measurement of metabolites
Plasma insulin was measured using a mouse insulin enzyme-linked immunosorbent assay (ELISA) kit (Crystal Chem). Plasma AST and ALT were analyzed using a colorimetric assay kit (BioVision). Plasma FGF-21 was measured using a mouse/rat FGF-21 ELISA kit (R&D systems), and hepatic glucose was determined using a glucose assay kit (Sigma). Hepatic TG was measured by Triglyceride Determination Kit (Sigma). 2-DG uptake of mice was analyzed using a 2-DG uptake measurement kit (Cosmo Bio Co.). Blood glucose levels were determined from tail vein blood using an Accu-Check Active blood glucose meter (Roche).
Tolerance test
Mice were starved for 16 hours and then given an intraperitoneal injection with glucose (1 g/kg BW on HF diet, 2 g/kg BW on NC diet, Sigma), pyruvate (1 g/kg BW on HF diet, 1.5 g/kg BW on NC diet, Sigma), or glycerol (1 g/kg BW on HF diet, 2 g/kg BW on NC diet, Sigma). Mice were starved for six hours and then injected intraperitoneally with mouse insulin (1 unit/kg BW on HF and NC diet, Sigma). Blood glucose levels were measured from tail vein blood collected at the designated times.
Virus
Liver-specific adeno-associated virus (AAV8.2‐hAAT‐mFlagPTP4A1‐pA) was purchased from Sirion (Martinsried, Germany). For PTP4A1 overexpression in the liver, mice were injected with a concentration of 2.0×10¹¹ vg AAV per mouse through the tail vein. PTP4A1 expression levels were determined by immunoblot analysis.
Recombinant adenoviruses expressing FGF21 or PTP4A1 were generated using the AdEasy adenoviral vector system described previously [44]. Recombinant adenoviruses were expanded in HEK 293AD cells and purified using an Adeno-X Maxi Purification kit (631533, Clontech). For animal experiments, mice were injected with recombinant adenovirus (1×10⁸ plaque-forming unit per mouse) intravenously through the tail vein. Adenovirus-mediated gene expressions were analyzed by quantitative real time polymerase chain reaction (qRT-PCR) and ELISA.
The lentiviral vector of shPTP4A1 (NM_003463.3-1388s21c1) was purchased from Sigma-Aldrich. Overexpression of PTP4A1 in Hep3B was achieved by lentivirus produced in the pLVX-EF1α-IRES-Puro lentiviral vector (Clontech). Lentivirus-infected cells were selected by puromycin (#P-1033; AG Scientific), and the expression of PTP4A1 was identified by qRT-PCR.
Primary hepatocytes isolation and cell culture
Primary hepatocytes were prepared from male mice at 8-10 weeks. Livers were perfused with prewarmed liver perfusion medium (17701-038, Life Technologies) followed by liver digest medium (17703-034, Life Technologies). Isolated hepatocytes (5 × 10⁵ cells/well) were placed on Primaria 6-well plates (353846, Corning) and cultured in medium 199 (10-060-CV, Sigma) supplemented with 10% fetal bovine serum (16000-044, Gibco), 20 nM insulin (I6634, Sigma), and 100 nM dexamethasone (D4902, Sigma) under 95% humidified air and 5% CO2. Hep3B and HEK293T cells were grown in DMEM (SH30243.01, HyClone) supplemented with 10% FBS at 37 °C under 95% humidified air and 5% CO2.
Luciferase reporter gene assay
Hep3B cells were seeded in 48-well plates (4 × 10⁴ cells/well) using DMEM and 10% FBS. Cells were transfected with 50 ng of luciferase reporter, 100 ng of effector, and 5 ng of pRL-TK (Renilla TK) plasmids using 0.5 μl of the transfection reagent Lipofectamine 2000 (Invitrogen). Cells were lysed and moved into 96-well plates 48 hours later for luciferase assays using the Dual-Luciferase Reporter Assay kit (E1960, Promega). Luciferase activity was measured on a fluorescence spectrophotometer (GloMax 96, Promega), and relative transcriptional activity was normalized by the Renilla activity.
Hyperinsulinemic-euglycemic clamping
Hyperinsulinemic-euglycemic clamping was executed as previously described [45]. Briefly, Ptp4a1-/- mice and WT were fed an HF diet, and then a hyperinsulinemic-euglycemic clamp was subjected. After an overnight fast, basal glucose levels were preserved by 20% glucose infused at different rates. Plasma glucose levels were consistently measured every 20 minutes. The insulin clamp was initiated with a primed-continuous infusion of 0.5 U/ml insulin. Basal and insulin-stimulated whole-body glucose uptake was measured through a consecutive input of 3H-glucose (NET-331C-2, PerkinElmer) for two hours before clamping (0.05 μCi/min) and during clamping (0.1 μCi/min), respectively. 2-deoxy-D-1-14C glucose (NEC-495-1, PerkinElmer) was infused to measure insulin-stimulated glucose uptake 75 minutes later. Plasma samples were dissolved in ZnSO4 (83265, Sigma) and Ba(OH)2 (B4059, Sigma), dried, resuspended in water, and detected with 3H-glucose and 2-deoxy-D-1-14C concentrations in scintillation fluid.
Histology and Immunohistochemistry
Liver pieces were fixed in 10% (v/v) phosphate-buffered formalin solution overnight at room temperature and then placed in 30% sucrose overnight at 4 °C. The fixed tissues were embedded in paraffin or OCT (3801480, Leica) and sectioned. H&E staining was applied to frozen and paraffin-embedded tissue sections. Oil-red O staining was used on frozen tissue sections. After staining, images were captured under a light microscope (BX53F2, Olympus Corp).
For immunostaining, liver sections were permeabilized with 0.05% (v/v) Triton X-100, blocked with 10% (v/v) chicken serum and 1% (w/v) BSA, and incubated with anti-CD45 (ab10558, Abcam) or anti-GLUT2 (ab54460, Abcam) antibody with 1% (w/v) BSA in TBS for overnight at 4 °C. Slides were visualized using biotinylated secondary antibodies with a 3,3′-diaminobenzidine substrate (PK-6100, Vector Laboratories). Nuclei were stained with hematoxylin. Immuno-staining images were captured using fluorescent and light microscopes (BX53F2, Olympus Corp).
Immunoprecipitation and Western blotting
Mouse tissues and cells were harvested and dissolved in RIPA buffer (50 mM Tris-HCl, 150 mM NaCl, 1 mM EDTA, 0.5% sodium deoxycholate, 1% Triton-X-100, 0.5% NP-40, pH 7.6) or NP-40 buffer (50 mM Tris-HCl, 150 mM NaCl, 1% NP-40, pH 7.4) containing protease and phosphatase inhibitor cocktail (GenDEPOT, Huston). Immunoprecipitation was performed with anti-Flag (F1804, Sigma) antibody overnight at 4 °C, followed by addition to protein G-Sepharose beads (Upstate Biotechnology) for two hours at 4 °C. Liver nuclear extracts were prepared as described previously [27]. Protein lysates were performed to Western blotting with the following primary antibodies [rat anti-HA (3F10, Roche), rabbit anti-GLUT2 (ab54460, Abcam), rabbit anti-β-actin (AbC-2004, Abclon), mouse anti-FLAG (F1804, Sigma), mouse anti-HSP90α/β (sc-13119, Santacruz), rabbit anti-CREBH (EWS101, Kerafast), mouse anti-Lamin B1 (sc-377001, Santacruz), goat anti-PTP4A1(EB06456, Everest), and rabbit anti-GSK3 β (#12456, Cell Signaling Technology)]. The membranes were incubated with primary antibodies followed by the horseradish peroxidase-conjugated secondary antibodies (rat: 31470, rabbit: 31464, Thermo Fischer Scientific; mouse: AbC-5001, AbClon) for one hour at room temperature. Immuno-reactive bands were visualized using a chemiluminescent substrate (RPN2106, GE).
RNA isolation and qRT-PCR
Total RNA was isolated using TRIZOL Reagents (15596026, Life Technologies) according to the manufacturer's recommendation. Complementary DNA was synthesized from target RNA using the M-MLV Reverse Transcriptase kit (N1705, C1101, N2515, U1518; Promega). The qRT-PCR was performed using the quantiMix SYBR kit (QS105; PKT Co.). The mRNA expression levels were normalized using human GAPDH or mouse 18s expression. The qRT-PCR primers are listed in Supplementary Table 1.
Flow cytometry
Isolated primary hepatocytes were blocked with rat IgG antibody (1 μg/ml, MAB005, R&D systems) in phosphate buffered saline (PBS) containing 1% (w/v) BSA for 15 minutes at room temperature. Next, cells were washed three times and incubated with the rat anti-GLUT2-allophycocyanin (APC) antibody (1 μg/ml, FAB1440A, R&D systems), mouse anti-asialoglycoprotein receptor 1 (ASGR1) (1 μg/ml, AF2755, R&D systems) with Alexa Flour 488 conjugated anti-mouse IgG antibody in PBS containing 1% (w/v) BSA. For lipids staining or glucose uptake assay, primary hepatocytes and Hep3B were incubated with BODIPY (20 μM, D-3922, Invitrogen) or 2-NBDG (500 μM, N13195, Invitrogen), respectively. After incubation, cells were washed three times and promptly analyzed on a FACSCalibur (BD Immunocytometry System).
Chromatin immunoprecipitation (ChIP) assay
Hep3B cells (1 × 10⁷) were processed using the EZ-ChipTM Kit (17-371; Millipore, Darmstadt, Germany) according to the manufacturer's instructions. Briefly, genomic DNA was crosslinked with 1% formaldehyde and fragmented into 500 ± 100 bp fragments by sonicating for 10 seconds with 5 μm/wave ten times. Soluble chromatin was incubated overnight with each antibody (HA antibody and human RNA polymerase II antibody). Immunoprecipitated DNA fragments were amplified and quantified by qRT-PCR using specific primers to the FGF21 gene promoter (CREBH binding region) and GAPDH gene promoter. The primers used for the FGF21 gene were forward 5'-CAGGCTGCCCTTGCCACGATG-3' and reverse 5'-ATACCCAGACAGGCCCGCCCA-3'. The primers used for the GAPDH gene were forward 5'-TACTAGCGGTTTTACGGGCG -3' and reverse 5'-TCGAACAGGAGGAGCAGAGAGCGA-3'.
Statistics
Data are expressed as the mean ± standard error of the mean. We subjected two‐tailed Student's t-tests, one-way ANOVA, two-way ANOVA, the Mann-Whitney U test, and linear regression analysis to test statistical significance where appropriate. Linear correction index R square and P value were calculated. Statistical tests are described in Figure Legends for each experiment. P values less than 0.05 were considered significant.
Abbreviations
AAT: alpha-1-antitrypsin; AAV: adeno-associated virus; Ad: adenovirus; ALT: alanine aminotransferase; ASGR1: asialoglycoprotein receptor 1; AST: aspartate transaminase; ATF5/7: activating transcription factor 5/7; BSA-OA: bovine serum albumin-oleic acid; BW: body weight; bZIP: basic helix-loop-helix leucine zipper; cluster of differentiation 45 (CD45); CREBH: cyclic adenosine monophosphate-responsive element-binding protein H; Ctrl: control; DEXA: dual-energy X-ray absorptiometry; 2-DG: 2-deoxyglucose; ELISA: enzyme-linked immunosorbent assay; ER: endoplasmic reticulum; eWAT: epididymal white adipose tissue; FGF21: fibroblast growth factor 21; GLUT2: glucose transporter 2; GlyTT: glycerol tolerance test; GTT: glucose tolerance test; H&E: hematoxylin and eosin; HEK293T: human embryonic kidney 293T; HF: high-fat; HGP: hepatic glucose production; HOMA-IR: homeostatic model assessment-insulin resistance; ITT: insulin tolerance test; NAFLD: non-alcoholic fatty liver disease; 2-NBDG: 2-(N-(7-Nitrobenz-2-oxa-1,3-diazol-4-yl)Amino)-2-Deoxyglucose; NC: normal chow; PBS: phosphate buffered saline; PKB: protein kinase B; PPARα: peroxisome proliferator-activated receptor α; PTP1B: protein tyrosine phosphatase 1B; PTP4A1: protein tyrosine phosphatase type IVA 1; PRL-1: phosphatase of regenerating liver-1; PTT: pyruvate tolerance test; qRT-PCR: quantitative real time polymerase chain reaction; shRNA: short hairpin RNA; TG: triglyceride; USF1: upstream stimulatory factor 1; WT: wild-type.
Supplementary Material
Supplementary figures and table.
Acknowledgements
We thank Prof. Seung-Hoi Koo from Korea University for kindly donating the adenoviral vector for FGF21. This study was supported by the Korea Research Institute of Bioscience and Biotechnology (KRIBB) Research Initiative Program (KGM5272221), by Basic Science Research Program through the National Research Foundation of Korea (NRF) funded by the Ministry of Education (NRF-2021R1I1A2056805), by the National Research Foundation of Korea (NRF) grant funded by the Korea government (MSIT)(NRF-2018R1C1B6005004), and by the Bio-Synergy Research Project (NRF-2015M3A9C4070489) of the Ministry of Science, ICT, and Future Planning through the National Research Foundation.
Author Contributions
B.H. and M.-G.K. designed the study, performed experiments, analyzed the data, prepared the figures, and wrote the manuscript. M.J.C., N.-K.L., J.L., K.-J.O., K.-H.B., and J.H.H. helped to conduct experiments. J.W.L. generated gene-targeted mice. J.-K.M. and J.-G.P. provided general supervision, designed the study, supported the experiments, and assisted with the critical discussion, preparation, and submission of the manuscript.
Competing Interests
The authors have declared that no competing interest exists.
References
1. Diamond RH, Cressman DE, Laz TM, Abrams CS, Taub R. PRL-1, a unique nuclear protein tyrosine phosphatase, affects cell growth. Mol Cell Biol. 1994;14:3752-62
2. Diamond RH, Peters C, Jung SP, Greenbaum LE, Haber BA, Silberg DG. et al. Expression of PRL-1 nuclear PTPase is associated with proliferation in liver but with differentiation in intestine. Am J Physiol. 1996;271:G121-9
3. Bai Y, Zhou HM, Zhang L, Dong Y, Zeng Q, Shou W. et al. Role of phosphatase of regenerating liver 1 (PRL1) in spermatogenesis. Sci Rep. 2016;6:34211
4. Rios P, Li X, Kohn M. Molecular mechanisms of the PRL phosphatases. FEBS J. 2013;280:505-24
5. Sun JP, Luo Y, Yu X, Wang WQ, Zhou B, Liang F. et al. Phosphatase activity, trimerization, and the C-terminal polybasic region are all required for PRL1-mediated cell growth and migration. J Biol Chem. 2007;282:29043-51
6. Bai Y, Luo Y, Liu S, Zhang L, Shen K, Dong Y. et al. PRL-1 protein promotes ERK1/2 and RhoA protein activation through a non-canonical interaction with the Src homology 3 domain of p115 Rho GTPase-activating protein. J Biol Chem. 2011;286:42316-24
7. Jeong DG, Kim SJ, Kim JH, Son JH, Park MR, Lim SM. et al. Trimeric structure of PRL-1 phosphatase reveals an active enzyme conformation and regulation mechanisms. J Mol Biol. 2005;345:401-13
8. Peters CS, Liang X, Li S, Kannan S, Peng Y, Taub R. et al. ATF-7, a novel bZIP protein, interacts with the PRL-1 protein-tyrosine phosphatase. J Biol Chem. 2001;276:13718-26
9. Peng Y, Du K, Ramirez S, Diamond RH, Taub R. Mitogenic up-regulation of the PRL-1 protein-tyrosine phosphatase gene by Egr-1. Egr-1 activation is an early event in liver regeneration. J Biol Chem. 1999;274:4513-20
10. Jiao Y, Ye DZ, Li Z, Teta-Bissett M, Peng Y, Taub R. et al. Protein tyrosine phosphatase of liver regeneration-1 is required for normal timing of cell cycle progression during liver regeneration. Am J Physiol Gastrointest Liver Physiol. 2015;308:G85-91
11. Cohen JC, Horton JD, Hobbs HH. Human fatty liver disease: old questions and new insights. Science. 2011;332:1519-23
12. Browning JD, Horton JD. Molecular mediators of hepatic steatosis and liver injury. J Clin Invest. 2004;114:147-52
13. Marjot T, Moolla A, Cobbold JF, Hodson L, Tomlinson JW. Nonalcoholic Fatty Liver Disease in Adults: Current Concepts in Etiology, Outcomes, and Management. Endocr Rev. 2020 41
14. Chalasani N, Younossi Z, Lavine JE, Diehl AM, Brunt EM, Cusi K. et al. The diagnosis and management of non-alcoholic fatty liver disease: practice Guideline by the American Association for the Study of Liver Diseases, American College of Gastroenterology, and the American Gastroenterological Association. Hepatology. 2012;55:2005-23
15. Radziuk J, Pye S. Hepatic glucose uptake, gluconeogenesis and the regulation of glycogen synthesis. Diabetes Metab Res Rev. 2001;17:250-72
16. Guo JW, Liu X, Zhang TT, Lin XC, Hong Y, Yu J. et al. Hepatocyte TMEM16A Deletion Retards NAFLD Progression by Ameliorating Hepatic Glucose Metabolic Disorder. Adv Sci (Weinh). 2020;7:1903657
17. Jwa H, Choi Y, Park UH, Um SJ, Yoon SK, Park T. Piperine, an LXRalpha antagonist, protects against hepatic steatosis and improves insulin signaling in mice fed a high-fat diet. Biochem Pharmacol. 2012;84:1501-10
18. Seyer P, Vallois D, Poitry-Yamate C, Schutz F, Metref S, Tarussio D. et al. Hepatic glucose sensing is required to preserve beta cell glucose competence. J Clin Invest. 2013;123:1662-76
19. Qin S, Wang S, Wang X, Wang J. Non-alcoholic fatty liver disease and the risk of urolithiasis: A systematic review and meta-analysis. Medicine (Baltimore). 2018;97:e12092
20. Friedman SL, Neuschwander-Tetri BA, Rinella M, Sanyal AJ. Mechanisms of NAFLD development and therapeutic strategies. Nat Med. 2018;24:908-22
21. Tillman EJ, Rolph T. FGF21: An Emerging Therapeutic Target for Non-Alcoholic Steatohepatitis and Related Metabolic Diseases. Front Endocrinol (Lausanne). 2020;11:601290
22. Caligiuri A, Gentilini A, Marra F. Molecular Pathogenesis of NASH. Int J Mol Sci. 2016 17
23. Keinicke H, Sun G, Mentzel CMJ, Fredholm M, John LM, Andersen B. et al. FGF21 regulates hepatic metabolic pathways to improve steatosis and inflammation. Endocr Connect. 2020;9:755-68
24. Xu J, Lloyd DJ, Hale C, Stanislaus S, Chen M, Sivits G. et al. Fibroblast growth factor 21 reverses hepatic steatosis, increases energy expenditure, and improves insulin sensitivity in diet-induced obese mice. Diabetes. 2009;58:250-9
25. Bao L, Yin J, Gao W, Wang Q, Yao W, Gao X. A long-acting FGF21 alleviates hepatic steatosis and inflammation in a mouse model of non-alcoholic steatohepatitis partly through an FGF21-adiponectin-IL17A pathway. Br J Pharmacol. 2018;175:3379-93
26. Coskun T, Bina HA, Schneider MA, Dunbar JD, Hu CC, Chen Y. et al. Fibroblast growth factor 21 corrects obesity in mice. Endocrinology. 2008;149:6018-27
27. Park JG, Xu X, Cho S, Hur KY, Lee MS, Kersten S. et al. CREBH-FGF21 axis improves hepatic steatosis by suppressing adipose tissue lipolysis. Sci Rep. 2016;6:27938
28. Fon Tacer K, Bookout AL, Ding X, Kurosu H, John GB, Wang L. et al. Research resource: Comprehensive expression atlas of the fibroblast growth factor system in adult mouse. Mol Endocrinol. 2010;24:2050-64
29. Badman MK, Pissios P, Kennedy AR, Koukos G, Flier JS, Maratos-Flier E. Hepatic fibroblast growth factor 21 is regulated by PPARalpha and is a key mediator of hepatic lipid metabolism in ketotic states. Cell Metab. 2007;5:426-37
30. Younossi ZM, Golabi P, de Avila L, Paik JM, Srishord M, Fukui N. et al. The global epidemiology of NAFLD and NASH in patients with type 2 diabetes: A systematic review and meta-analysis. J Hepatol. 2019;71:793-801
31. Mantovani A, Scorletti E, Mosca A, Alisi A, Byrne CD, Targher G. Complications, morbidity and mortality of nonalcoholic fatty liver disease. Metabolism. 2020 111S: 154170
32. Mantovani A, Dalbeni A. Treatments for NAFLD: State of Art. Int J Mol Sci. 2021 22
33. Chiarugi P, Buricchi F. Protein tyrosine phosphorylation and reversible oxidation: two cross-talking posttranslation modifications. Antioxid Redox Signal. 2007;9:1-24
34. He RJ, Yu ZH, Zhang RY, Zhang ZY. Protein tyrosine phosphatases as potential therapeutic targets. Acta Pharmacol Sin. 2014;35:1227-46
35. Tonks NK. Protein tyrosine phosphatases: from genes, to function, to disease. Nat Rev Mol Cell Biol. 2006;7:833-46
36. Chen PJ, Cai SP, Huang C, Meng XM, Li J. Protein tyrosine phosphatase 1B (PTP1B): A key regulator and therapeutic target in liver diseases. Toxicology. 2015;337:10-20
37. Revuelta-Cervantes J, Mayoral R, Miranda S, Gonzalez-Rodriguez A, Fernandez M, Martin-Sanz P. et al. Protein Tyrosine Phosphatase 1B (PTP1B) deficiency accelerates hepatic regeneration in mice. Am J Pathol. 2011;178:1591-604
38. Wang J, Kirby CE, Herbst R. The tyrosine phosphatase PRL-1 localizes to the endoplasmic reticulum and the mitotic spindle and is required for normal mitosis. J Biol Chem. 2002;277:46659-68
39. Zheng Z, Kim H, Qiu Y, Chen X, Mendez R, Dandekar A. et al. CREBH Couples Circadian Clock With Hepatic Lipid Metabolism. Diabetes. 2016;65:3369-83
40. Nakagawa Y, Satoh A, Yabe S, Furusawa M, Tokushige N, Tezuka H. et al. Hepatic CREB3L3 controls whole-body energy homeostasis and improves obesity and diabetes. Endocrinology. 2014;155:4706-19
41. Geng L, Lam KSL, Xu A. The therapeutic potential of FGF21 in metabolic diseases: from bench to clinic. Nat Rev Endocrinol. 2020;16:654-67
42. Nathan JD, Zdankiewicz PD, Wang J, Spector SA, Aspelund G, Jena BP. et al. Impaired hepatocyte glucose transport protein (GLUT2) internalization in chronic pancreatitis. Pancreas. 2001;22:172-8
43. Eisenberg ML, Maker AV, Slezak LA, Nathan JD, Sritharan KC, Jena BP. et al. Insulin receptor (IR) and glucose transporter 2 (GLUT2) proteins form a complex on the rat hepatocyte membrane. Cell Physiol Biochem. 2005;15:51-8
44. He TC, Zhou S, da Costa LT, Yu J, Kinzler KW, Vogelstein B. A simplified system for generating recombinant adenoviruses. Proc Natl Acad Sci U S A. 1998;95:2509-14
45. Ryu MJ, Kim SJ, Kim YK, Choi MJ, Tadi S, Lee MH. et al. Crif1 deficiency reduces adipose OXPHOS capacity and triggers inflammation and insulin resistance in mice. PLoS Genet. 2013;9:e1003356
Author contact
![]() Corresponding authors: Jeong-Ki Min, PhD., Biotherapeutics Translational Research Center, Korea Research Institute of Bioscience & Biotechnology, 125 Gwahak-ro, Yuseong-gu, Daejeon 34141, Republic of Korea; Tel: +82-42-860-4137; Fax: +82-42-860-4149; E-mail: jekmin74com; Jong-Gil Park, PhD., Biotherapeutics Translational Research Center, Korea Research Institute of Bioscience & Biotechnology, 125 Gwahak-ro, Yuseong-gu, Daejeon 34141, Republic of Korea; Tel: +82-42-860-4122; Fax: +82-42-860-4149; E-mail: jonggilparkre.kr
Corresponding authors: Jeong-Ki Min, PhD., Biotherapeutics Translational Research Center, Korea Research Institute of Bioscience & Biotechnology, 125 Gwahak-ro, Yuseong-gu, Daejeon 34141, Republic of Korea; Tel: +82-42-860-4137; Fax: +82-42-860-4149; E-mail: jekmin74com; Jong-Gil Park, PhD., Biotherapeutics Translational Research Center, Korea Research Institute of Bioscience & Biotechnology, 125 Gwahak-ro, Yuseong-gu, Daejeon 34141, Republic of Korea; Tel: +82-42-860-4122; Fax: +82-42-860-4149; E-mail: jonggilparkre.kr