Impact Factor
- Issue 14; 2026
- Issue 13; 2026
- Issue 12; 2026
- Issue 11; 2026
- Issue 10; 2026
- Volume 16; 2026
- Advance Articles
- Past Issues
- Cover Images
- Cover Suggestion
- Index & Coverage
- Special Issues
Introduction
Results
Discussion
Conclusions
Materials and Methods
Abbreviations
Supplementary Material
Acknowledgements
References
International Journal of Biological Sciences
International Journal of Medical Sciences
 Global reach, higher impact

Theranostics 2022; 12(14):6380-6394. doi:10.7150/thno.74828 This issue Cite
Research Paper
Cerenkov luminescence imaging of interscapular brown adipose tissue using a TSPO-targeting PET probe in the UCP1 ThermoMouse
Seok-Yong Lee1,2,3#, Ho Rim Oh1,2,3#, Young-Hwa Kim1,3, Sung-Hwan Bae1,3, Yongseok Lee4, Yun-Sang Lee1,4,5, Byung Chul Lee6,7, Gi Jeong Cheon1,3, Keon Wook Kang1,2,3, Hyewon Youn1,3,4 ![]()
1. Department of Nuclear Medicine, Seoul National University College of Medicine, Seoul, Republic of Korea
2. Department of Biomedical Sciences, Seoul National University Graduate School, Seoul, Republic of Korea
3. Cancer Research Institute, Seoul National University College of Medicine, Seoul, Republic of Korea
4. Cancer Imaging Center, Seoul National University Hospital, Seoul, Republic of Korea
5. Radiation Medicine Research Institute, Medical Research Center, Seoul National University College of Medicine, Seoul, Republic of Korea
6. Department of Nuclear Medicine, Seoul National University Bundang Hospital, Seongnam, Republic of Korea
7. Center for Nanomolecular Imaging and Innovative Drug Development, Advanced Institutes of Convergence Technology, Seoul National University, Suwon, Republic of Korea
# These authors equally contributed to this research.
Received 2022-5-6; Accepted 2022-8-20; Published 2022-8-29
Abstract

Rationale: [18F]fluorodeoxyglucose-positron emission tomography ([18F]FDG-PET) has been widely used as an imaging technique to measure interscapular brown adipose tissue (iBAT) activity. However, it is challenging to obtain iBAT-specific images using [18F]FDG-PET because increased uptake of [18F]FDG is observed in tumors, muscle, and inflamed tissues. Uncoupling protein 1 (UCP1) in the mitochondrial membrane, a well-known molecular marker of BAT, has been proposed as a useful BAT imaging marker. Recently, the UCP1 ThermoMouse was developed as a reporter mouse for monitoring UCP1 expression and investigating BAT activation. In addition, Translocator protein-18 kDa (TSPO) located in the outer mitochondrial membrane is also overexpressed in BAT, suggesting that TSPO-targeting PET has potential for iBAT imaging. However, there are no studies monitoring BAT using TSPO-targeting PET probes in the UCP1 ThermoMouse. Moreover, the non-invasive Cerenkov luminescence imaging (CLI) using Cerenkov radiation from the PET probe has been proposed as an alternative option for PET as it is less expensive and user-friendly. Therefore, we selected [18F]fm-PBR28-d2 as a TSPO-targeting PET probe for iBAT imaging to evaluate the usefulness of CLI in the UCP1 ThermoMouse.
Methods: UCP1 ThermoMouse was used to monitor UCP1 expression. Western blotting and immunohistochemistry were performed to measure the level of protein expression. [18F]fm-PBR28-d2 and [18F]FDG were used as radioactive probes for iBAT imaging. PET images were acquired with SimPET, and optical images were acquired with IVIS 100.
Results: UCP1 ThermoMouse showed that UCP1 and TSPO expressions were correlated in iBAT. In both PET and CLI, the TSPO-targeting probe [18F]fm-PBR28-d2 was superior to [18F]FDG for acquiring iBAT images. The high molar activity of the probe was essential for CLI and PET imaging. We tested the feasibility of TSPO-targeting probe under cold exposure by imaging with TSPO-PET/CLI. Both signals of iBAT were clearly increased after cold stimulation. Under prolonged isoflurane anesthesia, TSPO-targeting images showed higher signals from iBAT in the short-term than in long-term groups.
Conclusion: We demonstrated that TSPO-PET/CLI reflected UCP1 expression in iBAT imaging better than [18F]FDG-PET/CLI under the various conditions. Considering convenience and cost, TSPO-CLI could be used as an alternative TSPO-PET technique for iBAT imaging.
Keywords: Interscapular brown adipose tissue, UCP1, TSPO, PET, Cerenkov luminescence imaging
Introduction
Interscapular brown adipose tissue (iBAT) is an organ that plays an important role in maintaining heat production and energy homeostasis in mammals [1, 2]. Thus, impairment of the heat-generating function of iBAT contributes to metabolic diseases such as obesity. Various imaging modalities for iBAT have been developed [3, 4], such as positron emission tomography (PET) using [18F]fluorodeoxyglucose ([18F]FDG) that can visualize iBAT under cold or chemical stimulation conditions [5-9]. However, [18F]FDG is not compatible with iBAT-specific imaging due to its strong absorption in malignant cancers, inflammation, or during muscle activity [10]. Furthermore, iBAT imaging with [18F]FDG-PET needs to consider endocrine factors, such as individual differences in insulin sensitivity and epigenetic programs, which cannot be explained by glucose uptake [11, 12].
Uncoupling protein 1 (UCP1) is most abundantly expressed in the mitochondrial inner membrane and also overexpressed in brown adipose tissue (BAT) and used as its biomarker. UCP1 uncouples the respiratory chain from oxidative phosphorylation and ATP synthesis enabling energy use [13, 14]. The UCP1 ThermoMouse was recently developed to monitor its expression [15]. Translocator protein-18 kDa (TSPO) is a five transmembrane domain protein located on the mitochondrial outer membrane [16] and used to characterize many cancers and inflammations [17]. Various radioligands targeting TSPO have been developed as PET probes for imaging neuroinflammation [18-22]. TSPO is abundantly expressed in mitochondria and has recently emerged as a potential imaging biomarker for iBAT because of its enhanced expression in iBAT compared to the inguinal white adipose tissue (iWAT) [23, 24]. Successful iBAT-PET imaging using [11C]PBR28 that targets TSPO has been reported [25]. Our group also reported that deuterium-substituted [18F]fluormethyl-PBR28-d2 ([18F]fm-PBR28-d2) overcomes the metabolic stability and adverse short half-life of [11C] (T1/2 = 20.36 min) [26].
Cerenkov luminescence imaging (CLI) is a new optical imaging technique that captures the emission of electromagnetic radiation from β+ or β- decay of radionuclides, such as [18F] and [131I], in the medium. Cerenkov radiation (CR) is observed when a charged particle moving through a medium is faster than the phase velocity of light in that medium [27, 28]. With optical imaging equipment, CLI can be acquired with PET probes. Although CLI techniques for imaging iBAT using [18F]FDG have been tested [29-31], most studies focused on monitoring the biodistribution of [18F]FDG based on anatomical location without comparing the expression of UCP1, a biomarker of BAT. Currently, there are no reports of PET and CLI images using nuclear medicine probes such as [18F]FDG or [18F]fm-PBR28-d2 based on bioimaging of UCP1 expression, a biomarker of BAT. In this study, we compared UCP1 expression and PET signals from iBAT using [18F]FDG or [18F]fm-PBR28-d2 imaging in UCP1 ThermoMouse and discussed the possibility of CLI as an alternative option to PET.
Results
UCP1 ThermoMouse is useful for imaging in vivo UCP1 expression in the iBAT
UCP1 ThermoMouse is a reporter mouse for monitoring in vivo UCP1 expression generated by inserting the luciferase2-T2A-tdTomato cassette into the initiation codon of 98.6 kb bacterial artificial chromosome (BAC) containing the entire UCP1 locus [15]. Thus, bioluminescence from luciferase2 (Luc2) and fluorescence from tdTomato under the control of UCP1 expression could be monitored (Figure 1A). The luciferase activities and fluorescence signals from UCP1 expression were observed in the iBAT region (Figure 1B). As displayed in Figure 1C, analysis of UCP1 expression in the whole body of the UCP1 ThermoMouse showed higher luminescence signals from iBAT and testis with epididymis than other tissues. It is thought that a shorter distance between the detector and the object exaggerates the signal in the optical image. Thus, the epididymis produces a relatively stronger BLI signal because it protrudes above the testis and is closer to the detector compared to the flat iBAT.
UCP1 ThermoMouse is useful for imaging in vivo UCP1 expression in the iBAT. (A) Design of reporter gene construct of UCP1 ThermoMouse. (B) Bioluminescence and fluorescence imaging of interscapular brown adipose tissue (iBAT). (C) Bioluminescence imaging (BLI) for monitoring UCP1 expression in mouse organs. (D) UCP1 and TSPO protein expression in different adipose tissues and organs by western blotting. (E) Immunohistochemical staining of UCP1, luciferase, and TSPO in inguinal white adipose tissue (iWAT), epididymal white adipose tissue (eWAT) and iBAT. All slides were counterstained with hematoxylin. (x400 magnification). Scale bar, 20 μm. Figure was created by BioRender.com.
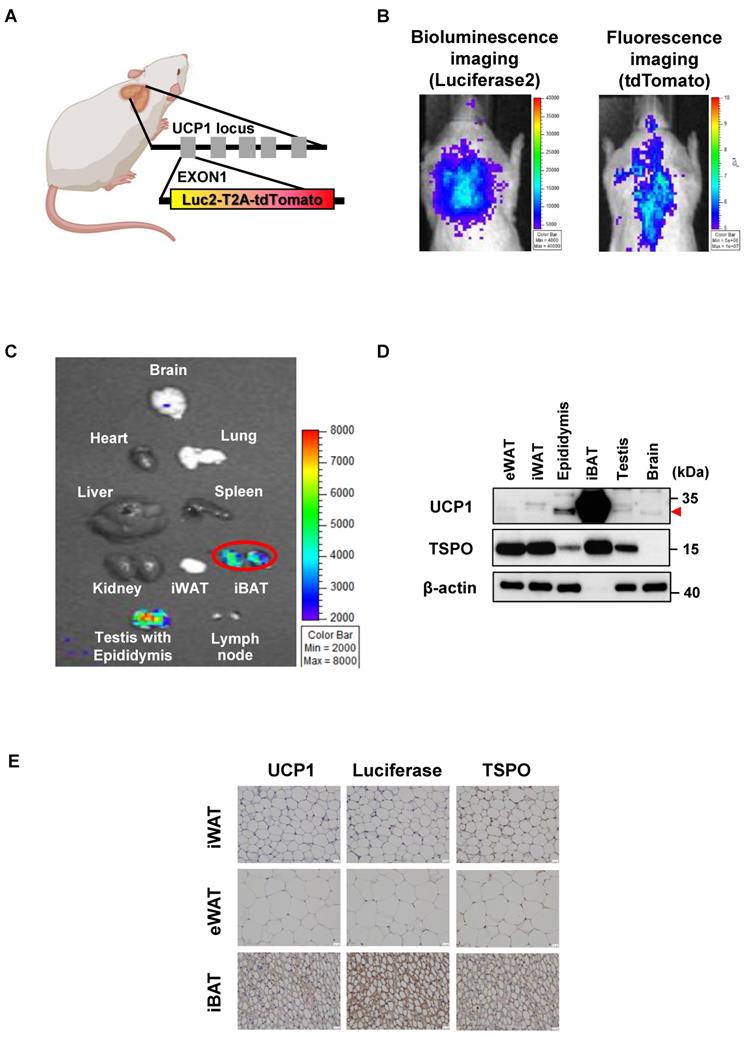
Since UCP1 is used as a BAT biomarker and the TSPO-targeting probe is considered an iBAT-specific imaging marker [25], we tested the correlation between UCP1 and TSPO expression in iBAT using western blotting and immunohistochemistry (IHC). UCP1 and TSPO expression in iBAT were significantly higher than in other tissues (Figure 1D). Figure 1E shows UCP1, luciferase, and TSPO expression in UCP1 ThermoMouse tissues, and demonstrates increased expression in iBAT. Although the expression of UCP1 was observed in the epididymis, epididymis and iBAT were quite separated in anatomical location. Thus, we concluded that the UCP1 ThermoMouse could be used to represent in vivo UCP1 expression in the iBAT.
TSPO targeting probe, [18F]fm-PBR28-d2 is superior to obtaining iBAT imaging than [18F]FDG
We performed [18F]FDG-PET and TSPO-PET for iBAT imaging because significant uptake of [18F]FDG in the iBAT area under cold exposure in humans was previously reported in many studies [5-9]. We tested the possibility of CLI as an alternative option to PET for iBAT imaging by comparing the relationship between luciferase reporter imaging of UCP1 expression and PET/CLI imaging of [18F]FDG or [18F]fm-PBR28-d2 in the UCP1 ThermoMouse model. Strong uptake [18F]FDG was observed in iBAT by PET and CLI imaging, but the [18F]FDG signal was also observed in the brain (Figure 2A). However, as evident from Figure 2B, PET and CLI of [18F]fm-PBR28-d2 targeting TSPO showed a strong signal in iBAT without its uptake in the brain. We quantitatively compared PET and CLI signals from [18F]FDG and [18F]fm-PBR28-d2. In PET imaging, [18F]FDG uptake in the brain was 5.08-fold higher than in iBAT (SUVmax, “iBAT” vs. “brain”, 0.575 ± 0.058 vs. 2.929 ± 0.7742, **P = 0.0063, Figure 2C). As expected, consistent with previous PET imaging results, CLI signal from [18F]FDG in the brain was 1.5-fold higher than in iBAT (Average radiance, photon/s/cm2/sr, “iBAT” vs. “brain”, 791000 ± 57026.3 vs. 1186667 ± 80829, **P = 0.0023, Figure 2D). On the other hand, [18F]fm-PBR28-d2 uptake in iBAT was 12.92-fold higher than in the brain (SUVmax, “brain” vs. “iBAT", 0.637 ± 0.182 vs. 8.246 ± 0.688, ****P < 0.0001, Figure 2E). Furthermore, the CLI signal from [18F]fm-PBR28-d2 in iBAT was 1.93-fold higher than in the brain (Average radiance, photon/s/cm2/sr, “brain” s. “iBAT”, 395000 ± 35085.6 vs. 762333.3 ± 68995.2, ** P = 0.0012, Figure 2F). Next, we examined the biodistribution of [18F]FDG and [18F]fm-PBR28-d2 in the UCP1 ThermoMouse and detected significantly higher [18F]FDG uptake in the heart and brain compared to [18F]fm-PBR28-d2 (%ID/g, [18F]FDG vs. [18F]fm-PBR28-d2, 56.74 ± 10.6 vs. 15.88 ± 13.66, *P = 0.014 for the heart; 6.62 ± 1.38 vs. 1.52 ± 0.96, **P = 0.0063 for the brain). Notably, we found that [18F]fm-PBR28-d2 uptake in iBAT was significantly higher than [18F]FDG uptake (Percentage of injected dose per gram (%ID/g), [18F]FDG vs. [18F]fm-PBR28-d2, 7.68 ± 2.47 vs. 34.08 ± 6.32, **P = 0.0025) (Figure 2G and Table 1).
TSPO targeting probe, [18F]fm-PBR28-d2 is superior to obtaining iBAT imaging than [18F]FDG. (A) Representative [18F]FDG-PET and CLI images. (B) Representative [18F]fm-PBR28-d2-PET and CLI images. (C) Quantitative analysis of PET signals (SUVmax ratio for PET) from iBAT after [18F]FDG injection. (D) Quantitative analysis of CLI signals (Average radiance, photon/s/cm2/sr for CLI) from iBAT after [18F]FDG injection. (E) Quantitative analysis of PET signals (SUVmax ratio for PET) from iBAT after [18F]fm-PBR28-d2 injection. (F) Quantitative analysis of CLI signals (Average radiance, photon/s/cm2/sr for CLI) from iBAT after [18F]fm-PBR28-d2 injection. (G) Biodistribution of [18F]FDG or [18F]fm-PBR28-d2 in UCP1 ThermoMice. Data represent means ± SD (n = 3 per group). *P < 0.05, **P < 0.01, ****P < 0.0001.
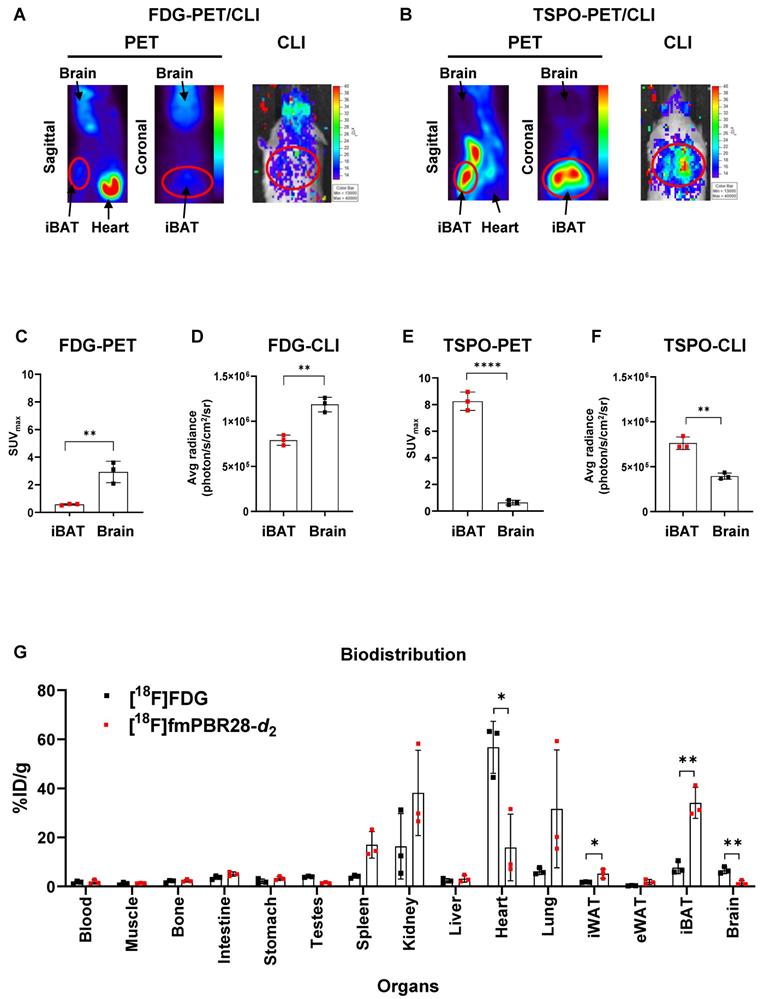
Biodistribution of [18F]FDG vs. [18F]fm-PBR28-d2.
| [18F]FDG (%ID/g) | [18F]fm-PBR28-d2 (%ID/g) | P-value | ||||
|---|---|---|---|---|---|---|
| Organs | Mean | SD | Mean | SD | ||
| Blood | 1.67 | 0.47 | 1.86 | 0.67 | ||
| Muscle | 1.16 | 0.44 | 1.34 | 0.11 | ||
| Bone | 2.08 | 0.42 | 2.34 | 0.2 | ||
| Intestine | 3.61 | 0.60 | 5.08 | 0.71 | ||
| Stomach | 2.14 | 0.79 | 3.31 | 0.68 | ||
| Testis | 3.96 | 0.20 | 1.46 | 0.20 | ||
| Spleen | 4.06 | 0.52 | 17.01 | 4.44 | ||
| Kidney | 16.38 | 10.91 | 38.19 | 14.21 | ||
| Liver | 2.33 | 0.75 | 3.18 | 1.16 | ||
| Heart | 56.74 | 10.6 | 15.88 | 13.6 | * | |
| Lung | 6.19 | 1.09 | 31.66 | 19.63 | ||
| iWAT | 1.78 | 0.08 | 5.21 | 1.55 | ||
| eWAT | 0.33 | 0.08 | 1.87 | 0.81 | ||
| iBAT | 7.68 | 2.47 | 34.08 | 6.32 | ** | |
| Brain | 6.62 | 1.38 | 1.52 | 0.96 | ** | |
*P < 0.05, **P < 0.01.
[18F]fm-PBR28-d2 reflects endogeneous UCP1 levels much better than [18F]FDG
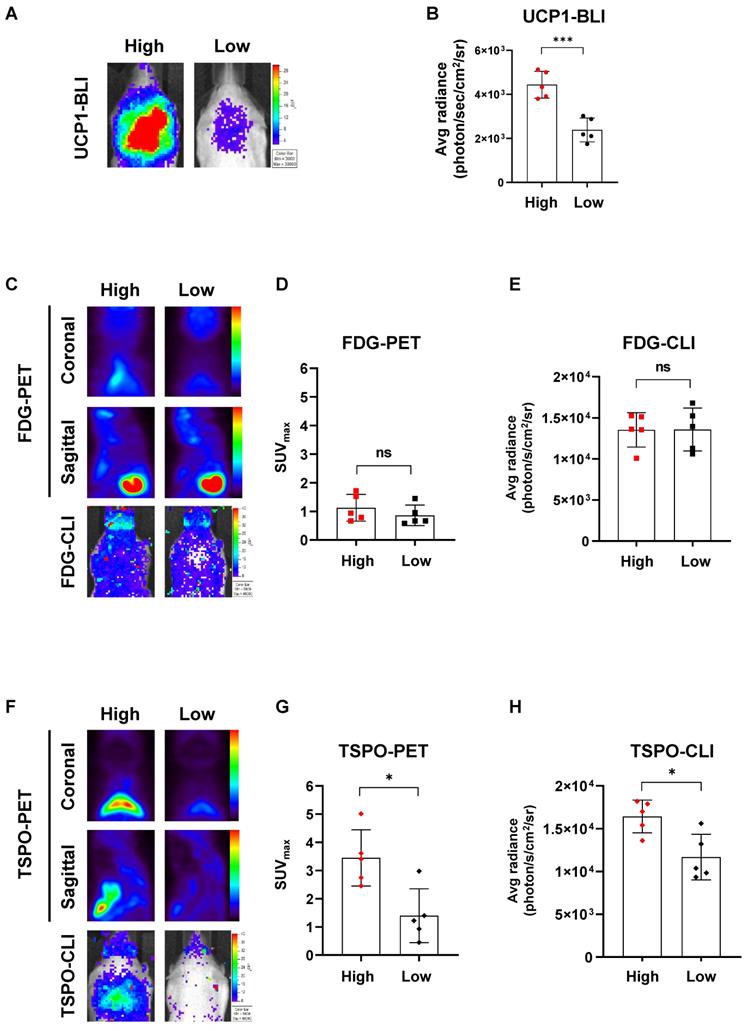
Because UCP1 expression generally varies between individual UCP1 ThermoMouse, we divided them into two groups based on the endogenous UCP1 levels after monitoring luciferase activity with BLI (Figure 3A). Subsequently, we compared PET and CLI images with [18F]FDG and [18F]fm-PBR28-d2 between the two groups. UCP1 expression, represented by the BLI signal, was 1.85-fold higher in the “high” group than in the “low” group (Average radiance, photon/s/cm2/sr, “high” vs. “low”, 4435.6 ± 609.5 vs. 2387 ± 542.83, ***P = 0.0005, Figure 3B). Then, we analyzed [18F]FDG-PET and [18F]FDG-CLI images and found no difference in [18F]FDG signals from PET and CLI between groups with different UCP1 levels (Figure 3C). Furthermore, no statistical significance was observed between groups of different UCP1 levels in quantitative analysis of [18F]FDG-PET (SUVmax, “high” vs. “low”, 1.12 ± 0.46 vs. 0.86 ± 0.36, not significant (ns), Figure 3D) and [18F]FDG-CLI (Average radiance, photon/s/cm2/sr, “high” vs. “low”, 13534 ± 2087.47 vs. 13578 ± 2613.71, ns, Figure 3E). However, as Figure 3F shows, [18F]fm-PBR28-d2 signals from TSPO-PET and TSPO-CLI were significantly higher in the “high” UCP1 group than in the “low” UCP1 group. Similarly, quantitative analysis of TSPO-PET and CLI showed that both signals were significantly higher in the “high” UCP1 group than in the “low” UCP1 group (SUVmax, “high” vs. “low”, 3.47 ± 0.99 vs. 1.40 ± 0.95, *P = 0.0104; average radiance, photon/s/cm2/sr, 16422 ± 1912.57 vs. 11673 ± 2655.12, *P = 0.012 for CLI, Figure 3G-H). These data suggested that [18F]fm-PBR28-d2 produced more specific images for iBAT than [18F]FDG.
[18F]fm-PBR28-d2 reflects endogenous UCP1 levels much better than [18F]FDG. (A) Representative BLI in groups of ThermoMice with “high” or “low” endogenous UCP1 expression. (B) Quantitative analysis of BLI signals from iBAT between groups with “high” and “low” UCP1 expression. (C) Representative [18F]FDG-PET and CLI images in groups with “high” and “low” UCP1 expression. (D) Quantitative analysis of [18F]FDG-PET signals from iBAT in groups with “high” and “low” UCP1 expression. (E) Quantitative analysis of [18F]FDG-CLI signals from iBAT in groups with “high” and “low” UCP1 expression. (F) Representative TSPO-PET and CLI images in groups with “high” and “low” UCP1 expression. (G) Quantitative analysis of TSPO-PET signals from iBAT in groups with “high” and “low” UCP1 expression. (H). Quantitative analysis of TSPO-CLI signals from iBAT in groups with “high” and “low” UCP1 expression. Data represent means ± SD (n = 5 per group). *P < 0.05, ***P < 0.001.
High molar activity is essential for acquiring TSPO-CLI as well as TSPO-PET on iBAT imaging
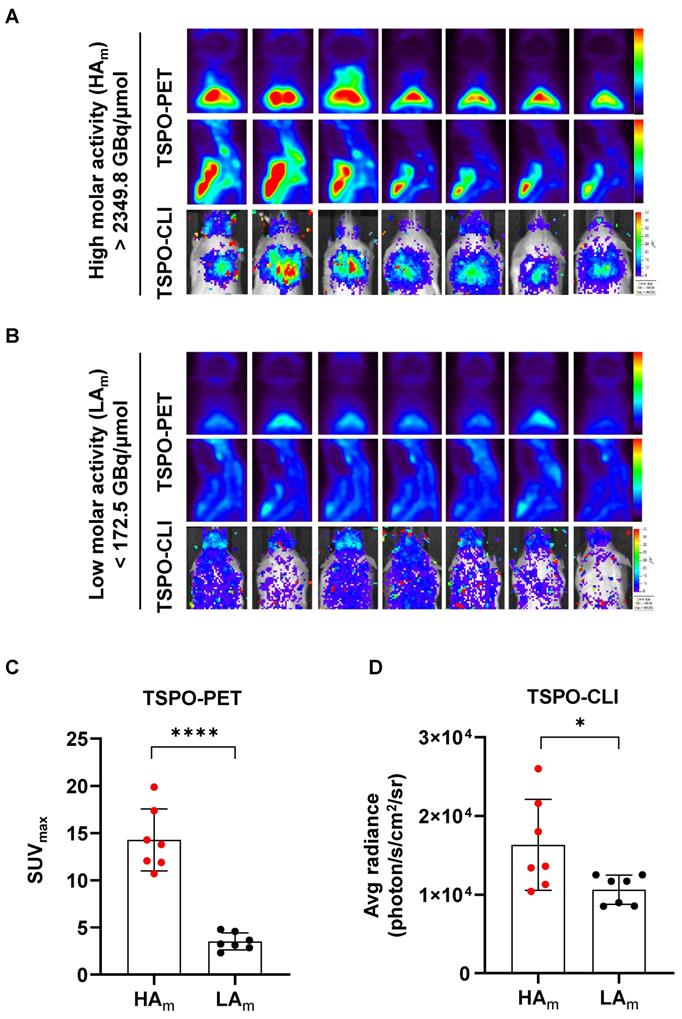
Since our results showed that [18F]fm-PBR28-d2 was better than [18F]FDG for iBAT imaging, we investigated conditions for generating better images of [18F]fm-PBR28-d2-PET and CLI. Probes with high molar (or specific) activity generally contain fewer non-radiolabeled precursors competing with radiolabeled molecules, resulting in better images. Therefore, we investigated qualitative differences in iBAT images between probes with different molar activities of [18F]fm-PBR28-d2 for TSPO-PET and CLI. As is evident from Figure 4A, PET and CLI signals of iBAT with the high molar activity probe (“HAm”, more than 2349.8 GBq/μmol) resulted in superior-quality images. Conversely, images from the probe with low molar activity (“LAm”, less than 172.5 GBq/μmol) showed poor PET and CLI signals in iBAT (Figure 4B). Quantitative analysis indicated that the PET signal in the HAm group was 4.06-fold higher than in the LAm group (“HAm” vs. “LAm”, 14.27 ± 3.28 vs. 3.51 ± 0.9, ****P < 0.0001, Figure 4C), and the CLI signal in the HAm group was 1.54-fold higher than in the LAm group (Average radiance, photon/s/cm2/sr, “HAm” vs. “LAm” 16328.57 ± 5781.78 vs. 10632.86 ± 1864.58, *P = 0.04, Figure 4D). Our results indicated that probes with higher molar activity produced better iBAT images in TSPO-PET and CLI. In particular, a higher molar activity of the probe was required for quantitative analysis of CLI.
High molar activity is essential for acquiring TSPO-CLI as well as TSPO-PET of iBAT imaging. (A) Representative TSPO-PET and TSPO-CLI for iBAT images using [18F]fm-PBR28-d2 with high molar activity (“HAm”, more than 2349.8 GBq/μmol). (B) Representative TSPO-PET and TSPO-CLI for iBAT images using [18F]fm-PBR28-d2 with low molar activity (“LAm”, less than 172.5 GBq/μmol). (C) Quantitative analysis of the PET signals from [18F]fm-PBR28-d2 with high and low molar activity in iBAT images of UCP1 ThermoMice. (D) Quantitative analysis of CLI signals from [18F]fm-PBR28-d2 with high and low molar activity in iBAT images of UCP1 ThermoMice. Data represent means ± SD (n = 7 per group). *P < 0.05, ****P < 0.0001.
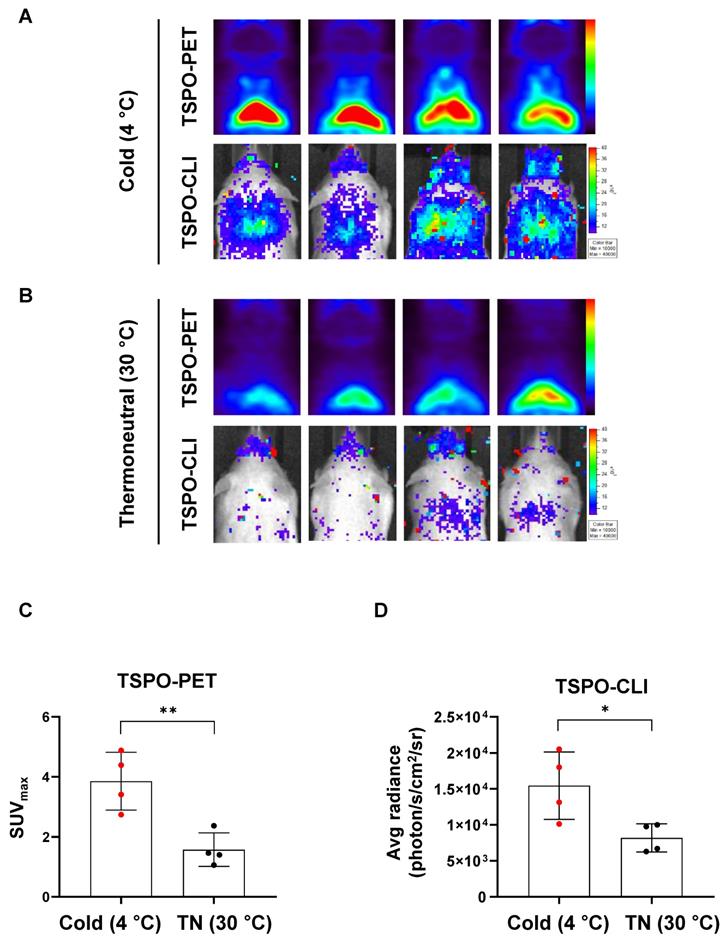
Cold stimulation increases both TSPO-PET and TSPO-CLI signals in iBAT
In [18F]FDG-PET, the detection rate of iBAT is less than 10% in human, but cold stimulation increases the image detection rate of iBAT by 33~100% [32]. Therefore, it is important to investigate and compare the effects of cold stimulation in iBAT imaging. We compared iBAT imaging by PET and CLI using TSPO-targeting probe under thermoneutral (TN, 30 °C) or cold stimulation (4 °C) conditions in UCP1 ThermoMouse. UCP1 ThermoMouse was exposed for 4 h to each group of TN or cold stimulation. Figure 5A shows the TSPO-PET signals from [18F]fm-PBR28-d2 in iBAT were much higher in the cold stimulation group (2.45-fold) than the thermoneutral condition group (SUVmax, “cold” vs. “thermoneutral”, 3.86 ± 0.96 vs. 1.57 ± 0.56, **P = 0.0064, Figure 5A-B upper panel and 5C). Similarly, TSPO-CLI signals from [18F]fm-PBR28-d2 in iBAT were significantly higher in the cold stimulation group (1.86-fold) than the thermoneutral condition group (Average radiance, photon/s/cm2/sr, “cold” vs. “thermoneutral”, 15437.5 ± 4683.15 vs. 8259.5 ± 2043.58, *P = 0.029, Figure 5A-B lower panel and 5D). Consistent with previous other reports, [18F]FDG-PET (1.53-fold) and [18F]FDG-CLI (1.18-fold) signals from [18F]FDG in iBAT were higher in the cold stimulation group (Figure S1). However, our data suggested that TSPO-targeting probe was more sensitive and specific reflected in iBAT imaging than using [18F]FDG.
Cold stimulation significantly increases both TSPO-PET and TSPO-CLI signals in iBAT. (A) Representative TSPO-PET and TSPO-CLI images with [18F]fm-PBR28-d2 under cold stimulation (4 °C) for 4 h. (B) Representative TSPO-PET and TSPO-CLI images with [18F]fm-PBR28-d2 under thermoneutral condition (30 °C) for 4 h. (C) Quantitative analysis of PET signals from iBAT after [18F]fm-PBR28-d2 injection under cold stimulation (4 °C) or thermoneutral condition (30 °C). (D) Quantitative analysis of CLI signals from iBAT after [18F]fm-PBR28-d2 injection under cold stimulation (4 °C) or thermoneutral condition (30 °C) . Data represent means ± SD (n = 4 per group). *P < 0.05, **P < 0.01.
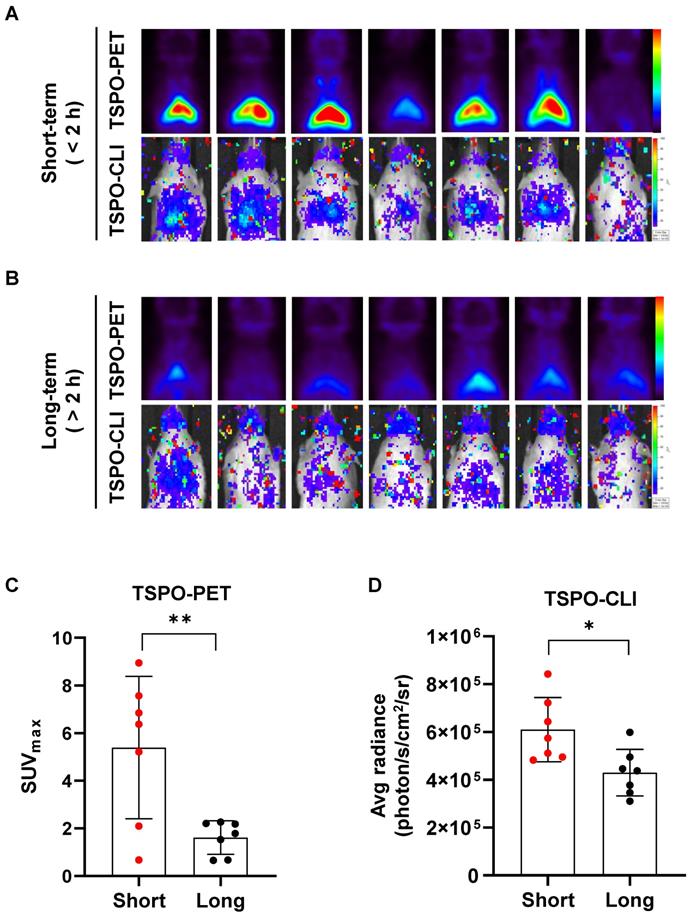
Short isoflurane exposure shows higher both TSPO-PET and TSPO-CLI signals than long isoflurane exposure
We compared iBAT activity changes following prolonged anesthesia by PET and CLI using a TSPO-targeting probe. UCP1 ThermoMouse was anesthetized with isoflurane for less than 2 h (short-term) or more than 2 h (long-term) prior to intravenous injection of [18F]fm-PBR28-d2 (Figure 6A-B). TSPO-PET signals from [18F]fm-PBR28-d2 in iBAT were much higher in the short-term (3.3-fold) than the long-term exposure group (SUVmax, “short-term” vs. “long-term”, 5.387 ± 2.989 vs. 1.613 ± 0.699, **P = 0.0069, Figures 6A-B upper panel and 6C). Similarly, TSPO-CLI signals from [18F]fm-PBR28-d2 in iBAT were significantly higher in the short-term (1.41-fold) than the long-term exposure group (Average radiance, photon/s/cm2/sr, “short-term” vs. “long-term”, 609857.1 ± 134265 vs. 429857.1 ± 97484.1, *P = 0.0141, Figure 6A-B lower panel and 6D). Interestingly, in the case of [18F]FDG, we found no significant difference in the PET and CLI imaging between the two groups with different exposure times to anesthesia (Figure S2). Our data showed that [18F]fm-PBR28-d2 produced a more sensitive and specific iBAT image than [18F]FDG by better reflecting UCP1 expression and providing enough CLI signal to evaluate the iBAT activity, suggesting that TSPO-CLI could be used as an alternative imaging technique to TSPO-PET for iBAT imaging.
Short isoflurane exposure shows higher both TSPO-PET and TSPO-CLI signals than long isoflurane exposure in iBAT. (A) Representative TSPO-PET and TSPO-CLI images with [18F]fm-PBR28-d2 under short exposure of isoflurane anesthesia (“short-term”, shorter than 2 h). (B) Representative TSPO-PET and TSPO-CLI images with [18F]fm-PBR28-d2 under long exposure of isoflurane anesthesia (“long-term”, longer than 2 h). (C) Quantitative analysis of PET signals from iBAT after [18F]fm-PBR28-d2 injection under short or long exposure of isoflurane anesthesia. (D) Quantitative analysis of CLI signals from iBAT after [18F]fm-PBR28-d2 injection under short or long exposure of isoflurane anesthesia. Data represent means ± SD (n = 7 per group). *P < 0.05, **P < 0.01.
Discussion
Recently, adipose tissue (AT) imaging has been spotlighted to diagnose and treat various metabolic diseases. Obesity is assessed by the amount of whole-body AT using body mass index (BMI) or the thickness of white adipose tissue by computed tomography (CT). Besides the white adipose tissue, the assessment of obesity requires a more detailed analysis of other adipose tissue types, such as the brown adipose tissue (BAT). Generally, iBAT images are acquired by cold stimulation or chemical treatments such as rosiglitazone and β-3 adrenergic agonist using [18F]FDG-PET [5, 6]. However, due to the elevated uptake of [18F]FDG in tissues with high glucose metabolism, such as the heart and brain [10], [18F]FDG-PET quantitative analysis of iBAT is not reliable.
The UCP1 ThermoMouse is a valuable model to image iBAT as it specifically shows the expression of endogenous UCP1, a biomarker of BAT, by bioluminescence and fluorescence imaging in vivo [15]. We validated high UCP1 and TSPO expression in iBAT using the UCP1 ThermoMouse (Figures 1 and 2). We evaluated the biodistribution of [18F]FDG and [18F]fm-PBR28-d2 in vivo and observed specific uptake of [18F]fm-PBR28-d2 in iBAT. Since [18F]FDG is capable of targeting iBAT, PET and CLI images are limited by changes in glucose metabolism in the body, its high uptake in the brain and heart could interfere with the reliability of [18F]FDG in iBAT images. We tested the feasibility of [18F]FDG and [18F]fm-PBR28-d2 for iBAT imaging in UCP1 ThermoMouse and we divided them into two groups (“high” and “low”) according to their UCP1 levels. We found that the [18F]fm-PBR28-d2 uptake correlated with endogenous levels of UCP1. However, we did not detect a correlation between the [18F]FDG uptake and endogenous levels of UCP1 (Figure 3). These data indicated that [18F]fm-PBR28-d2 was significantly more useful than [18F]FDG for obtaining iBAT images in both PET and CLI.
Because the detection rate of iBAT in [18F]FDG-PET is less than 10% in human, there is inconvenient to acquire images of iBAT by stimulation using cold climate or β-3 adrenergic receptor agonist [32]. In addition to higher uptake by brain and heart, skeletal muscle uptake may also interfere with obtaining iBAT-specific images. Therefore, its location has been verified by combining with anatomical images such as CT or magnetic resonance angiography (MRI). It was reported that glucose uptake in iBAT is about 8-fold higher than skeletal muscles but the total amount of iBAT in the whole body is only 0.2% of skeletal muscles [50]. Therefore, the amount of total glucose uptake in iBAT is only about 1% of that of skeletal muscles. On the other hand, both TSPO and UCP1 proteins are present in mitochondria, and the brown color of BAT is derived from a smaller droplet size with a higher number of mitochondria compared to WAT, so TSPO is considered to represent the expression of UCP1 relatively well.
Since an optimal dose of radionuclide activity is required for an accurate PET scan [31], the molar activity of an imaging probe Am, defined as the radioactivity in a specific amount of tracer, is important [33]. We determined that higher molar activity was a significant factor for CLI and PET. Especially for [18F]fm-PBR28-d2, a molar activity of at least 2300 GBq/μmol was required to obtain better CLI images (Figure 4). However, too high molar activity might saturate probe uptake in the target organ, making accurate observation difficult. Therefore, it was necessary to determine the optimal range of molar activity of a probe to obtain high-quality images [34]. Although PET instruments effectively visualize and quantify the uptake of radioactive probes in non-invasive whole-body imaging, their cost is prohibitive for routine use. Since most optical imaging equipment is less expensive than PET equipment, CLI imaging using Cerenkov radiation from a PET probe can be used as an alternative. Therefore, we tested the comparability of PET and CLI images for iBAT in the UCP1 ThermoMouse model. Our results showed that TSPO-PET with [18F]fm-PBR28-d2 reflected UCP1 expression in iBAT better than [18F]FDG-PET and was more sensitive for iBAT imaging. In addition, iBAT images could be obtained with CLI using [18F]fm-PBR28-d2, and TSPO-CLI could be used as an alternative imaging technique to TSPO-PET for iBAT imaging.
From 2003 to 2012, since the detection rate of iBAT in [18F]FDG-PET is less than 10% in human but cold stimulation increases the image detection rate of iBAT for 33~100% [32]. As we mentioned above, UCP1 expression increases in iBAT that uncouples the respiratory chain from oxidative phosphorylation resulting high rate of oxidation and capable of using metabolic energy expenditure to provide heat under cold stimulation [2, 7, 35]. we showed that TSPO-PET and TSPO-CLI of signals in iBAT with [18F]fm-PBR28-d2 were significant higher in the cold stimulation group than thermoneutral condition group (Figure 5). Also, the correlation between UCP1 expression and [18F]FDG uptake under cold stimulation condition in iBAT was evaluated. (Figure S1). However, these results suggest that more sensitive and specific iBAT imaging is possible using TSPO-targeting probe than [18F]FDG.
General anesthesia plays an important role in the long-term PET imaging and patient surgery in the clinic and is also essential in animal studies [36, 37]. Effects of anesthetics on mitochondrial metabolism have been extensively studied, suggesting that anesthesia has a detrimental effect on mitochondrial function [38]. For example, isoflurane was shown to decrease the binding of [11C]DPA-713, a TSPO radioligand, in the monkey brain [39]. These data suggested that anesthetics may affect the TSPO binding affinity differently, acting as a variable for TSPO-PET imaging. Indeed, we observed that the binding of [18F]fm-PBR28-d2 in PET and CLI was decreased in the group with longer exposure to anesthesia than with shorter exposure (Figure 6). On the other hand, UCP1 expression and [18F]FDG uptake in iBAT of UCP1 ThermoMouse did not change even after “long term” isoflurane exposure compared to “short-term” exposure (Figure S2). These data indicated that anesthetics might decrease the metabolic function of mitochondria, thereby inhibiting TSPO expression or function and consequently affecting iBAT imaging. However, iBAT images using [18F]fm-PBR28-d2 are generally acquired within 1 h and may not be influenced by the long-term anesthesia effect.
In addition to the results of our research in this paper, various iBAT studies are possible in UCP1 ThermoMouse using [18F]FDG-PET or TSPO-PET probes. The iBAT images obtained from human [18F]FDG-PET showed decreased glucose uptake with age due to mitochondrial dysfunction and impairment of endocrine signaling [40-44], suggesting that TSPO-PET may also be affected by age. Preliminary, we observed that a young UCP1 ThermoMouse (9 weeks old) had higher signals in both TSPO-PET and TSPO-CLI than an older UCP1 ThermoMouse (36 weeks old) under normal condition (Figure S3). However, additional experiments are needed to explain this observation. Also, since most obese people have white fat as adipocytes, research on obesity treatment through browning of white fat is of interest. It is well established that diet-induced obese (DIO) mouse models or obese humans have larger adipocytes, fewer mitochondria, and lower UCP1 expression than lean mice or humans [35, 45-49]. Therefore, iBAT images with UCP1 and TSPO-targeting ligands in the DIO model of UCP1 ThermoMouse are expected to provide various information on browning of white fat.
Conclusions
In this study, we revealed that the TSPO-targeting probe, [18F]fm-PBR28-d2, can be used as a reliable iBAT imaging probe that reflects UCP1 expression. We also confirmed that [18F]fm-PBR28-d2 can be used for TSPO-PET and TSPO-CLI to visualize iBAT. Significantly, our results showed that the TSPO-CLI can effectively replace TSPO-PET under defined conditions.
Materials and Methods
Animals
All experiments were approved by the Institutional Animal Care and Use Committee of the Seoul National University (IACUC No. 18-1228-2, 28 December 2018). UCP1 ThermoMouse (UCP1-Luc2-tdTomato reporter transgenic mouse) were obtained from Jackson Laboratory (ME, USA). Only 8-16 weeks old males were used for this research study because the reporter transgene was inserted into the Y chromosome. Carrier males were mated with FVB/NJ female mice to maintain live colonies. Offspring were identified by genotyping with Ucp1 primer. Sequences of the primers to validate the UCP1 reporter gene insertion were as follows. 5'-GTGCCACTGTTGTCTTCAGG-3' (forward); 5'-ATAGCTTCTGCCAACCGAAC-3' (reverse).
Immunohistochemisty (IHC)
Tissues from UCP1 ThermoMice were dissected and fixed with 4% paraformaldehyde. Fixed tissues were paraffin-embedded and cut with a microtome to generate 4 μm slices. Subsequently, tissue slices were mounted on the glass slides. For the IHC analysis, slides were deparaffinized, rehydrated, and treated with 0.5% H2O2 (386790, Calbiochem, San Diego, CA, USA) for 30 min for endogenous peroxidase blocking. The slides were boiled with 10 mM sodium citrate (pH 6.0) (ICN biomedicals, Aurora, OH, USA) for antigen retrieval and permeabilized with 0.5% Triton X-100 (35501, Yakuri pure chemicals, OSAKA, Japan) in Tris-buffered saline (TBS) for 5 min. Antibodies were diluted with TBS containing 1% BSA and incubated for 24 h at 4 ºC. Primary antibodies included rabbit isotype control (02-6102, Invitrogen, Waltham, MA, USA), goat isotype control (31245, Invitrogen, Waltham, MA, USA), anti-UCP1 (ab10983, Abcam, Cambridge, UK), anti-luciferase (NB100-1677, Novus Biologicals, Centennial, CO, USA), and anti-TSPO (ab109497, Abcam, Cambridge, UK). Immunolabeling was performed with biotinylated horse anti-rabbit IgG (BA-1100, Vector Laboratories, Burlingame, California, USA) and horse anti-goat IgG (BA-9500, Vector Laboratories, Burlingame, California, USA) secondary antibodies for 1 h followed by binding with ABC (PK-6100, Vector Laboratories, Burlingame, California, USA) for 1 h. Finally, 3, 3'-diaminobenzidine (DAB) (SK-4100, Vector Laboratories) was used as a chromogenic substrate (SK-4100, Vector Laboratories), and slides were counterstained with hematoxylin.
Western blotting
Extracted proteins from eWAT, iWAT, epididymis, iBAT, testis and whole brain (10 μg) were loaded and separated on bis-Tris-HCl buffered 10% sodium dodecyl sulfate (SDS)-polyacrylamide gels. Separated proteins were transferred to polyvinylidene fluoride (PVDF) membranes and incubated at 4 ºC with anti-UCP1 (ab10983, Abcam, Cambridge, UK), anti-TSPO (ab109497, Abcam, Cambridge, UK), and anti-β-actin (A5441, Sigma-Aldrich, St. Louis, MO, USA)] antibodies for overnight. Next, membranes were incubated with horseradish peroxide-linked goat anti-rabbit (7074S, Cell Signaling Technology, Danvers, MA, USA) and horse anti-mouse (7076S, Cell Signaling Technology, Danvers, MA, USA) secondary antibodies for 1 h at room temperature. All immunoreactive bands were imaged with an LAS-3000 imaging system (Bio-Rad Laboratories, Hercules, CA, USA).
Ex vivo biodistribution of PET probes
Radioactive [18F]fluorodeoxyglucose ([18F]FDG) and deuterium-substituted [18F]fluoromethyl-PBR28 ([18F]fm-PBR28-d2) were synthesized following the protocols described previously [26]. UCP1 ThermoMouse underwent intravenous injection with [18F]FDG or [18F]fm-PBR28-d2. After 1 h, mice were euthanized, and tissue samples were collected, including blood, muscle, bone, intestine, stomach, testes, spleen, kidney, liver, heart, lung, iWAT, eWAT, and iBAT. Radioactivity of the samples was measured by Cobra II gamma counter (Canberra Packard; Vaughan, Ontario, Canada). Results were expressed as the percentage of injected dose per gram (%ID/g).
Bioluminescence imaging
Bioluminescence imaging was acquired using an IVIS 100 imaging system (Xenogen, Alameda, CA, USA). UCP1 ThermoMice were anesthetized with 1.5% isoflurane combined with oxygen. Subsequently, D-luciferin (3 mg per mouse, #E1605, Promega, WI, USA) was injected intraperitoneally, and bioluminescence signals were obtained and analyzed with Living Imaging software (ver.2.50.2, Xenogen, Alameda, CA, USA).
Cerenkov luminescence imaging
CLI was acquired using an IVIS 100 imaging system. UCP1 ThermoMice were anesthetized with isoflurane and intravenously injected with [18F]FDG (11.1 to 14.8 MBq per mouse) or [18F]fm-PBR28-d2 (11.1 to 14.8 MBq per mouse). Mice were then subjected to CLI sequentially for 1 h after [18F]FDG or [18F]fm-PBR28-d2 injection with the following parameters: open filter, f/stop = 1, bin = 4, FOV = D, and exposure time = 300 s.
PET imaging
PET scans were acquired by small animal PET imaging (SimPET, Brightonics imaging, Seoul, Korea) to visualize iBAT. Mice were anesthetized with 1.5% isoflurane combined with oxygen during the PET scans. PET images were acquired for 10 min and reconstructed by using the 3D OSEM algorithm (12 subsets). PET images were reconstructed and analyzed by the AMIDE program (ver. 0.9.0, http://amide.sourceforge.net). An ellipsoidal region-of-interest (ROI) was drawn around the target on the iBAT and expressed as a standardized uptake value (SUV) in a sagittal or a coronal PET slice using the AMIDE program (ver. 0.9.0, http://amide.sourceforge.net). Subsequently, the maximum PET SUV ratio in iBAT was calculated.
Statistical analysis
All results were calculated as mean ± standard deviation (SD), and statistical significance was determined using the unpaired 2-sample parametric Student t-test. GraphPad Prism 8 software (GraphPad Software Inc., San Diego, CA, USA) was used for statistical analysis. P < 0.05 was considered statistically significant.
Abbreviations
UCP1: uncoupling protein 1; [18F]FDG: [18F]fluorodeoxyglucose; TSPO: translocator protein-18 kDa; PET: positron emission tomography; AT: Adipose tissue; BAT: brown adipose tissue; iBAT: interscapular brown adipose tissue; WAT: white adipose tissue; iWAT: inguinal white adipose tissue; eWAT: epididymal white adipose tissue; BLI: bioluminescence imaging; CLI: Cerenkov luminescence imaging; CR: Cerenkov radiation; BAC: Bacterial artificial chromosome; Luc2: Luciferase-2; Am: molar activity; TN: thermoneutral; ROI: region of interest; SUV: standardized uptake value; CT: Computed tomography; MRI: Magnetic resonance angiography.
Supplementary Material
Supplementary figures.
Acknowledgements
This work was funded by the National Research Foundation (NRF) of the Ministry of Science and ICT (MSIT), Republic of Korea (2020R1A2C2011695, 2017K2A9A2A10013554, 2018R1D1A1B07044012, 2022R1C1C2008812) and supported by a grant of the Korea Health Technology R&D Project through the Korea Health Industry Development Institute (KHIDI) funded by the Ministry of Health & Welfare, Republic of Korea (HI18C1916). Graphical abstract was created with BioRender.com.
Author contributions
S-Y. L, H. R. O, and Y-H. K performed western blotting, immunohistochemistry, animal imaging, and interpretation of data. S-Y. L, H. R. O, and S-H. B maintained and characterized UCP1 ThermoMouse. Y. L performed radiosynthesis of the described radiotracer. Y-S. L and B. C. L participated in scientific discussions of radiotracers. S-Y. L. and H. R. O wrote the initial draft of the manuscript. G. J. C and K. W. K participated in scientific discussions on animal imaging. H. Y. conceptualized and supervised the project, performed data interpretation, and provided scientific guidance. S-Y. L and H. Y wrote the final version of the manuscript. All authors have read and agreed to the final version of the manuscript.
Competing Interests
The authors have declared that no competing interest exists.
References
1. Betz MJ, Enerbäck S. Targeting thermogenesis in brown fat and muscle to treat obesity and metabolic disease. Nat Rev Endocrinol. 2018;14:77-87
2. Villarroya F, Cereijo R, Villarroya J, Giralt M. Brown adipose tissue as a secretory organ. Nat Rev Endocrinol. 2017;13:26-35
3. Wang W, Seale P. Control of brown and beige fat development. Nat Rev Mol Cell Biol. 2016;17:691-702
4. Harms M, Seale P. Brown and beige fat: development, function and therapeutic potential. Nat Med. 2013;19:1252-63
5. Boon MR, van Marken Lichtenbelt WD. Brown adipose tissue: A human perspective. Handb Exp Pharmacol. 2016;233:301-19
6. Iwen KA, Backhaus J, Cassens M, Waltl M, Hedesan OC, Merkel M. et al. Cold-induced brown adipose tissue activity alters plasma fatty acids and improves glucose metabolism in men. J Clin Endocrinol Metab. 2017;102:4226-34
7. van Marken Lichtenbelt WD, Vanhommerig JW, Smulders NM, Drossaerts JM, Kemerink GJ, Bouvy ND. et al. Cold-activated brown adipose tissue in healthy men. N Engl J Med. 2009;360:1500-8
8. Nascimento EBM, van Marken Lichtenbelt WD. In vivo detection of human brown adipose tissue during cold and exercise by PET/CT. Handb Exp Pharmacol. 2019;251:283-98
9. Andersson J, Lundström E, Engström M, Lubberink M, Ahlström H, Kullberg J. Estimating the cold-induced brown adipose tissue glucose uptake rate measured by 18F-FDG PET using infrared thermography and water-fat separated MRI. Sci Rep. 2019;9:12358
10. Gerngross C, Schretter J, Klingenspor M, Schwaiger M, Fromme T. Active brown fat during 18F-FDG PET/CT imaging defines a patient group with characteristic traits and an increased probability of brown fat redetection. J Nucl Med. 2017;58:1104-10
11. Carpentier AC, Blondin DP, Virtanen KA, Richard D, Haman F, Turcotte EE. Brown adipose tissue energy metabolism in humans. Front Endocrinol (Lausanne). 2018;9:447
12. Sun W, Dong H, Becker AS, Dapito DH, Modica S, Grandl G. et al. Cold-induced epigenetic programming of the sperm enhances brown adipose tissue activity in the offspring. Nat Med. 2018;24:1372-83
13. Kozak LP, Anunciado-Koza R. UCP1: its involvement and utility in obesity. Int J Obes (Lond). 2008;32(Suppl 7):S32-8
14. Chouchani ET, Kazak L, Spiegelman BM. New advances in adaptive thermogenesis: UCP1 and beyond. Cell Metab. 2019;29:27-37
15. Galmozzi A, Sonne SB, Altshuler-Keylin S, Hasegawa Y, Shinoda K, Luijten IHN. et al. ThermoMouse: an in vivo model to identify modulators of UCP1 expression in brown adipose tissue. Cell Rep. 2014;9:1584-93
16. Rupprecht R, Papadopoulos V, Rammes G, Baghai TC, Fan J, Akula N. et al. Translocator protein (18 kDa) (TSPO) as a therapeutic target for neurological and psychiatric disorders. Nat Rev Drug Discov. 2010;9:971-88
17. Bhoola NH, Mbita Z, Hull R, Dlamini Z. Translocator Protein (TSPO) as a potential biomarker in human cancers. Int J Mol Sci. 2018;19:2176
18. Winkeler A, Boisgard R, Awde AR, Dubois A, Theze B, Zheng J. et al. The translocator protein ligand [18F]DPA-714 images glioma and activated microglia in vivo. Eur J Nucl Med Mol Imaging. 2012;39:811-23
19. Werry EL, Barron ML, Kassiou M. TSPO as a target for glioblastoma therapeutics. Biochem Soc Trans. 2015;43:531-6
20. Unterrainer M, Mahler C, Vomacka L, Lindner S, Havla J, Brendel M. et al. TSPO PET with [18F]GE-180 sensitively detects focal neuroinflammation in patients with relapsing-remitting multiple sclerosis. Eur J Nucl Med Mol Imaging. 2018;45:1423-31
21. Owen DR, Howell OW, Tang SP, Wells LA, Bennacef I, Bergstrom M. et al. Two binding sites for [3H]PBR28 in human brain: implications for TSPO PET imaging of neuroinflammation. J Cereb Blood Flow Metab. 2010;30:1608-18
22. Ching AS, Kuhnast B, Damont A, Roeda D, Tavitian B, Dolle F. Current paradigm of the 18-kDa translocator protein (TSPO) as a molecular target for PET imaging in neuroinflammation and neurodegenerative diseases. Insights Imaging. 2012;3:111-9
23. Yang J, Yang J, Wang L, Moore A, Liang SH, Ran C. Synthesis-free PET imaging of brown adipose tissue and TSPO via combination of disulfiram and 64CuCl2. Sci Rep. 2017;7:8298
24. Selvaraj V, Tu LN. Current status and future perspectives: TSPO in steroid neuroendocrinology. J Endocrinol. 2016;231:R1-30
25. Ran C, Albrecht DS, Bredella MA, Yang J, Yang J, Liang SH. et al. PET imaging of human brown adipose tissue with the TSPO tracer [11C]PBR28. Mol Imaging Biol. 2018;20:188-93
26. Moon BS, Jung JH, Park HS, Contino M, Denora N, Lee BC. et al. Preclinical comparison study between [18F]fluoromethyl-PBR28 and its deuterated analog in a rat model of neuroinflammation. Bioorg Med Chem Lett. 2018;28:2925-9
27. Robertson R, Germanos MS, Li C, Mitchell GS, Cherry SR, Silva MD. Optical imaging of Cerenkov light generation from positron-emitting radiotracers. Phys Med Biol. 2009;54:N355-65
28. Spinelli AE, D'Ambrosio D, Calderan L, Marengo M, Sbarbati A, Boschi F. Cerenkov radiation allows in vivo optical imaging of positron emitting radiotracers. Phys Med Biol. 2010;55:483-95
29. Grootendorst MR, Cariati M, Kothari A, Tuch DS, Purushotham A. Cerenkov luminescence imaging (CLI) for image-guided cancer surgery. Clin Transl Imaging. 2016;4:353-66
30. Zhang X, Kuo C, Moore A, Ran C. In vivo optical imaging of interscapular brown adipose tissue with 18F-FDG via Cerenkov luminescence imaging. PLoS One. 2013;8:e62007
31. Zhang X, Kuo C, Moore A, Ran C. Cerenkov luminescence imaging of interscapular brown adipose tissue. J Vis Exp. 2014: e51790.
32. Bauwens M, Wierts R, van Royen B, Bucerius J, Backes W, Mottaghy F. et al. Molecular imaging of brown adipose tissue in health and disease. Eur J Nucl Med Mol Imaging. 2014;41:776-91
33. Keller T, López-Picón FR, Krzyczmonik A, Forsback S, Takkinen JS, Rajander J. et al. Comparison of high and low molar activity TSPO tracer [18F]F-DPA in a mouse model of Alzheimer's disease. J Cereb Blood Flow Metab. 2020;40:1012-20
34. Wurzer A, Pollmann J, Schmidt A, Reich D, Wester HJ, Notni J. Molar activity of Ga-68 labeled PSMA inhibitor conjugates determines PET imaging results. Mol Pharm. 2018;15:4296-302
35. Virtanen KA, Lidell ME, Orava J, Heglind M, Westergren R, Niemi T. et al. Functional brown adipose tissue in healthy adults. N Engl J Med. 2009;360:1518-25
36. Elfving B, Bjørnholm B, Knudsen GM. Interference of anaesthetics with radioligand binding in neuroreceptor studies. Eur J Nucl Med Mol Imaging. 2003;30:912-5
37. Hassoun W, Le Cavorsin M, Ginovart N, Zimmer L, Gualda V, Bonnefoi F. et al. PET study of the [11C]raclopride binding in the striatum of the awake cat: effects of anaesthetics and role of cerebral blood flow. Eur J Nucl Med Mol Imaging. 2003;30:141-8
38. Jevtovic-Todorovic V, Boscolo A, Sanchez V, Lunardi N. Anesthesia-induced developmental neurodegeneration: the role of neuronal organelles. Front Neurol. 2012;3:141
39. Tsukada H, Nishiyama S, Ohba H, Kanazawa M, Kakiuchi T, Harada N. Comparing amyloid-β deposition, neuroinflammation, glucose metabolism, and mitochondrial complex I activity in brain: a PET study in aged monkeys. Eur J Nucl Med Mol Imaging. 2014;41:2127-36
40. Tajima K, Ikeda K, Chang HY, Chang CH, Yoneshiro T, Oguri Y. et al. Mitochondrial lipoylation integrates age-associated decline in brown fat thermogenesis. Nat Metab. 2019;1:886-98
41. Pfannenberg C, Werner MK, Ripkens S, Stef I, Deckert A, Schmadl M. et al. Impact of age on the relationships of brown adipose tissue with sex and adiposity in humans. Diabetes. 2010;59:1789-93
42. Kim Y, Kang BE, Ryu D, Oh SW, Oh CM. Comparative transcriptome profiling of young and old brown adipose tissue thermogenesis. Int J Mol Sci. 2021 22.13143
43. Yoneshiro T, Aita S, Matsushita M, Okamatsu-Ogura Y, Kameya T, Kawai Y. et al. Age-related decrease in cold-activated brown adipose tissue and accumulation of body fat in healthy humans. Obesity (Silver Spring). 2011;19:1755-60
44. Becher T, Palanisamy S, Kramer DJ, Eljalby M, Marx SJ, Wibmer AG. et al. Brown adipose tissue is associated with cardiometabolic health. Nat Med. 2021;27:58-65
45. Oberkofler H, Dallinger G, Liu YM, Hell E, Krempler F, Patsch W. Uncoupling protein gene: quantification of expression levels in adipose tissues of obese and non-obese humans. J Lipid Res. 1997;38:2125-33
46. Semple RK, Crowley VC, Sewter CP, Laudes M, Christodoulides C, Considine RV. et al. Expression of the thermogenic nuclear hormone receptor coactivator PGC-1alpha is reduced in the adipose tissue of morbidly obese subjects. Int J Obes Relat Metab Disord. 2004;28:176-9
47. Cypess AM, Lehman S, Williams G, Tal I, Rodman D, Goldfine AB. et al. Identification and importance of brown adipose tissue in adult humans. N Engl J Med. 2009;360:1509-17
48. Saito M, Okamatsu-Ogura Y, Matsushita M, Watanabe K, Yoneshiro T, Nio-Kobayashi J. et al. High incidence of metabolically active brown adipose tissue in healthy adult humans: effects of cold exposure and adiposity. Diabetes. 2009;58:1526-31
49. Zingaretti MC, Crosta F, Vitali A, Guerrieri M, Frontini A, Cannon B. et al. The presence of UCP1 demonstrates that metabolically active adipose tissue in the neck of adult humans truly represents brown adipose tissue. FASEB J. 2009;23:3113-20
50. Blondin DP, Labbé SM, Phoenix S, Guérin B, Turcotte ÉE, Richard D. et al. Contributions of white and brown adipose tissues and skeletal muscles to acute cold-induced metabolic responses in healthy men. J Physiol. 2015;593:701-14
Author contact
![]() Corresponding author: Hyewon Youn, Ph.D. Department of Nuclear Medicine, Seoul National University Hospital, #207-4 Samsung Cancer Research Bldg. 103 Daehak-No, Chongno-Gu, Seoul, 03080, Korea; Tel.: +822-3668-7026; Fax: +822-745-7690; E-mail: hwyounac.kr
Corresponding author: Hyewon Youn, Ph.D. Department of Nuclear Medicine, Seoul National University Hospital, #207-4 Samsung Cancer Research Bldg. 103 Daehak-No, Chongno-Gu, Seoul, 03080, Korea; Tel.: +822-3668-7026; Fax: +822-745-7690; E-mail: hwyounac.kr