Impact Factor
- Issue 13; 2026
- Issue 12; 2026
- Issue 11; 2026
- Issue 10; 2026
- Issue 9; 2026
- Volume 16; 2026
- Advance Articles
- Past Issues
- Cover Images
- Cover Suggestion
- Index & Coverage
- Special Issues
Introduction
Methods
Results
Discussion
Abbreviations
Acknowledgements
Supplementary Material
References
International Journal of Biological Sciences
International Journal of Medical Sciences
 Global reach, higher impact

Theranostics 2021; 11(18):9038-9053. doi:10.7150/thno.63416 This issue Cite
Research Paper
Mapping the landscape of synthetic lethal interactions in liver cancer
Chen Yang1,2*, Yuchen Guo2*, Ruolan Qian2*, Yiwen Huang3, Linmeng Zhang2, Jun Wang2, Xiaowen Huang4, Zhicheng Liu5, Wenxin Qin2, Cun Wang2 ![]() , Huimin Chen4
, Huimin Chen4 ![]() , Xuhui Ma2
, Xuhui Ma2 ![]() , Dayong Zhang1
, Dayong Zhang1 ![]()
1. Department of Clinical Medicine, School of Medicine, Zhejiang University City College, Hangzhou, China.
2. State Key Laboratory of Oncogenes and Related Genes, Shanghai Cancer Institute, Renji Hospital, Shanghai Jiao Tong University School of Medicine, Shanghai, China.
3. Department of Clinical Medicine, Fujian Medical University, Fuzhou, China.
4. Division of Gastroenterology and Hepatology, Key Laboratory of Gastroenterology and Hepatology, Renji Hospital, School of Medicine, Shanghai Jiao Tong University, Shanghai, China.
5. Hepatic Surgery Center, Tongji Hospital, Tongji Medical College, Huazhong University of Science and Technology, Wuhan, China.
*These authors contributed equally to this work.
Received 2021-6-1; Accepted 2021-8-14; Published 2021-8-26
Abstract

Almost all the current therapies against liver cancer are based on the “one size fits all” principle and offer only limited survival benefit. Fortunately, synthetic lethality (SL) may provide an alternate route towards individualized therapy in liver cancer. The concept that simultaneous losses of two genes are lethal to a cell while a single loss is non-lethal can be utilized to selectively eliminate tumors with genetic aberrations.
Methods: To infer liver cancer-specific SL interactions, we propose a computational pipeline termed SiLi (statistical inference-based synthetic lethality identification) that incorporates five inference procedures. Based on large-scale sequencing datasets, SiLi analysis was performed to identify SL interactions in liver cancer.
Results: By SiLi analysis, a total of 272 SL pairs were discerned, which included 209 unique target candidates. Among these, polo-like kinase 1 (PLK1) was considered to have considerable therapeutic potential. Further computational and experimental validation of the SL pair TP53-PLK1 demonstrated that inhibition of PLK1 could be a novel therapeutic strategy specifically targeting those patients with TP53-mutant liver tumors.
Conclusions: In this study, we report a comprehensive analysis of synthetic lethal interactions of liver cancer. Our findings may open new possibilities for patient-tailored therapeutic interventions in liver cancer.
Keywords: liver cancer, synthetic lethality, precision medicine, TP53, PLK1
Introduction
Recent rapid advances in individualized therapy have revolutionized cancer prognosis, making cancers previously considered to be lethal, such as breast cancer and lung cancer, manageable and even curable [1]. However, it remains challenging to realize individualized therapy for liver cancer. Almost all the approved therapies against liver cancer lack corresponding biomarkers for predicting efficacy and can only yield marginal survival benefit [2, 3]. Considering that the global burden of liver cancer has been increasing year over year, novel therapeutics are urgently required to counter this global health threat.
By sequencing large-scale clinical samples, the roles of many mutated genes in the occurrence and development of liver cancer have been elucidated [2]. In many cancer types, genetically targeted therapies have been successfully applied to target mutated gene products. However, unlike EGFR [4] or ALK [5] mutations in lung cancer, most liver cancer mutations are undruggable with conventional approaches. For example, TP53 mutation, the most common genetic change accounting for ~30% of all liver cancer cases, is currently difficult to target therapeutically for the immaturity of p53-targeted agonists [6]. Fortunately, an appealing concept called synthetic lethality (SL) provides a promising approach to target mutated genes previously considered to be undruggable [7]. The original concept of SL reflects relationships between two genes in which their simultaneous disruption causes cell death whereas functional loss of only one of the genes does not affect cell viability [7]. By harnessing this concept, selective elimination of cells with mutations in tumor suppressor genes (TSGs), such as TP53, can be realized using conventional chemical inhibitors. A classic example of the application of this concept is PARP inhibitors used for the treatment of tumors with BRCA mutations, which currently represent the only SL-based therapeutics approved by the United States Food and Drug Administration (FDA) [8]. Many expanded SL concepts have also been developed, such as synthetic dosage lethality [7, 9], metabolic SL [10], collateral SL [11], and conditional SL [7], offering additional possibilities for the development of SL-based therapies.
To date, many experimental and computational approaches have been adopted to screen potential SL interactions. Experimental SL screening approaches can be broadly classified into two categories: model organism-based and human cell-based screening. Model organism-based screens mainly depend on synthetic genetic array analysis [12] and diploid synthetic lethality analysis with microarrays [13], while human cell-based screens usually utilize RNA interference (RNAi) and clustered regularly interspaced short palindromic repeats (CRISPR) technologies [14, 15]. As alternatives to experimental methods, emerging computational approaches, such as DAISY [16], MiSL [17], ISLE [18], and DiscoverSL [19], can offer convenient and low-cost SL prediction. However, most established approaches utilize pan-cancer data for SL inference and do not focus on a specific cancer type. Accordingly, detailed SL interactions in liver cancer remain under-explored. To fill this gap, we propose a new approach tailored to liver cancer, termed statistical inference-based synthetic lethality identification (SiLi). Based on this approach, we determined the landscape of SL interactions in liver cancer, which might provide new opportunities for highly specific therapeutic strategies.
Methods
Clinical Data
Seven clinical cohorts of liver cancer, including TCGA-LIHC [20], LINC-JP [21], LIRI-JP [22], LICA-FR [23], KOREAN [24], LICA-CN, and CHCC-HBV [25], were included in this study, which comprised 1,825 patients from multiple geographically different origins. Of these, TCGA-LIHC, LIRI-JP, LICA-FR, and CHCC-HBV cohorts had both RNA sequencing (RNAseq) and whole genome/exome sequencing (WGS/WES) data available, while LINC-JP, KOREAN, and LICA-CN cohorts only contained WGS/WES data. Among the four cohorts with available transcriptome data, TCGA-LIHC, LIRI-JP, and LICA-FR cohorts provided raw counts of gene expression, while CHCC-HBV cohort provided fragments per kilobase per million reads (FPKM) normalized data. For consistency, both raw counts and FPKM were transformed into transcripts per kilobase million (TPM) values that were more comparable between samples. As for the mutation data, in this study, we focused on the single nucleotide variants (SNVs) and small insertions/deletions (indels). Copy number variants (CNVs) profiles were not considered due to the data limitations. Non-functional mutations, including silent mutations (synonymous mutations) and mutations in intronic or intergenic regions, were first excluded, and only cases with functional mutations were considered as gene mutation events. Samples without functional mutations or fewer than 10 mutations in gene panels were considered as outliers and discarded from downstream analyses. Genes with mutation frequencies less than 2.5% were also excluded. Loss-of-function (LOF) or inactivating mutations were defined as any truncating mutation (frameshift and nonsense mutations), the resulting proteins of which were usually nonfunctional. Duplicated mutations in each sample were merged to keep only one record. For survival analysis, three cohorts (TCGA-LIHC, LIRI-JP, and CHCC-HBV) provided follow-up information. The survival data of TCGA-LIHC cohort were achieved from the TCGA Pan-Cancer Clinical Data Resource (TCGA-CDR) [26], while the survival data of LIRI-JP and CHCC-HBV cohorts were obtained from supplementary files of reference [22, 25].
Cancer Cell Line Data
Expression profiles of human cancer cell lines were obtained from the Broad Institute Cancer Cell Line Encyclopedia (CCLE) project (based on RNAseq) [27] and the Wellcome Sanger Institute Genomics of Drug Sensitivity in Cancer (GDSC) project (based on microarray) [28]. Drug response data were achieved from the Cancer Therapeutics Response Portal (CTRPv.2.0, released October 2015) [29], GDSC1&2 (released October 2019) [28], and PRISM Repurposing dataset (19Q4, released December 2019) [30], respectively. CTRP had the sensitivity data of 481 compounds across 835 cell lines, GDSC contained the sensitivity data of 396 compounds across 773 cell lines, while PRISM included the sensitivity data of 1448 compounds across 482 cell lines. All the three datasets provided area under the dose-response curve (AUC) values as a measure of drug sensitivity, where lower AUC values indicate increased sensitivity to treatments. Notably, cell lines in CTRP and PRISM were obtained from the CCLE project, and molecular data in CCLE were thus used for CTRP and PRISM analyses. For gene dependency data, genome-wide gene dependency scores, including CERES scores from CRISPR knockout screens and DEMETER scores for RNAi screens, were downloaded from the Cancer Dependency Map (DepMap) portal [31, 32]. Lower CERES or DEMETER scores indicate that corresponding genes are more likely to be essential in cell growth and survival.
Driver Genes Detection
DriverNet algorithm was utilized to discern potential driver genes of liver cancer [33]. By exploiting influence graph, this algorithm integrates genome and transcriptome data to evaluate the driver mutation probability. The input files of DriverNet include an influence graph, a mutation matrix, and a corresponding gene expression matrix. In this study, the influence graph was constructed using an updated protein functional interaction network (Version 2019, Reactome) [34]. The output of DriverNet is the significance of imported genes. Genes with adjusted P < 0.05 were deemed significant. To determine whether our prediction was reliable, we compiled a comprehensive list of liver cancer-associated driver genes from 14 previously published studies and compared our prediction with previous results. Since we only focused on tumor suppressor genes (TSGs) among these driver genes, 20/20 rule was adopted to further filter out oncogenes [35]. Briefly, we defined those genes containing >20% LOF mutations as potential tumor suppressors, which were used to construct subsequent TSG-target network.
Network-Based Stratification
Based on the mutation profiles of driver genes, network-based stratification (NBS) was conducted to identify classifications of liver cancer [36]. This algorithm is currently implemented in Python package called pyNBS (based on Python 2.7.2), which runs much faster than its original MATLAB-based version [37]. The input data of NBS analysis include a high-quality cancer reference network (CRN) provided by the new NBS study [37] and a mutation matrix of driver genes. The resulting data contain the clustering information and corresponding consensus matrix. The number of clusters k was varied from 2 to 5. To evaluate the robustness of classifications, we further calculated the cophenetic correlation coefficient based on the resultant consensus matrix using the NMF R package. The k value that resulted in the maximum cophenetic correlation coefficient was considered as the optimal number of clusters. Through conducting nearest template prediction (NTP) analyses (Gene Pattern modules), we compared our results with previously published results, including classifications by Boyault et al. (G1-G6) [38], Chiang et al. (Five subclasses) [39], Hoshida et al. (S1-S3) [40], Désert et al. (Four subclasses) [41], and Yang et al. (C1-C3) [42].
Collection of Drug Targets
Currently, not all human proteins are druggable and only less than 20% of them can be targeted using traditional small molecule agents [43]. Therefore, to identify genes with potential therapeutic implications, we only focused on druggable targets (DTs) and used them to construct TSG-DT network. Target information was derived from two sources, namely the Drug Repurposing Hub [44] and DrugBank [45]. The Drug Repurposing Hub contains 6125 compounds with corresponding 2249 target genes, while DrugBank compiles 5514 compounds and 2724 target genes. The target information in DrugBank was extracted from the fulldatabase file (XML format) using XML and dbparser packages. After removing duplication, a total of 3194 druggable genes were identified. Notably, for establishing the TSG-associated SL network, target genes whose mechanism of action (MOA) was denoted as an agonist were excluded.
Mutual Exclusivity Analysis
The analysis was performed on the basis of 1825 patients with available genomic data using discover R package. Gene pairs with adjusted P < 0.15 or nominal P < 0.05 were considered significant. Mutual exclusivity-based SL network was visualized using Cytoscape software (version 3.7.1) [46]. The annotation of TSG and target genes were also presented in the network graph.
Functional Similarity Analysis
Functional similarity (FS) scores between gene pairs were calculated based on the semantic similarities in molecular function (MF) and cellular component (CC) aspect of the gene ontology (GO) terms, which can take both function and location of genes into account [47]. The FS score for a gene pair is given as:

Semantic similarities in MF (SimMF) and CC (SimCC) were measured based on the GO topological structure through using GOSemSim package [48]. Gene pairs with FS scores >0.5 were considered to have high functional interactions.
Rank Aggregation Analysis
Rank aggregation analysis was conducted to obtain a robust ranking of resultant SL pairs based on the ranking results from multiple sources. An order statistics-based method proposed by Stuart et al. was utilized to perform this analysis [49]. The output scores of this method were probabilities. We then defined the rank aggregation score (RAS) as follows:
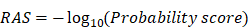
The resulting RAS was then used to determine a final ranking of candidate SL pairs. A higher RAS indicated a more concordant high ranking.
Predicting Drug Sensitivity in Clinical Samples
Either CCLE or GDSC projects only measured the drug response data in less than 20 liver cancer cell lines, the limited number of which might diminish statistical power and interfere with meaningful conclusions of downstream analyses. Previous studies have demonstrated that drug response in clinical samples can be estimated using data from in vitro cell line experiments [50, 51]. Therefore, we intended to perform drug response prediction based on the actual drug sensitivity and molecular data, which could to some extent tackle the problem of limited cell line number. Herein, the ridge regression model, which was considered an efficient and effective method in the previous report, was utilized to conduct transcriptome data-based drug response prediction [52]. Based on the expression and drug response data of solid cell lines from CCLE and GDSC projects (excluding hematopoietic and lymphoid tissue-derived cell lines), this predictive model was trained with a satisfied predictive accuracy evaluated by default 10-fold cross-validation and applied to the clinical samples to achieve the estimated drug response values. The drugs were mapped to their targets for constructing the TSG-DT-drug network.
Enrichment Analysis
To functionally describe the gene set of interest, we conducted the hypergeometric test using the clusterProfiler package based on the hallmark definitions (h.all.v7.0.symbols) downloaded from the Molecular Signatures Database (MSigDB) [53]. The resulting P values from the hypergeometric tests were adjusted for multiple comparison testing and adjusted P < 0.05 were considered significant. The adjusted P values were then transformed to -log10(P) and visualized as bar plots.
Human Cell Lines and Compounds
The human HCC cell lines, HEP3B217, HUH7, HEPG2, SNU398, SNU878, HUH6, SKHEP1 and PLCPRF5, were provided by Erasmus University (Rotterdam, Netherlands). MHCC97H were provided by the Liver Cancer Institute of Zhongshan Hospital (Shanghai, China). These cells were maintained in Dulbecco's modified Eagle's medium (DMEM) (Gibco, Carlsbad, CA) supplemented with 10% fetal bovine serum (FBS) (Gibco) and 1% penicillin/streptomycin (BasalMedia), incubated at 37 °C in humidified atmosphere with 5% CO2. Mycoplasma contamination was excluded via a PCR-based method. The information of TP53 mutation status of cell lines used in this study was achieved from our previous publication [54]. The identities of all the cell lines were confirmed by short tandem repeat (STR) profiling. Volasertib (S2235) and GSK461364 (S2193) were purchased from Selleck Chemicals and dissolved in dimethyl sulfoxide (DMSO) using a storage concentration of 10 mM.
Cell Proliferation Assays
For long-term cell proliferation assay, cells were seeded into six-well plates (2-3×10⁴ cells per well) and agents or vehicle control was added after 24 hours. Cells were treated with agents as indicated for 10-14 days during which the culture media were replaced every three days. Afterwards, cells were stained with 1% crystal violet for 30 minutes and rinsed with tap water. Pictures were taken using ImageScannerTM III (GE Healthcare) at 300 dpi resolution. In order to obtain the quantitative results of long-term cell proliferation assays, crystal violet was solubilized using 33% glacial acetic acid for 20 min and the absorbance was measured at 590 nm. For short-term assays, cells were seeded into 96-well plates (2-3×10³ cells per well) and were treated with agents for 72 hours. Then, cell viability was measured using CellTiter-Blue (CTB) assay (Promega) according to the manufacturer's recommendations. Experiments were performed in triplicate.
Cell Apoptosis Assays
To visualize Caspase 3/7 activity, IncuCyte Caspase-3/7 green apoptosis assay reagent was added to the culture medium and images of phase and fluorescence were captured in IncuCyte ZOOM system (Essen Bioscience). Cell apoptosis was analyzed based on green fluorescent staining of apoptotic cells.
Statistical Analysis
Unless stated otherwise, all the computational analyses and graphical visualization were performed in R statistical software (v.3.6.0, R Core Team, R Foundation for Statistical Computing, Vienna, Austria). Comparison of a continuous variable in two groups was performed using either parametric test (Student's t-test) if the variable was normally distributed or nonparametric test (Wilcoxon rank-sum test). Similarly, correlation between two continuous variables was measured by either Pearson's r correlation or Spearman's rank-order correlation. Contingency table variables were analyzed by Fisher's exact tests. The hazard ratio (HR) was estimated using a Cox regression model by R package survival. Survival curve was carried out using Kaplan-Meier methods and the log-rank (Mantel-Cox) test was used to determine the statistical significance of differences. The Benjamini-Hochberg method was applied for multiple testing correction. A two-tailed P < 0.05 was considered statistically significant unless indicated otherwise.
Results
The SiLi Pipeline
SiLi is a computational pipeline for statistically inferring candidate SL interactions using high-throughput clinical data sets, drawing on experiences from several previous approaches such as DAISY [16], MiSL [17], ISLE [18], and DiscoverSL [19]. This computational pipeline includes five inference steps: (1) functional similarity analysis, (2) differential gene expression analysis, (3) pairwise gene coexpression analysis, (4) pairwise survival analysis, and (5) rank aggregation analysis. The detailed procedures are described as follows:
- The strategy for functional similarity analysis is based on the notion that genes with SL interactions tend to engage in closely related biological processes and accordingly their location in the GO topological structure should be close (Figure 1A) [16]. We defined FS score as the geometric mean of semantic similarities between MF and CC. Gene pairs with FS scores ≤ 0.5 were considered to have low functional similarity and were filtered out from the list of candidate SL pairs.
- The strategy for differential gene expression analysis is motivated by the assumption that if a certain gene loses its function due to mutation, tumors may increase the expression of its SL partners as a compensatory mechanism (Figure 1A). This hypothesis was adopted in multiple earlier studies to search for potential SL interactions [17, 55]. We conducted differential expression analysis using Wilcoxon rank-sum test between samples with and without functional TSG mutations, and only genes with significantly higher expression in mutated samples were deemed potential SL partners of corresponding TSGs.
- The strategy for pairwise gene coexpression analysis is based on the analogous notion of functional similarity, that is, SL pairs tend to have a similar function and hence are more likely to be coexpressed (Figure 1A) [16]. Gene pairs with significant correlation (Spearman's correlation coefficient > 0.15 and adjusted P < 0.05) were considered to be potential SL pairs.
- The strategy for pairwise survival analysis assumes that co-inactivation of paired genes would reduce tumor fitness and consequently patients with co-inactive SL pairs are more likely to exhibit significantly better outcomes than patients without co-inactivation (Figure 1A) [18, 56]. Due to data limitations, we mainly used expression data to define inactive/active gene status, and a gene was considered to be inactive in a sample if its gene expression was below the median across all samples. Gene pairs that could lead to significantly better prognosis for patients with co-inactivation than patients without co-inactivation were retained for subsequent analysis (P < 0.05).
- Only gene pairs that passed all four procedures described above were taken as candidate SL pairs and utilized for constructing the TSG-DT network. Rank aggregation analysis using Stuart's method was then conducted to rank the resultant SL candidates [49].
Study overview. (A) Schematic representation of the concept of synthetic lethality. (B) Flow chart of the SiLi pipeline developed for inferring synthetic lethal interaction in liver cancer.
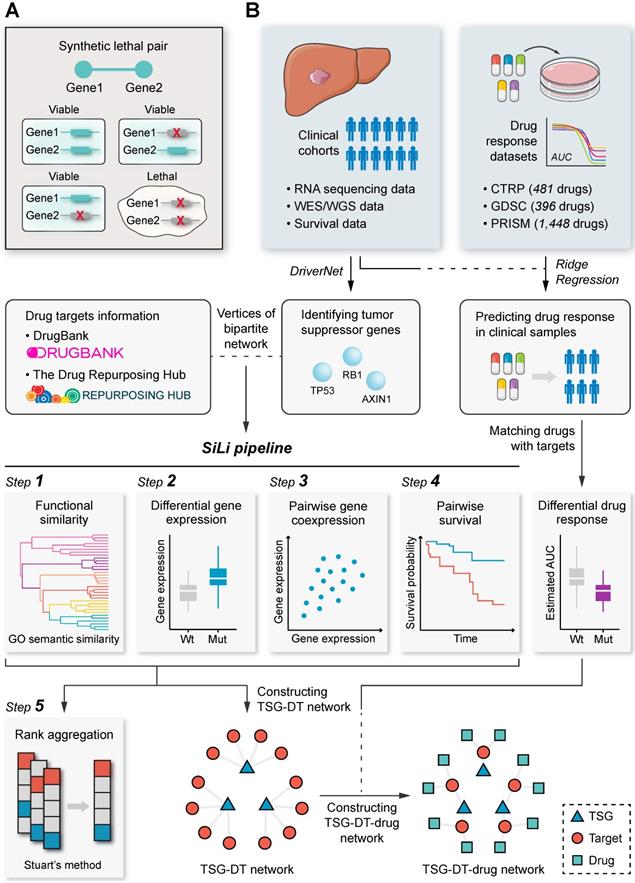
A schematic diagram of the procedures of SiLi and the overall study design is presented in Figure 1B.
A Brief Illustration and Validation of SiLi
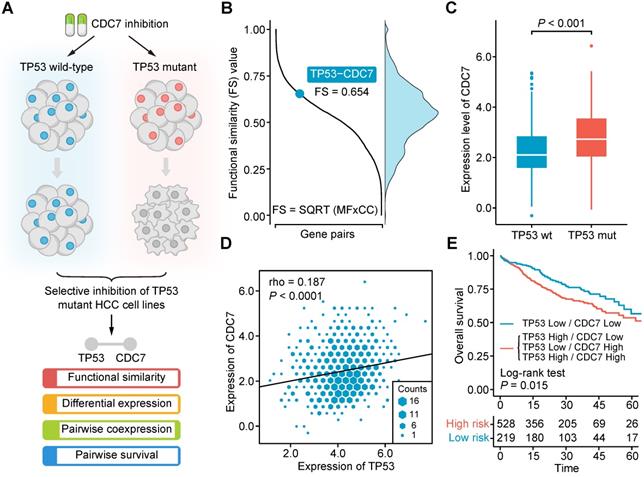
In our recent work, we found that CDC7 inhibitors could selectively suppress the growth and proliferation of TP53-mutant liver cancer cell lines, suggesting that an SL interaction may exist between TP53 and CDC7 in liver cancer (Figure 2A) [54]. By exploiting this finding, we intend to briefly exemplify the practical application of SiLi as well as examine whether the theoretical assumptions used for the development of SiLi hold in this real SL interaction. Functional similarity analysis gave an FS score of 0.654 for the TP53-CDC7 pair, higher than the threshold (0.5) we set (Figure 2B). Differential analysis of CDC7 expression between TP53-mutant and TP53 wild-type samples suggested a significant difference between the two groups, with higher CDC7 expression in the TP53-mutant samples than the TP53-wild-type samples (P < 0.001) (Figure 2C). Coexpression analysis indicated that TP53 and CDC7 were significantly positively correlated (P < 0.0001), and the Spearman's correlation coefficient value (0.187) was also higher than our threshold (0.15) (Figure 2D). In the pairwise survival analysis, we observed that patients with co-inactivation of TP53 and CDC7 had significantly better survival outcomes than patients without co-inactivation (P = 0.015) (Figure 2E). Generally, these analysis results not only display the procedures of SiLi intuitively but also demonstrate the rationality of the SiLi pipeline design to some extent.
Computational validation of the synthetic lethal interaction between TP53 and CDC7. (A) Schematic diagram of the experimental finding of TP53-CDC7 interaction. (B) The distribution of functional similarity scores among different gene pairs and the illustration of the functional similarity score of TP53-CDC7 gene pair. (C) Differential gene expression of CDC7 between TP53-mutant and TP53-wild-type samples. Statistical significance of expression difference was determined using Wilcoxon rank-sum test. (D) Correlation of the gene expression between TP53 and CDC7. Spearman correlation coefficient is indicated on the top left of the plots. (E) Survival difference between the groups with and without co-inactivation of TP53 and CDC7.
Determination of Driver Genes in Liver Cancer
Not all gene aberrations are related to tumorigenesis and tumor progression; some aberrations occur randomly, which are termed 'passengers' [35]. Only a small number of aberrations, called 'drivers', possess the ability to confer selective advantages to tumor cells [35]. Therefore, therapeutic strategies that target driver genes are more likely to have clinical significance. Currently, a plethora of algorithms based on various statistical principles have been developed to discern candidate driver genes [57]. Of these, mutation frequency-based algorithms, such as MuSiC and MutSigCV, are the most commonly used approaches, and have been adopted by the majority of large-scale clinical studies focused on liver cancer [20, 23, 24]. To identify candidate drivers, we applied a network-based method, DriverNet, to the currently most comprehensive metadata set of liver cancer, which includes 849 patients with liver cancer from four clinical cohorts with both expression and mutation data available (Figure 3A) [33]. Batch effects were removed to ensure comparability between different cohorts (Figure S1A). This analysis yielded 34 genes with q < 0.05. Of these, 25 genes (73.5%) have been reported by at least one previous study as driver candidates, which demonstrates the reliability of our prediction (Figure 3B and Table S1). These 25 genes were considered robust drivers of liver cancer and used for subsequent analysis.
Identification of driver genes in liver cancer. (A) Summary of included clinical cohorts for DriverNet analysis. (B) Comparison between driver genes identified in this study and that reported by previous studies. (C) The mutation distribution of subclasses identified by network-based stratification. Statistical significance of difference was determined using Fisher's exact tests. Only statistically significant genes were labelled in the figure. Previously reported transcriptome-based molecular classifications were presented on the bottom of the plot. (D) Survival difference between three NBS subclasses. The statistical significance was determined by log-rank (Mantel-Cox) test.
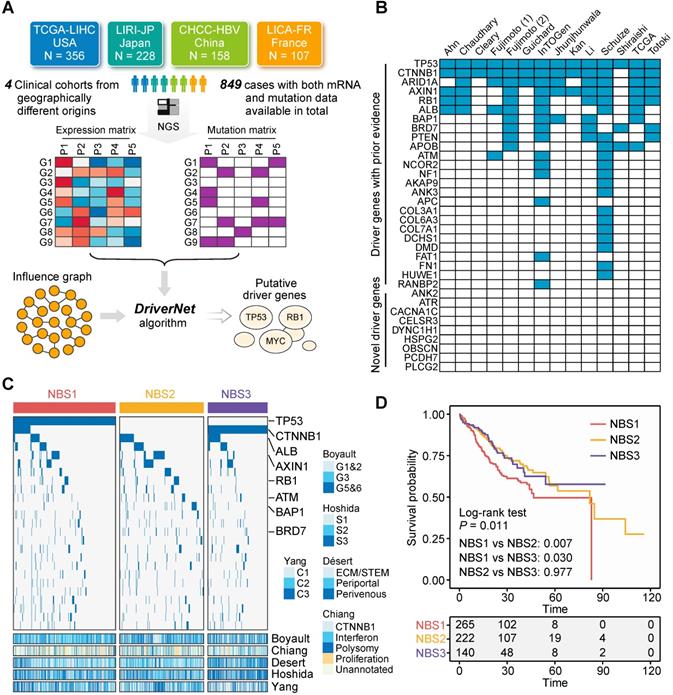
To demonstrate the clinical implications of these driver genes, we next classified their mutation profiles using the NBS algorithm [36]. According to their cophenetic correlation coefficients, patients were assigned to three subclasses (Figure S1B and S1C). Each subclass had distinguishing mutation features. NBS1 and NBS2 exhibited a higher proportion of TSG mutations (the identification of TSGs is presented below), including TP53, AXIN1, RB1, BAP1, and BRD7, while NBS3 was characterized by a high mutation frequency of CTNNB1 and low mutation frequency of TSGs (Figure 3C). Based on this result, NBS1 and NBS2 were defined as TSG-enriched subclasses. NBS classification was also associated with previously reported transcriptome-based classification. Taking the subclass NBS3 as an example, it was linked to Désert's perivenous (P < 0.001) [41] and Hoshida's S3 (P < 0.001) [40] subclasses. In addition, survival analysis indicated that there was a significant difference in survival outcome among the three NBS subclasses, and NBS1 exhibited a worse prognosis than either NBS2 (P = 0.007) or NBS3 (P = 0.030) (Figure 3D). In summary, the above results provide insight into driver gene-based clinical categorization of patients with liver cancer and hold the potential to guide further investigations of individualized therapies.
Selection of Tumor Suppressors and Druggable Genes
Driver genes can be further classified into two classes: TSGs and oncogenes. Most alterations in TSGs cause loss of gene functions, while alterations in oncogenes tend to be gain-of-function mutations [35]. The functional differences between these two driver gene classes could lead to distinct strategies for inferring their SL partners. Herein, motivated by the 20/20 rule, we defined those drivers containing more than 20% LOF mutations as potential TSGs [35]. According to this principle, 14 of the 25 genes were deemed TSGs, which were then examined manually to guarantee a credible result (Figure S2A). We further investigated the mutation distribution of TSGs and oncogenes. The proportion of cases with at least one TSG mutation (70.67%) was higher than the proportion of cases with at least one oncogene mutation (48.41%), suggesting that therapeutics focused on TSGs might cover more patients with liver cancer than therapeutics focused on oncogenes (Figure S2B). However, most of current molecular targeted therapies exert their function through inhibiting a hyperactivated oncogene rather than restoring an inactivated TSG [6]. Fortunately, SL offers an alternative means to indirectly target TSGs. Based on these considerations, we subsequently focused on interrogating SL partners of the 14 identified TSGs.
Another critical problem is that not all identified SL partners of TSGs can be druggable if SL inference is performed in a genome-wide level [43]. Therefore, to ensure that all candidate genes can be targeted using conventional chemical agents, we compiled a list of 3194 druggable genes and limited the SL candidates to these genes. Accordingly, the SL network is a bipartite network, constructed on the basis of 14 TSGs and 3194 druggable genes.
Inference of TSG-DT interactions
Based on the concept that simultaneous mutation of two genes in an SL pair influences cellular processes and causes cell death, mutual exclusivity analysis can be adopted to discover potential SL interactions [58-60]. For conducting this analysis, we collected seven clinical cohorts with available WES/WGS data, comprising 1825 patients with liver cancer (Figure S3A). With the threshold for significance set to adjusted P < 0.15, only 18 mutually exclusive gene pairs were identified. If we further limited these gene pairs to TSG-DT interactions, only 4 gene pairs were left (Figure S3B). To identify more mutually exclusive pairs, we relaxed the threshold to nominal P < 0.05. Under this condition, a total of 325 mutually exclusive pairs and 67 TSG-DT pairs were identified (Figure S3C), which we believe is still limited for further screening. Although mutual exclusivity analysis has been adopted by multiple studies to infer candidate SL interactions, this analysis might not be a suitable option in liver cancer, given the relatively sparse mutation profiles of this cancer type [19, 59, 61]. In summary, these results support the rationality of excluding mutual exclusivity analysis from the SiLi pipeline.
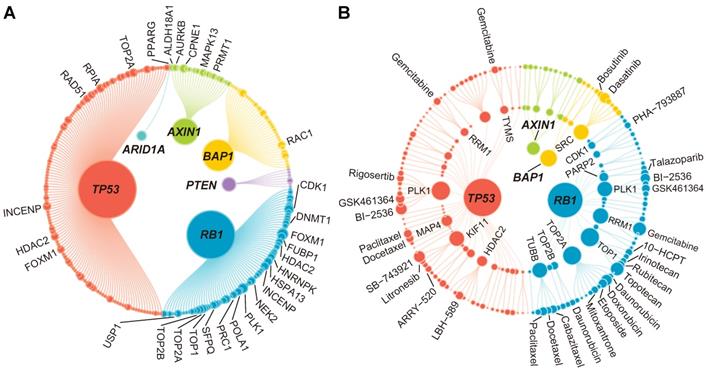
Taking the 14 TSGs and 3194 druggable genes identified above as the basis, the first four steps of SiLi, including functional similarity analysis, differential gene expression analysis, pairwise gene coexpression analysis, and pairwise survival analysis, were conducted to infer TSG-DT pairs with potential SL interactions. A total of 272 TSG-DT pairs (including 209 unique targets) passed the four screening steps and were considered SL candidates for liver cancer (Table S2). These SL candidates are visualized in a bipartite network graph in Figure 4A.
The results of the identification of SL interactions. (A) A bipartite network of 272 TSG-DT interactions. The node size is proportional to the node degree. Only top 30 TSG-DT pairs with highest RAS scores are marked on the plot. The detailed information is presented in Table S2. (B) A bipartite network of 165 TSG-DT-drug interactions. For nodes in the inner layers, the node size is proportional to the node degree. For nodes in the outer layer, the node size is proportional to the fold change values of differential response analysis. Only top 30 TSG-DT-drug pairs with highest fold change values are marked on the plot. The detailed information is presented in Table S2.
Subsequently, in order to obtain a ranking of the 272 TSG-DT pairs, rank aggregation analysis was performed to integrate the SiLi results. Briefly, the TSG-DT pairs were firstly ranked based on their FS scores (functional similarity), fold change values (differential expression), correlation coefficients (pairwise coexpression), and hazard ratios (pairwise survival). Then, Stuart's method was applied to integrate all these rankings and calculate the RAS of each TSG-DT pair (Figure S4A and Table S3) [49]. We considered that TSG-DT pairs with high RASs were more likely to have SL interactions.
The SL candidates in this study were compared to those inferred in other studies to evaluate our prediction results. Due to the deficiency of studies focused on investigating liver cancer-specific SL pairs, we compared our results with those from pan-cancer or other tumor-associated studies, including studies by Wang et al. [55], Kranthi et al. [62], Ye et al. [59], and Jerby-Arnon et al. [16]. The comparison results suggest that the overall consistency between different predictions is quite poor. Only 3.68% (10 pairs) of our prediction overlapped with other results (Figure S4B). We suppose that the different inference procedures, as well as input data, might be the major contributors of the discrepancy.
Extension of TSG-DT interactions to TSG-DT-drug interactions
By leveraging pharmacogenomic data from CTRP [29], GDSC [28], and PRISM [30] datasets and integrating drug information into the TSG-DT network, we intended to further construct a TSG-DT-drug network, which might possess relatively direct and practical clinical implications. Regardless of duplication, a total of 1986 unique drugs were included in this study. Estimated drug response in clinical samples could be obtained by constructing ridge regression model based on actual drug sensitivity and expression data from cell lines. The reliability of this approach has been validated computationally and experimentally in our previous publication [51]. Next, according to target annotation, 1986 drugs were mapped to 209 unique targets in the TSG-DT network, which retained 381 DT-associated drugs. To further connect TSGs with these DT-associated drugs, differential drug response analysis was conducted between samples with and without TSG mutations. Only drugs with significantly lower estimated AUC values in mutated samples were considered to be SL-associated drugs. This analysis yielded 165 TSG-drug pairs (without removing duplication from different datasets) and 62 TSG-DT pairs (Table S2). These pairs are visualized in a TSG-DT-drug network graph in Figure 4B. Considering that the 1986 drugs could only cover 96 of 209 (45.9%) targets inferred by SiLi, this step was taken as an extension rather than a further screening to avoid potential bias.
Characterization of Target Genes in the TSG-DT Network
As mentioned above, there are 209 unique target genes in the 272 TSG-DT pairs. To evaluate the clinical and biological significance of these genes, we carried out comprehensive analyses using clinical data from the metadata set and gene dependency data from CRISPR and RNAi screens. The biological processes related to the 209 targets were first characterized by enrichment analysis. Most of the significantly enriched processes, such as E2F targets, G2M checkpoint, and MYC targets V1, were associated with cell proliferation, and were generally consistent with the function of their SL partners (Figure 5A). Next, the expression differences of these genes between tumor and normal tissues were investigated. Differential genes were identified by adjusted P < 0.01 and |log2(fold change)| > 1. As expected, all the differential target genes exhibited higher expression levels in tumor tissues than normal tissues (Figure 5B and Table S4). Cox proportional hazards regression analysis was also performed to reveal their association with survival outcome. The result suggests that all the significant genes (207 of 209) are associated with unfavorable prognosis (hazard ratio > 1) (Figure 5C and Table S5). These findings demonstrate that the clinical phenotypes of these 209 genes are compatible with their roles as potential targets for inhibitors.
Clinical and biological characteristics of resulting 209 unique targets. (A) The results of enrichment analysis based on 209 target genes using 50 hallmark gene sets. (B) Differential expressed genes between tumor tissues and normal tissues. The 209 targets were marked on the plot. (C) The survival association of 209 target genes determined by cox proportional hazards regression analysis. (D) The difference of CRISPR-based gene dependency scores between target set and random set. (E) The difference of RNAi-based gene dependency scores between target set and random set. Statistical significance of expression difference was determined using Wilcoxon rank-sum test. (F) Schematic plot of the biological relationship between TP53 and PLK1. (G) The CRISPR-based gene dependency scores of PLK1 across 20 liver cancer cell lines. (H) The RNAi-based dependency scores of PLK1 across 17 liver cancer cell lines.
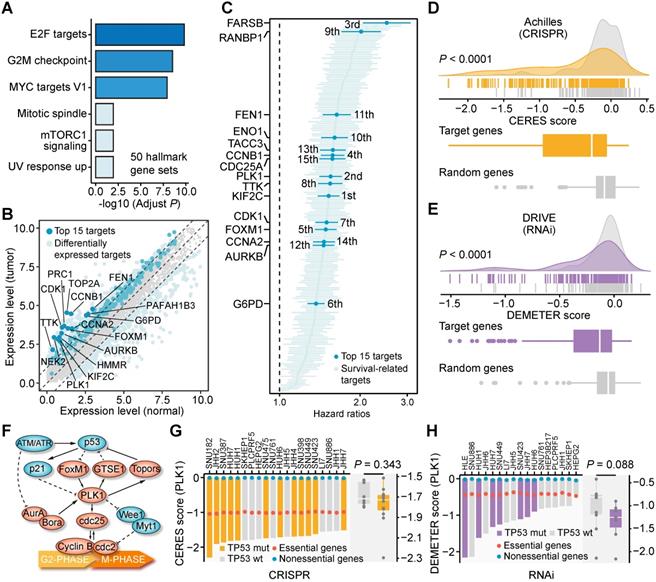
Furthermore, the dependency of the target genes across liver cancer cell lines was also explored. We first generated a random gene set of the same size (209) and then compared the dependency scores of the target set and the random set. The target set had significantly lower dependency scores than the random set using either CRISPR-based data (Figure 5D) or RNAi-based data for comparison (Figure 5E), which means that liver cancer cell lines are more likely to depend on these 209 genes for their survival and growth. The dependency rankings of the 209 genes were also calculated (Figure S5A and S5B, Table S6). Overall, the above analysis results systematically depict the characteristics of the 209 genes and preliminarily unveil their potential as novel therapeutic targets for treating liver cancer.
Identification of Novel Therapeutics for TP53-mutant Liver Cancer
The rankings of the 209 target genes varied greatly when different analysis results were used for ranking. Among the targets, we noticed that polo-like kinase 1 (PLK1) was a relatively top-ranked target in multiple analyses (differential expression analysis: 11th; survival analysis: 2nd; CRISPR-based dependency: 14th; RNAi-based dependency: 7th). Also, two PLK1-engaged gene pairs, RB1-PLK1 and TP53-PLK1, are highly ranked among the 272 TSG-DT pairs (RB1-PLK1: 4th; TP53-PLK1: 47th) (Figure S4A). Accordingly, the target PLK1 was selected for further validation of its therapeutic potential in liver cancer. Given that the low mutation frequency of RB1 (4.83%) (Figure S2B) is neither conducive to subsequent experimental validation (Hep3B is the only RB1-mutated liver cancer cell line recorded in CCLE) nor favorable for its potential clinical application, we selected the TP53-PLK1 for subsequent validation.
TP53 and PLK1 collectively participate in the cell cycle process (Figure 5F) [63]. To delineate the relationship between TP53 and PLK1 in liver cancer, the dependency scores of PLK1 across TP53-mutant and TP53-wild-type liver cancer cell lines were analyzed (Figure 5G and 5H). Cell lines with TP53 mutations showed a trend toward lower PLK1 dependency scores, albeit not statistically significant. Many small molecule inhibitors targeting PLK1 are currently available. The results of in silico analysis suggested that TP53 mutation could lead to higher sensitivity of tumors to treatment with multiple PLK1 inhibitors (Figure 6A). The current clinical status and target specificity of these PLK1 inhibitors were presented in Figure 6B [44]. Among them, volasertib was selected for further experimental validation for its late-phase clinical status and high target specificity. Long-term cell proliferation assays were first performed using nine liver cancer cell lines (Figure 6C). The quantitative results showed that, under the condition of different treatment concentrations, volasertib all exhibited a stronger antitumor activity on TP53-mutant cell lines than on TP53-wild-type cell lines (Figure 6D). We further conducted short-term CTB-based viability assays to validate this result (Figure S6). It could be observed that the cell viability of TP53-mutant cell lines were significantly lower than that of TP53-wild-type cell lines, consistent with the results from long-term assays (Figure 6E). Aside from volasertib, another PLK1 inhibitor named GSK461364 was also used to perform additional validation. Similarly, the treatments of GSK461364 had preferential growth inhibitory activity on TP53-mutant cells than TP53-wild-type cells as well, which further demonstrated the reliability of our findings (Figure S7A-C and Figure S8).
Investigations of the roles of PLK1 inhibition as a novel therapeutic strategy of liver cancer. (A) The results of differential drug response analyses. The PLK1 inhibitors with significant response differences between TP53-mutant and wild-type groups were labeled on the plot. (B) The information of clinical status and target specificity of included PLK1 inhibitors. (C) Long-term cell proliferation assays were conducted based on six TP53-mutant cell lines (SNU398, SNU878, MHCC97H, HEP3B217, HUH7, and PLCPRF5) and three TP53-wild-type cell lines (SKHEP1, HEPG2, and HUH6) treated with volasertib using gradient concentrations (6.25nM, 12.5nM, 25nM, and 50nM). (D) Quantitative results of long-term cell proliferation assays of volasertib. The point represents the mean value and the error bar indicates the standard deviation. (E) Comparison of CellTiter-Blue assay-based cell viability between TP53-mutant and TP53-wild-type cell lines treated with volasertib using two different concentrations (6.25nM and 12.5nM). (F) Representative Incucyte images of caspase-3/7 green assays of liver cancer cell lines treated with volasertib and GSK461364 (scale bars: 100 µm). Based on the results from cell proliferation assays, 12.5nM was chosen for volasertib treatment while 6.25nM was chosen for GSK461364 treatment. (G) Quantitative comparison of caspase-3/7 green assays between TP53-mutant and TP53-wild-type cell lines. Statistical significance of difference was determined using Student t-test (***P < 0.001, ****P < 0.0001).
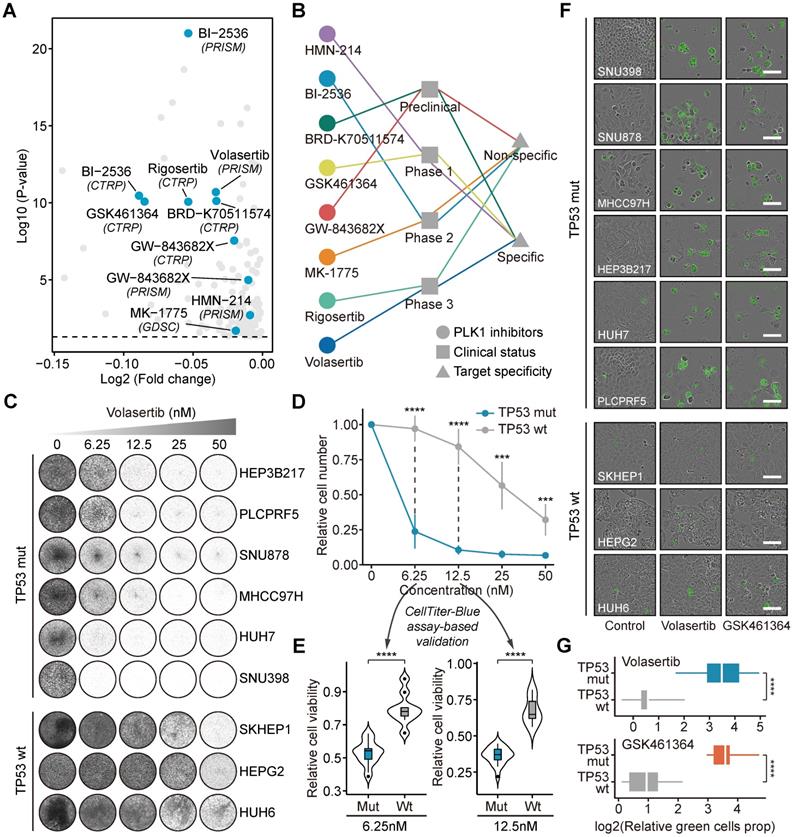
Concurrently, to explore the effects of PLK1 inhibitors on the apoptosis pathway, we performed caspase 3/7 assays, in which apoptosis activation is proportional to the intensity of green fluorescence (Figure 6F). TP53-mutant cell lines exhibited stronger green fluorescence than TP53-wild-type cell lines, indicating that PLK1 inhibitors might have a stronger ability to induce apoptosis upon TP53 mutation (Figure S9 and Figure 6G). Overall, the consistent results from in silico prediction and in vitro experiments demonstrate the potential of targeting PLK1 for treating liver cancer.
Discussion
Current therapeutic strategies against liver cancer still follow the principle of “one size fits all” with low overall response rates [3]. Due to the absence of FDA-approved agents that can specifically target genetic aberrations, individualized treatment of liver cancer has lagged far behind other cancers [3]. Recently, the selective FGFR4 inhibitor fisogatinib has presented some promising results in phase I/II clinical trials and brought new therapeutic opportunities to liver cancer [64]. However, considering that the target population of fisogatinib is limited to patients with either genomic amplification or upregulated expression of FGF19, this therapy can only cover <30% of all liver cancer cases [64]. According to our finding, >70% of liver cancer patients harbored at least one TSG mutation. Nevertheless, effective therapies targeting patients with TSG mutations remain largely unexplored [3]. Aiming to fill this knowledge gap, we proposed the SiLi pipeline and thereby determined 272 TSG-DT pairs with potential SL interactions in liver cancer. Further, we extended these TSG-DT interactions to TSG-DT-drug interactions that had more direct clinical significance. Theoretically, the vast majority of patients with liver cancer can be covered by SL-based therapeutic strategies and our findings could provide novel insights into personalized liver cancer treatment.
There are two main types of computational approaches to inferring SL interactions: statistical approaches and machine learning approaches [65]. Statistical approaches, such as the previously reported DAISY [16] and ISLE [18] and our SiLi, use biological hypothesis-based statistical tests to predict SL pairs, which are relatively convenient and flexible. In comparison, machine learning approaches require prior knowledge of SL interactions for training prediction models. Taking DiscoverSL as an example, this approach applies a random forest classifier to determine whether SL pairs of interest are meaningful [19]. Before the prediction, the random forest model needs first to be trained on validated positive/negative SL pairs using statistical tests-based features as independent variables. New SL interactions can then be predicted based on the trained random forest model [19]. Evidently, the development of machine learning approaches relies on a sufficient number of previously validated SL pairs. In the absence of training data, adopting statistical approaches should be a preferable option.
The specific procedures adopted by various statistical approaches also vary substantially. Many established approaches integrate analyses of functional genetic screening data into their pipelines [16, 60]. This procedure was not adopted in SiLi since the insufficient number of cell lines with available gene dependency data could limit the statistical power and thus affect the final prediction results. Another common inference procedure adopted by many statistical approaches is mutual exclusivity analysis [19, 59, 61]. This procedure, according to our findings, is also not applicable to liver cancer due to the sparsity of the mutation profiles. In general, among the numerous approaches developed to date, SiLi is the only one tailored specifically to liver cancer data. Notably, SiLi can also be applied to other cancers that have similar data characteristics as liver cancer.
Among the 272 identified TSG-DT gene pairs, TP53-PLK1 exhibits several advantageous biological and clinical properties. Thus, it was selected to be further investigated for its therapeutic implication. The relationship between p53 and PLK1 has been described in a previous study [63]. Specifically, both p53 and PLK1 engage in the cell cycle process (Figure 5F). The roles of p53 that induce cell cycle arrest rival the functions of PLK1 that promote cell cycle progression [63]. Expression of PLK1 is indirectly repressed by p53 through multiple processes, and suppression of PLK1 through p53 is a crucial mechanism that cells use to prevent abnormal overcoming of cell cycle arrest [63]. Mutation or loss of TP53 can lead to upregulation of PLK1 expression, thereby promoting a hyperproliferative phenotype [63]. Among patients with primary breast cancer, patients with TP53-mutant tumors expressing PLK1 have been found to exhibit a poorer survival outcome than patients having either PLK1 expression or TP53 mutation alone [66]. Since intact p53 may reduce the sensitivity of tumor cells to selective PLK1 inhibition by suppressing the basal level of PLK1, cells with TP53 mutations may have a greater susceptibility to PLK1 inhibition, which was reported in a prior study [67]. Although a very recent study presented a preliminary finding that TP53-mutant Huh7 cells were more sensitive to PLK1 inhibitors than TP53-wild-type HepG2 cells, systematic analyses have not yet been conducted to characterize PLK1 as a specific target and PLK1 inhibitors as selective therapeutics of TP53-mutant liver cancer [68]. In this study, utilizing public data from clinical cohorts and functional genetic screens, we comprehensively investigated the potential therapeutic role of PLK1 in liver cancer. The significant clinical implications and the high cell dependencies both suggest that PLK1 can be a promising therapeutic target in liver cancer. Comparisons of the estimated drug response of TP53-mutant and TP53-wild-type samples to several PLK1 inhibitors showed that PLK1 inhibitors tended to have lower estimated AUC values (higher sensitivity) in the TP53-mutant group than those in the TP53-wild-type group. Considering that the estimated drug response cannot represent the actual case, we further conducted in vitro experiments across nine liver cancer cell lines to validate the in silico results. As expected, the experimental results showed a good agreement with the computational results, collectively demonstrating that inhibition of PLK1 has the potential to be a novel and selective anti-liver cancer strategy.
This study has several limitations. First, the identification of liver cancer-specific SL interactions relied on only three types of data, namely expression data, SNVs/indels-based mutation data, and survival data, without the involvement of CNVs profiles due to the data limitation. Since CNVs are also closely associated with the gain/loss of function of corresponding genes, the exclusion of CNV data might affect the accuracy of the SL prediction. Generally, currently available resources are insufficient for carrying out multiple omics-based analyses in a large-scale metadata set of liver cancer. With more and more high-throughput sequencing data becoming available, the results of this work should be validated and extended in an appropriate large-scale metadata set in the future. Second, an insufficient number of liver cancer-specific SL interactions with experimental evidence limited our capacity to assess the accuracy of the SL prediction. Comparisons between our results and several previous non-specific predictions presented poor concordance, suggesting that further validation would be necessary to ensure the reliability of our results. Finally, we only conducted in vitro experiments to investigate the therapeutic potential of PLK1 inhibitors. Performing more comprehensive in vivo validations using cell line derived xenograft or patient derived xenograft tumor models might give more convincing results. These limitations notwithstanding, this study has several strengths, including the individual data pooled study design that contributed a large number of patients with liver cancer. Owing to the large sample size, we were able to explore the SL partners of TSGs with low mutation frequency.
Overall, the present study proposed a new approach for SL identification and presents the most comprehensive landscape of TSG-associated SL interactions in liver cancer. Additionally, a novel therapeutic strategy targeting PLK1 was also demonstrated to have significant potential in the field of personalized liver cancer treatment.
Abbreviations
AUC: area under the dose-response curve; CC: cellular component; CCLE: cancer cell line encyclopedia; CNVs: copy number variants; CRISPR: clustered regularly interspaced short palindromic repeats; CRN: cancer reference network; CTRP: cancer therapeutics response portal; DepMap: Dependency Map; DTs: druggable targets; FDA: United States Food and Drug Administration; FPKM: fragments per kilobase per million reads; FS: functional similarity; HR: hazard ratio; Indels: insertions/deletions; GDSC: genomics of drug sensitivity in cancer; GO: gene ontology; LOF: loss-of-function; MF: molecular function; MOA: mechanism of action; NBS: network-based stratification; NTP: nearest template prediction; RAS: rank aggregation score; RNAi: RNA interference; RNAseq: RNA sequencing; SiLi: statistical inference-based synthetic lethality identification; SL: synthetic lethality; SNVs: single nucleotide variants; TCGA-CDR: TCGA Pan-Cancer Clinical Data Resource; TPM: transcripts per kilobase million; TSGs: tumor suppressor genes; WGS: whole genome sequencing; WES: whole exome sequencing.
Acknowledgements
This study was financially supported by the National Key Sci-Tech Special Projects of Infectious Diseases of China (2018ZX10732202-002-003), the National Natural Science Foundation of China (81874229) and Shanghai Natural Science Foundation (19ZR1452700).
Supplementary Material
Supplementary figures and tables.
Author Contributions
C.Y. and Y.G. designed the study and performed the computational analyses. D.Z. and R.Q. and J.W. performed the in vitro validation experiments. C.Y., X.H., Z.L. and L.Z. wrote the manuscript. W.Q. provided guidance on manuscript preparation. D.Z., X.M., H.C. and C.W. supervised the study.
Competing Interests
The authors have declared that no competing interest exists.
References
1. Schilsky RL. Personalized medicine in oncology: the future is now. Nat Rev Drug Discov. 2010;9:363-6
2. Villanueva A. Hepatocellular Carcinoma. N Engl J Med. 2019;380:1450-62
3. Faivre S, Rimassa L, Finn RS. Molecular therapies for HCC: Looking outside the box. J Hepatol. 2020;72:342-52
4. Lynch TJ, Bell DW, Sordella R, Gurubhagavatula S, Okimoto RA, Brannigan BW. et al. Activating mutations in the epidermal growth factor receptor underlying responsiveness of non-small-cell lung cancer to gefitinib. N Engl J Med. 2004;350:2129-39
5. Shaw AT, Kim DW, Nakagawa K, Seto T, Crinó L, Ahn MJ. et al. Crizotinib versus chemotherapy in advanced ALK-positive lung cancer. N Engl J Med. 2013;368:2385-94
6. Morris LG, Chan TA. Therapeutic targeting of tumor suppressor genes. Cancer. 2015;121:1357-68
7. O'Neil NJ, Bailey ML, Hieter P. Synthetic lethality and cancer. Nat Rev Genet. 2017;18:613-23
8. Fong PC, Boss DS, Yap TA, Tutt A, Wu P, Mergui-Roelvink M. et al. Inhibition of poly(ADP-ribose) polymerase in tumors from BRCA mutation carriers. N Engl J Med. 2009;361:123-34
9. Kroll ES, Hyland KM, Hieter P, Li JJ. Establishing genetic interactions by a synthetic dosage lethality phenotype. Genetics. 1996;143:95-102
10. Zecchini V, Frezza C. Metabolic synthetic lethality in cancer therapy. Biochim Biophys Acta Bioenerg. 2017;1858:723-31
11. Muller FL, Aquilanti EA, DePinho RA. Collateral Lethality: A new therapeutic strategy in oncology. Trends Cancer. 2015;1:161-73
12. Tong AH, Evangelista M, Parsons AB, Xu H, Bader GD, Pagé N. et al. Systematic genetic analysis with ordered arrays of yeast deletion mutants. Science. 2001;294:2364-8
13. Pan X, Yuan DS, Xiang D, Wang X, Sookhai-Mahadeo S, Bader JS. et al. A robust toolkit for functional profiling of the yeast genome. Mol Cell. 2004;16:487-96
14. Tang L, Chen R, Xu X. Synthetic lethality: A promising therapeutic strategy for hepatocellular carcinoma. Cancer Lett. 2020;476:120-8
15. Wang C, Cao Y, Yang C, Bernards R, Qin W. Exploring liver cancer biology through functional genetic screens. Nat Rev Gastroenterol Hepatol. 2021 [Epub ahead of print]
16. Jerby-Arnon L, Pfetzer N, Waldman YY, McGarry L, James D, Shanks E. et al. Predicting cancer-specific vulnerability via data-driven detection of synthetic lethality. Cell. 2014;158:1199-209
17. Sinha S, Thomas D, Chan S, Gao Y, Brunen D, Torabi D. et al. Systematic discovery of mutation-specific synthetic lethals by mining pan-cancer human primary tumor data. Nat Commun. 2017;8:15580
18. Lee JS, Das A, Jerby-Arnon L, Arafeh R, Auslander N, Davidson M. et al. Harnessing synthetic lethality to predict the response to cancer treatment. Nat Commun. 2018;9:2546
19. Das S, Deng X, Camphausen K, Shankavaram U. DiscoverSL: an R package for multi-omic data driven prediction of synthetic lethality in cancers. Bioinformatics. 2019;35:701-2
20. Ally A, Balasundaram M, Carlsen R, Chuah E, Clarke A, Dhalla N. et al. Comprehensive and integrative genomic characterization of hepatocellular carcinoma. Cell. 2017;169:1327-41 e23
21. Totoki Y, Tatsuno K, Covington KR, Ueda H, Creighton CJ, Kato M. et al. Trans-ancestry mutational landscape of hepatocellular carcinoma genomes. Nat Genet. 2014;46:1267-73
22. Fujimoto A, Furuta M, Totoki Y, Tsunoda T, Kato M, Shiraishi Y. et al. Whole-genome mutational landscape and characterization of noncoding and structural mutations in liver cancer. Nat Genet. 2016;48:500-9
23. Schulze K, Imbeaud S, Letouzé E, Alexandrov LB, Calderaro J, Rebouissou S. et al. Exome sequencing of hepatocellular carcinomas identifies new mutational signatures and potential therapeutic targets. Nat Genet. 2015;47:505-11
24. Ahn SM, Jang SJ, Shim JH, Kim D, Hong SM, Sung CO. et al. Genomic portrait of resectable hepatocellular carcinomas: implications of RB1 and FGF19 aberrations for patient stratification. Hepatology. 2014;60:1972-82
25. Gao Q, Zhu H, Dong L, Shi W, Chen R, Song Z. et al. Integrated Proteogenomic Characterization of HBV-Related Hepatocellular Carcinoma. Cell. 2019;179:1240
26. Liu J, Lichtenberg T, Hoadley KA, Poisson LM, Lazar AJ, Cherniack AD. et al. An Integrated TCGA Pan-Cancer Clinical Data Resource to Drive High-Quality Survival Outcome Analytics. Cell. 2018;173:400-16.e11
27. Ghandi M, Huang FW, Jané-Valbuena J, Kryukov GV, Lo CC, McDonald ER 3rd. et al. Next-generation characterization of the Cancer Cell Line Encyclopedia. Nature. 2019;569:503-8
28. Iorio F, Knijnenburg TA, Vis DJ, Bignell GR, Menden MP, Schubert M. et al. A Landscape of Pharmacogenomic Interactions in Cancer. Cell. 2016;166:740-54
29. Rees MG, Seashore-Ludlow B, Cheah JH, Adams DJ, Price EV, Gill S. et al. Correlating chemical sensitivity and basal gene expression reveals mechanism of action. Nat Chem Biol. 2016;12:109-16
30. Corsello SM, Nagari RT, Spangler RD, Rossen J, Kocak M, Bryan JG. et al. Discovering the anti-cancer potential of non-oncology drugs by systematic viability profiling. Nat Cancer. 2020;1:235-48
31. Meyers RM, Bryan JG, McFarland JM, Weir BA, Sizemore AE, Xu H. et al. Computational correction of copy number effect improves specificity of CRISPR-Cas9 essentiality screens in cancer cells. Nat Genet. 2017;49:1779-84
32. Tsherniak A, Vazquez F, Montgomery PG, Weir BA, Kryukov G, Cowley GS. et al. Defining a Cancer Dependency Map. Cell. 2017;170:564-76.e16
33. Bashashati A, Haffari G, Ding J, Ha G, Lui K, Rosner J. et al. DriverNet: uncovering the impact of somatic driver mutations on transcriptional networks in cancer. Genome Biol. 2012;13:R124
34. Wu G, Feng X, Stein L. A human functional protein interaction network and its application to cancer data analysis. Genome Biol. 2010;11:R53
35. Vogelstein B, Papadopoulos N, Velculescu VE, Zhou S, Diaz LA Jr, Kinzler KW. Cancer genome landscapes. Science. 2013;339:1546-58
36. Hofree M, Shen JP, Carter H, Gross A, Ideker T. Network-based stratification of tumor mutations. Nat Methods. 2013;10:1108-15
37. Huang JK, Jia T, Carlin DE, Ideker T. pyNBS: a Python implementation for network-based stratification of tumor mutations. Bioinformatics. 2018;34:2859-61
38. Boyault S, Rickman DS, de Reynies A, Balabaud C, Rebouissou S, Jeannot E. et al. Transcriptome classification of HCC is related to gene alterations and to new therapeutic targets. Hepatology. 2007;45:42-52
39. Chiang DY, Villanueva A, Hoshida Y, Peix J, Newell P, Minguez B. et al. Focal gains of VEGFA and molecular classification of hepatocellular carcinoma. Cancer Res. 2008;68:6779-88
40. Hoshida Y, Nijman SM, Kobayashi M, Chan JA, Brunet JP, Chiang DY. et al. Integrative transcriptome analysis reveals common molecular subclasses of human hepatocellular carcinoma. Cancer Res. 2009;69:7385-92
41. Desert R, Rohart F, Canal F, Sicard M, Desille M, Renaud S. et al. Human hepatocellular carcinomas with a periportal phenotype have the lowest potential for early recurrence after curative resection. Hepatology. 2017;66:1502-18
42. Yang C, Huang X, Liu Z, Qin W, Wang C. Metabolism-associated molecular classification of hepatocellular carcinoma. Mol Oncol. 2020;14:896-913
43. Dang CV, Reddy EP, Shokat KM, Soucek L. Drugging the 'undruggable' cancer targets. Nat Rev Cancer. 2017;17:502-8
44. Corsello SM, Bittker JA, Liu Z, Gould J, McCarren P, Hirschman JE. et al. The Drug Repurposing Hub: a next-generation drug library and information resource. Nat Med. 2017;23:405-8
45. Wishart DS, Feunang YD, Guo AC, Lo EJ, Marcu A, Grant JR. et al. DrugBank 5.0: a major update to the DrugBank database for 2018. Nucleic Acids Res. 2018;46:D1074-d82
46. Shannon P, Markiel A, Ozier O, Baliga NS, Wang JT, Ramage D. et al. Cytoscape: a software environment for integrated models of biomolecular interaction networks. Genome Res. 2003;13:2498-504
47. Han Y, Yu G, Sarioglu H, Caballero-Martinez A, Schlott F, Ueffing M. et al. Proteomic investigation of the interactome of FMNL1 in hematopoietic cells unveils a role in calcium-dependent membrane plasticity. J Proteomics. 2013;78:72-82
48. Yu G, Li F, Qin Y, Bo X, Wu Y, Wang S. GOSemSim: an R package for measuring semantic similarity among GO terms and gene products. Bioinformatics. 2010;26:976-8
49. Stuart JM, Segal E, Koller D, Kim SK. A gene-coexpression network for global discovery of conserved genetic modules. Science. 2003;302:249-55
50. Geeleher P, Zhang Z, Wang F, Gruener RF, Nath A, Morrison G. et al. Discovering novel pharmacogenomic biomarkers by imputing drug response in cancer patients from large genomics studies. Genome Res. 2017;27:1743-51
51. Yang C, Chen J, Li Y, Huang X, Liu Z, Wang J. et al. Exploring subclass-specific therapeutic agents for hepatocellular carcinoma by informatics-guided drug screen. Brief Bioinform. 2021;22:bbaa295
52. Azuaje F. Computational models for predicting drug responses in cancer research. Brief Bioinform. 2017;18:820-9
53. Liberzon A, Birger C, Thorvaldsdóttir H, Ghandi M, Mesirov JP, Tamayo P. The Molecular Signatures Database (MSigDB) hallmark gene set collection. Cell Syst. 2015;1:417-25
54. Wang C, Vegna S, Jin H, Benedict B, Lieftink C, Ramirez C. et al. Inducing and exploiting vulnerabilities for the treatment of liver cancer. Nature. 2019;574:268-72
55. Wang X, Simon R. Identification of potential synthetic lethal genes to p53 using a computational biology approach. BMC Med Genomics. 2013;6:30
56. Matlak D, Szczurek E. Epistasis in genomic and survival data of cancer patients. PLoS Comput Biol. 2017;13:e1005626
57. Cheng F, Zhao J, Zhao Z. Advances in computational approaches for prioritizing driver mutations and significantly mutated genes in cancer genomes. Brief Bioinform. 2016;17:642-56
58. Das S, Camphausen K, Shankavaram U. Pan-Cancer Analysis of Potential Synthetic Lethal Drug Targets Specific to Alterations in DNA Damage Response. Front Oncol. 2019;9:1136
59. Ye H, Zhang X, Chen Y, Liu Q, Wei J. Ranking novel cancer driving synthetic lethal gene pairs using TCGA data. Oncotarget. 2016;7:55352-67
60. Han Y, Wang C, Dong Q, Chen T, Yang F, Liu Y. et al. Genetic Interaction-Based Biomarkers Identification for Drug Resistance and Sensitivity in Cancer Cells. Mol Ther Nucleic Acids. 2019;17:688-700
61. Srihari S, Singla J, Wong L, Ragan MA. Inferring synthetic lethal interactions from mutual exclusivity of genetic events in cancer. Biol Direct. 2015;10:57
62. Kranthi T, Rao SB, Manimaran P. Identification of synthetic lethal pairs in biological systems through network information centrality. Mol Biosyst. 2013;9:2163-7
63. Hyun SY, Hwang HI, Jang YJ. Polo-like kinase-1 in DNA damage response. BMB Rep. 2014;47:249-55
64. Kim RD, Sarker D, Meyer T, Yau T, Macarulla T, Park JW. et al. First-in-Human Phase I Study of Fisogatinib (BLU-554) Validates Aberrant FGF19 Signaling as a Driver Event in Hepatocellular Carcinoma. Cancer Discov. 2019;9:1696-707
65. Liany H, Jeyasekharan A, Rajan V. Predicting synthetic lethal interactions using heterogeneous data sources. Bioinformatics. 2020;36:2209-16
66. King SI, Purdie CA, Bray SE, Quinlan PR, Jordan LB, Thompson AM. et al. Immunohistochemical detection of Polo-like kinase-1 (PLK1) in primary breast cancer is associated with TP53 mutation and poor clinical outcom. Breast Cancer Res. 2012;14:R40
67. Shin SB, Woo SU, Chin YW, Jang YJ, Yim H. Sensitivity of TP53-Mutated Cancer Cells to the Phytoestrogen Genistein Is Associated With Direct Inhibition of Plk1 Activity. J Cell Physiol. 2017;232:2818-28
68. Li Y, Zhao ZG, Luo Y, Cui H, Wang HY, Jia YF. et al. Dual targeting of Polo-like kinase 1 and baculoviral inhibitor of apoptosis repeat-containing 5 in TP53-mutated hepatocellular carcinoma. World J Gastroenterol. 2020;26:4786-801
Author contact
![]() Corresponding authors: Dayong Zhang, E-mail: zhangdyedu.cn; Xuhui Ma, E-mail: xhmaorg; Huimin Chen, E-mail: huimin.chancom; Cun Wang, E-mail: cwangorg.
Corresponding authors: Dayong Zhang, E-mail: zhangdyedu.cn; Xuhui Ma, E-mail: xhmaorg; Huimin Chen, E-mail: huimin.chancom; Cun Wang, E-mail: cwangorg.