Impact Factor
- Issue 14; 2026
- Issue 13; 2026
- Issue 12; 2026
- Issue 11; 2026
- Issue 10; 2026
- Volume 16; 2026
- Advance Articles
- Past Issues
- Cover Images
- Cover Suggestion
- Index & Coverage
- Special Issues
Introduction
Results
Discussion
Conclusions
Materials and Methods
Abbreviations
Supplementary Material
Acknowledgements
References
International Journal of Biological Sciences
International Journal of Medical Sciences
 Global reach, higher impact

Theranostics 2021; 11(10):4945-4956. doi:10.7150/thno.55209 This issue Cite
Research Paper
Candida albicans disorder is associated with gastric carcinogenesis
Mengya Zhong1,2#, Yubo Xiong1,2#, Jiabao Zhao1,2, Zhi Gao3, Jingsong Ma1,2, Zhengxin Wu4, Yongxi Song5 ![]() , Xuehui Hong1,2
, Xuehui Hong1,2 ![]()
1. Department of Gastrointestinal Surgery, Zhongshan Hospital of Xiamen University, Xiamen, Fujian, China.
2. School of Medicine, Xiamen University, Xiamen, Fujian, China.
3. National Center for International Research of Biological Targeting Diagnosis and Therapy, Guangxi Key laboratory of Biological Targeting Diagnosis and Therapy Research, Guangxi Medical University, Nanning, Guangxi, China.
4. School of Medicine, Guangxi University, Nanning, Guangxi, China.
5. Department of Surgical Oncology and General Surgery, Key Laboratory of Precision Diagnosis and Treatment of Gastrointestinal Tumors, Ministry of Education, The First Affiliated Hospital of China Medical University, Shenyang, Liaoning, China.
#These authors contributed equally to this work.
Received 2020-10-29; Accepted 2021-1-29; Published 2021-3-5
Abstract

Background: Bacterial infection is associated with gastric carcinogenesis. However, the relationship between nonbacterial components and gastric cancer (GC) has not been fully explored. We aimed to characterize the fungal microbiome in GC.
Methods: We performed ITS rDNA gene analysis in cancer lesions and adjacent noncancerous tissues of 45 GC cases from Shenyang, China. Obtaining the OTUs and combining effective grouping, we carried out species identifications, alpha and beta diversity analyses, and FUNGuild functional annotation. Moreover, differences were compared and tested between groups to better investigate the composition and ecology of fungi associated with GC and find fungal indicators.
Results: We observed significant gastric fungal imbalance in GC. Principal component analysis revealed separate clusters for the GC and control groups, and Venn diagram analysis indicated that the GC group showed a lower OTU abundance than the control. At the genus level, the abundances of 15 fungal biomarkers distinguished the GC group from the control, of which Candida (p = 0.000246) and Alternaria (p = 0.00341) were enriched in GC, while Saitozyma (p = 0.002324) and Thermomyces (p = 0.009158) were decreased. Combining the results of Welch's t test and Wilcoxon rank sum test, Candida albicans (C. albicans) was significantly elevated in GC. The species richness Krona pie chart further revealed that C. albicans occupied 22% and classified GC from the control with an area under the receiver operating curve (AUC) of 0.743. Random forest analysis also confirmed that C. albicans could serve as a biomarker with a certain degree of accuracy. Moreover, compared with that of the control, the alpha diversity index was significantly reduced in the GC group. The Jaccard distance index and the Bray abundance index of the PCoA clarified separate clusters between the GC and control groups at the species level (p = 0.00051). Adonis (PERMANOVA) analysis and ANOVA showed that there were significant differences in fungal structure among groups (p = 0.001). Finally, FUNGuild functional classification predicted that saprotrophs were the most abundant taxa in the GC group.
Conclusions: This study revealed GC-associated mycobiome imbalance characterized by an altered fungal composition and ecology and demonstrated that C. albicans can be a fungal biomarker for GC. With the significant increase of C. albicans in GC, the abundance of Fusicolla acetilerea, Arcopilus aureus, Fusicolla aquaeductuum were increased, while Candida glabrata, Aspergillus montevidensis, Saitozyma podzolica and Penicillium arenicola were obviously decreased. In addition, C. albicans may mediate GC by reducing the diversity and richness of fungi in the stomach, contributing to the pathogenesis of GC.
Keywords: Gastric cancer, fungal imbalance, Candida albicans, mycobiome, biomarker
Introduction
Gastric cancer (GC) is the fourth most common malignancy and one of the main causes of cancer-related deaths worldwide [1]. The majority of GC cases are the intestinal type of noncardia gastric cancer, which undergoes a predictable histological progression from atrophic gastritis (AG) to intestinal metaplasia (IM) and eventually to GC [2]. Initially, Helicobacter pylori (H. pylori) infection causes inflammation of the gastric mucosa and destruction of related hydrochloric acid secreting glands, leading to AG [3]. AG is a chronic inflamed, hypochloremic state, which may cause GC. Although it is known that H. pylori infection contributes to this cascade, only approximately 1-3% of infected individuals subsequently develop GC [4, 5]. Some host-related factors mentioned in the current research, including age, smoking status, genetic susceptibility and environmental factors, such as consumption of a high-salt diet and smoked foods containing nitrates, as well as microbial infections, have been shown to contribute to gastric carcinogenesis [6]. However, the relationship between gastric microbial components (such as fungi) other than H. pylori and GC has not been fully explored.
Over the past decade, due to the difficulty in culturing the commensal microorganisms that reside in the stomach, compared with intestinal microbiome, gastric microbiome studies are few, with only recent increases in studied on this topic [7]. In recent years, combined with advances in PCR techniques and metagenomics, the robust microbiome of the stomach has attracted extensive attention [8]. Most of the research efforts on the microbiome have focused on characterizing bacteria in healthy and diseased states, while the relatively low abundance of nonbacterial components has been neglected because of various technical challenges ranging from sample preparation to inadequate reference databases. Studies have provided evidence that bacteria, mainly the phyla Proteobacteria, Firmicutes, Actinobacteria and Fusobacteria [9, 10], can be regularly detected in gastric biopsies with gastric microbial imbalance associated with GC. Although H. pylori is still the main risk factor for histological changes, the chance of evolving GC after infection is not high, indicating that the presence of other components plays a key role in the development of GC.
With the advancement of high-throughput sequencing technology, sequencing methods provide access to the gastric mycobiome. Genomic equivalence estimates that the fungal composition of the mammalian microbiota comprises less than 1% of all commensal microbial species, but fungi are significantly larger than bacteria in cell size and possess specialized metabolic gene clusters in response to specific ecological needs. Emerging research has revealed that fungi play a stable role in the development and maintenance of the host immune system and can be altered in various diseases [11, 12]. The latest Nature journal reports that fungi, like bacteria, can also be transferred from the intestine to the pancreas, and related changes in the fungal microbiome promote pancreatic oncogenesis [13]. With the discovery of the role for gut microbiota dysbiosis in colorectal, oral, and pancreatic carcinogenesis, it is necessary to conduct further studies regarding the role of mycobiome as a potential prognostic tool for early diagnosis of cancer [14]. Additionally, growing attention towards the characterization of mycobiome may contribute to improving the efficiency of therapeutic methods used to modulate the composition and activity of intestinal microbiota [14]. Thus, the dynamic exploration of the changes in the composition of gastric fungi in the progression from health to GC not only provides direction for future high-throughput fungal sequencing research on tumors but is also essential for further investigating the mechanisms of gastric carcinogenesis other than H. pylori.
In this study, we characterized fungal compositional and ecological changes by analyzing metagenomic sequences in cancer lesions and adjacent noncancerous tissues of 45 patients with GC. C. albicans was also discovered as a fungal indicator for GC. For the first time, we used ITS sequencing to demonstrate the importance of fungi in the pathogenesis of GC, providing a theoretical scientific basis for the development of potential prevention and treatment strategies.
Results
Gastric fungal imbalance is associated with GC
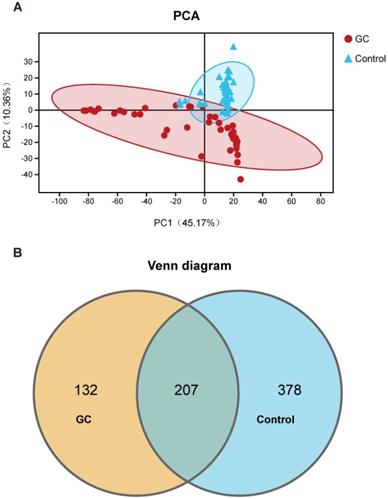
We evaluated 90 samples from 45 pairs of patients and divided them into a GC group and a control group (adjacent noncancerous tissue) for comparison. We also analyzed the clinical characteristics closely related to GC and found no significant differences. The detailed characteristics of the patients are shown in Table S1. We first assessed and compared the fungal composition in the specimens. The PCA showed that the GC and control groups aggregated separately, revealing that the gastric mucosal fungal community discriminated GC and the control into two significantly distinct groups. The GC group exhibited more unique fungal profiles than the control group (Figure 1A, Table S2). To clarify the OTU crossover between different groups, we used a Venn diagram to indicate the differences among the groups according to OTU abundance. We found that both groups shared a total OTU abundance of 207. Simultaneously, the GC group showed a lower OTU abundance than the control group (Figure 1B). Meanwhile, we also obtained 10 healthy samples. We didn't find significant difference between healthy individuals and the adjacent noncancerous tissues (Figure S1). Besides, when we added the 10 healthy samples to the 45 adjacent non-cancerous tissues, the results of 55 non-cancerous specimens compared to 45 GC samples are basically the same as the comparing results between 45 pairs (Figure S2). Taking into account the rigorous comparision of the experiment and the statistical difference, we finally show the results of 45 pairs of cancer and adjacent noncancerous samples for the further analysis. Based on these OTU clustering results, it is suggested that alterations in stomach fungal composition may be associated with gastric carcinogenesis.
Classification and distribution of fungi in the stomachs of gastric cancer (GC) patients. (A) Through the principal component analysis (PCA) dynamic display, GC (n=45) and control (n=45) samples showed clustering distributions. PC1 and PC2 represent the first two main components, and they reflect the contribution to the sample difference, expressed as a percentage. (B) Based on the OTU abundance, Venn diagram analysis was performed. Unique OTUs between the GC (orange) and control (blue) groups was found as well as common OTUs (lightcyan) between the two groups.
Taxonomic coverage and alterations of fungi in GC
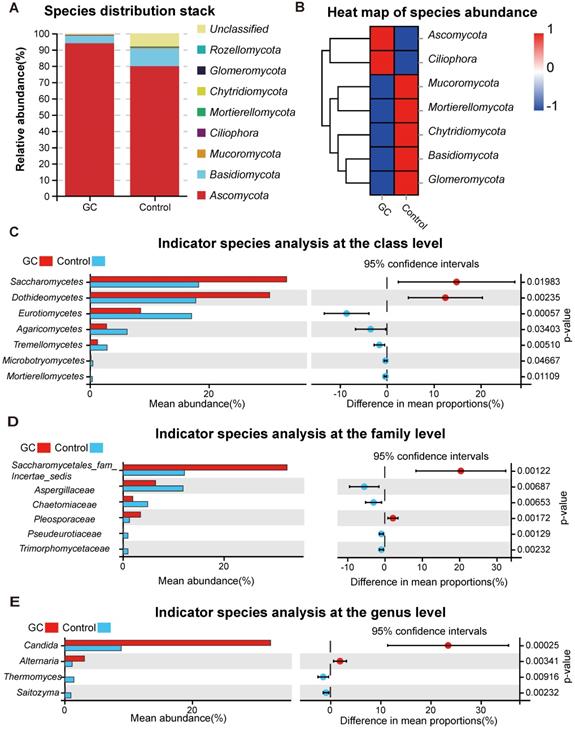
For the distribution of fungal taxa, in both the GC and control groups, the phylum Ascomycota was the dominant mycoflora, and Basidiomycota was considered to be the second most abundant phylum (Figure 2A). The corresponding species abundance heat map is shown in Figure 2B. We further analyzed the differences at the lower taxonomic level of class, finding a significant depletion of Eurotiomycetes, Agaricomycetes, Tremellomycetes, Microbotryomycetes and Mortierellomycetes and enrichment of Saccharomycetes and Dothideomycetes in the GC group compared with the control group (Figure 2C). At the family level, we found 17 fungi with significant differences (Table S3), so we only showed data with a P value less than 0.01. Pseudeurotiaceae, Trimorphomycetaceae, Chaetomiaceae and Aspergillaceae were significantly decreased in the GC group, while Saccharomycetales_fam_Incertae_sedis and Pleosporaceae were increased, compared to the control (Figure 2D). Furthermore, at the genus level, there were 15 different fungi between the two groups (Table S4); 2 fungal genera were enriched in the GC group, including Candida (p = 0.000246) and Alternaria (p = 0.00341), while Saitozyma (p = 0.002324) and Thermomyces (p = 0.009158) were decreased, compared to the control (Figure 2E).
Changes in the fungal composition in the stomachs of gastric cancer (GC) patients. (A) Relative abundance of dominant gastric fungal phyla in the GC and control groups. The dominant phyla were Ascomycota and Basidiomycota in both groups. (B) The corresponding heatmap also shows changes in the fungal phyla in the GC and control groups. Differences in fungal composition and abundance between GC (n=45) and the control (n=45) were detected using Welch's t test. The variation in the relative abundance of species represented in different groups was demonstrated graphically. Differences in OTUs appear in the left rows, and the corresponding P values are shown in the right rows. (C) Differentially abundant fungal classes between the GC and control groups. OTUs and taxa differences are shown with p-values less than 0.05. Differentially abundant fungal families (D) or genera (E) between the GC and control groups. OTUs and taxa differences are shown with p-values less than 0.01.
Candida albicans as a fungal indicator species for GC
To better identify fungal taxa with value as potential GC indicators, we evaluated fungal alterations at the species level. We initially used Welch's t test and found that there were 13 species with significant differences in the mean abundance when comparing the two groups (Table S5). Then, the Wilcoxon rank sum test was applied to determine whether the median species abundance was statistically significant, and we confirmed that 59 species had significant differences between the two groups (Table S6). The species with higher contents and greater than two-fold changes in abundance were selected for the next analysis.
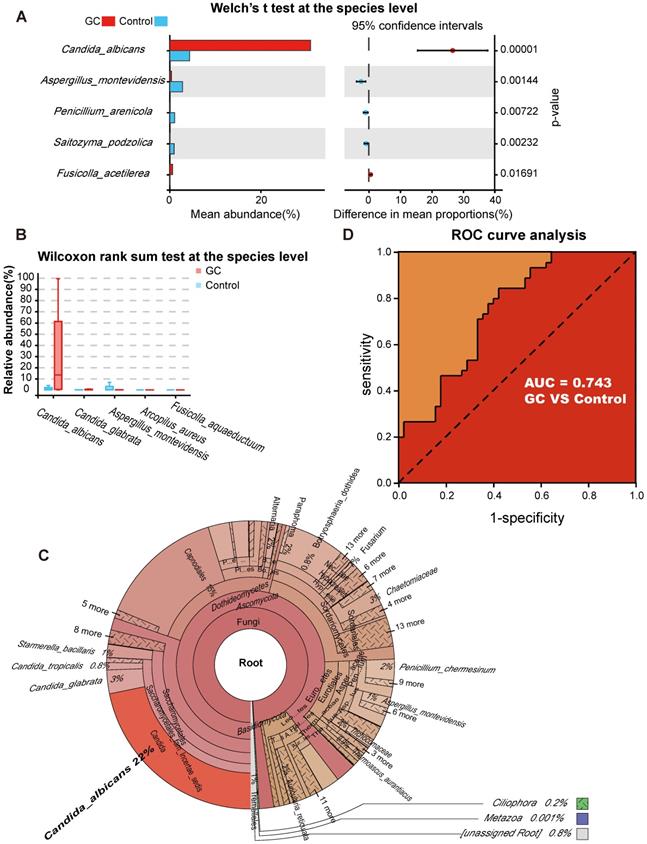
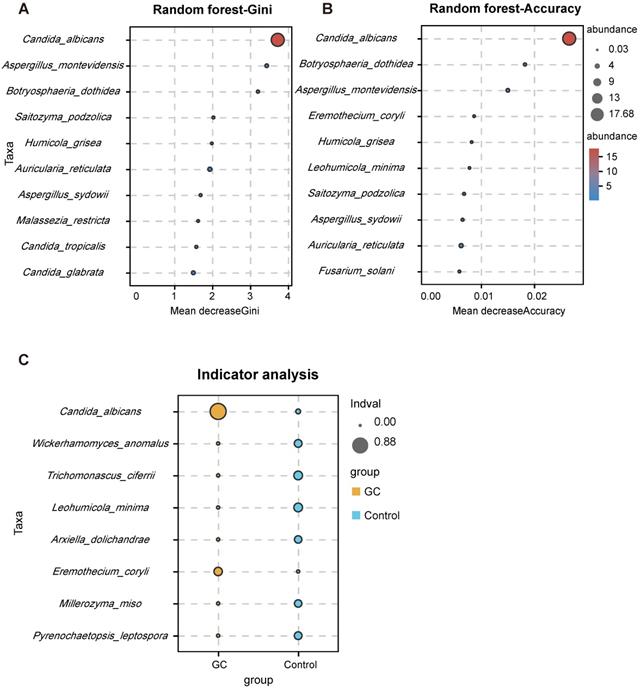
With the Welch's t test, C. albicans (p = 0.000015) and Fusicolla acetilerea (p = 0.01691) were increased, while Aspergillus montevidensis (p = 0.001437), Saitozyma podzolica (p = 0.002324) and Penicillium arenicola (p = 0.00722) were obviously decreased in the GC group (Figure 3A). With the Wilcoxon rank sum test, the abundance of C. albicans (p = 0.000072), Arcopilus aureus (p = 0.040759) and Fusicolla aquaeductuum (p = 0.026626) was higher in the GC group, while Candida glabrata (p = 0.014443) and Aspergillus montevidensis (p = 0.000586) were less abundant, compared to the control (Figure 3B). These results demonstrated that C. albicans was significantly elevated in the GC group (p < 0.0001). Next, we dynamically displayed the composition of species at different classification levels through the species composition pie chart and found that the abundance of C. albicans at the species level accounted for 22% (Figure 3C, Table S7). We evaluated the accuracy based on the ROC curve and observed an AUC value of 0.743 (Figure 3D). Random forest analysis was used to screen potential indicator species, and the values of the Gini index (Figure 4A) and the mean decrease in accuracy (Figure 4B) were the largest for C. albicans. Combined with the indicator analysis, we comprehensively considered the strong indicator ability of C. albicans among the groups (Figure 4C). These results all indicated that C. albicans had an obvious effect in distinguishing GC and non-GC tissues and can be used as a biomarker with a certain degree of accuracy.
Candida albicans as an indicator fungus for GC. Differences in fungal species abundance between the GC (n=45) and control (n=45) groups were detected using Welch's t test (A) or Wilcoxon rank sum test (B), and Candida albicans was significantly elevated in the GC group (p<0.0001). (C) Species annotation was performed based on the sequence information of the OTUs, a Krona pie chart was established at the species level, and the absolute abundance of C. albicans accounted for 22%. (D) The markers achieved an area under the receiver operating characteristic curve (AUC) of 0.743 for the classification of the GC group from the control group.
Candida albicans has a strong indication ability. Using the random forest algorithm to calculate the contribution of C. albicans to the grouping difference at the species level, it is found that the Gini index (A) and average accuracy (B) values were both largest for C. albicans. (C) The indicator analysis considers the frequency and abundance of C. albicans between groups.
Altered fungal microbiota diversity in GC
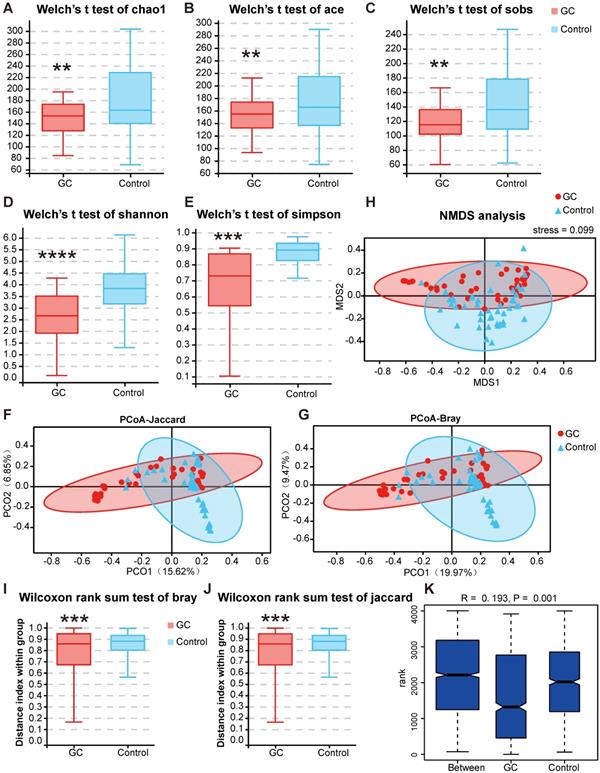
Next, we conducted a diversity analysis to further understand the species richness and microbiome structure among the groups. Alpha diversity indexes (Chao1, ACE, Sobs, Shannon, Simpson and Good's Coverage) were significantly reduced in the GC group compared with those of the control (Figure S3, Table S8). Briefly, we measured fungal alpha diversities and determined whether, through a t test (Figure 5A-E) or rank sum test, five indexes, namely, the Chao1, ACE, Sobs, Shannon and Simpson indexes, were significantly different between the GC and control groups (p < 0.05) (Table 1).
Changes in fungal microbiome diversity in GC. Hypothesis tests of the alpha diversity index through Welch's t test, Chao1 (A), ACE (B), Sobs (C), Shannon (D) and Simpson (E) diversity indexes between the GC (n=45) and control (n=45) groups confirmed that there were significant differences in species diversity between groups. Principal coordinate analysis (PCoA) of Jaccard distances (F) or Bray-Curtis distances (G) showed the stratification of GC (n=45) from control (n=45) samples by their fungal compositional profiles. (H) Nonmetric multidimensional scaling (NMDS) analysis of the fungal compositional profiles stratified GC (n=45) from control (n=45) samples. A stress value less than 0.1 indicates that the model grouping is reliable. At the genus level, the Wilcoxon rank sum test was used to judge the significant difference between the Bray-Curtis distance (I) and Jaccard distance (J), and the degree of difference in fungal microbiome structure within the groups was compared. (K) Based on the distance index ranking, ANOSIM (analysis of similarities) confirmed that the distance between groups was significantly greater than the distance within groups, indicating that the microbiome structure of different groups was significantly different. **P<0.01, ***P<0.001, ****P<0.0001.
Difference of alpha diversity index between the GC and control groups
| Group | Testing method | Index | P value |
|---|---|---|---|
| GC-VS-Control | T-test | Sobs | 0.001267 |
| Shannon | 0.000003 | ||
| Simpson | 0.000156 | ||
| Chao1 | 0.001763 | ||
| Ace | 0.006286 | ||
| Wilcoxon | Sobs | 0.011800 | |
| Shannon | 0.000001 | ||
| Simpson | 0.000001 | ||
| Chao1 | 0.025431 | ||
| Ace | 0.044121 |
We used PCoA to analyze two classic beta diversity indexes, the Jaccard distance index (Figure 5F) and the Bray abundance index (Figure 5G), and confirmed separate clusters for the GC and control groups at the species level. To overcome the shortcomings of linear models (PCA, PCoA) and better reflect the nonlinear structure, we evaluated the accuracy of the model through NMDS stress values. We ensured the reliability of the model, confirming that the stress values of the Jaccard and Bray indexes were less than 0.1 (Figure 5H). The significant difference of the two indexes between groups was shown by the Wilcoxon rank sum test at the genus level (p = 0.00051, Figure 5I-J). We then evaluated and verified the fungal composition in our groups. Both Adonis (PERMANOVA) analysis (p = 0.001) and the ANOSIM test (Figure 5K) revealed that there were significant differences in fungal structure between the GC and control groups. Combining the two diversity index results, our analysis suggested that with gastric carcinogenesis, the richness of the related fungal composition decreases, and the structure of the fungal community is quite different.
Ecological guilds of sampled taxa
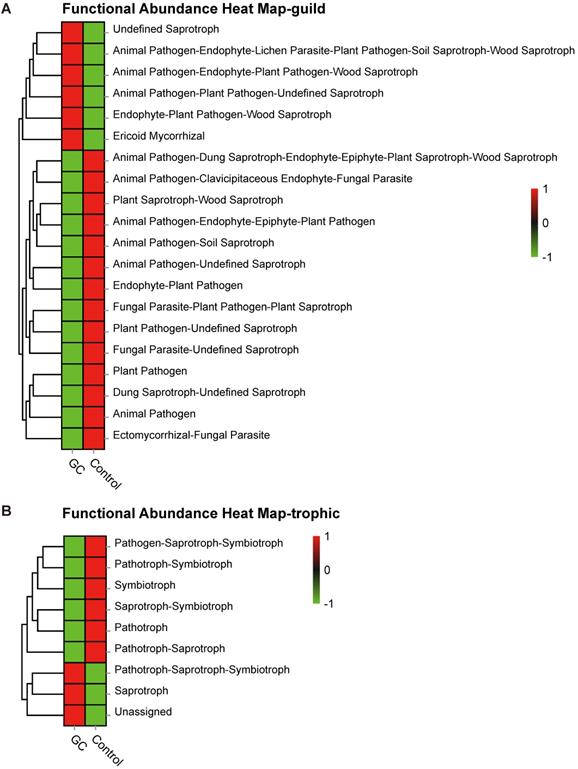
Based on the OTU abundance, we used FUNGuild to perform functional classification prediction. The fungal taxa were grouped into 83 ecological guilds (Table S9), and top ten categories are displayed here. The most diverse guild was undefined saprotrophs (Figure S4A). In addition, trophic mode divided fungal taxa into 9 types (Table S10), of which the most diverse type was saprotrophs (Figure S4B). In particular, heatmaps were drawn to describe the functional predictions under the two analytical methods, as shown in Figure 6A and Figure 6B, respectively. Thus, our analyses showed a symbiotic ecological relationship in the stomach, which is important for the homeostasis of gastric fungi, while fungal imbalance ultimately indicates the negative effects of gastric carcinogenesis.
Saprotrophs are the most common functional category associated with GC. Based on the OTU abundance, fungal functional annotation was carried out using FUNGuild. Using functional groups (guilds), fungi were divided into categories based on their absorption and utilization of environmental resources. The three major categories and twelve subcategories of fungi distinguished the GC (n=45) and control groups (n=45) at the guild (A) and trophic (B) levels.
Discussion
Gastric cancer causes one of the major types of digestive tract tumor worldwide [1]. After the continuous development of high-throughput sequencing technology, research on the correlation between gastric microbiome (other than H. pylori) and GC has gradually emerged. In this study, we described the fungal spectrum associated with GC, which has not been explained to date; the focus was on gastric fungal imbalance associated with GC. Compared with fecal samples, the colonization performance of tissue samples can better demonstrate the dynamic changes in the surrounding environment for gastric carcinogenesis. Therefore, we analyzed the ITS metagenome sequences of cancer lesions and adjacent noncancerous tissues to investigate the composition and ecological alterations of fungi associated with GC and identify fungal indicators. To ensure that the most effective data were clustered into OTUs, we filtered low-quality reads, and assembled and refiltered the data. After obtaining the OTUs, under the condition that the GC and control groups were effectively grouped, we carried out species identifications and alpha and beta diversity analysis, and compared differences between groups. C. albicans was identified for the first time as a key fungus that can be used to distinguish between GC and control groups. We also combined FUNGuild functional annotation to study fungal functions from other ecological perspectives. For the first time, we showed the characteristics of the fungal microbiome in the stomach tissues of GC patients, demonstrating imbalance of the fungi in the GC ecosystem and proving that C. albicans can be used as a biomarker with a certain degree of accuracy.
We clarified specific fungal composition changes in GC. Overall, the GC group showed a lower OTU abundance. At the phylum level, Ascomycota was the most enriched in the GC group compared with the control group, while Basidiomycota was less enriched. We further analyzed the differences at lower taxonomic levels and finally, at the species level, confirmed that C. albicans, Fusicolla acetilerea, Arcopilus aureus and Fusicolla aquaeductuum were excessively colonized in the GC tissue. At present, C. albicans is the most researched of these organisms with regard to its role in various diseases. This species normally exists in the body and does not cause damage. However, when the host's defense capacity is weakened, C. albicans could cause disease. Therefore, C. albicans is recognized as an opportunistic pathogen. Since immunosuppression caused by cancer chemotherapy promotes C. albicans infection, the relationship between C. albicans and cancer development or progression has been widely reported. For example, for hematological malignancies or solid tumors, up to 35% of patients with underlying disease have candidiasis, and the most common underlying disease among patients with candidiasis is also solid tumor [15]. C. albicans can produce carcinogenic nitrosamines, which can cause abnormal proliferative changes in oral epithelial cancer [16]. The risk of malignant transformation of oral leukoplakia is higher than that of oral lichenoid lesions, and C. albicans strains isolated from patients can produce more carcinogenic acetaldehyde in ethanol [17]. The role of C. albicans in tumor adhesion and metastasis has been associated with TNF-α and IL-18 [18-20]. Recently, Bertolini et al. confirmed that C. albicans induced mucosal bacterial dysbiosis and promoted invasive infection [21]. Kazmierczak-Siedlecka et al. found that C. albicans is the major gut microbe causing inflammation and consequently contributing to oral cancer development [14].
Notably, we first confirmed the indicative role of C. albicans in GC. In our study, compared with the control, the species richness of C. albicans occupied 22% in the GC group. Both the Welch's t test and Wilcoxon rank sum test confirmed that C. albicans was significantly more abundant in the GC group than the control group. In addition, the ROC curve showed that the AUC value of C. albicans was 0.743. Combined with the results of the Gini index and the mean decrease in accuracy, all results indicated that C. albicans could be used as a biomarker with a certain degree of accuracy. Routine detection methods for C. albicans include blood culture, microscopic examination, and biochemical identification [22, 23], but clinically these tests delay antifungal treatment. To make up for the shortcomings of time-consuming and low sensitivity of conventional examinations, the current molecular biology techniques for detecting fungi have seen a leap in quality and are gradually being applied in clinical practice, including polimerase chain reaction (PCR) [24], real-time PCR [25], mass spectrometry [26], immunoassay [27], Polymerase spiral reaction (PSR) [28] and 18S rDNA high-throughput screening [29], with the advantages of higher sensitivity, faster processing ( < 1 working day) and prospect for a high degree of laboratory automation, these technologies provide an attractive alternative for the identification and quantitation of C. albicans rDNA in pure cultures and blood samples. Aykut et al. stated that identifying the species most associated with cancer may guide future attempts to use targeted antifungal drugs to slow tumor growth and avoid side effects and reported Malassezia as a pathogenic fungus associated with pancreatic cancer that promotes pancreatic oncogenesis via activation of MBL [13].Our discovery that C. albicans may have contributed to the pathogenesis of GC not only lays a scientific foundation for the exploration of innovative therapies for GC but also provides a new idea for treating specific patients by adjusting their intestinal microbial microbiome as an adjuvant therapy or developing immunotherapies for targeted control of fungal infections, which is worthy of further study. Similar with the gut bacteria, we believe that the composition of gastric mycobiome is associated with the ethnicity or region in a certain degree. Thus, more studies from different countries or regions are required to better describe the fungal microbiome of stomach.
By diversity analysis, compared with the control group, the GC group showed a decrease in species richness, diversity and uniformity. The structure of the species microbiome between the groups also showed a significant change. Due to the current lack of fungal genomic data, we integrated published article data and used FUNGuild to predict fungal functions from other ecological perspectives based on OTU abundance. The guild classification revealed that the most diverse guilds were undefined saprotrophs. Simultaneously, the trophic mode implied that the most diverse fungal type was the saprotrophs. Our analysis clarified the importance of fungal homeostasis in the stomach and suggests that fungal imbalance is associated with the occurrence and development of GC.
Conclusions
In conclusion, compared with most studies focusing on the bacterial spectrum associated with GC, our study described the gastric fungal imbalance in gastric carcinogenesis for the first time and showed that C. albicans can be used as a fungal marker for GC. In addition, C. albicans may possibly mediate GC by reducing the diversity and richness of fungi in the stomach, contributing to the pathogenesis of GC. We also revealed the importance of homeostasis for gastric fungi. Additional analysis investigating the potential role of C. albicans in gastric carcinogenesis is warranted to delineate its use as a noninvasive biomarker for GC diagnosis.
Materials and Methods
Sample collection and PCR amplification
A total of 100 samples were obtained from 45 pairs of patients diagnosed with GC as well as 10 healthy individuals (include 7 men and 3 women, with an average age of 64 years) at the First Affiliated Hospital of China Medical University, Shenyang, China. Surgical biopsies were obtained from sites of cancer lesions and adjacent noncancerous tissues in each patient.
All specimens were stored at -80 °C until DNA extraction. In addition, subjects provided informed consent for obtaining study specimens, and the study was approved by the Clinical Research Ethics Committees of the First Affiliated Hospital of China Medical University.
Microbial DNA was extracted using HiPure DNA Kits (Magen, Guangzhou, China) according to the manufacturer's protocols. The internal transcribed spacer (ITS) of the ITS2 region between the 5.8S and 28S genes of the ribosomal DNA gene was amplified by PCR (94 °C for 2 min, 30 cycles at 98 °C for 10 s, 62 °C for 30 s, and 68 °C for 30 s, and a final extension at 68 °C for 5 min) using the fungal-specific primers ITS3_KYO2: GATGAAGAACGYAGYRAA and ITS4: TCCTCCGCTTATTGATATGC [30]. PCRs were performed in triplicate in a 50-μL mixture containing 5 μL of 10× KOD buffer, 5 μL of 2 mM dNTPs, 3 μL of 25 mM MgSO4, 1.5 μL of each primer (10 μM), 1 μL of KOD polymerase, and 100 ng of template DNA. The related PCR reagents used in the experiment were from TOYOBO, Japan.
Metagenomics sequencing
Amplicons were extracted from 2% agarose gels, purified using the AxyPrep DNA Gel Extraction Kit (Axygen Biosciences, Union City, CA, USA) according to the manufacturer's instructions and quantified using the ABI StepOnePlus Real-Time PCR System (Life Technologies, Foster City, USA). The purified amplicons were pooled in equimolar amounts and paired-end sequenced (PE250) on an Illumina platform according to standard protocols. The raw reads were deposited into the NCBI Sequence Read Archive (SRA) database.
Quality control and read assembly
Raw data containing adapters or low-quality reads affect subsequent assembly and analyses. Thus, to obtain high-quality clean reads, the raw reads were further filtered according to the following rules using FASTP [31] (version 0.18.0): reads containing more than 10% of unknown nucleotides-(N) and reads with less than 50% of bases with a quality value (Q-value) > 20 were removed. Paired-end clean reads were merged as raw tags using FLASH [32] (version 1.2.11) with a minimum overlap of 10 bp and a mismatch error rate of 2%.
The noisy sequences of raw tags were filtered using the QIIME [33] (version 1.9.1) pipeline based on specific filtering conditions [34] to obtain high-quality clean tags. The filtering conditions were as follows: briefly, raw tags from the first low-quality base site where the number of bases in the continuous low-quality value (the default quality threshold is <= 3) reached the set length (the default length is 3) were broken. Then, tags whose continuous high-quality base length was less than 75% of the tag length were filtered.
OTU and community composition analyses
The effective tags were clustered into operational taxonomic units (OTUs) with at least 97% similarity using the UPARSE [35] (version 9.2.64) pipeline. The tag sequence with the highest abundance was selected as the representative sequence within each cluster. For the analyses between groups, Venn diagram-based analyses were performed in the R project VennDiagram package [36] (version 1.6.16), and an upset plot was developed in the R project UpSetR package [37] (version 1.3.3) to identify unique and common OTUs.
The representative sequences were classified into organisms by a naive Bayesian model using the RDP classifier [38] (version 2.2) based on the ITS2 [39] database (version update_2015), with a confidence threshold value of 0.8. The abundance statistics of each taxa were visualized using Krona [40] (version 2.6). The stacked bar plot of the community composition was visualized in the R project ggplot2 package [41] (version 2.2.1). Circular layout representations of species abundance were graphed using Circos [42] (version 0.69-3). A heatmap of species abundance was plotted using the pheatmap package (version 1.0.12) [43] in the R project.
Statistical analysis
The random forest package [44] (version 4.6.12), pROC package [45] (version 1.10.0) and labdsv package [46] (version 2.0-1) were used in the R project. A ternary plot of species abundance was plotted using the R ggtern package [47] (version 3.1.0). Chao1, Simpson and all other alpha diversity indexes were calculated in QIIME [33] (version 1.9.1). Comparisons of the alpha indexes between groups were performed with Welch's t-test and Wilcoxon rank test using the R project [48] (version 2.5.3).
The R project [48] (version 2.5.3) was also used to analyze the data based on multivariate statistical techniques, including Jaccard and Bray-Curtis distance matrixes, principal component analysis (PCA), principal coordinate analysis (PCoA) and nonmetric multidimensional scaling (NMDS) of weighted UniFrac distances, and the results were plotted in the R project ggplot2 package [41] (version 2.2.1). Welch's t-test, Wilcoxon rank test, Adonis (also called PERMANOVA) and ANOSIM test were performed using the R project, and the functional groups (guilds) of the fungi were inferred using FUNGuild [49] (version 1.0).
Abbreviations
GC: gastric cancer; AUC: area under the receiver operating curve; C. albicans: Candida albicans; AG: atrophic gastritis; IM: intestinal metaplasia; ITS: internal transcribed spacer; SRA: Sequence Read Archive; OUTs: operational taxonomic units; PCA: principal component analysis; PCoA: principal coordinate analysis; NMDS: nonmetric multidimensional scaling.
Supplementary Material
Supplementary figures and tables.
Acknowledgements
We would like to thank the First Affiliated Hospital of China Medical University for providing clinical samples and the entire research team for their contributions and support.
Author Contributions
MYZ, XHH and YXS designed the study. MYZ, YBX and JBZ conducted the experiments. YBX, ZG, JSM and ZXW analyzed the results. XHH and YXS collected the clinical samples. MYZ, YBX and XHH collectively conceptualized the manuscript. YXS edited the manuscript and provided critical comments. All the authors reviewed and approved the final version of the manuscript.
Ethics approval and consent to participate
The study was approved by the Clinical Research Ethics Committees of the First Affiliated Hospital of China Medical University.
Availability of data and material
All data generated or analyzed during this study are included in this published article and its supplementary information files.
Funding
This research was supported by the National Natural Science Foundation of China (82072727, 81872031) and the Outstanding Youth Fund Project of Fujian Province (2018D0016).
Availability of supporting data
The raw reads were deposited into the NCBI SRA database (Accession Number: SRA: SRP276371 and Bioproject PRJNA650666).
Competing Interests
The authors have declared that no competing interest exists.
References
1. Siegel RL, Miller KD, Jemal A. Cancer statistics, 2019. CA Cancer J Clin. 2019;69:7-34
2. Park YH, Kim N. Review of atrophic gastritis and intestinal metaplasia as a premalignant lesion of gastric cancer. J Cancer Prev. 2015;20:25-40
3. Amieva M, Peek RM Jr. Pathobiology of Helicobacter pylori-Induced Gastric Cancer. Gastroenterology. 2016;150:64-78
4. Stewart OA, Wu F, Chen Y. The role of gastric microbiota in gastric cancer. Gut Microbes. 2020;11:1220-30
5. Peek RM Jr, Crabtree JE. Helicobacter infection and gastric neoplasia. J Pathol. 2006;208:233-48
6. Compare D, Rocco A, Nardone G. Risk factors in gastric cancer. Eur Rev Med Pharmacol Sci. 2010;14:302-8
7. Sheh A, Fox JG. The role of the gastrointestinal microbiome in Helicobacter pylori pathogenesis. Gut Microbes. 2013;4:505-31
8. Monstein HJ, Tiveljung A, Kraft CH, Borch K, Jonasson J. Profiling of bacterial flora in gastric biopsies from patients with Helicobacter pylori-associated gastritis and histologically normal control individuals by temperature gradient gel electrophoresis and 16S rDNA sequence analysis. J Med Microbiol. 2000;49:817-22
9. Nardone G, Compare D. The human gastric microbiota: Is it time to rethink the pathogenesis of stomach diseases? United European Gastroenterol J. 2015;3:255-60
10. Coker OO, Dai Z, Nie Y, Zhao G, Cao L, Nakatsu G. et al. Mucosal microbiome dysbiosis in gastric carcinogenesis. Gut. 2018;67:1024-32
11. Coker OO, Nakatsu G, Dai RZ, Wu WKK, Wong SH, Ng SC. et al. Enteric fungal microbiota dysbiosis and ecological alterations in colorectal cancer. Gut. 2019;68:654-62
12. Lai GC, Tan TG, Pavelka N. The mammalian mycobiome: A complex system in a dynamic relationship with the host. Wiley Interdiscip Rev Syst Biol Med. 2019;11:e1438
13. Aykut B, Pushalkar S, Chen R, Li Q, Abengozar R, Kim JI. et al. The fungal mycobiome promotes pancreatic oncogenesis via activation of MBL. Nature. 2019;574:264-7
14. Kazmierczak-Siedlecka K, Dvorak A, Folwarski M, Daca A, Przewlocka K, Makarewicz W. Fungal Gut Microbiota Dysbiosis and Its Role in Colorectal, Oral, and Pancreatic Carcinogenesis. Cancers (Basel). 2020 12
15. Zirkel J, Klinker H, Kuhn A, Abele-Horn M, Tappe D, Turnwald D. et al. Epidemiology of Candida blood stream infections in patients with hematological malignancies or solid tumors. Med Mycol. 2012;50:50-5
16. Sanjaya PR, Gokul S, Gururaj Patil B, Raju R. Candida in oral pre-cancer and oral cancer. Med Hypotheses. 2011;77:1125-8
17. Gainza-Cirauqui ML, Nieminen MT, Novak Frazer L, Aguirre-Urizar JM, Moragues MD, Rautemaa R. Production of carcinogenic acetaldehyde by Candida albicans from patients with potentially malignant oral mucosal disorders. J Oral Pathol Med. 2013;42:243-9
18. Ramirez-Garcia A, Arteta B, Abad-Diaz-de-Cerio A, Pellon A, Antoran A, Marquez J. et al. Candida albicans increases tumor cell adhesion to endothelial cells in vitro: intraspecific differences and importance of the mannose receptor. PLoS One. 2013;8:e53584
19. Rodriguez-Cuesta J, Hernando FL, Mendoza L, Gallot N, de Cerio AA, Martinez-de-Tejada G. et al. Candida albicans enhances experimental hepatic melanoma metastasis. Clin Exp Metastasis. 2010;27:35-42
20. Ramirez-Garcia A, Rementeria A, Aguirre-Urizar JM, Moragues MD, Antoran A, Pellon A. et al. Candida albicans and cancer: Can this yeast induce cancer development or progression? Crit Rev Microbiol. 2016;42:181-93
21. Bertolini M, Ranjan A, Thompson A, Diaz PI, Sobue T, Maas K. et al. Candida albicans induces mucosal bacterial dysbiosis that promotes invasive infection. PLoS Pathog. 2019;15:e1007717
22. Bouchara JP, Declerck P, Cimon B, Planchenault C, de Gentile L, Chabasse D. Routine use of CHROMagar Candida medium for presumptive identification of Candida yeast species and detection of mixed fungal populations. Clin Microbiol Infect. 1996;2:202-8
23. Alam MZ, Alam Q, Jiman-Fatani A, Kamal MA, Abuzenadah AM, Chaudhary AG. et al. Candida identification: a journey from conventional to molecular methods in medical mycology. World J Microbiol Biotechnol. 2014;30:1437-51
24. Vahidnia A, Bekers W, Bliekendaal H, Spaargaren J. High throughput multiplex-PCR for direct detection and diagnosis of dermatophyte species, Candida albicans and Candida parapsilosis in clinical specimen. J Microbiol Methods. 2015;113:38-40
25. Maaroufi Y, Heymans C, De Bruyne JM, Duchateau V, Rodriguez-Villalobos H, Aoun M. et al. Rapid detection of Candida albicans in clinical blood samples by using a TaqMan-based PCR assay. J Clin Microbiol. 2003;41:3293-8
26. Zehm S, Schweinitz S, Wurzner R, Colvin HP, Rieder J. Detection of Candida albicans by mass spectrometric fingerprinting. Curr Microbiol. 2012;64:271-5
27. Gunasekera M, Narine M, Ashton M, Esfandiari J. Development of a Dual Path Platform (DPP(R)) immunoassay for rapid detection of Candida albicans in human whole blood and serum. J Immunol Methods. 2015;424:7-13
28. Jiang X, Dong D, Bian L, Zou D, He X, Ao D. et al. Rapid Detection of Candida albicans by Polymerase Spiral Reaction Assay in Clinical Blood Samples. Front Microbiol. 2016;7:916
29. Wagner K, Springer B, Pires VP, Keller PM. Molecular detection of fungal pathogens in clinical specimens by 18S rDNA high-throughput screening in comparison to ITS PCR and culture. Sci Rep. 2018;8:6964
30. Toju H, Tanabe AS, Yamamoto S, Sato H. High-coverage ITS primers for the DNA-based identification of ascomycetes and basidiomycetes in environmental samples. PLoS One. 2012;7:e40863
31. Chen S, Zhou Y, Chen Y, Gu J. fastp: an ultra-fast all-in-one FASTQ preprocessor. Bioinformatics. 2018;34:i884-i90
32. Magoc T, Salzberg SL. FLASH: fast length adjustment of short reads to improve genome assemblies. Bioinformatics. 2011;27:2957-63
33. Caporaso JG, Kuczynski J, Stombaugh J, Bittinger K, Bushman FD, Costello EK. et al. QIIME allows analysis of high-throughput community sequencing data. Nat Methods. 2010;7:335-6
34. Bokulich NA, Subramanian S, Faith JJ, Gevers D, Gordon JI, Knight R. et al. Quality-filtering vastly improves diversity estimates from Illumina amplicon sequencing. Nat Methods. 2013;10:57-9
35. Edgar RC. UPARSE: highly accurate OTU sequences from microbial amplicon reads. Nat Methods. 2013;10:996-8
36. Chen H, Boutros PC. VennDiagram: a package for the generation of highly-customizable Venn and Euler diagrams in R. BMC Bioinformatics. 2011;12:35
37. Conway JR, Lex A, Gehlenborg N. UpSetR: an R package for the visualization of intersecting sets and their properties. Bioinformatics. 2017;33:2938-40
38. Wang Q, Garrity GM, Tiedje JM, Cole JR. Naive Bayesian classifier for rapid assignment of rRNA sequences into the new bacterial taxonomy. Appl Environ Microbiol. 2007;73:5261-7
39. Ankenbrand MJ, Keller A, Wolf M, Schultz J, Forster F. ITS2 Database V: Twice as Much. Mol Biol Evol. 2015;32:3030-2
40. Ondov BD, Bergman NH, Phillippy AM. Interactive metagenomic visualization in a Web browser. BMC Bioinformatics. 2011;12:385
41. Wickham H CW. ggplot2: An implementation of the Grammar of Graphics. R package version 07. 2008 3
42. Krzywinski M, Schein J, Birol I, Connors J, Gascoyne R, Horsman D. et al. Circos: an information aesthetic for comparative genomics. Genome Res. 2009;19:1639-45
43. Kolde R KMR. Kolde M R. Package 'pheatmap'. Package 'pheatmap'. 2015 1
44. Liaw A WM. Classification and regression by randomForest. R news. 2002: 2: 18-22.
45. Robin X, Turck N, Hainard A, Tiberti N, Lisacek F, Sanchez JC. et al. pROC: an open-source package for R and S+ to analyze and compare ROC curves. BMC Bioinformatics. 2011;12:77
46. Roberts D W RMDW. Package 'labdsv'. Ordination and Multivariate. 2016
47. Hamilton N E FM. ggtern: Ternary diagrams using ggplot2. Journal of Statistical Software. 2018: 87: 1-17.
48. Oksanen J, Blanchet FG, Kindt R, Legendre P, O'Hara RG, Simpson GL. et al. Vegan: community ecology package. 2010; 23. 2010
49. Nguyen NH, Song ZW, Bates ST, Branco S, Tedersoo LH, Menke J. et al. FUNGuild: an open annotation tool for parsing fungal community datasets by ecological guild. Fungal Ecology. 2016;20:241-8
Author contact
![]() Corresponding authors: Xuehui Hong, M.D., Ph.D., 201 Hubinnan Road, Siming District, Xiamen, 361004, Fujian Province, China. Phone number/Fax: +86-592-2993181; E-mail: hongxuedu.cn; Yongxi Song, M.D., Ph.D., 155 North Nanjing Street, Heping District, Shenyang, 110001, Liaoning Province, China. Phone number/Fax: +86-24-83283556; E-mail: songyongxi840309com.
Corresponding authors: Xuehui Hong, M.D., Ph.D., 201 Hubinnan Road, Siming District, Xiamen, 361004, Fujian Province, China. Phone number/Fax: +86-592-2993181; E-mail: hongxuedu.cn; Yongxi Song, M.D., Ph.D., 155 North Nanjing Street, Heping District, Shenyang, 110001, Liaoning Province, China. Phone number/Fax: +86-24-83283556; E-mail: songyongxi840309com.