Impact Factor
- Issue 14; 2026
- Issue 13; 2026
- Issue 12; 2026
- Issue 11; 2026
- Issue 10; 2026
- Volume 16; 2026
- Advance Articles
- Past Issues
- Cover Images
- Cover Suggestion
- Index & Coverage
- Special Issues
Introduction
Methods
Results
Discussion
Abbreviations
Supplementary Material
Acknowledgements
References
International Journal of Biological Sciences
International Journal of Medical Sciences
 Global reach, higher impact

Theranostics 2021; 11(5):2201-2217. doi:10.7150/thno.52717 This issue Cite
Research Paper
m6A regulator-based methylation modification patterns characterized by distinct tumor microenvironment immune profiles in colon cancer
Wei Chong1,2,3, Liang Shang1,2,3, Jin Liu4, Zhen Fang2,3, Fengying Du2,3, Hao Wu2,3, Yang Liu2,3, Zhe Wang5, Yang Chen6, Shengtao Jia7, Liming Chen8, Leping Li1,2,3 ![]() , Hao Chen9
, Hao Chen9 ![]()
1. Department of Gastrointestinal Surgery, Shandong Provincial Hospital Affiliated to Shandong First Medical University, Jinan, Shandong, 250021, China
2. Department of Gastrointestinal Surgery, Shandong Provincial Hospital, Cheeloo College of Medicine, Shandong University, Jinan, Shandong, 250021, China
3. Key Laboratory of Engineering of Shandong Province, Shandong Provincial Hospital, Jinan, Shandong, 250021, China
4. Department of Gastroenterology, Key Laboratory of Engineering of Shandong Province, Shandong Provincial Hospital, Jinan, Shandong, 250021, China
5. Tianjin Sino-US Diagnostics Co., Ltd, Tianjin, China
6. Department of Radiation Oncology, Tianjin Medical University Cancer Institute and Hospital, National Clinical Research center for Cancer; Key Laboratory of Cancer Prevention and Therapy; Tianjin's Clinical Research Center for Cancer, Tianjin, China
7. Department of Tumor Cell Biology, National Clinical Research Center for Cancer, Tianjin's Clinical Research Center for Cancer, Tianjin Medical University Cancer Institute and Hospital, Tianjin, China
8. Division of Gastroenterology, Department of Medicine, Center for Advanced Biomedical Imaging and Photonics, Beth Israel Deaconess Medical Center, Harvard University, Boston, 02215, MA, USA
9. Clinical Research Center of Shandong University, Clinical Epidemiology Unit, Qilu Hospital of Shandong University, Jinan, Shandong, 250021, China
Received 2020-9-1; Accepted 2020-11-21; Published 2021-1-1
Abstract

Recent studies have highlighted the biological significance of RNA N6-methyladenosine (m6A) modification in tumorigenicity and progression. However, it remains unclear whether m6A modifications also have potential roles in immune regulation and tumor microenvironment (TME) formation.
Methods: In this study, we curated 23 m6A regulators and performed consensus molecular subtyping with NMF algorithm to determine m6A modification patterns and the m6A-related gene signature in colon cancer (CC). The ssGSEA and CIBERSORT algorithms were employed to quantify the relative infiltration levels of various immune cell subsets. An PCA algorithm based m6Sig scoring scheme was used to evaluate the m6A modification patterns of individual tumors with an immune response.
Results: Three distinct m6A modification patterns were identified among 1307 CC samples, which were also associated with different clinical outcomes and biological pathways. The TME characterization revealed that the identified m6A patterns were highly consistent with three known immune profiles: immune-inflamed, immune-excluded, and immune-desert, respectively. Based on the m6Sig score, which was extracted from the m6A-related signature genes, CC patients can be divided into high and low score subgroups. Patients with lower m6Sig score was characterized by prolonged survival time and enhanced immune infiltration. Further analysis indicated that lower m6Sig score also correlated with greater tumor mutation loads, PD-L1 expression, and higher mutation rates in SMGs (e.g., PIK3CA and SMAD4). In addition, patients with lower m6Sig scores showed a better immune responses and durable clinical benefits in three independent immunotherapy cohorts.
Conclusions: This study highlights that m6A modification is significantly associated with TME diversity and complexity. Quantitatively evaluating the m6A modification patterns of individual tumors will strengthen our understanding of TME characteristics and promote more effective immunotherapy strategies.
Keywords: Colon cancer, m6A modification, Tumor microenvironment, Immune profiles, Immunotherapy
Introduction
Methylation of N6 adenosine (m6A), which is widely observed in mRNAs, lncRNAs and miRNAs, is the most common type of RNA modification and plays crucial roles in multiple physiological processes and disease progression [1, 2]. m6A modification is also a kind of dynamic and reversible process, which is controlled by different types of regulatory proteins: the methyltransferases (“writers”), the demethylases (“erasers”) and binding proteins (“readers”) [3]. The expression and function of these regulatory proteins have great impacts on m6A modification, and investigation of these regulators can help understanding the mechanisms of m6A in gene regulation [4, 5]. Increasing evidence has demonstrated that dysregulated expression and genetic changes of m6A regulators are correlated with malignant tumor progression and immunomodulatory abnormalities [6-9]. A comprehensive understanding of the genetic variation and expression perturbations underlying cancer heterogeneity will further benefit the identification of RNA methylation-based therapeutic targets [10].
Colon cancer (CC) is one of the most common malignancies and remains the primary cause of cancer death worldwide, and 30% - 50% of patients develop recurrence, metastasis and even death within 5 years of treatment [11, 12]. Recently, with the increased understanding of the diversity and complexity of the tumor microenvironment contexture (including cancer cells, stromal cells, infiltrating immune cells, and secreted cytokines et al.), the crucial immune cell subsets in tumorigenesis and metastasis have been gradual recognized [13-16]. Indeed, assessment of the densities of lymphocyte populations (CD3 and cytotoxic CD8 T cells) at the tumor center and the tumor margin were demonstrated to play an important complementary role to the tumor staging system in relapse and mortality prediction in CC [17]. Moreover, current immunotherapies represented by specific immune checkpoint inhibitors (ICIs), such as anti-CTLA-4 and anti-PD-1/L1, have achieved a marked durable response in CC treatment [18, 19]. Evaluating immune infiltration based on the characteristics of the TME constitutes a critical approach to predicting the response to existing ICIs and developing novel immunotherapeutic strategies [20-22]. Current studies also proposed the novel concept of 'immune contexture', which classified CC tumors into three major immune coordination profiles (hot, excluded and cold) and represented different TME characteristics and treatment options [23-25]. Therefore, tumor immune phenotypes identified by comprehensively parsing the components of the tumor microenvironment will assist in guiding and predicting immunotherapeutic responsiveness [17, 26, 27].
Recent studies revealed the interactions between TME immune cell infiltration and m6A modification, which cannot be fully explained by the RNA degradation mechanism. Han et al. reported that YTHDF1 promotes lysosomal protease-directed degradation of tumor neoantigens in dendritic cells by recognizing their m6A modification and enhancing their translation [28]. Loss of YTHDF1 in dendritic cells markedly enhances the cross-presentation of antigens and the cross-priming of CD8+ T cells. Another study demonstrated that FTO impeded interferon-gamma (IFN-γ)-induced cytotoxicity in melanoma cells in vitro by upregulating PD-1, CXCR4, and SOX10 through suppression of YTHDF2-mediated RNA decay process. Moreover, knockdown of FTO sensitized melanoma to anti-PD-1 treatment in mice via the upregulation of IFN-γ [29]. METTL3-mediated mRNA m6A modification is essential for translation of the costimulatory molecules CD40, CD80, and the Snail homeostasis in cancer progression [30, 31]. However, the aforementioned studies were all restricted to one or two m6A regulators on account of technical limitations, while the antitumor effect of these regulators is regulated by numerous tumor suppressor factors that act in a highly coordinated manner. As an alternative, continuously accumulating transcriptomics and genomic data provide an ideal resource for comprehensive analysis of m6A regulators and immune regulation [32, 33]. Thus, recognizing the TME cell infiltration characteristics mediated by multiple m6A regulators will contribute to enhancing our understanding of cancer immunity.
In this study, we comprehensively evaluated the association between m6A modification patterns and TME cell-infiltrating characteristics by integrating the transcriptomic and genomic data of 1307 CC samples from TCGA and GEO databases. Three distinct m6A modification patterns with nonnegative matrix factorization (NMF) clustering were identified, and the TME characteristics of these three patterns were closely linked to three previously reported immune phenotypes: immune-inflamed, immune-excluded, and immune-desert [25]. Moreover, we constructed a scoring scheme to quantify the m6A modification patterns of individual tumors and predict patients' clinical response to ICI treatment. These findings suggested that m6A modification plays an indispensable role in shaping diverse tumor immune microenvironment profiles and in directing therapeutic intervention plans for colon cancer.
Methods
Collect and preprocess of publicly attainable expression datasets
Gene expression data and clinical features of CC samples were retrospectively collected from publicly available datasets of the NCBI GEO database (https://www.ncbi.nlm.nih.gov/geo/) and TCGA (https://cancergenome.nih.gov/). The selection criteria of CC datasets were adopted from the workflow of Dai et al. [34], and a total of 1307 patients were enrolled for analysis, including those from the GSE39582/CIT Cohort (N = 557) [35], GSE37892 (N = 130) [36], GSE14333 (N = 226) [37], and TCGA-COAD (The Cancer Genome Atlas-Colon Adenocarcinoma, N = 394) datasets (Table S1). The GSE17538 (N = 200) [38] dataset was excluded from this analysis owing to its probe cell intensity (CEL) files extensively overlapped with the GSE14333 series. Since these GEO datasets shared the same microarray sequencing platform (Affymetrix HG-U133 plus 2.0), we downloaded the raw “CEL” files and performed background adjustment and quantile normalization by 'affy' and 'simpleaffy' packages. TCGA RNA sequencing data (FPKM format) were downloaded from the UCSC Xena (https://gdc.xenahubs.net/download/TCGA-COAD.htseq_fpkm.tsv.gz) and transformed into transcripts per kilobase million (TPM) format. The ComBat method from the 'SVA' R package was used to remove the batch effects among different GEO datasets [34]. The genomic mutation data (including somatic mutation and copy number variation) of TCGA-COAD were curated from the UCSC Xena database and the Davoli et al. study [39]. The R package 'Rcircos' was employed to plot the copy number variation landscape of 23 m6A regulators in human chromosomes. Nonsynonymous mutation (including frameshift mutation, inflame mutation, missense mutation, nonsense mutation, and splice site mutation) counts were recognized as tumor mutation load (TML). The clinical information and m6A regulator expression of the meta-GEO and TCGA datasets are listed in Table S2 and S3.
Consensus molecular clustering of twenty-three m6A regulators by NMF
We retrieved the literatures related to m6A methylation modification, and a total of 23 acknowledged m6A regulator genes were curated and analyzed to identify distinct m6A methylation modification patterns [1-3, 6]. The 23 m6A regulators included 8 writers (CBLL1, KIAA1429, METTL14, METTL3, RBM15, RBM15B, WTAP, and ZC3H13), 2 erasers (ALKBH5 and FTO), and 13 readers (ELAVL1, FMR1, HNRNPA2B1, HNRNPC, IGF2BP1, IGF2BP2, IGF2BP3, LRPPRC, YTHDC1, YTHDC2, YTHDF1, YTHDF2, and YTHDF3). We performed consensus clustering with NMF to identify distinct m6A modification patterns based on the expression of 23 m6A regulators. Specifically, the expression of 23 m6A regulators (Matrix A) was factorized into 2 nonnegative matrices W and H (i.e., A≈WH). Repeated factorization of matrix A was performed, and its outputs were aggregated to obtain consensus clustering of colon cancer samples. The optimal number of clusters was selected according to cophenetic, dispersion, and silhouette coefficients. The R package 'NMF' (version 0.22.0) with the brunet algorithm and 200 nruns was used to perform the consensus clustering.
Gene set variation analysis (GSVA) and Gene Ontology (GO) annotation
We utilized GSVA analysis [40] with the R package 'GSVA' to investigate the variation in biological processes between different m6A modification patterns. The well-defined biological signatures were derived from the Hallmarker gene set [41] (download from MSigDB database v7.1) and Mariathasan et al. constructed gene set [27] (curated from IMvigor210CoreBiologies packages). GO annotation for m6A phenotype-related genes was performed in the R package 'clusterProfiler' with the cutoff value of FDR < 0.01.
Immune cell infiltration estimation by ssGSEA and deconvolution algorithm
Single sample gene set enrichment analysis (ssGSEA) was introduced to quantify the relative abundance of 28 immune cell types in the tumor microenvironment. Special feature gene panels for marking each immune cell type were curated from a recent study [42, 43]. The relative abundance of each immune cell type was represented by an enrichment score in ssGSEA analysis and normalized to unity distribution from 0 to 1. The biosimilarity of the infiltrating immune cells was estimated by multidimensional scaling (MDS) and a Gaussian fitting model. The deconvolution approach CIBERSORT [44] (http://cibersort.stanford.edu/) was used to estimate the abundances of 22 distinct leukocyte subsets with the gene expression profile of colon cancer.
Quantify the immune response predictor: Immunophenoscore, TIDE and ESTIMATE
Immunophenoscore (IPS) is a superior predictor of response to anti-CTLA-4 and anti-PD-1 regimens, which quantify the determinants of tumor immunogenicity and characterize the intratumoral immune landscapes and cancer antigenomes [42]. The scoring scheme developed from a panel of immune-related genes belonging to the four classes: MHC-related molecules (MHC), checkpoints or immunomodulators (CP), effector cells (EC) and suppressor cells (SC). The weighted averaged Z score was calculated by averaging the samplewise Z scores of the four classes within the respective category and the sum of the weighted averaged Z score was calculated as the IPS. The Tumor Immune Dysfunction and Exclusion (TIDE) algorithm proposed by Jiang et al. was utilized to model distinct tumor immune evasion mechanisms [45], including dysfunction of tumor infiltration cytotoxic T lymphocytes (CTLs) and exclusion of CTLs by immunosuppressive factors. A higher TIDE score indicated tumor cells more likely to induce immune escape, thus indicating a lower response rate to ICI treatment. The Estimation of Stromal and Immune Cells in Malignant Tumors using Expression Data (ESTIMATE) algorithm [46], which takes advantage of the unique properties of the transcriptional profiles to infer the tumor cellularity as well as the tumor purity. By using the ESTIMATE algorithm, we calculated the immune and stromal scores to predict the level of infiltrating immune and stromal cells and these form the basis to infer tumor purity. Tumor tissues with abundant immune cell infiltration represented a higher immune score and lower level of tumor purity.
Significantly mutated genes and tumor mutational signatures
We utilized the MutSigCV algorithm to identify significantly mutated genes (SMGs) [47, 48]. Specifically, MutSigCV measures the significant enrichment of nonsilent somatic mutations in a gene by addressing mutational context-specific background mutation rates. Genes with statistically significant (q < 0.1) and certified in the human Cancer Cell lines Encyclopedia (CCLE) [49] were recognized as SMGs [50] (Table S4). The mutational landscape of m6A modification genes and SMGs in TCGA-COAD cohort was depicted by the waterfall function of the R 'maftools' package [51]. Mutational signatures extracted from the TCGA genomic data also adopted the 'maftools' package. ExtractSignatures function based on Bayesian variant nonnegative matrix factorization, factorized the mutation portrait matrix into two nonnegative matrices 'signatures' and 'contributions', where 'signatures' represent mutational processes and 'contributions' represent the corresponding mutational activities [52]. The SignatureEnrichment function can automatically determine the optimal number of extracted mutational signatures and assign them to each sample based on the mutational activities. The extracted mutational portrait of CC was compared and annotated by cosine similarity analysis against the Catalogue of Somatic Mutations in Cancer (COSMIC) [53].
Identification of DEGs between distinct m6A modification phenotypes
The previous consensus clustering algorithm classified patients into three distinct m6A modification patterns, and we next determined m6A modification-related differentially expressed genes (DEGs) among distinct m6A phenotypes. The R package 'limma' [54] was used to evaluate DEGs in CC samples between different modification clusters. Specifically, gene expression data were normalized by voom and then fed to lmFit and eBayes functions to calculate the differential expressed statistics. The significance filtering criteria of DEGs were set as an adjusted P value less than 0.001.
Construction of the m6Sig score
We developed an m6A scoring scheme to quantify the m6A modification level of individual patients by using principal component analysis (PCA). Specifically, the overlapping DEGs identified from different m6A clusters were selected and employed to perform prognostic analysis for each gene using a univariate Cox regression model. The genes with a significant prognostic impact were extracted for further feature selection by using recursive feature elimination (RFE) with random forest and the 10-fold cross-validation method in the 'caret' package. We then curated the expression profile of the final determined genes to perform PCA analysis, and principal components 1 and 2 were extracted and served as the signature score. This method mainly focuses on the score on the set with the largest block of well correlated (or inverse-correlated) genes in the set, while downweighting contributions from genes that do not track with other set members. We then adopted a formula similar to previous studies to define the m6Sig score [55, 56]: m6Sig score= ∑(PC1i+PC2i), where is the expression of final determined m6A phenotype-related genes.
Collection of genomic and clinical information of the ICI-based cohort
We systematically searched the gene expression profiles of ICI therapy, which could be publicly obtained and coupled with detailed clinical pathology information. Three immunotherapeutic cohorts were finally included in our study: metastatic melanoma treated with nivolumab (anti-PD-1 mcAb) [57] or ipilimumab (anti-CTLA-4 mcAb) [58], and metastatic urothelial cancer (mUC) treated with atezolizumab (anti-PD-L1 mcAb) [27]. The gene expression profiles of pre-therapy biopsy samples were curated and transformed into the TPM format for further analysis.
Statistical analyses
The statistical analyses in this study were generated by R-3.6.1. For quantitative data, statistical significance for normally distributed variables was estimated by Student's t-tests, and nonnormally distributed variables were analyzed by the Wilcoxon rank-sum test. For comparisons of more than two groups, Kruskal-Wallis tests and one-way analysis of variance were used as nonparametric and parametric methods, respectively [59]. Two-sided Fisher exact tests were used to analyze contingency tables. Kaplan-Meier survival analysis and the Cox proportional hazards model were used to analyze the association between the m6A modification pattern and prognosis with the R package 'Survminer' (0.4.6). The surv-cutpoint function from the 'survival' package was applied to stratify samples into high and low m6Sig score subgroups. The receiver operating characteristic (ROC) curve was used to assess the prognosis classification performance of the m6Sig score model, and the area under the curve (AUC) were calculated using 'timeROC' package (0.3). Patients with detailed clinical information were included and adjusted for confounding factors in the multivariate regression model. All comparisons were two-sided with an alpha level of 0.05, and the Benjamini-Hochberg method was applied to control the false discovery rate (FDR) for multiple hypothesis testing [60].
Results
Landscape of genetic variation of m6A regulators in colon cancer
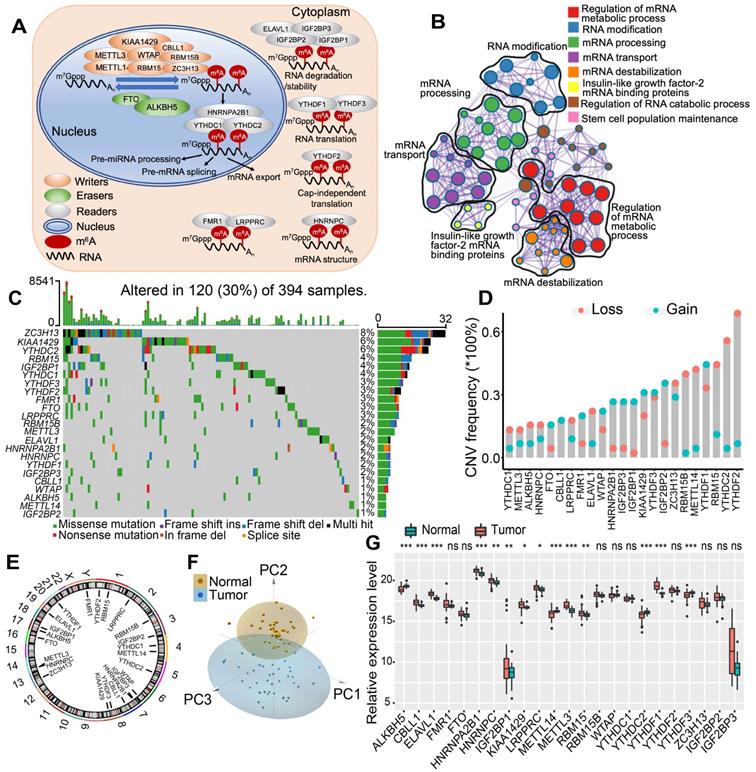
In this study, we investigated the roles of 23 m6A RNA methylation regulatory genes in CC (“writers”: CBLL1, KIAA1429, METTL14, METTL3, RBM15, RBM15B, WTAP, and ZC3H13; “readers”: ELAVL1, FMR1, HNRNPA2B1, HNRNPC, IGF2BP1, IGF2BP2, IGF2BP3, LRPPRC, YTHDC1, YTHDC2, YTHDF1, YTHDF2, and YTHDF3; and “erasers”: ALKBH5 and FTO). Figure 1A shows that the dynamic reversible process of these m6A regulators can recognize, remove and add m6A-modified sites and alter substantial biological processes, such as RNA splicing, RNA translation, and RNA degradation. GO enrichment and Metascape analyses of 23 m6A regulators were conducted, and significantly enriched biological processes are summarized in Figure 1B and Figure S1A. We first determined the prevalence of somatic mutations of 23 m6A regulators in CC. A total of 120 of the 394 (30.5%) samples experienced genetic alterations of m6A regulators, primarily including amplification, missense mutations, and deep deletions. ZC3H13 showed the highest mutation frequency, followed by KIAA1429 and YTHDC2 (Figure 1C). We also examined mutation co-occurrence across all m6A regulators and found a significant mutation co-occurrence relationship between IGF2BP1 and YTHDC2, YTHDF1 and KIAA1429, LRPPRC and YTHDF2, and RBM15 and ZC3H13 (Figure S1B). Further analysis of 23 m6A regulators revealed that CNV mutations were prevalent. YTHDF1/3, IGF2BP1/2/3, KIAA1429 and HNRNPA2B1 showed widespread CNV amplification. In contrast, YTHDF2, YTHDC2, METTL14, RBM15 and ZC3H13 had prevalent CNV deletions (Figure 1D). The locations of CNV alterations of 23 m6A regulators on chromosomes are shown in Figure 1E. Moreover, we performed principal component analysis (PCA) based on paired tumor-normal specimens and found that the 23 m6A regulators completely distinguished CC samples from normal samples (Figure 1F). Further analysis demonstrated that ALKBH5, METTL14, YTHDC2, and YTHDF3 were significantly downregulated in tumor samples, whereas CBLL1, ELAVL1, HNRNPA2B1, HNRNPC, IGF2BP1, KIAA1429, LRPPRC, METTL3, RBM15, and YTHDF1 were significantly upregulated in tumor samples (Figure 1G). The expression of m6A regulators with CNV amplification was significantly increased in CC samples compared to normal control samples, such as HNRNPA2B1, IGF2BP1, KIAA1429, and YTHDF1, while METTL14 and YTHDC2 were markedly decreased in the tumor specimens (Figure 1D, 1G). Furthermore, Spearman correlation analysis was performed to evaluate mutual regulation among these m6A regulators (Figure S1C). The erasers ALKBH5 and FTO showed a significant inverse correlation with other m6A regulators. Cox regression analysis was employed to ascertain the relationship between these m6A regulators and the prognosis of CC patients. A forestplot showed that YTHDC1 could be considered a protective factor and was significantly associated with prolonged relapse-free survival, while IGF2BP1 was recognized as a risk factor (Figure S1D-E). The above analysis demonstrated the significant differences and connections in the genomic and transcriptomic landscape of m6A regulators between normal and CC samples. Therefore, the expression alterations and genetic variation in m6A regulators played a crucial role in regulating CC occurrence and progression.
The landscape of genetic alterations of m6A regulators in colon cancer. (A) Regulation of m6A modification and its biological functions in RNA metabolism by m6A “writer”, “eraser” and “reader” proteins. m6A RNA methylation was known to be involved in all stages in the life cycle of RNA including pre-mRNA splicing, pre-miRNA processing, RNA translation, RNA degradation/stability, etc. (B) Metascape enrichment network visualization showed the intra-cluster and inter-cluster similarities of enriched terms, up to 20 terms per cluster. Cluster annotations were shown in the color code. (C) 120 of the 394 CC patients experienced genetic alterations of 23 m6A regulators, with a frequency of 30%, mostly including amplification, missense mutations, and deep deletions. The number on the right indicated the mutation frequency in each regulator. Each column represented individual patients. (D) The CNV mutation frequency of 23 m6A regulators was prevalent. The column represented the alteration frequency. The deletion frequency, pink dot; The amplification frequency, blue dot. (E) The location of CNV alteration of m6A regulators on chromosomes. (F) Principal component analysis of 23 m6A regulators to distinguish tumors from normal samples. (G) The difference of mRNA expression levels of 23 m6A regulators between normal and CC samples. The asterisks represented the statistical P-value (*P < 0.05; **P < 0.01; ***P < 0.001).
Identification of m6A methylation modification patterns mediated by 23 regulators
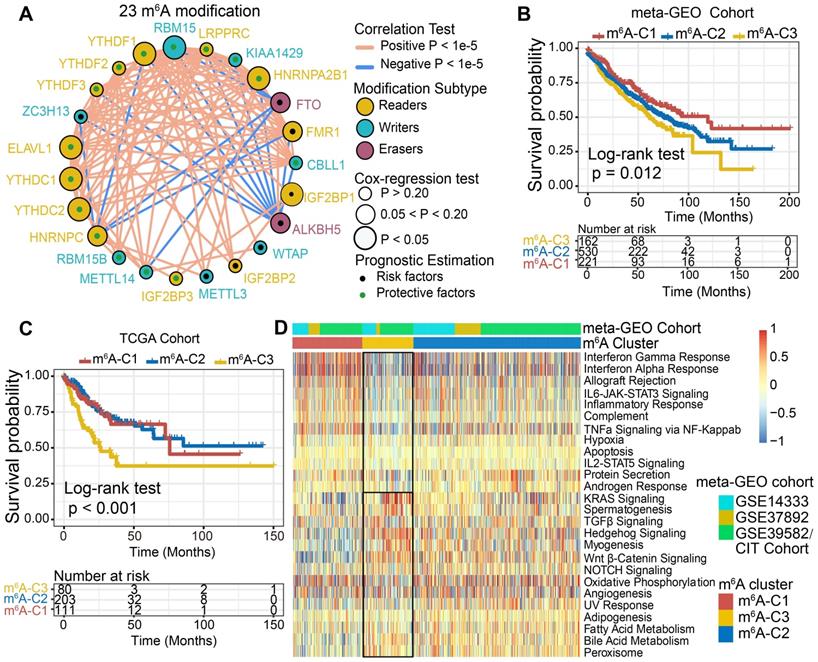
Three GEO datasets with available survival data and clinical annotations (CIT/GSE39582, GSE14333 and GSE37892) were enrolled in the meta-cohort. The comprehensive landscape of the interactions of the 23 m6A regulators, the regulator connections and their prognostic significance in CC patients was illustrated in the m6A regulator network (Figure 2A). The results indicated that cross-talk among the regulators of writers, readers and erasers probably plays critical roles in the formation of different m6A modification patterns and was implicated in cancer pathogenesis and progression. Based on these hypotheses, we utilized consensus clustering analysis of the NMF algorithm to stratify samples with qualitatively different m6A modification patterns based on the expression of 23 m6A regulators. Accordingly, we identified three distinct modification pattern clusters, including 221 cases in pattern cluster 1, 530 cases in cluster 2 and 162 cases in cluster 3 (Figure 2B, Figure S2A-C). We termed these clusters m6A-C1, m6A-C2, and m6A-C3, among which m6A-C1 exhibited a prominent survival advantage, whereas m6A-C3 had the worst prognosis in the meta-GEO cohort (P = 0.012, log-rank test). In addition, we performed identical analyses in the TCGA-COAD cohort, and similar results were obtained (P < 0.001, log-rank test, Figure 2C, Figure S2D). Multivariate Cox proportional hazards regression analysis further demonstrated that this modification model was associated with patient survival outcomes after adjusting for clinicopathologic factors in these two cohorts (meta-GEO cohort: m6A-C1 vs. m6A-C3, HR, 0.63 [95%CI, 0.46 to 0.87], P = 0.005, Figure S3A; TCGA-COAD: m6A-C1 vs. m6A-C3, HR, 0.49 [95%CI, 0.29 to 0.83], P = 0.008, Figure S3B). We also noticed a significant difference in the expression of m6A regulators between distinct m6A modification patterns. IGF2BP1 and YTHDF1 were significantly elevated in the m6A-C3 subtype; FTO, RBM15B, METTL14, and YTHDC2 were markedly increased in the m6A-C2 subtype; and ALKBH5, IGF2BP3 and YTHDC1 were evidently increased in the m6A-C1 subtype (Figure S2C-D).
m6A methylation modification pattern and relevant biological pathway. (A) The interaction of expression on 23 m6A regulators in CC. The m6A regulators in three RNA modification types were depicted by circles in different colors. Readers, yellow; Writers, blue; Erasers, red. The lines connecting m6A regulators represented their interaction with each other. The size of each circle represented the prognosis effect of each regulator and scaled by P-value. Protective factors for patients' survival were indicated by a green dot in the circle center and risk factors indicated by the black dot in the circle center. (B) Kaplan-Meier curves of relapse-free survival (RFS) for 913 CC patients in meta-GEO cohort with different m6A clusters. The numbers of patients in m6A-C1, m6A-C2, and m6A-C3 phenotypes are 221, 530, and 162, respectively (Log-rank test). (C) Kaplan-Meier curves of relapse-free survival (RFS) for 394 CC patients in the TCGA cohort with three m6A clusters. The numbers of patients in m6A-C1, m6A-C2, and m6A-C3 phenotypes are 111, 203, and 80, respectively (Log-rank test). The m6A-C3 showed significantly worse prognostic than the other two m6A clusters in both meta-GEO and TCGA-COAD cohorts. (D) Heatmap shows the GSVA score of representative Hallmark pathways curated from MSigDB in distinct m6A modification patterns. The GEO cohort composition (GSE14333, GSE37892, and GSE39582) were used as sample annotations.
The m6A modification patterns characterized by distinct immune landscapes
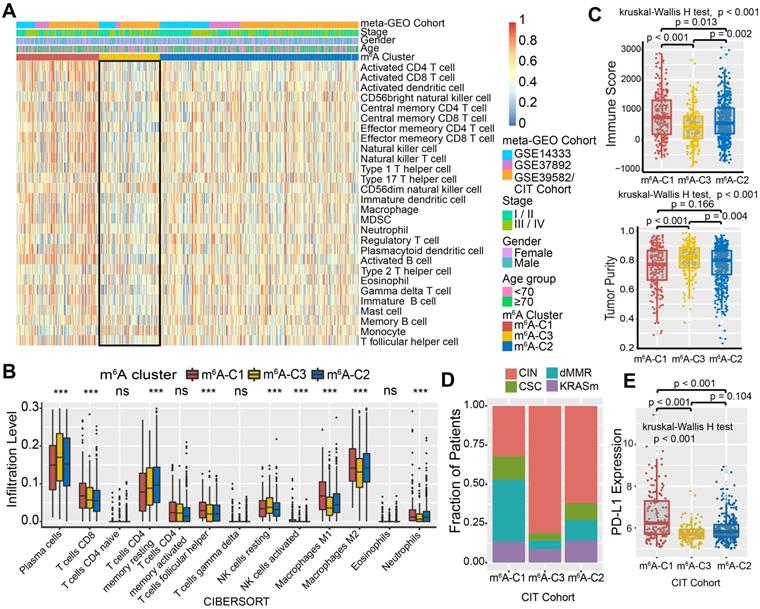
To explore the biological molecular changes underlying three distinct m6A modification patterns, we performed GSVA enrichment analysis against the Hallmarker gene set (Figure 2D). GSVA indicated that m6A-C1 was significantly enriched in immune activation-related processes, including interferon gamma/alpha response, allograft rejection and inflammatory response. However, m6A-C3 presented enrichment pathways prominently associated with carcinogenic activation and stromal pathways, such as the Wnt-β-catenin, TGF-β, and hedgehog signaling pathways. Intriguingly, m6A-C2 was highly enriched in both immune regulation and stromal-related signaling pathways. Furthermore, we constructed a heatmap with ssGSEA to visualize and compare the relative abundances of 28 immune infiltrating cell subpopulations among distinct m6A modification patterns (Figure 3A). Antitumor lymphocyte cell subpopulations, such as effector memory CD4+/CD8+ T cells, activated CD4+/CD8+ T cells, and NK T cells, were mainly enriched in the m6A-C1 and m6A-C2 subtypes. However, regulatory T cells, type 2 T helper cells, monocytes, etc. were markedly elevated in the m6A-C3 subtype. We also further characterized the immune infiltration profile with CIBERSORT, a deconvolution algorithm using support vector regression to evaluate the immune cell subsets in the TME. A consistent result was also observed in this m6A methylation modification stratification (Figure 3B). Previous studies revealed that the immune-excluded tumor phenotype was characterized by an abundance of immune cells, while these immune cells were retained in the stroma surrounding tumor cell nests rather than penetrating their parenchyma [25]. Therefore, we speculated that abundant stromal elements in the m6A-C2 subtype suppressed an effective antitumor immune response. Subsequent analyses demonstrated that stromal activation was markedly enhanced in the m6A-C2 subtype, as exhibited by processes related to epithelial-mesenchymal transition (EMT), TGF-β, and WNT-target pathways, further corroborating our hypothesis (Figure S3C-D). Moreover, we used the ESTIMATE algorithm to quantify the overall infiltration of immune cells (Immune Score) and tumor cell purity (Tumor Purity) across three modification patterns. Further analyses revealed that m6A-C1 exhibited the highest immune scores, followed by m6A-C2 and m6A-C3 (Figure 3C, upper panel). Conversely, m6A-C3 had a higher tumor purity than m6A-C2 and m6A-C1, suggesting that m6A-C2 and m6A-C1 subtype tumors are surrounded by more nontumor components (e.g., immune cells and stromal cells) (Figure 3C, lower panel). Marisa et al. (CIT cohort/GSE39582) stratified CC patients into four dominant molecular subtypes (CIN, CSC, dMMR, and KRASm) and identified dMMR tumors associated with immune coordination while CIN associated with ECM-receptor interaction, focal adhesion, and Wnt receptor pathways [35]. Consistent with the previous findings, patients with the CIN subtype were predominantly clustered into m6A-C2 and m6A-C3, whereas the dMMR subtype was mainly concentrated within m6A-C1 tumors (Figure 3D). Considering that PD-L1 is a well-established biomarker for predicting the response to anti-PD-1/L1 treatment [61], we also compared the PD-L1 expression level in different m6A modification clusters and observed a significant up-regulation in the m6A-C1 subtype (Figure 3E). Based on these findings, we confirmed that the three m6A modification patterns were characterized by different immune infiltration profiles. As expected, m6A-C1 was recognized as an immune-inflamed phenotype characterized by immune activation and abundant immune cell infiltration; m6A-C2 was recognized as an immune-excluded phenotype characterized by stromal activation and weakened immune cell infiltration; and m6A-C3 was recognized as an immune-desert phenotype characterized by immune suppression.
TME characteristics in distinct m6A modification patterns. (A) Unsupervised clustering of 23 m6A regulators in the meta-GEO CC cohort. Clinicopathological information including age, gender, and tumor stage, as well as the m6A cluster, is shown in annotations above. Red represented the high expression of regulators and blue represented the low expression. (B) The fraction of tumor-infiltrating lymphocyte cells in three m6A clusters using the CIBERSORT algorithm. Within each group, the scattered dots represented TME cell expression values. The thick line represented the median value. The bottom and top of the boxes were the 25th and 75th percentiles (interquartile range). The whiskers encompassed 1.5 times the interquartile range. The statistical difference of three gene clusters was compared through the Kruskal-Wallis H test. *P < 0.05; **P < 0.01; ***P < 0.001. (C) The immune score and tumor purity of three gene clusters were analyzed and plotted. (D) The proportion of molecular subtypes in the three modification patterns. (E) Comparison of PD-L1 expression level across three m6A modification patterns.
We further investigated the specific association between each m6A regulator and immune cell infiltration by using Spearman's correlation analyses (Figure S4A). High expression of ALKBH5, FTO, IGF2BP3, and WTAP was significantly associated with enhanced immunocyte infiltration, whereas CBLL1, ELAVL1, FMR1, HNRNPA2B1, IGF2BP1, KIAA1429, LRPPRC, RBM15, YTHDF1-3, and ZC3H13 expression exhibited a negative correlation with the immune infiltration level. Among these m6A regulators, the m6A binding protein IGF2BP1 attracted our attention on account of its significant negative correlation with prognostic outcomes and immune infiltration. Moreover, a strong positive correlation between IGF2BP1 and YTHDF1 was identified in the aforementioned results (Figure 2A). Current studies revealed the mechanism of m6A-regulator YTHDF1 in mediating the activation of dendritic cells (DCs) and antigen cross-priming of CD8+ T cells by enhancing translation of mRNA encoding cathepsins (lysosomal proteases that degrade antigens in phagosomes) [28]. Our study also found that IGF2BP1 exhibited a significant negative correlation with the infiltration levels of activated DCs, immature DCs, and CD8+ T cells (Figure S4A-B). We next stratified IGF2BP1 into high versus low expression subgroups and explored the molecular pathogenesis behind IGF2BP1. GSEA analysis demonstrated that samples with low IGF2BP1 expression showed enrichment of genes involved in the interferon gamma/alpha response, TNFα via NF-κB, and inflammatory response signaling pathways (Figure S4C). The ESTIMATE algorithm exhibited a higher immune score in the IGF2BP1 low-expression subgroup, which confirmed the above findings (Figure S4D). Four categories of immunogenicity analysis revealed that the low IGF2BP1 expression subgroup was characterized by the upregulation of cross-presentation-related MHC molecules and immune effector cells but downregulation of immune suppressor cells (Figure S4E). In addition, we observed that tumors with IGF2BP1 mutations harbored significantly greater TML than those without IGF2BP1 mutations (Figure S4F). Taken together, we speculated that IGF2BP1 may coordinate with YTHDF1 to mediate methylation modification that suppressed the activation of DCs and cytotoxic T lymphocytes, thus impeding the intratumoral antitumor immune response.
m6A phenotype-related DEGs in colon cancer
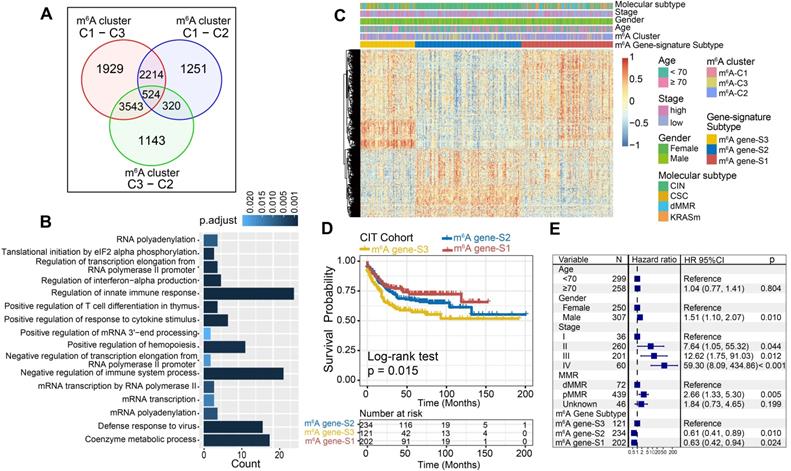
Although the consensus clustering algorithm based on m6A regulator expression classified CC patients into three m6A modification phenotypes, the underlying genetic alterations and expression perturbations within these phenotypes were not well known. Based on these queries, we further examined the potential m6A-related transcriptional expression change across three m6A modification patterns in CC. The empirical Bayesian approach was applied to determine overlapping differentially expressed genes (DEGs) among the three m6A modification patterns. A total of 524 DEGs that represented the critical distinguishing index of the three m6A modification patterns were considered as m6A-related signature and illustrated in a Venn diagram (Figure 4A, Table S5). GO enrichment analysis of these signature genes revealed that the biological processes related to RNA modification, transcription, and immune regulation were significant over-represented (Figure 4B). These results further demonstrated the overlapped DEGs were characterized by m6A modification and immunity, and could be regarded as the m6A-related gene signatures. Based on the 524 most representative m6A phenotype-related signature genes, we performed unsupervised consensus clustering analysis and obtained three stable transcriptomic phenotypes (Figure S5A-B). These stratifications divided patients into three distinct m6A gene signature subgroups that had different clinicopathologic features and were defined as m6A gene-S1, m6A gene-S2 and m6A gene-S3 (Figure 4C). We found that patients with an advanced clinical stage were represented by the m6A gene-S3 subgroup, and patients with CIN subtypes and down-regulated PD-L1 expression were mainly concentrated in the m6A gene-S2 and S3 subgroups (Figure 4C, Figure S5C). Further survival analysis indicated a significant prognostic differences among the three m6A gene signatures in CC samples. The m6A gene-S1 signature was proven to be associated with better prognosis, while m6A gene-S3 was associated with worse survival outcomes (Figure 4D). The association between the m6A gene signatures with survival remained statistically significant after considering age, gender, MMR and stage (Cox proportional hazards model, m6A-S2 vs. m6A-S3, HR, 0.61 [95%CI, 0.41 to 0.89], P = 0.010; Figure 4E). The expression levels of the 23 m6A regulators among three gene signature subgroups were also compared and shown in Figure S5D. We observed significant differences in m6A regulator expression between the three m6A gene signature subgroups, which was consistent with the expected results of the m6A methylation modification patterns.
Construction of differential expression of m6A gene signatures and functional annotation. (A) 524 m6A-related differentially expressed genes (DEGs) between three m6A-clusters were shown in the Venn diagram. (B) Functional annotation for m6A-related genes using GO enrichment analysis. The color depth of the barplots represented the number of genes enriched. (C) Unsupervised clustering of overlapping m6A phenotype-related DEGs to classify patients into different genomic subtypes, termed as m6A gene S1-3, respectively. The gene signature subtypes, m6A clusters, molecular subtypes, tumor stage, gender, and age were used as patient annotations. (D) The survival curves of the m6A phenotype-related gene signatures were estimated by the Kaplan-Meier plotter. (P = 0.015, Log-rank test). (E) Subgroup analysis estimating clinical prognostic value between m6A gene signature in independent CC data sets and cancer stage by univariate Cox regression. The length of the horizontal line represented the 95% confidence interval for each group. The vertical dotted line represented the hazard ratio (HR) of all patients.
Construction of the m6Sig score and exploration of its clinical relevance
Although our findings identified the role of m6A modification in prognosis and immune infiltration modulation, these analyses were only based on the patient population and could not accurately predict the patterns of m6A methylation modification in individual tumors. Therefore, we developed a scoring scheme termed the m6Sig score, which is based on the identified m6A-related signature genes, to quantify the m6A modification pattern of individual CC patients. Considering the complexity of the quantification of m6A modification, we illustrated the workflow of m6Sig score construction with the alluvial diagram (Figure 5A). These results indicated that m6A gene-S2 with the CIN subtype was linked to a higher m6Sig score, whereas m6A gene-S1 exhibited a lower m6Sig score. Notably, m6A-C3 showed the highest m6Sig score, followed by m6A-C2 and m6A-C1 (Figure S6A). We examined the relationship between known biological signatures and the m6Sig score through Spearman analysis. A heatmap of the correlation matrix demonstrated that the m6Sig score was markedly negatively correlated with the immune activation process and DNA repair signatures but positively correlated with EMT and stromal-relevant signatures (Figure 5B). There was also a significant inverse correlation between the m6Sig score and the immune score (r = -0.44, P < 0.001), demonstrating the crosstalk between the m6Sig score and immune infiltration evaluation (Figure S6B). Similarly, compared with the subgroups of patients with a high m6Sig score, the low m6Sig score subgroup had higher proportions of MHC molecules and immune effector cells but lower proportions of suppressor cells and checkpoint molecules (Figure S6C). Furthermore, we sought to determine the prognostic ability of the m6Sig score in predicting survival outcome by dividing the patients into low- or high-score subgroups with a cutoff value of 1.8947 (Methods section). As expected, patients with low m6Sig score were significantly associated with a better prognosis in the CIT cohort (HR, 0.47 [95%CI, 0.35 to 0.63], P < 0.001, Figure 5C), and the results of the ROC curves analysis validated the predictive advantage of the established risk model (AUC = 0.732, Figure S6D). Furthermore, multivariate Cox regression model analysis considering patient age, gender, tumor stage, molecular subtype and MSI status confirmed the m6Sig score as a robust and independent prognostic biomarker for evaluating patient outcomes (HR, 0.58 [95%CI, 0.42 to 0.80], P < 0.001, Figure S6F). We also explored the relationship between the m6Sig score and molecular subtype and found that the dMMR subtype was associated with a lower m6Sig score than other CC subtypes (Figure 5D). Additionally, the PD-L1 expression level was investigated, and there was a pronounced elevation in the low m6Sig score group (Figure 5E).
Construction of m6Sig score and explore the relevance of clinical features. (A) Alluvial diagram of m6A clusters in groups with different molecular subtypes (CIN, CSC, dMMR and KRASm), m6A-gene cluster, and m6Sig score. (B) Correlations between m6Sig score and the known biological gene signatures using Spearman analysis. The negative correlation was marked with blue and positive correlation with red. (C) Kaplan-Meier curves for high and low m6Sig score patient groups in CIT cohort. Log-rank test, P < 0.001. (D) Distribution of m6Sig score in the different molecular subtypes. The thick line represented the median value. The bottom and top of the boxes were the 25th and 75th percentiles (interquartile range). The whiskers encompassed 1.5 times the interquartile range. The differences between every two groups were compared through the Kruskal-Wallis H test. (E) Relative distribution of PD-L1 expression in high m6Sig score versus low m6Sig score subgroups. (F) Kaplan-Meier curves for patients with high and low m6Sig score subgroups in the TCGA cohort. (G) Violin plot showing m6Sig score in groups with high or low MSI and stable status. The differences between the four groups were compared through the Kruskal-Wallis test. MSS, microsatellite stable; MSI-H, high microsatellite instability; MSI-L, low microsatellite instability. (H-I) Relative distribution of tumor mutation load (H) and somatic copy number alternation (I) in m6Sig score high versus low subgroups. (J) Mutational landscape of SMGs in TCGA-COAD stratified by low (left panel) versus high m6Sig score (right panel) subgroups. Individual patients were represented in each column. The upper barplot showed TML, the right bar plot showed the mutation frequency of each gene in separate m6Sig score groups. m6A cluster, stage, gender, MSI status, and mutational signatures were shown as patient annotations.
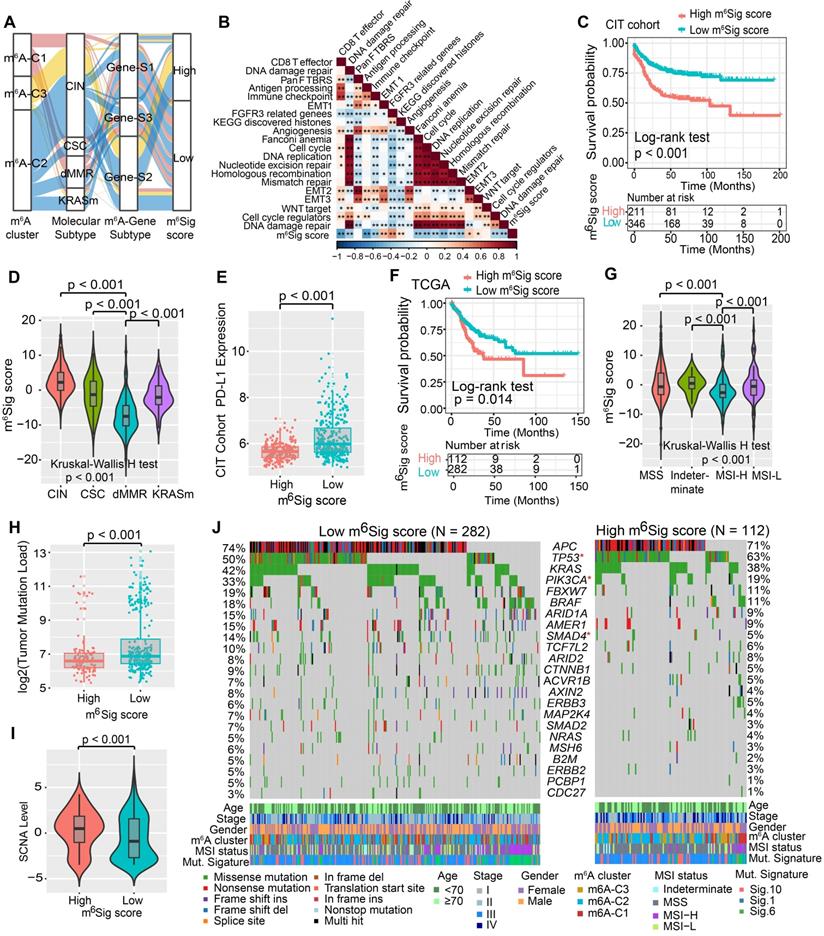
We next validated the constructed m6A scoring system by integrating the clinical characteristics and genomic information of TCGA-COAD database. It was also found that m6Sig score displayed the potential prognosis predictive value in TCGA cohort (AUC = 0.704, Figure S6E), and patients with low m6Sig score indicated a prominent survival benefit (HR, 0.62 [95%CI, 0.42 to 0.91], P = 0.014; Figure 5F). Multivariate analysis for the TCGA cohort also confirmed that the m6Sig score could act as an independent prognostic biomarker in CC (HR, 0.65 [95%CI, 0.41 to 0.90], P = 0.009; Figure S6G). TCGA analysis revealed a comprehensive molecular characterization of CC and suggested subdividing tumors into four subtypes based on MSI status. A significant lower m6Sig score was found in samples of the MSI-H subtype than in those of the other three subtypes (Figure 5G). To further verify the reliability of the m6A scoring model, we utilized the two aforementioned CC cohorts and an independent cohort to determine the relationship between the m6Sig score and patient prognosis (GSE14333, GSE37892 and GSE33113). Consistent with the above findings, the low m6Sig score group showed an obvious survival advantage over the high score group (Figure S7A-C). The above results strongly suggested that the m6Sig score can represent the m6A modification patterns and predict the prognosis of CC patients.
Increasing evidence has demonstrated an association between the tumor genome somatic mutations and responsiveness to immunotherapy. Consequently, we investigated the distribution patterns of tumor mutation load in different m6Sig score groups and revealed that the low m6Sig score group had higher mutation frequencies (Figure 5H). We also noticed a higher frequency of somatic copy number alterations (SCNA) in the low m6Sig score subgroup, consistent with the previous finding that SCNA correlated positively with immune evasion and tumor cell proliferation (Figure 5I). We further performed significantly mutated gene (SMG) analysis for CC samples in the low m6Sig score subgroup versus the high score subgroup. The SMG mutational landscapes showed that PIK3CA (33% vs. 19%) and SMAD4 (14% vs. 5%) had higher somatic mutation rates in the low m6Sig score group, whereas TP53 (50% vs. 63%) had higher somatic mutation rates in the high m6Sig score subtype (Fisher's exact test, P < 0.05, Figure 5J). To gain further insights into the mutational processes operative in CC, we extracted three mutational signatures (known as signatures 1, 6, and 10) from the TCGA-COAD mutational profile. We found that the low m6Sig score subtype exhibited a significantly higher proportion of mutational signature 6 (Fisher's exact test, P = 0.013, Figure 5J). These data enabled us to depict the effect of m6Sig score classification on genomic variation more comprehensively, as well as to reveal the potentially complex interaction between individual somatic mutations and m6A modifications.
The role of m6Sig score in predicting immunotherapeutic benefits
ICI treatment represented by CTLA-4/PD-1 inhibitors has undoubtedly caused a major breakthrough in antitumor therapy. In addition to well-known TML, PD-L1, and MSI [48, 62], newly identified predictors, such as TIDE and IPS, are widely used and strongly recommended to evaluate the immune response. Our analysis also revealed that the TIDE was significantly decreased in the low m6Sig score group, and IPS was significantly elevated in the low m6Sig score group (TIDE distribution in TCGA-COAD and CIT, both P < 0.001, Figure 6A-B; IPS distribution in TCGA-COAD and CIT, both P < 0.001, Figure 6C-D). These findings indirectly demonstrated that the representation of tumor m6A modification patterns plays a crucial role in mediating the immune response.
The m6Sig score predicts immunotherapeutic benefits. (A-D) The relative distribution of TIDE was compared between m6Sig score high versus low groups in TCGA-COAD (A) and CIT (B) cohort, respectively. The relative distribution of IPS was also compared between m6Sig score high and low groups in TCGA-COAD (C) and CIT (D) cohort. (E) Kaplan-Meier curves for high and low m6Sig score patient groups in the Riaz et al. cohort. Log-rank test, P = 0.030. (F) The fraction of patients with clinical response to anti-PD-1 immunotherapy (Riaz et al. cohort) in low or high m6Sig score groups. CR/PR vs. SD/PD: 39% vs. 61% in the low m6Sig score groups, 11% vs. 89% in the high m6Sig score groups. (G) Kaplan-Meier curves for high and low m6Sig score patient groups in the Vanallen et al. cohort. Log-rank test, P = 0.032. (H) The fraction of patients with clinical response to anti-CTLA-4 immunotherapy in low or high m6Sig score groups of Vanallen et al. cohort. CR/SD vs. PD: 42% vs. 58% in the low m6Sig score groups and 25% vs. 75% in the high m6Sig score groups. CR, complete response; PR, partial response; SD, stable disease; PD, progressive disease.
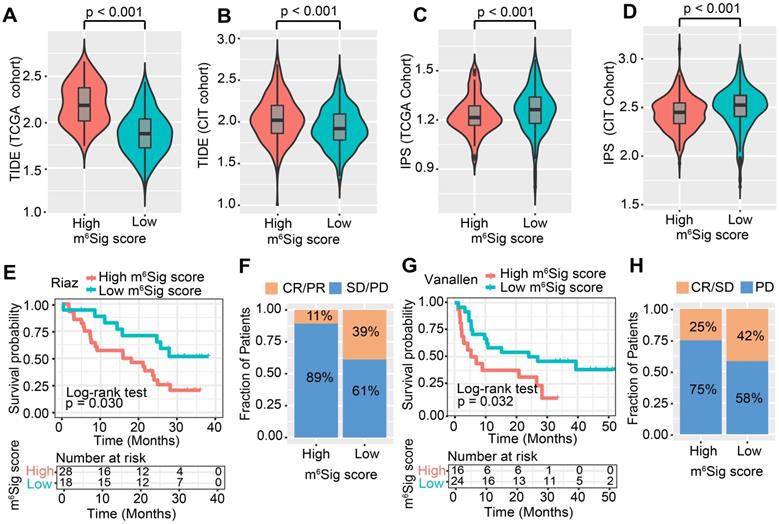
Considering the strong connection of the m6Sig score with the immune response, we next investigated whether the m6A modification signature could predict patients' response to ICI therapy in three independent immunotherapy cohorts. Firstly, in both the anti-PD-1 cohort [57] (Riaz et al. study) and anti-CTLA-4 cohort [58] (Vanallen et al. study), patients with a low m6Sig score group exhibited significant clinical advantages and markedly prolonged survival (anti-PD-1, HR, 0.40 [95%CI, 0.18 to 0.92], P = 0.030. Figure 6E; an-CTLA-4, HR, 0.42 [95%CI, 0.19 to 0.92], P = 0.032, Figure 6G). The significant therapeutic benefits and immune response to ICI treatment were confirmed in patients with low m6Sig score compared to those with high m6Sig score (response rate of anti-PD-1 cohort: 39% vs. 11%, Figure 6F; response rate of anti-CTLA-4 cohort: 42% vs. 25%, Figure 6H). A consistent result was also observed in the anti-PD-L1 cohort (Mariathasan et al. study), lower m6Sig scores in mUC patients were significantly associated with better clinical outcomes and higher tumor mutational load (anti-PD-L1, HR, 0.66 [95%CI, 0.49 to 0.88], P = 0.004, Figure S7D-F). Taken together, our findings strongly suggest that the m6Sig score is associated with the response to immunotherapies and can further predict the prognosis of patients.
Discussion
Mounting evidence has shown that m6A modification plays an essential role in innate immunity, inflammation, and antitumor effects through interaction with diverse m6A regulators [6, 7, 63]. Although plenty of elegant studies have revealed the epigenetic modulation of m6A regulators in the immune contexture, the overall TME characteristics mediated by integrated m6A regulators have not been comprehensively recognized. Therefore, identifying distinct m6A modification patterns in the tumor immune microenvironment will provide insights into the interactions of m6A RNA methylation on anti-tumor immune response and facilitate more effective precision immunotherapy strategies.
In this study, we identified three distinct m6A methylation modification patterns characterized by different immune phenotypes, which were correlated with diverse anticancer immunity. The m6A-C1 was characterized by immune activation and tumor-infiltrating lymphocyte infiltration, corresponding to an immune-inflamed phenotype. The m6A-C2 was characterized by the presence of immune cells and stroma, together with EMT, TGF-β and Wnt signaling pathway activation, corresponding to an immune-excluded phenotype. The m6A-C3 was characterized by the immunosuppression TME, corresponding to an immune-desert phenotype. A previous study demonstrated that the tumor microenvironment contexture plays a crucial role in tumor progression and immunotherapeutic efficacy [20]. Baseline levels of tumor-infiltrating CD4+/CD8+ T cells, Macrophage M1, NK cells and inflammatory cytokines secretion et al. have been shown to be correlated with the likelihood of immune response [20, 64, 65]. We also identified that the m6A-C1 pattern was significantly associated with elevated tumor-infiltrating lymphocyte and PD-L1 levels, supporting the potential predictive value on immunotherapy benefits. Recent studies reported that the activation of EMT- and TGF-β-related pathways impeded the penetration of lymphocyte cells into the parenchyma of these tumors [66]. Specific molecular inhibitors targeting TGF-β have been shown to reshape the tumor microenvironment (e.g. reprogram peritumoral stromal fibroblasts) and restore the anti-tumor immunity [27, 67]. Based on these findings, we speculated that CC patients with the m6A-C2 pattern may benefit from combination treatment with ICB agents and TGF-β blockade.
Furthermore, differentially expressed genes (DEGs) identified from distinct m6A modification patterns were significantly over-represented in biological pathways implicated in RNA polyadenylation and immunity, suggesting that these DEGs were considered as m6A phenotype-related gene signatures. Similar to the results of m6A modification clustering, three transcriptomic subtypes based on m6A signature genes were identified and were significantly associated with different survival outcomes and TME landscapes. We further established a quantification system named the 'm6Sig score' to define different m6A modification patterns, thus guiding therapeutic strategies for individual patients more precisely. As a result, the m6A modification pattern characterized by the immune-excluded phenotype and immune-desert phenotype exhibited a higher m6Sig score, while the pattern characterized by the immune-inflamed phenotype showed a lower m6Sig score. Further analyses highlighted that the m6Sig score was a prognostic biomarker in colon cancer and associated with mutational signatures, SCNA and MSI-H status, suggesting that the m6Sig score may serve as a preferable surrogate for genomic aberrations. In addition, we observed that the m6Sig score was strongly associated with predictors of the immune response, including TML, PD-L1, IPS, and TIDE, implying that m6A modification could influence the therapeutic efficacy of immunotherapy. Actually, we identified the robust prediction ability of the m6Sig score in the immune response via three independent ICI cohorts. These findings verified our hypothesis that the m6A modification pattern could be applied in clinical practice to determine immune phenotypes and guide therapeutic regimens.
Besides elucidated the clustering results of m6A-modification, we also explored the specific role of individual m6A-regulator in the regulation of tumor immunity. Recent advances have indicated that RNA N6-methyladenosine enhances mRNA stability and translation mainly through mRNA binding proteins of IGF2BPs [68]. Of these, IGF2BP1 was recognized as a tumor oncogene as it impairs miRNA-directed downregulation of oncogenic factors in various cancer types [69, 70]. Our analyses revealed that IGF2BP1 was up-regulated in tumor tissues and associated with reduced survival time. Further analysis indicated a strong positive correlation between IGF2BP1 and YTHDF1 in colon cancer. A previous study reported that YTHDF1 could recognize m6A-marked transcripts encoding lysosomal proteases and result in degradation of neoantigens in dendritic cells, thereby suppressing cross-presentation of tumor neoantigens and cross-priming of CD8+ T cells [28]. Furthermore, higher expression of IGF2BP1 exhibited a significantly lower infiltration level of activated DCs and immature DCs, suggesting that IGF2BP1 mediated m6A modification may be involved in the activation of TME DCs. IGF2BP2/3 were also functioned as 'readers' in identifying and stabilizing the m6A site, and played a nonnegligible role in colorectal carcinoma progression via post-transcriptional regulation manner [71, 72]. Although high expression of IGF2BP2 was not a strong indicator of prognosis, leukocyte subsets analyses indicated that it was significantly negatively correlated with the infiltration of tumor infiltrating lymphocytes (TILs). Accordingly, the m6A modification effect of IGF2BP1/2 on immunosuppressive mechanisms still require further validation in low-throughput biological experiments with cell culture and PDX mouse models. KIAA1429 and RBM15/15B contain RNA-binding domains, and thus may facilitate the recruitment of the 'writer' complex to specific sites in mRNA [73, 74]. Here, we observed that KIAA1429 and RBM15 had prevalent CNV alterations and significant up-regulation in tumor tissues, suggesting the potential role of promoting the migration and invasion of cancer cells [75]. Subsequent correlation analysis also revealed that the two m6A-writers were inversely associated with immune cell infiltration. Inversely, the m6A RNA demethylase ALKBH5 exhibited an obvious enhancement in T lymphocyte infiltration and significant up-regulation in normal samples, indicating that the multiple types of post-transcriptional regulation underlay anti-tumor effects [76, 77]. Together, these results suggest a diverse heterogeneity of m6A modification, demonstrating the importance of a comprehensive assessment of the m6A modification patterns and enhancing our understanding of epigenetic regulation on diverse physiological processes.
Evaluation of the mutated driver genes underlying human tumors is a critical foundation for cancer diagnostics, therapeutics, and rational therapy selection. Here, we identified that the mutation rates of the SMGs of PIK3CA and SMAD4 were markedly augmented in the low score subgroup compared to the high score subgroup, while the TP53 mutation rate was elevated in the high score subgroup. Previous studies demonstrated that the PIK3CA mutation was associated with increased immune cell infiltration and decreased tumoral PD-L1 expression [78, 79]. SMAD4 belongs to the SMAD protein family, which is involved in the TGF-β signaling pathway that usually impedes immune activation in the tumor microenvironment [80]. TP53 is frequently mutated in most tumor types, and its mutation results in the downregulation of the immune response in hepatocellular carcinoma [81]. These m6Sig score-related tumor driver gene mutations were markedly associated with the immune activity, suggesting the complicated interaction of m6A modification with tumor immunogenomic characteristics.
Although we reviewed the literature and curated a catalog of 23 recognized regulators of RNA methylation, a series of new identified regulators need to be incorporated into the model to optimize the accuracy of the m6A modification patterns. In the absence of an appropriate ICI-based colon cancer dataset, we hope that combined with different immunotherapy regimens (anti-PD1/L1 or anti-CTLA-4) across different malignancies (Melanoma and Urothelial cancer) to verify the effects of m6Sig score could further strengthen our conclusion. Besides, the m6A modification patterns and m6Sig score were identified by using retrospective datasets; thus, a prospective cohort of CC patients receiving immunotherapy is needed to validate our findings. Moreover, as not all patients with low m6Sig score exhibited robust clinical benefits from ICI therapy, more clinicopathological features should be incorporated into the prediction models to improve accuracy.
In this study, we comprehensively evaluated the m6A modification patterns among 1307 colon cancer samples based on 23 m6A regulators, and systematically correlated these modification patterns with TME cell-infiltrating characteristics. This integrated analysis indicated that dysregulation of RNA methylation lays a critical foundation for understanding the regulation of tumor immunity. More broadly, evaluating the m6A modification patterns of the individual tumor will contribute to enhancing our cognition of the characteristics of TME infiltration and provide important insight into immunotherapeutic efficacy.
Abbreviations
CC: Colon cancer; NMF: nonnegative matrix factorization; PCA: principal component analysis; ICI: immune check-point inhibitors; RFS: relapse-free survival; TME: tumor microenvironment; TML: tumor mutation load; HR: hazards ratio; OR: odds ratio; GSEA: gene set enrichment analysis; COAD: Colon adenocarcinoma; MSI: microsatellite instability; dMMR: Mismatch repair deficiency; IPS: Immunophenoscore; TIDE: Tumor Immune Dysfunction and Exclusion.
Supplementary Material
Supplementary figures.
Supplementary tables.
Acknowledgements
We sincerely thank Prof. You Lang Zhou from Affiliated Hospital of Nantong University for analysis advice, and also thanks Dr. Yichen Yang from Tianjin tumor hospital for helpful discussions. This study was supported by grant from Key Research and Development Program of Shandong Province (No.2019JZZY010104; No.2019GSF108146), Academic promotion programme of Shandong First Medical University (2019QL021), Special Foundation for Taishan Scholars Program of Shandong Province (No.ts20190978), and The Research Incubation Funding of Shandong Provincial Hospital.
Author Contributions
Conception and design: H.C., W.C.; Development of methodology: H.C., W.C. Acquisition of data: L.S., J.L., Z.F., F.Y.D., Z.W. and S.T.J.; Analysis and interpretation of data (e.g., statistical analysis, biostatistics, computational analysis): H.C., W.C., H.W., Y.L., and Y.C.; Writing, review, and/or revision of the manuscript: W.C., H.C., L.M.C., and L.P.L.; Administrative, technical, or material support (i.e., reporting or organizing data, constructing databases): H.C., W.C.; Study supervision: H.C., W.C. and L.P.L.
Competing Interests
The authors have declared that no competing interest exists.
References
1. Zhao BS, Roundtree IA, He C. Post-transcriptional gene regulation by mRNA modifications. Nat Rev Mol Cell Biol. 2017;18:31-42
2. Zaccara S, Ries RJ, Jaffrey SR. Reading, writing and erasing mRNA methylation. Nat Rev Mol Cell Biol. 2019;20:608-24
3. He L, Li H, Wu A, Peng Y, Shu G, Yin G. Functions of N6-methyladenosine and its role in cancer. Mol Cancer. 2019;18:176
4. Li XC, Jin F, Wang BY, Yin XJ, Hong W, Tian FJ. The m6A demethylase ALKBH5 controls trophoblast invasion at the maternal-fetal interface by regulating the stability of CYR61 mRNA. Theranostics. 2019;9:3853-65
5. Chen Z, Wu L, Zhou J, Lin X, Peng Y, Ge L. et al. N6-methyladenosine-induced ERRgamma triggers chemoresistance of cancer cells through upregulation of ABCB1 and metabolic reprogramming. Theranostics. 2020;10:3382-96
6. Chen XY, Zhang J, Zhu JS. The role of m(6)A RNA methylation in human cancer. Mol Cancer. 2019;18:103
7. Shulman Z, Stern-Ginossar N. The RNA modification N(6)-methyladenosine as a novel regulator of the immune system. Nat Immunol. 2020;21:501-12
8. Zhao Q, Zhao Y, Hu W, Zhang Y, Wu X, Lu J. et al. m(6)A RNA modification modulates PI3K/Akt/mTOR signal pathway in Gastrointestinal Cancer. Theranostics. 2020;10:9528-43
9. Wang Y, Wang Y, Luo W, Song X, Huang L, Xiao J. et al. Roles of long non-coding RNAs and emerging RNA-binding proteins in innate antiviral responses. Theranostics. 2020;10:9407-24
10. Li Y, Xiao J, Bai J, Tian Y, Qu Y, Chen X. et al. Molecular characterization and clinical relevance of m(6)A regulators across 33 cancer types. Mol Cancer. 2019;18:137
11. Siegel RL, Miller KD, Fedewa SA, Ahnen DJ, Meester RGS, Barzi A. et al. Colorectal cancer statistics, 2017. CA Cancer J Clin. 2017;67:177-93
12. Schmoll HJ, Van Cutsem E, Stein A, Valentini V, Glimelius B, Haustermans K. et al. ESMO Consensus Guidelines for management of patients with colon and rectal cancer. a personalized approach to clinical decision making. Ann Oncol. 2012;23:2479-516
13. Mahajan UM, Langhoff E, Goni E, Costello E, Greenhalf W, Halloran C. et al. Immune Cell and Stromal Signature Associated With Progression-Free Survival of Patients With Resected Pancreatic Ductal Adenocarcinoma. Gastroenterology. 2018;155:1625-39 e2
14. Fridman WH, Zitvogel L, Sautes-Fridman C, Kroemer G. The immune contexture in cancer prognosis and treatment. Nat Rev Clin Oncol. 2017;14:717-34
15. Turley SJ, Cremasco V, Astarita JL. Immunological hallmarks of stromal cells in the tumour microenvironment. Nat Rev Immunol. 2015;15:669-82
16. Sun Q, Zhang B, Hu Q, Qin Y, Xu W, Liu W. et al. The impact of cancer-associated fibroblasts on major hallmarks of pancreatic cancer. Theranostics. 2018;8:5072-87
17. Pages F, Mlecnik B, Marliot F, Bindea G, Ou FS, Bifulco C. et al. International validation of the consensus Immunoscore for the classification of colon cancer: a prognostic and accuracy study. Lancet. 2018;391:2128-39
18. Le DT, Durham JN, Smith KN, Wang H, Bartlett BR, Aulakh LK. et al. Mismatch repair deficiency predicts response of solid tumors to PD-1 blockade. Science. 2017;357:409-13
19. Xiao Y, Freeman GJ. The microsatellite instable subset of colorectal cancer is a particularly good candidate for checkpoint blockade immunotherapy. Cancer Discov. 2015;5:16-8
20. Galon J, Bruni D. Approaches to treat immune hot, altered and cold tumours with combination immunotherapies. Nat Rev Drug Discov. 2019;18:197-218
21. Binnewies M, Roberts EW, Kersten K, Chan V, Fearon DF, Merad M. et al. Understanding the tumor immune microenvironment (TIME) for effective therapy. Nat Med. 2018;24:541-50
22. Li X, Wen D, Li X, Yao C, Chong W, Chen H. Identification of an Immune Signature Predicting Prognosis Risk and Lymphocyte Infiltration in Colon Cancer. Front Immunol. 2020;11:1678
23. Camus M, Tosolini M, Mlecnik B, Pages F, Kirilovsky A, Berger A. et al. Coordination of intratumoral immune reaction and human colorectal cancer recurrence. Cancer Res. 2009;69:2685-93
24. Hegde PS, Karanikas V, Evers S. The Where, the When, and the How of Immune Monitoring for Cancer Immunotherapies in the Era of Checkpoint Inhibition. Clin Cancer Res. 2016;22:1865-74
25. Chen DS, Mellman I. Elements of cancer immunity and the cancer-immune set point. Nature. 2017;541:321-30
26. Mlecnik B, Tosolini M, Kirilovsky A, Berger A, Bindea G, Meatchi T. et al. Histopathologic-based prognostic factors of colorectal cancers are associated with the state of the local immune reaction. J Clin Oncol. 2011;29:610-8
27. Mariathasan S, Turley SJ, Nickles D, Castiglioni A, Yuen K, Wang Y. et al. TGFbeta attenuates tumour response to PD-L1 blockade by contributing to exclusion of T cells. Nature. 2018;554:544-8
28. Han D, Liu J, Chen C, Dong L, Liu Y, Chang R. et al. Anti-tumour immunity controlled through mRNA m(6)A methylation and YTHDF1 in dendritic cells. Nature. 2019;566:270-4
29. Yang S, Wei J, Cui YH, Park G, Shah P, Deng Y. et al. m(6)A mRNA demethylase FTO regulates melanoma tumorigenicity and response to anti-PD-1 blockade. Nat Commun. 2019;10:2782
30. Wang H, Hu X, Huang M, Liu J, Gu Y, Ma L. et al. Mettl3-mediated mRNA m(6)A methylation promotes dendritic cell activation. Nat Commun. 2019;10:1898
31. Lewinska A, Adamczyk-Grochala J, Deregowska A, Wnuk M. Sulforaphane-Induced Cell Cycle Arrest and Senescence are accompanied by DNA Hypomethylation and Changes in microRNA Profile in Breast Cancer Cells. Theranostics. 2017;7:3461-77
32. Chen YT, Shen JY, Chen DP, Wu CF, Guo R, Zhang PP. et al. Identification of cross-talk between m(6)A and 5mC regulators associated with onco-immunogenic features and prognosis across 33 cancer types. J Hematol Oncol. 2020;13:22
33. Finotello F, Trajanoski Z. Quantifying tumor-infiltrating immune cells from transcriptomics data. Cancer Immunol Immunother. 2018;67:1031-40
34. Dai W, Li Y, Mo S, Feng Y, Zhang L, Xu Y. et al. A robust gene signature for the prediction of early relapse in stage I-III colon cancer. Mol Oncol. 2018;12:463-75
35. Marisa L, de Reynies A, Duval A, Selves J, Gaub MP, Vescovo L. et al. Gene expression classification of colon cancer into molecular subtypes: characterization, validation, and prognostic value. PLoS Med. 2013;10:e1001453
36. Laibe S, Lagarde A, Ferrari A, Monges G, Birnbaum D, Olschwang S. et al. A seven-gene signature aggregates a subgroup of stage II colon cancers with stage III. OMICS. 2012;16:560-5
37. Jorissen RN, Gibbs P, Christie M, Prakash S, Lipton L, Desai J. et al. Metastasis-Associated Gene Expression Changes Predict Poor Outcomes in Patients with Dukes Stage B and C Colorectal Cancer. Clin Cancer Res. 2009;15:7642-51
38. Smith JJ, Deane NG, Wu F, Merchant NB, Zhang B, Jiang A. et al. Experimentally derived metastasis gene expression profile predicts recurrence and death in patients with colon cancer. Gastroenterology. 2010;138:958-68
39. Davoli T, Uno H, Wooten EC, Elledge SJ. Tumor aneuploidy correlates with markers of immune evasion and with reduced response to immunotherapy. Science. 2017 355
40. Hanzelmann S, Castelo R, Guinney J. GSVA: gene set variation analysis for microarray and RNA-seq data. BMC Bioinformatics. 2013;14:7
41. Subramanian A, Tamayo P, Mootha VK, Mukherjee S, Ebert BL, Gillette MA. et al. Gene set enrichment analysis: a knowledge-based approach for interpreting genome-wide expression profiles. Proc Natl Acad Sci U S A. 2005;102:15545-50
42. Charoentong P, Finotello F, Angelova M, Mayer C, Efremova M, Rieder D. et al. Pan-cancer Immunogenomic Analyses Reveal Genotype-Immunophenotype Relationships and Predictors of Response to Checkpoint Blockade. Cell Rep. 2017;18:248-62
43. Jia Q, Wu W, Wang Y, Alexander PB, Sun C, Gong Z. et al. Local mutational diversity drives intratumoral immune heterogeneity in non-small cell lung cancer. Nat Commun. 2018;9:5361
44. Newman AM, Liu CL, Green MR, Gentles AJ, Feng W, Xu Y. et al. Robust enumeration of cell subsets from tissue expression profiles. Nat Methods. 2015;12:453-7
45. Jiang P, Gu S, Pan D, Fu J, Sahu A, Hu X. et al. Signatures of T cell dysfunction and exclusion predict cancer immunotherapy response. Nat Med. 2018;24:1550-8
46. Yoshihara K, Shahmoradgoli M, Martinez E, Vegesna R, Kim H, Torres-Garcia W. et al. Inferring tumour purity and stromal and immune cell admixture from expression data. Nat Commun. 2013;4:2612
47. Lawrence MS, Stojanov P, Polak P, Kryukov GV, Cibulskis K, Sivachenko A. et al. Mutational heterogeneity in cancer and the search for new cancer-associated genes. Nature. 2013;499:214-8
48. Chen H, Yang M, Wang Q, Song F, Li X, Chen K. The new identified biomarkers determine sensitivity to immune check-point blockade therapies in melanoma. Oncoimmunology. 2019;8:1608132
49. Ghandi M, Huang FW, Jane-Valbuena J, Kryukov GV, Lo CC, McDonald ER 3rd. et al. Next-generation characterization of the Cancer Cell Line Encyclopedia. Nature. 2019;569:503-8
50. Chen H, Chong W, Yang X, Zhang Y, Sang S, Li X. et al. Age-related mutational signature negatively associated with immune activity and survival outcome in triple-negative breast cancer. Oncoimmunology. 2020;9:1788252
51. Mayakonda A, Lin DC, Assenov Y, Plass C, Koeffler HP. Maftools: efficient and comprehensive analysis of somatic variants in cancer. Genome Res. 2018;28:1747-56
52. Chen H, Chong W, Teng C, Yao Y, Wang X, Li X. The immune response-related mutational signatures and driver genes in non-small-cell lung cancer. Cancer Sci. 2019;110:2348-56
53. Kandoth C, McLellan MD, Vandin F, Ye K, Niu B, Lu C. et al. Mutational landscape and significance across 12 major cancer types. Nature. 2013;502:333-9
54. Ritchie ME, Phipson B, Wu D, Hu Y, Law CW, Shi W. et al. limma powers differential expression analyses for RNA-sequencing and microarray studies. Nucleic Acids Res. 2015;43:e47
55. Zhang B, Wu Q, Li B, Wang D, Wang L, Zhou YL. m(6)A regulator-mediated methylation modification patterns and tumor microenvironment infiltration characterization in gastric cancer. Mol Cancer. 2020;19:53
56. Zeng D, Li M, Zhou R, Zhang J, Sun H, Shi M. et al. Tumor Microenvironment Characterization in Gastric Cancer Identifies Prognostic and Immunotherapeutically Relevant Gene Signatures. Cancer Immunol Res. 2019;7:737-50
57. Riaz N, Havel JJ, Makarov V, Desrichard A, Urba WJ, Sims JS. et al. Tumor and Microenvironment Evolution during Immunotherapy with Nivolumab. Cell. 2017;171:934-49 e15
58. Van Allen EM, Miao D, Schilling B, Shukla SA, Blank C, Zimmer L. et al. Genomic correlates of response to CTLA-4 blockade in metastatic melanoma. Science. 2015;350:207-11
59. Hazra A, Gogtay N. Biostatistics Series Module 3: Comparing Groups: Numerical Variables. Indian J Dermatol. 2016;61:251-60
60. Love MI, Huber W, Anders S. Moderated estimation of fold change and dispersion for RNA-seq data with DESeq2. Genome Biol. 2014;15:550
61. Sun C, Mezzadra R, Schumacher TN. Regulation and Function of the PD-L1 Checkpoint. Immunity. 2018;48:434-52
62. Chen H, Chong W, Wu Q, Yao Y, Mao M, Wang X. Association of LRP1B Mutation With Tumor Mutation Burden and Outcomes in Melanoma and Non-small Cell Lung Cancer Patients Treated With Immune Check-Point Blockades. Front Immunol. 2019;10:1113
63. Jian D, Wang Y, Jian L, Tang H, Rao L, Chen K. et al. METTL14 aggravates endothelial inflammation and atherosclerosis by increasing FOXO1 N6-methyladeosine modifications. Theranostics. 2020;10:8939-56
64. Topalian SL, Taube JM, Anders RA, Pardoll DM. Mechanism-driven biomarkers to guide immune checkpoint blockade in cancer therapy. Nat Rev Cancer. 2016;16:275-87
65. Zeng D, Ye Z, Wu J, Zhou R, Fan X, Wang G. et al. Macrophage correlates with immunophenotype and predicts anti-PD-L1 response of urothelial cancer. Theranostics. 2020;10:7002-14
66. Tauriello DVF, Palomo-Ponce S, Stork D, Berenguer-Llergo A, Badia-Ramentol J, Iglesias M. et al. TGFbeta drives immune evasion in genetically reconstituted colon cancer metastasis. Nature. 2018;554:538-43
67. Panagi M, Voutouri C, Mpekris F, Papageorgis P, Martin MR, Martin JD. et al. TGF-beta inhibition combined with cytotoxic nanomedicine normalizes triple negative breast cancer microenvironment towards anti-tumor immunity. Theranostics. 2020;10:1910-22
68. Huang X, Zhang H, Guo X, Zhu Z, Cai H, Kong X. Insulin-like growth factor 2 mRNA-binding protein 1 (IGF2BP1) in cancer. J Hematol Oncol. 2018;11:88
69. Muller S, Bley N, Glass M, Busch B, Rousseau V, Misiak D. et al. IGF2BP1 enhances an aggressive tumor cell phenotype by impairing miRNA-directed downregulation of oncogenic factors. Nucleic Acids Res. 2018;46:6285-303
70. Muller S, Glass M, Singh AK, Haase J, Bley N, Fuchs T. et al. IGF2BP1 promotes SRF-dependent transcription in cancer in a m6A- and miRNA-dependent manner. Nucleic Acids Res. 2019;47:375-90
71. Li T, Hu PS, Zuo Z, Lin JF, Li X, Wu QN. et al. METTL3 facilitates tumor progression via an m(6)A-IGF2BP2-dependent mechanism in colorectal carcinoma. Mol Cancer. 2019;18:112
72. Xu W, Sheng Y, Guo Y, Huang Z, Huang Y, Wen D. et al. Increased IGF2BP3 expression promotes the aggressive phenotypes of colorectal cancer cells in vitro and vivo. J Cell Physiol. 2019;234:18466-79
73. Patil DP, Chen CK, Pickering BF, Chow A, Jackson C, Guttman M. et al. m(6)A RNA methylation promotes XIST-mediated transcriptional repression. Nature. 2016;537:369-73
74. Deng X, Su R, Weng H, Huang H, Li Z, Chen J. RNA N(6)-methyladenosine modification in cancers: current status and perspectives. Cell Res. 2018;28:507-17
75. Wang T, Kong S, Tao M, Ju S. The potential role of RNA N6-methyladenosine in Cancer progression. Mol Cancer. 2020;19:88
76. Guo X, Li K, Jiang W, Hu Y, Xiao W, Huang Y. et al. RNA demethylase ALKBH5 prevents pancreatic cancer progression by posttranscriptional activation of PER1 in an m6A-YTHDF2-dependent manner. Mol Cancer. 2020;19:91
77. Chen Y, Zhao Y, Chen J, Peng C, Zhang Y, Tong R. et al. ALKBH5 suppresses malignancy of hepatocellular carcinoma via m(6)A-guided epigenetic inhibition of LYPD1. Mol Cancer. 2020;19:123
78. Choi M, Kadara H, Zhang J, Parra ER, Rodriguez-Canales J, Gaffney SG. et al. Mutation profiles in early-stage lung squamous cell carcinoma with clinical follow-up and correlation with markers of immune function. Ann Oncol. 2017;28:83-9
79. Borcoman E, De La Rochere P, Richer W, Vacher S, Chemlali W, Krucker C. et al. Inhibition of PI3K pathway increases immune infiltrate in muscle-invasive bladder cancer. Oncoimmunology. 2019;8:e1581556
80. Yu J, Wei M, Becknell B, Trotta R, Liu S, Boyd Z. et al. Pro- and antiinflammatory cytokine signaling: reciprocal antagonism regulates interferon-gamma production by human natural killer cells. Immunity. 2006;24:575-90
81. Long J, Wang A, Bai Y, Lin J, Yang X, Wang D. et al. Development and validation of a TP53-associated immune prognostic model for hepatocellular carcinoma. EBioMedicine. 2019;42:363-74
Author contact
![]() Corresponding authors: Dr. Hao Chen, Clinical Research Center of Shandong University, Clinical Epidemiology Unit, Qilu Hospital of Shandong University, Jinan, Shandong 250021, China. E-mail: 201962008940sdu.edu.cn; chenhao6938com. Prof. Leping Li, Department of Gastrointestinal Surgery, Shandong Provincial Hospital Affiliated to Shandong First Medical University, Jinan, Shandong, 250021, China. E-mail: lilepingcom.cn.
Corresponding authors: Dr. Hao Chen, Clinical Research Center of Shandong University, Clinical Epidemiology Unit, Qilu Hospital of Shandong University, Jinan, Shandong 250021, China. E-mail: 201962008940sdu.edu.cn; chenhao6938com. Prof. Leping Li, Department of Gastrointestinal Surgery, Shandong Provincial Hospital Affiliated to Shandong First Medical University, Jinan, Shandong, 250021, China. E-mail: lilepingcom.cn.