Impact Factor
- Issue 14; 2026
- Issue 13; 2026
- Issue 12; 2026
- Issue 11; 2026
- Issue 10; 2026
- Volume 16; 2026
- Advance Articles
- Past Issues
- Cover Images
- Cover Suggestion
- Index & Coverage
- Special Issues
Introduction
Methods
Results
Discussion
Abbreviations
Supplementary Material
Acknowledgements
References
International Journal of Biological Sciences
International Journal of Medical Sciences
 Global reach, higher impact

Theranostics 2020; 10(12):5384-5397. doi:10.7150/thno.41616 This issue Cite
Research Paper
Targeted sequencing reveals the mutational landscape responsible for sorafenib therapy in advanced hepatocellular carcinoma
Jing Tang1,2,#, Cheng-Jun Sui3#, Dong-Fang Wang4,#, Xin-Yuan Lu5,#, Gui-Juan Luo2, Qing Zhao6, Qiu-Yu Lian4, Seogsong Jeong2,7, Xi-Meng Lin2, Yan-Jing Zhu2, Bo Zheng2, Rui Wu8, Qing Wang2, Xiao-Long Liu9, Jing-Feng Liu9, Qiang Xia7, Gang Wu1, Jin Gu4, ![]() , Hong-Yang Wang2,11,12,
, Hong-Yang Wang2,11,12, ![]() , Lei Chen2,10,
, Lei Chen2,10, ![]()
1. Cancer Center, Union Hospital, Tongji Medical College, Huazhong University of Science and Technology, Wuhan 430022, China.
2. The International Cooperation Laboratory on Signal Transduction, Eastern Hepatobiliary Surgery Hospital, Second Military Medical University, Shanghai 200438, China.
3. Department of special treatment and liver transplantation, Eastern Hepatobiliary Surgery Hospital, Second Military Medical University, Changhai Road 225, Shanghai 200438, China
4. MOE Key Laboratory for Bioinformatics, BNRIST Bioinformatics Division, Department of Automation, Tsinghua University, Beijing 100084, China
5. Department of Pathology, Eastern Hepatobiliary Surgery Hospital, Second Military Medical University, Changhai Road 225, Shanghai, Shanghai 200438, China
6. Department of Clinical Pharmacology, Xiangya Hospital, Central South University, Changsha, Hunan, China. 2Institute of Clinical Pharmacology, Central South University, Changsha, Hunan 410013, China.
7. Department of Liver Surgery, Renji Hospital, School of Medicine, Shanghai Jiao Tong University, Shanghai, 200127, China.
8. Department of Biliary Surgery I, Eastern Hepatobiliary Surgery Hospital, Second Military Medical University, Changhai Road 225, Shanghai 200438, China
9. The United Innovation of Mengchao Hepatobiliary Technology Key Laboratory of Fujian Province, Mengchao Hepatobiliary Hospital of Fujian Medical University, Fuzhou 350025, China
10. Fudan University Shanghai Cancer Center; Department of Oncology, Shanghai Medical College, Fudan University, Shanghai 200032, China
11. Ministry of Education (MOE) Key Laboratory on signaling Regulation and Targeting Therapy of Liver Cancer, Shanghai 200438, China
12. Shanghai Key Laboratory of Hepato-biliary Tumor Biology, Shanghai 200438, China
# These authors contributed equally to this work.
Received 2019-10-29; Accepted 2020-3-19; Published 2020-4-6
Abstract

Rationale: The existence of primary and acquired drug resistance is the main obstacle for the effect of multi-kinase inhibitor sorafenib and regorafenib in advanced hepatocellular carcinoma (HCC). However, plenty of patients did not significantly benefit from sorafenib treatment and little is known about the mechanism of drug resistance.
Methods: Laser capture microdissection was used to acquire matched normal liver and tumor tissues on formalin-fixed paraffin-embedded specimens collected before sorafenib therapy from the first surgery of 119 HCC patients. Ultra-deep sequencing (~1000×) targeting whole exons of 440 genes in microdissected specimens and siRNA screen in 7 cell lines were performed to find mutations associated with differential responses to sorafenib. Patient-derived xenograft models were employed to determine the role of TP53 in response to sorafenib. Lentiviruses harboring wild-type and c.G52C-mutant OCT4 were applied to explore the function of OCT4 in resistance to sorafenib. ChIP-PCR assay for analysis of OCT4 transcriptional activity was performed to explore the affinity with the KITLG promoter. Statistical analyses were used to associate levels of p53 and OCT4 with tumor features and patient outcomes.
Results: Total 1,050 somatic mutations and 26 significant driver genes were identified. SiRNA screening in 7 HCC cell lines was further performed to identify mutations associated with differential responses to sorafenib. A recurrent nonsynonymous mutation c.G52C in OCT4 (OCT4mut) was strongly associated with good response to sorafenib, whereas the stop-gain mutation in TP53 showed the opposite outcome both in vitro and in vivo. OCT4wt-induced stem cell factor (encoded by KITLG gene, SCF) expression and cross-activation of c-KIT/FLT3-BRAF signals were identified indispensably for sorafenib resistance, which could be reversed by the combination of c-KIT tyrosine kinase inhibitors or neutralizing antibody against SCF. Mechanistically, an OCT4 binding site in upstream of KITLG promoter was identified with a higher affinity to wildtype of OCT4 rather than G52C-mutant form, which is indispensable for OCT4-induced expression of KITLG and sorafenib resistance.
Conclusion: Our study reported a novel somatic mutation in OCT4 (c.G52C) responsible for the sorafenib effect, and also shed new light on the treatment of HCC through the combination of specific tyrosine kinase inhibitors according to individual genetic patterns.
Keywords: Mutational Landscape, Sorafenib Resistance, TP53, OCT4, Hepatocellular Carcinoma.
Introduction
Hepatocellular carcinoma (HCC) is one of the most common malignancies and lethal neoplasm worldwide with rapidly increasing incidence [1]. Despite recent advances in surgical techniques and the discovery of various therapeutic strategies, the prognosis of HCC remains dismal [2]. Curative modalities such as radical resection and transplantation, cannot be used in the majority of patients with HCC due to the rapid progression of the tumor and its advanced stage at the time of diagnosis [3]. For those patients, besides several immunotherapeutic strategies, the multikinase inhibitors, such as sorafenib and regorafenib are the major drugs for the treatment of advanced HCC (aHCC) clinically [4].
Sorafenib was firstly approved for the treatment of HCC by the European Medicines Agency and U.S. Food and Drug Administration in the last decade, which was supported by the results of a large-scale, multi-institutional, double-blind, placebo-controlled phase III clinical trial that included 602 patients with aHCC [5]. The Sorafenib Hepatocarcinoma Assessment Randomized Protocol (SHARP) study demonstrated a remarkably significant increase in OS (median survival months, 10.7 vs. 7.9) and time to radiologic progression (median progression-free months, 5.5 vs. 2.8) when the patients received sorafenib treatment. However, low overall response rate and acquired drug resistance are the major factor hampering the usage of sorafenib clinically and has raised global concern for understanding the underlying mechanism [6].
Previous studies have documented that the outcomes of sorafenib treatments are partly dependent on the BCLC stage, Child-Pugh score, performance status of the patient [7], and the basal levels of pERK, JNK or VEGFA in HCC tissues. In addition, the crosstalk involving the PI3K/AKT and JAK-STAT pathways, the activation of hypoxia-inducible pathways, epithelial-mesenchymal transition, epigenetic regulation, and tumor environment were also involved in sorafenib resistance. Although many genetic features related to drug response have been intensively investigated in different types of cancer by applying high-throughput sequencing techniques [8, 9], the recurrent genetic variations associated with sorafenib resistance in aHCC are still uncovered. Here, we selected 440 genes including oncogenes, tumor suppressors and immuno-genes, and analyzed potential genetic variations related to sorafenib resistance by applying ultra-deep whole exons sequencing method with FFPE specimens from 119 HCC cases.
Methods
Patients and samples
HCC patients diagnosed for the first time at Eastern Hepatobiliary Surgery Hospital (EHBH) and underwent hepatectomy during 2006-2013. A total of 119 post-resection patients with recurrent HCC who received systemic therapy containing sorafenib were enrolled. FFPE specimens derived from hepatectomy were serially cut onto glass slides or polyethylene naphthalate membrane slides (Leica). Hematoxylin & Eosin staining was then performed to determine the distribution of tumor and normal tissues by three pathologists and laser capture of histologically matched tumor and normal tissue was performed using an LS-AMD microscope (Leica) according to the manufacture's protocol. Demographic and clinical characteristics of these patients are shown in - Table S1 and S2. All patients provided written informed consent for treatment and molecular analysis, with ethical approval provided by the EHBH Ethics Committee. The therapeutic effect of sorafenib was assessed according to the mRECIST criteria [10].
DNA targeted sequencing
We used 119 pairs of tumors and normal FFPE specimens, seven PDX tissues and seven HCC cell lines for targeted sequencing. Isolated genomic DNA concentration was verified using the Qubit dsDNA HS Assay Kit (Life Technologies, Carlsbad, California, USA). Samples were prepared as described in the Ion AmpliSeq Library Preparation User Guide, Publication #MAN0006735 Rev. 5.0 (Life Technologies) using the Ion AmpliSeq Library Kit 2.0 with Ion AmpliSeq Comprehensive Cancer Panel v2.0 (including 409 genes, Life Technologies) and our custom-designed Panel (31 HCC related genes). Ion Xpress Barcode Adapters 1-64 Kit (Life Technologies) was used during the adapter ligation step of the library preparation to uniquely barcode each sample in one single run. Following option 2 of the user guide, libraries were quantified by qPCR. Libraries were diluted to 100 pM based on molarity values from qPCR assay before pooling. An equimolar mix of barcoded libraries was prepared and then diluted to 10 pM. The 10 pM library pool was used in the preparation of template-positive Ion Sphere Particles (ISPs) containing clonally amplified DNA using the Ion PI™ Template OT2 200 Kit v3 on the Ion OneTouch 2 System (Life Technologies). Template-positive ISPs were enriched using the Ion OneTouch ES all as described in the Ion PI™ Template OT2 200 Kit v3 User Guide, Publication #MAN0009133 Rev. B.0 (Life Technologies). Enriched ISPs were loaded onto an Ion PI™ Chip v2 and sequenced with the Ion PI™ Sequencing 200 Kit v3 on an Ion Proton System as described in the Ion PI™ Sequencing 200 Kit v3 User Guide, Publication #MAN0009136 Rev. B.0 (Life Technologies).
Variant calling, filtering, and annotation
The raw sequence data were processed by Torrent Suite Software (Life Technologies). Candidate somatic mutations were identified by comparing the called variants from the matched tumors and adjacent normal tissues with a minimal mutation rate of 5% (this cutoff was chosen by considering the high sequencing depth). Then, stringent filtering steps were used to reduce the false positives: 1) only point mutations were kept (due to the high error rate of polymers by Ion Proton); 2) the sites, which are heterozygous in adjacent normal tissues, were removed (exclude the effects of CNVs or mixture populations); and 3) all the sites overlapped with known SNPs (dbSNP and 1000g) were excluded. The functional impacts of the identified mutations were annotated by ANNOVAR[11]. The driver genes were analyzed by MutSigCV [12].The sequence data can be downloaded via Genome Sequence Archive (GSA) Accession CRA001003 (Temporary link for review: [http://bigd.big.ac.cn/gsa/s/dI7yD1ja]).
Statistical analysis
Demographic and clinical characteristics were presented as median (interquartile range [IQR]). Cox proportional hazards model was applied to evaluate the hazard ratio (HR) with 95% confidence interval (CI) in the univariate analysis and the significant prognostic factors were enrolled in multivariate analysis to confirm independent prognostic factors. Overall survival rates were evaluated using Kaplan-Meier curves with the Log-rank test. Univariable and multivariable analyses were carried out by applying the Cox proportional hazards regression model. All the experiments have been performed at least three times. All statistical analyses were performed using SPSS software (version 22.0).
Further details of the materials and methods used in this study can be found in the online supplementary files.
Results
Mutational landscape established by targeted DNA sequencing
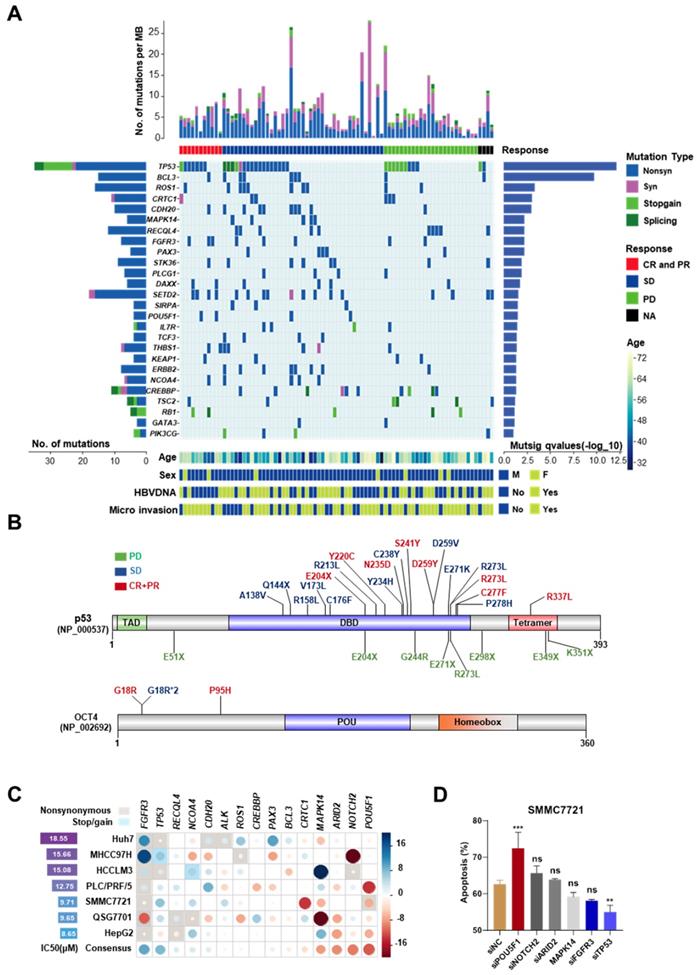
To avoid the contamination from normal hepatocytes and other non-hepatocyte components, Laser capture microdissection (LCM) was used to collect tumor and adjacent normal tissues from the first surgery of 119 HCC patients, who relapsed after the surgery and were not suitable for the second operation. All these 119 patients received mono sorafenib therapy or systemic therapy containing sorafenib; according to NCCN guidelines for advanced hepatobiliary cancers (See in Figure S1A-B and patient information in Table S1). The collected specimens were analyzed by targeted exome sequencing of 440 cancer genes (409 from Ion AmpliSeqTM Comprehensive Cancer Panel and 31 custom-designed HCC-related genes, Table S3). After the default quality control and a modest filter (coverage > 150 and broadness > 60% for the targeted regions), 86 paired samples were left. Among them, 77 pairs were sequenced by Ion ProtonTM Systems (the median coverage ~1100×) and the other 9 were sequenced by Ion PGMTM Sequencer (~300×). Additionally, 6 (4 with >1000 and 2 with >200 somatic mutations) of 86 samples were further excluded due to the abnormal high mutation rates. In the remaining 80 samples, 1,050 somatic mutations were identified, including 310 synonymous, 591 nonsynonymous, 48 stop-gain and 22 splicing mutations (Figure 1A). The average number of somatic mutations per tumor was 12.7 (6.8 per Mb), and the median was 11 (5.9 per Mb). The list of the identified somatic mutations and their basic statistics are provided in Tables S4-S8.
The mutation landscape of cancer-related genes for advanced HCC and mutations associated with differential responses to sorafenib. (A) The top panel shows individual tumor mutations rates. The second panel indicates clinical responses after sorafenib treatment. The middle panel shows genes with statistically significant levels of somatic point mutations (MutSigCV, q-value < 0.1). The bottom panel shows the age, sex, HBV-DNA, and microvascular invasion. The left panel shows gene mutation rates and the right panel shows gene mutation significant levels (as the log10-transformed p-value). (B) The nonsynonymous mutations (Frequency > 20%) in TP53 and OCT4 and their corresponding sorafenib responses in HCC patients. Font colors of mutations indicate different responses: green for progressive disease (PD), blue for stable disease (SD), red for complete response or partial response (CR+PR). Sites with asterisk and numbers indicated the occurrence number of the mutation. (C) The gene-mediated sorafenib responses by knockdown experiments. The left panel shows the IC50 for each cell line without siRNA knockdown. The circle in the matrix indicates the changes of IC50 in the corresponding cell line (row) after the knockdown of the corresponding gene (column). The circle with a larger radius means stronger change (measured as Z score) and the color indicates the direction of the change (blue/red for reduced/increased sensitivity after the knockdown). The background rectangle with shadow indicates that the gene in the cell line is mutated. The last line of the matrix shows the mean effect across all the tested cell lines for each gene. (D) Cell early and late apoptosis rate was analyzed using Flow cytometry in SMMC7721 cells treated with the indicated siRNAs along with 10uM sorafenib or DMSO. ***P<0.001; ** P <0.01; ns, not significantly, as compared to the negative control cells.
Roles of highly mutated genes in cellular processes
Twenty-six significantly mutated genes (driver genes) were identified by MutSigCV (q-value < 0.1, Table S9) (Figure 1A). Four of them (TP53, RB1, KEAP1, TSC2) have been recurrently reported in previous studies. These twenty-six genes are strongly associated with cell cycle and cell proliferation, including TP53 (non-silent mutation rate 45%, 34/80), BCL3 (11.25%, 9/80), FGFR3 (10%, 8/80), MAPK14 (6.25%, 5/80), and RB1 (6.25%, 5/80). TP53 was the most mutated gene, including 3 splicing site mutations, 9 stop-gain mutations, and 22 nonsynonymous exonic mutations (MutSigCV q=7.37 × 10⁻¹³). Several genes encoding transcription factors, e.g., PAX3 (6.25%, 5/80) and OCT4 (also known as POU5F1, 5%, 4/80), were identified. OCT4 is a key factor for embryonic development and stem cell pluripotency [13]. PAX3 is also a regulator of fetal development [14]. Chromatin modifiers play important roles in HCCs. Several highly mutated chromatin regulators reported in previous studies, such as ARID1A (nonsilent/silent mutations in 5/1 tumors) and ARID2 (nonsilent/silent mutations in 5/3 tumors) were also identified, although they did not reach the threshold of statistical significance. We also identified several novel epigenetic regulator drivers, including CREBBP, DAXX, and SETD2. High frequent mutations in CREBBP have been reported previously in other cancers [15, 16]. DAXX mutations are associated with chromatin instability and abnormal telomere maintenance [17]. SETD2 is an important regulator of H3K36 methylation and therefore, affects genome accessibility and stability [18]. It is interestingly found that CTNNB1 mutations were rare in our cohort (the median coverage of CTNNB1 region was ~1200×). A similar observation of the paucity of CTNNB1 mutations has been made in another Chinese cohort [19].
Mutations associated with differential response to sorafenib
Then, the relationships between mutation patterns and responses to sorafenib were analyzed. For drug responses, complete response (CR), partial response (PR), stable disease (SD), and progressive disease were assessed according to mRECIST [10]. The CR and PR groups were combined as CR+PR group in this study. Four tumors without clinical response evidence were excluded from this analysis. First, we examined the relationships between the responses to sorafenib and tumor mutation burden. The six hypermutated tumors were not enriched in any response group (P > 0.2, Fisher's exact test). Mutations in three genes, ALK, OCT4, and ARID2, were found moderately associated with the responses (P < 0.1, Table S10) by single-gene analysis. OCT4 mutations indicated good responses. All four OCT4 mutations were located at the N-terminal rather than its POU homeobox domain. Three of them were recurrent mutations at c.G52C (this mutation was also found in HCC cell line 7721) (Figure 1B). Although the overall non-silent mutations of TP53 were not significantly associated with the response to sorafenib, we observed that TP53 stop-gain mutations were highly enriched in the PD group (P = 1.92 × 10⁻¹⁶) (Figure 1B).
Then, knockdown experiments were implemented to validate the effects of OCT4 and TP53 mutations on the sensitivity to sorafenib in HCC cell lines. In addition, two other genes with moderate associations (ALK and ARID2), and another 11 significantly mutated genes (BCL3, FGFR3, CDH20, CRTC1, NOTCH2, ROS1, MAPK14, PAX3, RECQL4, CREBBP, and NCOA4) were included for the experiments (the description of the mutations and experimental details can be found in Figure S2-S4 and Table S11-S12). OCT4 knockdown strongly improved the inhibition of cell growth by sorafenib in most studied cell lines, whereas TP53 knockdown increased the resistance to the drug (Figure 1C). Inconsistent with a previous study [20], no significant effects of MAPK14 was found after sorafenib treatment. Both flow cytometry analysis and western blot experiments demonstrated that siRNA-induced knockdown of TP53 significantly attenuated sorafenib-induced apoptosis and cell death in SMMC7721, whereas knockdown of OCT4 showed the opposite effect (Figure 1D, Figure S5A-B).
Stop-gain mutations within Tp53 promotes sorafenib resistance
Knockdown of TP53 by infection with shRNA-carrying lentivirus (shTP53) promoted resistance to sorafenib of SMMC7721 cells (Figure 2A, Figure S5C-D), but had no impact on cell proliferation (Figure 2B). In addition, overexpression of TP53 improved the sensitivity to sorafenib, although the result did not reach statistical significance (Figure 2A). Sorafenib IC50 increased 1.7-fold after shTP53 treatment (16.99μM vs. 9.83μM) but decreased by 27.8% upon TP53 overexpression (7.10μM vs. 9.83μM).
Stop-gain TP53 mutation promotes resistance to sorafenib. (A) Dose-response curves for sorafenib. SMMC7721 cells harboring GFP (Control), shTP53- or TP53-vehicle were treated with sorafenib at the indicated concentrations. Viable cells were measured after 48 h of treatment and plotted relative to untreated control cells (mean ± s.d., n = 3 for each concentration). The curves were fitted using a nonlinear regression model with a sigmoidal dose-response. (B) The proliferation rates of SMMC7721 cells with Control/shTP53-vehicle were evaluated by CCK8 assay. (C) The IHC intensity scores of p53 were analyzed in FFPE specimens in different response groups. (D) Kaplan-Meier analysis of the correlation between p53 expression levels and OS in HCC patients with sorafenib therapy. (E) Representative p53 staining in TP53- or GFP-lentivirus treated PDXs. (F) Male NOD.Cg-Prkdcscid Il2rgtm1Wjl/SzJ mice (n=6) were subcutaneously injected with engraftments of PDXs, then Control/TP53-lentivirus and sorafenib were treated, the tumor volumes of engraftments of PDXs were evaluated for 20 days (top). Western immunoblot analysis for PARP and cleavage PRAP in sorafenib-treated PDX cells lentivirally transduced with Control/TP53 (bottom). ***P<0.001, ** P <0.01, * P <0.05.
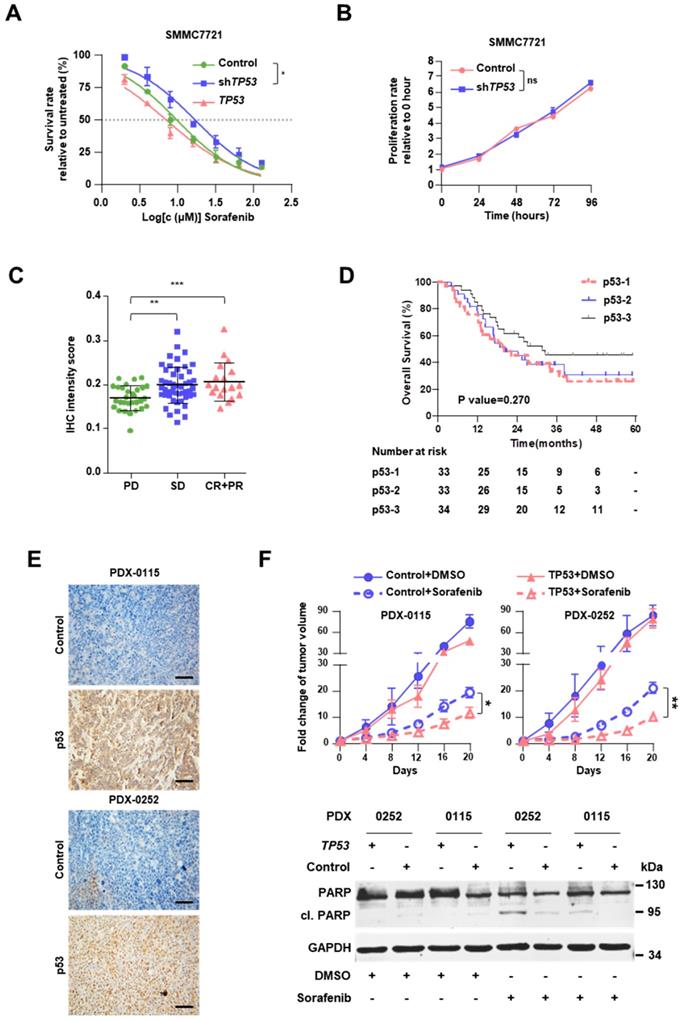
Immunohistochemical staining clearly showed that the level of p53 is positively associated with the clinical responses (Figure 2C, Figure S6A and Table S13). It should be noted that in our cohort p53 expression was not found as a significant prognostic indicator, the HR was 0.790 (95% CI, 0.586-1.064; P=0.119), suggesting further study with larger sample size is warranted to clarify its contribution for sorafenib response. As expected, tumor size > 5 cm and vascular invasion were also found to be significant and independent prognostic factors for the OS (Table 1). In the Kaplan-Meier estimation, the OS of the patients with high expression of p53 revealed to be higher compared to those with low or moderate expressions without statistical significance (1-year OS, 85.3% versus 75.8% and 78.8%; P=0.270; Figure 2D).
Univariate and Multivariate Analyses (Cox regression)
| Characteristic | Univariate analysis | Multivariate analysis | ||
|---|---|---|---|---|
| HR (95% CI) | P value | HR (95% CI) | P value | |
| p53 | 0.790 (0.586-1.064) | 0.119 | NA | NA |
| OCT4 | 1.682 (1.128-2.507) | 0.010 | 1.587 (1.026-2.455) | 0.038 |
| Tumor size > 5 cm | 1.818 (1.029-3.211) | 0.037 | 2.483 (1.226-5.028) | 0.012 |
| Macrovascular Invasion | 2.083 (1.210-3.586) | 0.007 | 2.146 (1.231-3.742) | 0.007 |
Abbreviations: HR, hazard ratio; CI, confidence interval. A value of P<0.05 was considered to be significant.
Meanwhile, Kaplan-Meier estimation showed patients with TP53 stop gain have a poor prognosis (P=0.048, Figure S6B), compared with other TP53 mutations. To assess the in vivo impact of exogenous p53 on the response to sorafenib, we employed PDX models in NOD.Cg-Prkdcscid Il2rgtm1Wjl/SzJ mice (Figure S6C). PDXs demonstrated distinct TP53 mutations, namely stop-gain mutation in PDX-0115 (TP53-NM_000546:exon8:c.G892T:p.E298X) and missense mutation in PDX-0252 (TP53-NM_000546:exon8:c.G818T:p.R273L). These two mutations were also detected in the sequenced specimens; they were associated with diminished protein expression of p53 in PDXs and progressive disease in HCC patients (Figure 2E). In both PDX-0115 and PDX-0252 models, lentivirus-induced overexpression of TP53 resulted in enhanced cell apoptosis upon sorafenib treatment, which meant that restoration of TP53 expression level significantly augmented the response to sorafenib (Figure 2F).
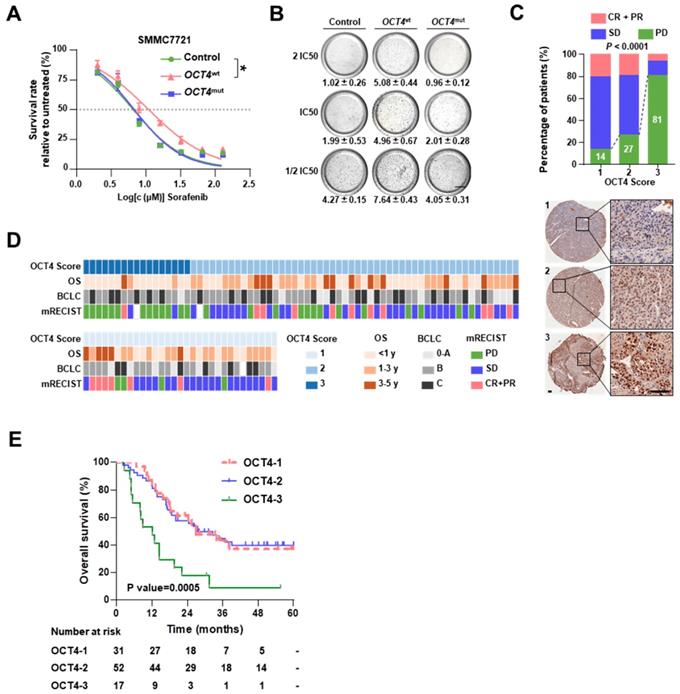
OCT4 mutation (c. G52C) sensitizes HCCs to sorafenib treatment
As shown in Figure 1B, OCT4 c.G52C mutation may affect sorafenib sensitivity. The OCT4 acts as a key transcription factor to participate in tumorigenicity and drug-resistance of HCC [21].To explore the mechanism of OCT4 mediated sorafenib response, we firstly examined the protein expression of OCT4 in nine cell lines (Figure S7A). Among the cell lines with low OCT4 levels, SMMC7721 cells (harboring the c.G52C mutation) and MHCC97H cells (without the c.G52C mutation) were separately infected with lentiviruses harboring wild-type and c.G52C-mutant OCT4 (denoted as 7721-OCT4wt and 7721-OCT4mut, respectively). OCT4wt cells showed relatively higher resistance to sorafenib, whereas OCT4mut cells were as sensitive as cells infected with control lentivirus in both cell lines (Figure 3A and Figure S7B). The majority of OCT4wt cells survived in the presence of 2 × IC50 sorafenib concentration, whereas the survival rate in OCT4mut cells declined significantly with sorafenib at 0.5 × IC50 concentration (Figure 3B). On the other hand, PLC/PRF/5 cells expressed wildtype OCT4 and higher OCT4 protein levels, showed no alteration in response to sorafenib with wild-type or c.G52C-mutant OCT4 transfection (Figure S7C). As expected, immunohistochemical staining showed that OCT4 expression was significantly higher in the PD group than in the CR+PR group (Figure 3C and 3D). A higher protein level of OCT4 was found to be an unfavorable prognostic factor that significantly reduced the OS in both univariable analysis (HR, 1.682; 95% CI, 1.128 to 2.507; P = 0.010) and multivariable (HR, 1.587; 95% CI, 1.026 to 2.455; P = 0.038) analyses (Table 1). In the Kaplan-Meier estimation, high expression of OCT4 resulted in a significant reduction in OS (1-year OS, 47.1% versus 82.7% and 83.9%; P=0.0005; Figure 3E). Additionally, the level of AFP and larger tumor size were found significantly associated with higher expression of OCT4 (P<0.05; Figure S6D).
OCT4 mutation sensitizes HCC to sorafenib. (A) Dose-response curves for sorafenib. SMMC7721 cells transfected by GFP (Control), OCT4wt or OCT4mut (c.G52C) were treated with sorafenib at the indicated concentrations. Viable cells were measured after 48 h of treatment and plotted relative to untreated control cells (mean ± s.d., n = 3 for each concentration, *P<0.05). (B) Soft agar colony assay of Control-, OCT4wt - and OCT4mut -SMMC7721 cells treated with sorafenib at the indicated concentrations. Colonies (mean±s.d, n=3) 50 μm were counted using a microscope 21 days later. Scale bar, 800 μm. (C) The drug responses in different OCT4 expression sub-groups (measure by IHC score). Representative IHC staining for OCT4 was shown below. (D) The matrix shows the OCT4 IHC scores and the OS, BCLC stages and sorafenib responses of treated patients. (E) Kaplan-Meier estimation of OS according to the expression of OCT4.
The activation of c-Kit/Flt3-Ras/Raf/MAPK signaling is indispensable for sorafenib resistance
We inspected whether OCT4mut influenced the efficacy of sorafenib by modulating tumor cell stemness. Both OCT4wt and OCT4mut cells expressed increased levels of OCT4, EPCAM, CD90 genes, and exhibited enhanced spheroid formation (Figure 4A-B). Then, we examined regorafenib (another multi-kinase inhibitor approved for advanced HCCs recently) concentration-response relationship in OCT4wt and OCT4mut-treated SMMC7721 cells. No difference of regorafenib IC50 value was found between cells expressing OCT4wt and OCT4mut (Figure S7E). Since sorafenib possess much higher IC50 values for FLT3 (58 nM with sorafenib) and c-Kit (68 nM with sorafenib v.s. 7 nM with regorafenib) [22, 23] in comparison with regorafenib, we wondered whether OCT4mut-induced cell sensitivity for sorafenib might result from the differential activity on FLT3 or c-Kit signal upon sorafenib or regorafenib treatment. Specifically, as shown in Figure 4C, suppressing FLT3 and c-KIT expression could partially overcome OCT4wt-induced resistance to sorafenib, whereas down-regulating the expression of BRAF, the downstream target of FLT3 and KIT [24], totally reversed the impact of OCT4wt. Western blot analysis also revealed an increased level of phosphorylated FLT3, c-KIT, and BRAF in SMMC7721 (OCT4wt) cells rather than OCT4mut cells (Figure 4D, upper panel). Given that BRAF is a component of RAS/RAF/MAPK signaling, these results indicate that OCT4wt might reactivate the RAS/RAF/MAPK pathway through c-KIT and FLT3 and contribute to the resistance to sorafenib.
OCT4 modulates c-KIT/FLT3 and activates RAS/RAF/MAPK signaling. (A) The fold change of OCT4, EPCAM, and CD90 mRNA levels was determined by qRT-PCR analysis in SMMC7721 cells treated with Control-, OCT4wt or OCT4mut -lentivirus. 18S was used as an internal control (mean±s.d, n=3). (B) Determination of tumor spheroid formation. A total of 3000 cells were seeded into low-adhesion plates and incubated for 10 days after the indicated treatment (mean±s.d, n=3). (C) Relative cell survival rates of OCT4wt-to OCT4mut-SMMC7721 cells with indicated siRNAs and sorafenib in IC50 of Control SMMC7721 cells for 48 (mean±s.d, n=3). (D)Upper panel: Levels of indicated protein determined by western blot in Control-, OCT4wt- and OCT4mut-SMMC7721 cells; Lower panel: Protein levels of p-FLT3, p-CKIT and p-BRAF determined by western blot after SMMC7721 cells stimulated with SCF (5ng/ml) for 48h. (E) Left panel: Detection of mRNA levels of SCF and FLT3LG in Control-, OCT4wt- and OCT4mut-SMMC7721 cells (mean±s.d, n=3); Right panel: Dose-response curves for sorafenib in the presence of neutralizing antibody against SCF. Control-, OCT4wt - and OCT4mut -SMMC7721 cells were treated with sorafenib at the indicated concentrations. Viable cells were measured after 48 h of treatment and plotted relative to untreated control cells (mean ± s.d., n = 3 for each concentration, **P<0.01, * P <0.05). (F) Chromatin immunoprecipitation from Control-, OCT4wt - and OCT4mut -SMMC7721 cells using OCT4 antibody. The analysis was conducted using specific primers for the promoter region of KITLG.
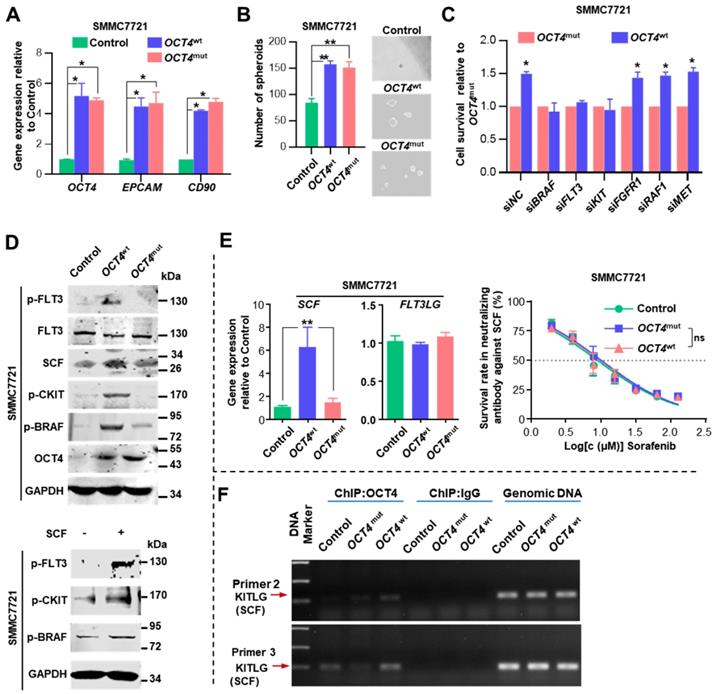
Relative mRNA expression of stem cell factor (SCF, KITLG or c-KIT ligand), was substantially elevated in OCT4wt cells upon sorafenib treatment, whereas the expression of FLT3LG, a ligand of FLT3, was unaltered (Figure 4E, left panel). Surprisingly, we observed that SCF could induce the phosphorylation of both FLT3 and c-KIT, indicating that the cross-activation of SCF upon c-KIT and FLT3 receptors (Figure 4D, lower panel). Sorafenib exhibited full efficacy in both OCT4wt and OCT4mut SMMC7721 cells when they were treated with the neutralizing antibody against SCF (Figure 4E, right panel). Last but not least, chromatin immunoprecipitation (ChIP) showed that more OCT4 was recruited to the predicted promoter regions of the KITLG (the gene encodes stem cell factor) in OCT4wt SMMC7721 cells than in control- or OCT4mut SMMC7721 cells (Figure 4F and Figure S7D). Taken together, these results suggested that in OCT4wt overexpressing HCC, sorafenib-induced SCF expression and simultaneous activation of c-KIT and FLT3 signaling is indispensable for OCT4wt mediated sorafenib resistance.
Combined treatment with sorafenib and tyrosine kinase inhibitors (TKIs) improves therapeutic response
Due to the cross-activation of c-KIT/FLT3 signaling, the efficacy of the combined treatment with imatinib (a selective tyrosine kinase inhibitor of c-KIT and platelet-derived growth factor receptor) or dovitinib (TKI-258, a multi-targeted receptor tyrosine kinase inhibitor for FLT3/c-KIT) was evaluated to verify whether it can improve the sensitivity of sorafenib therapy. As shown in Figure 5A and Figure S7F, no difference was observed for the cell survival among control, OCT4wt and OCT4mut SMMC7721 cells in the presence of either of two TKIs. Remarkably, OCT4wt cells had a better response to the treatment of sorafenib and c-KIT TKIs than sorafenib alone (Figure 5B and Figure S7G).
Combined treatment with sorafenib and c-KIT tyrosine kinase inhibitors improves drug's impact. (A) Dose-response curves for imatinib. Control-, OCT4wt - and OCT4mut -SMMC7721 cells were treated with imatinib at the indicated concentrations. Viable cells were measured after 48 h of treatment and plotted relative to untreated control cells (mean ± s.d., n = 3 for each concentration). (B, C) Control-, OCT4wt - and OCT4mut -SMMC7721 cells (B) and HCC-LM3, PVTT cell lines (C) were treated by sorafenib alone or combined with 0.4μM imatinib (S+I) and 7μM dovitinib (S+D), respectively. Viable cells were measured after 48 h of treatment and plotted relative to untreated control cells. Dose-response curves were fitted and IC50s of each treatment were calculated. (D) Left: Schematic representation of establishing HCC xenograft tumor burden in mice with mono sorafenib or combined sorafenib and imatinib treatment; Right: Intrahepatic tumor burden of nude mice 20 days after Control- and OCT4wt-SMMC7721 cells injection and treatment with sorafenib, imatinib, combinations thereof and vehicle (n = 4). (E) Tumor volume (upper panel) and weight changes (lower panel) in Control-, OCT4wt - and OCT4mut -SMMC7721 cells after vehicle-, sorafenib- and sorafenib combined imatinib-treatment (mean ± s.d., n = 4 for each condition). (F) Left: Representative Immunohistochemistry images of Ki-67 staining in xenografts generated from subcutaneous transplantation with indicated treatment; Right: Quantification of Ki67-positive cells in corresponding xenografts in the left. (mean ± s.d., n = 3,statistical significance calculated using Student's t-test, scale bars: 100 µm, *** P <0.001, ** P <0.01, * P <0.05).
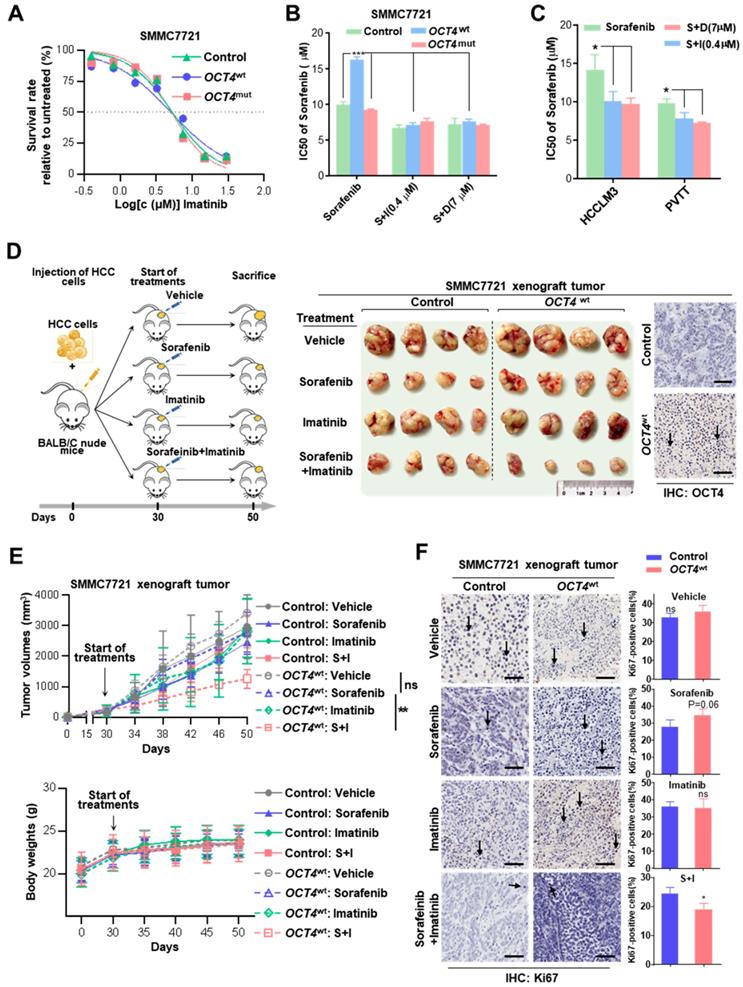
The effects of combined sorafenib and c-KIT TKIs treatment were further examined in OCT4wt cell lines (HCCLM3 and PVTT). As expected, the combination treatment achieved much better responses for both HCCLM3 and PVTT cells than sorafenib only (Figure 5C). Moreover, the efficacy of combined sorafenib and imatinib treatment was evaluated in xenografts inoculated with lenti-OCT4wt-infected SMMC7721 cells or lenti-NC-infected cells. OCT4wt xenografts showed a limited response to monotherapy with either sorafenib or imatinib, whereas the combination of two drugs resulted in significant tumor regression and the absence of weight loss in mice (Figure 5D-E). Notably, markedly decreased expression of the cell proliferation marker Ki-67 in HCC cells was observed in xenografts treated with combined sorafenib and imatinib (Figure 5F).
Discussion
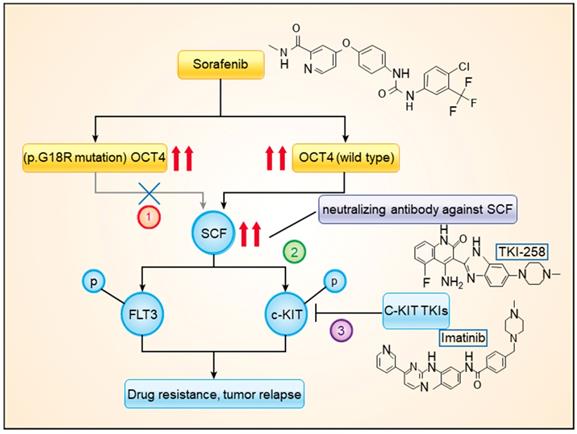
In the present study, by using high-throughput sequencing, we explored the genetic features in HCC tissue samples that were associated with the response to sorafenib treatment. Among the frequently mutated genes, the stop-gain mutation of TP53 and the c.G52C mutation of OCT4 (p.G18R of OCT4) were found to be associated with sorafenib responses. The OCT4wt was found to modulate expression levels of c-KIT and FLT3, which were simultaneously activated by SCF, upregulating RAS/RAF/MAPK signaling. The combined treatment with sorafenib and imatinib or dovitinib had significantly higher efficacy than that of sorafenib mono treatment (Figure 6).
A model showing the mechanism of OCT4wt rendering sorafenib resistance. Combined treatment with sorafenib and imatinib or neutralizing antibody against SCF blocked the activation of c-KIT by OCT4wt.
A phase III study of pembrolizumab, as a second-line agent after sorafenib therapy recently reported negative results [25]. At present, multi-kinase inhibitors, which are represented by sorafenib, still serve as the first-line treatment for patients with unresectable HCC [26]. However, this promising systemic treatment provides only limited survival benefits and has a low response rate, indicating that there is a great need to study the mechanism of the drug resistance to improve survival outcomes of patients with HCC. To the best of our knowledge, this study is the first large-scale clinical genomic study of primary resistance to sorafenib in aHCC. Unexpectedly, unlike the general consensus that the efficacy of EGFR tyrosine kinase inhibitors and anti-EGFR antibodies should be affected first and foremost by EGFR mutations, the efficacy of sorafenib was altered by mutations in other genes rather in its primary targets.
In accordance with previous studies that reported 58% TP53 mutation rate in HCC patients [27] and TP53 mutation were significant prognostic factors associated with shorter survival [28], our data showed that 37.9% of HCC cases had TP53 mutations, which ranked TP53 as the most mutated gene in our cohort. There are lots of reports on the role of TP53 genetic alterations in HCC: The R273L mutation is a dominant-negative mutation that contains a point mutation in the DNA-binding domain and is commonly found in various types of cancers [29]; Inactivating mutations of TP53 were one of the main potential drivers and enriched in HBV-related HCC [30]. Besides, TP53 mutation also resulted in the downregulation of the immune response and doxorubicin resistance in HCC [31, 32]. We initially found the TP53 stopgain mutation in HCC as a mutation type conferring resistance to sorafenib. The stop-gain variant E298X, which diminished p53 expression, also demonstrated a significant impact on the sensitivity to sorafenib. Since frameshift mutation also leads to TP53 loss-of-function, we attempted to examine whether stopgain mutation and frameshift mutation would make any difference in drug response by checking the ICGC database. As expected, both stopgain and frameshift cases showed worse survival rates in comparison with missense cases. When combining cases with frameshift and stopgain together, a more obvious difference between missense and frameshift+stopgain groups was observed (data not shown). Further studies with a larger cohort with either TP53 mutation cases or drug response information should be warranted. In our survival analysis, patients with higher p53 expression showed better OS albeit, without statistical significance, this correlation should be further determined within a larger cohort. Although it has been reported that over-expression of p53 resulted in poor survival in HCC [33], the inconsistency in the present study might be due to the different inclusion criteria and clinical management with sorafenib for HCC patients nowadays. Future studies will be necessary to find ways to overcome the resistance by combining sorafenib administration with the restoration of wild-type TP53 activity. We believe that the suppression of the inhibitory impact of TP53 loss-of-function mutations may increase the therapeutic efficacy of sorafenib for aHCC patients.
Although OCT4 has been suggested to play a crucial role in HCC [34], its mutations have not been explored for drug resistance. Higher expression of OCT4 was observed in sorafenib-resistant cells compared with that in their parental counterparts at the mRNA and protein levels [35]. Our data functionally identified OCT4wt as a target whose upregulation confers strong resistance to sorafenib treatment. It has been reported that knockdown of KITLG with siRNA and inhibition of SCF signaling by tyrosine kinase inhibitors like sorafenib could enhance anti-tumor reactivity, tumor regression and prolonged survival in murine models of colon and Lewis lung carcinoma[36, 37], and we firstly identified the KITLG gene was a novel OCT4-responsive gene that was upregulated upon wild-type OCT4 overexpression. Furthermore, the increased level of OCT4wt was associated with phosphorylation of c-KIT and FLT3 through the release of SCF and consequently reactivated the RAS/RAF/MAPK cascade. As our results indicated, the activation of c-KIT by OCT4wt predicted poor response to sorafenib treatment. However, OCT4mut did not exert such effects. These results provided a clue for the mechanisms of sensitivity to sorafenib in certain populations and suggested a new drug combination approach. The lack of toxicity is particularly important for the treatment of patients with advanced HCC with impaired liver function [38, 39]. Thus, it is noteworthy that imatinib may (without additional toxicity) potentially restore the sensitivity to sorafenib in cancers that have become resistant [40]. In addition, results of a recent phase 2 study showed another c-KIT/FLT3 inhibitor dovitinib, also known as TKI-258, did not appear to have improved activity over sorafenib in patients with advanced HCC [41], our data suggested that future trials can be designed to test the therapeutic efficacy of a combined treatment with sorafenib and imatinib or dovitinib in patients with high expression levels of OCT4wt and c-KIT.
Analysis of clinical data suggested that both p53 and OCT4 were independent prognostic factors, of which p53 expression was associated with favorable survival outcomes, whereas expression of OCT4 indicated unfavorable prognosis. More importantly, in comparison with G52C mutation, our study here implied that the expression of OCT4 seems to be a more practical biomarker for drug response prediction. Patients with a higher expression level of OCT4 might significantly benefit from the combined treatment with sorafenib and c-KIT TKIs than sorafenib mono-treatment.
Because mutations of certain genes serve as negative factors that enhance sorafenib resistance, should sorafenib treatment be replaced with second-line therapies in HCC patients with such mutations? With the recent advances in the development of second-line therapeutic agents, such as regorafenib, precise selection of patients for whom sorafenib treatment would be beneficial becomes a major issue [42]. Future trials exploring relevant stratification of patients and identification of those who will and who will not likely obtain survival benefit from sorafenib treatment are necessary.
Although our study was performed on the largest cohort of aHCC patients in which sensitivity to sorafenib responses was examined in parallel with genomic characterization, there still are some limitations. Our study was consistent with the results of other studies from Eastern countries: all involved patients were from mainland China, where HBV infection is endemic. The adverse events of sorafenib were not collected because of the retrospective nature of the study. Similarly, the adverse events during the combined treatment with sorafenib and imatinib could not be evaluated. Despite these limitations, our study uncovered several molecular markers of primary sorafenib resistance, including TP53, OCT4 mutations, and OCT4 overexpression, which have not been reported previously. The combination of clinical genomic analysis and functional study will provide informative clues for future trials. We highly suggest future large-scale randomized controlled trials to assess the impact on sorafenib responses in patients with TP53 stop-gain mutations. And also, combined therapy with sorafenib and other tyrosine kinase inhibitors may be recommended in patients with certain genetic alterations who failed or progressed on sorafenib treatment.
Abbreviations
HCC, hepatocellular carcinoma; HBV, hepatitis B virus; BCLC, Barcelona Clinic Liver Cancer; OS, overall survival; PDX, patient-derived xenograft; FFPE, formalin-fixed paraffin-embedded; LCM, laser capture microdissection; mRECIST, modified Response Evaluation Criteria in Solid Tumors; qRT-PCR, quantitative reverse-transcript polymerase chain reaction.
Supplementary Material
Supplementary materials and methods, figures.
Supplementary tables.
Acknowledgements
We would like to thank the members of the International Co-operation Laboratory on Signal Transduction, especially Dongping Hu, Linna Guo, Dan Cao, Dandan Huang, Shanna Huang, and Congli Hu, for excellent technical assistance.
Ethics approval and consent to participate
All patients provided written informed consent for treatment and molecular analysis, with ethical approval provided by the EHBH Ethics Committee.
Consent for publication
Written informed consent for publication was obtained from the patients. All authors have agreed to publish this manuscript.
Funding
This work was supported by the National Natural Science Foundation of China (81602107, 81790633, 81672860, 81830054, 61922047, 81890993 and 61721003), the state Key project for liver cancer (2018ZX10732202-001), and the National Key R&D Program of China (2017YFA0505803, 2017YFC0908100).
Author Contributions
JT and GJL performed all experiments. DFW performed the bioinformatics analysis of high-throughput sequencing. SJ and QX performed bioinformatics analysis of clinical data. CJS prepared all samples and clinical data. XYL, RW, and XLL provided human specimens and pathology identification. QZ, QYL, XML, YJZ, QW, JFL, GW, and BZ provided support with experimental techniques. LC, JT and JG designed research and wrote the manuscript. JG, LC, and HYW conceived the study and supervised all experiments.
Availability of data and materials
The datasets used and/or analyzed during the current study are available from the corresponding author on reasonable request.
Competing Interests
The authors have declared that no competing interest exists.
References
1. Siegel RL, Miller KD, Jemal A. Cancer Statistics, 2017. CA Cancer J Clin. 2017;67:7-30
2. Forner A, Llovet JM, Bruix J. Hepatocellular carcinoma. Lancet. 2012;379:1245-1255
3. Allaire M, Nault JC. Advances in management of hepatocellular carcinoma. Curr Opin Oncol. 2017;29:288-295
4. Finn RS, Zhu AX, Farah W, Almasri J, Zaiem F, Prokop LJ. et al. Therapies for advanced stage hepatocellular carcinoma with macrovascular invasion or metastatic disease: A systematic review and meta-analysis. Hepatology. 2018;67:422-435
5. Llovet JM, Ricci S, Mazzaferro V, Hilgard P, Gane E, Blanc JF. et al. Sorafenib in advanced hepatocellular carcinoma. N Engl J Med. 2008;359:378-390
6. Chen J, Jin R, Zhao J, Liu J, Ying H, Yan H. et al. Potential molecular, cellular and microenvironmental mechanism of sorafenib resistance in hepatocellular carcinoma. Cancer Lett. 2015;367:1-11
7. Ganten TM, Stauber RE, Schott E, Malfertheiner P, Buder R, Galle PR. et al. Sorafenib in Patients with Hepatocellular Carcinoma-Results of the Observational INSIGHT Study. Clin Cancer Res. 2017;23:5720-5728
8. Collins FS, Varmus H. A new initiative on precision medicine. N Engl J Med. 2015;372:793-795
9. Jiang T, Li X, Wang J, Su C, Han W, Zhao C. et al. Mutational Landscape of cfDNA Identifies Distinct Molecular Features Associated With Therapeutic Response to First-Line Platinum-Based Doublet Chemotherapy in Patients with Advanced NSCLC. Theranostics. 2017;7:4753-4762
10. Lencioni R, Llovet JM. Modified RECIST (mRECIST) assessment for hepatocellular carcinoma. Semin Liver Dis. 2010;30:52-60
11. Wang K, Li M, Hakonarson H. ANNOVAR: functional annotation of genetic variants from high-throughput sequencing data. Nucleic Acids Res. 2010;38:e164
12. Lawrence MS, Stojanov P, Polak P, Kryukov GV, Cibulskis K, Sivachenko A. et al. Mutational heterogeneity in cancer and the search for new cancer-associated genes. Nature. 2013;499:214-218
13. Fogarty NME, McCarthy A, Snijders KE, Powell BE, Kubikova N, Blakeley P. et al. Genome editing reveals a role for OCT4 in human embryogenesis. Nature. 2017;550:67-73
14. Zalc A, Rattenbach R, Aurade F, Cadot B, Relaix F. Pax3 and Pax7 play essential safeguard functions against environmental stress-induced birth defects. Dev Cell. 2015;33:56-66
15. Peifer M, Fernandez-Cuesta L, Sos ML, George J, Seidel D, Kasper LH. et al. Integrative genome analyses identify key somatic driver mutations of small-cell lung cancer. Nat Genet. 2012;44:1104-1110
16. Song Y, Li L, Ou Y, Gao Z, Li E, Li X. et al. Identification of genomic alterations in oesophageal squamous cell cancer. Nature. 2014;509:91-95
17. Heaphy CM, de Wilde RF, Jiao Y, Klein AP, Edil BH, Shi C. et al. Altered telomeres in tumors with ATRX and DAXX mutations. Science. 2011;333:425
18. Pfister SX, Ahrabi S, Zalmas LP, Sarkar S, Aymard F, Bachrati CZ. et al. SETD2-dependent histone H3K36 trimethylation is required for homologous recombination repair and genome stability. Cell Rep. 2014;7:2006-2018
19. Huang J, Deng Q, Wang Q, Li KY, Dai JH, Li N. et al. Exome sequencing of hepatitis B virus-associated hepatocellular carcinoma. Nat Genet. 2012;44:1117-1121
20. Rudalska R, Dauch D, Longerich T, McJunkin K, Wuestefeld T, Kang TW. et al. In vivo RNAi screening identifies a mechanism of sorafenib resistance in liver cancer. Nat Med. 2014;20:1138-1146
21. Chang TS, Wu YC, Chi CC, Su WC, Chang PJ, Lee KF. et al. Activation of IL6/IGFIR confers poor prognosis of HBV-related hepatocellular carcinoma through induction of OCT4/NANOG expression. Clin Cancer Res. 2015;21:201-210
22. Adnane L, Trail PA, Taylor I, Wilhelm SM. Sorafenib (BAY 43-9006, Nexavar®), a dual-action inhibitor that targets RAF/MEK/ERK pathway in tumor cells and tyrosine kinases VEGFR/PDGFR in tumor vasculature. Methods Enzymol. 2006;407:597-612
23. Wilhelm SM, Dumas J, Adnane L, Lynch M, Carter CA, Schütz G. et al. Regorafenib (BAY 73-4506): a new oral multikinase inhibitor of angiogenic, stromal and oncogenic receptor tyrosine kinases with potent preclinical antitumor activity. Int J Cancer. 2011;129:245-255
24. Dibb NJ, Dilworth SM, Mol CD. Switching on kinases: oncogenic activation of BRAF and the PDGFR family. Nat Rev Cancer. 2004;4:718-727
25. Finn RS, Ryoo B-Y, Merle P, Kudo M, Bouattour M, Lim HY. et al. Pembrolizumab as second-line therapy in patients with advanced hepatocellular carcinoma in KEYNOTE-240: a randomized, double-blind, phase III trial. J Clin Oncol. 2020;38:193-202
26. Niu L, Liu L, Yang S, Ren J, Lai PBS, Chen GG. New insights into sorafenib resistance in hepatocellular carcinoma: Responsible mechanisms and promising strategies. Biochim Biophys Acta. 2017;1868:564-570
27. Xiao-Mo WU, Jing-Geng FU, Wang-Zhong GE, Zhu JY, Wang JY, Wei Z. et al. Science Letters: Screen p53 mutations in hepatocellular carcinoma by FASAY: A novel splicing mutation. J Zhejiang Univ Sci B. 2007;8:81-87
28. Peng SY, Chen WJ, Lai PL, Jeng YM, Sheu JC, Hsu HC. High alpha-fetoprotein level correlates with high stage, early recurrence and poor prognosis of hepatocellular carcinoma: significance of hepatitis virus infection, age, p53 and beta-catenin mutations. Int J Cancer. 2004;112:44-50
29. Hollstein M, Sidransky D, Vogelstein B, Harris CC. p53 mutations in human cancers. Science. 1991;253:49-53
30. Schulze K, Nault J-C, Villanueva AJJoh. Genetic profiling of hepatocellular carcinoma using next-generation sequencing. J Hepatol. 2016;65:1031-1042
31. Long J, Wang A, Bai Y, Lin J, Yang X, Wang D. et al. Development and validation of a TP53-associated immune prognostic model for hepatocellular carcinoma. EBioMedicine. 2019;42:363-374
32. Ma Z, Guo D, Wang Q, Liu P, Xiao Y, Wu P. et al. Lgr5-mediated p53 Repression through PDCD5 leads to doxorubicin resistance in Hepatocellular Carcinoma. Theranostics. 2019;9:2967-2983
33. Stroescu C, Dragnea A, Ivanov B, Pechianu C, Herlea V, Sgarbura O. et al. Expression of p53, Bcl-2, VEGF, Ki67 and PCNA and prognostic significance in hepatocellular carcinoma. J Gastrointestin Liver Dis. 2008;17:411-417
34. Wu G, Wilson G, Zhou G, Hebbard L, George J, Qiao L. Oct4 is a reliable marker of liver tumor propagating cells in hepatocellular carcinoma. Discov Med. 2015;20:219
35. Li M, Yang J, Zhou W, Ren Y, Wang X, Chen H. et al. Activation of an AKT/FOXM1/STMN1 pathway drives resistance to tyrosine kinase inhibitors in lung cancer. Br J Cancer. 2017;117:974-983
36. Ozao-Choy J, Ma G, Kao J, Wang GX, Meseck M, Sung M. et al. The novel role of tyrosine kinase inhibitor in the reversal of immune suppression and modulation of tumor microenvironment for immune-based cancer therapies. Cancer Res. 2009;69:2514-2522
37. Umansky V, Blattner C, Gebhardt C, Utikal J. The Role of Myeloid-Derived Suppressor Cells (MDSC) in Cancer Progression. Vaccines (Basel). 2016 4
38. Wörns MA, Galle PR. HCC therapies-lessons learned. Nat Rev Gastroenterol Hepatol. 2014;11:447-452
39. Zitvogel L, Rusakiewicz S, Routy B, Ayyoub M, Kroemer G. Immunological off-target effects of imatinib. Nat Rev Clin Oncol. 2016;13:431
40. Iqbal N, Iqbal N. Imatinib: A Breakthrough of Targeted Therapy in Cancer. Chemother Res Pract. 2014;2014:357027
41. Cheng AL, Thongprasert S, Lim HY, Sukeepaisarnjaroen W, Yang TS, Wu CC. et al. Randomized, open-label phase 2 study comparing frontline dovitinib versus sorafenib in patients with advanced hepatocellular carcinoma. Hepatology. 2016;64:774-784
42. Rimassa L, Pressiani T, Personeni N, Santoro A. Regorafenib for the treatment of unresectable hepatocellular carcinoma. Expert Rev Anticancer Ther. 2017;17:567-576
Author contact
![]() Corresponding authors: Lei Chen, Ph.D. International Co-operation Laboratory on Signal Transduction, Eastern Hepatobiliary Surgery Institute, Second Military Medical University, 225 Changhai Road, 200438 Shanghai, China. E-mail: chenleiedu.cn. Tel: 86-21-81875361. Fax: 86-21-65566851. Jin Gu, Ph. D. MOE Key Laboratory for Bioinformatics, BNRIST Bioinformatics Division, Department of Automation, Tsinghua University, Beijing 100084, China. E-mail: jguedu.cn. Tel: +86-10-62794294. Fax: +86-10-62773552. Hong-Yang Wang, M.D., Ph.D. International Co-operation Laboratory on Signal Transduction, Eastern Hepatobiliary Surgery Institute, Second Military Medical University, 225 Changhai Road, 200438 Shanghai, China. E-mail: hywangksina.com. Tel: 86-21-81875361. Fax: 86-21-65566851.
Corresponding authors: Lei Chen, Ph.D. International Co-operation Laboratory on Signal Transduction, Eastern Hepatobiliary Surgery Institute, Second Military Medical University, 225 Changhai Road, 200438 Shanghai, China. E-mail: chenleiedu.cn. Tel: 86-21-81875361. Fax: 86-21-65566851. Jin Gu, Ph. D. MOE Key Laboratory for Bioinformatics, BNRIST Bioinformatics Division, Department of Automation, Tsinghua University, Beijing 100084, China. E-mail: jguedu.cn. Tel: +86-10-62794294. Fax: +86-10-62773552. Hong-Yang Wang, M.D., Ph.D. International Co-operation Laboratory on Signal Transduction, Eastern Hepatobiliary Surgery Institute, Second Military Medical University, 225 Changhai Road, 200438 Shanghai, China. E-mail: hywangksina.com. Tel: 86-21-81875361. Fax: 86-21-65566851.