Impact Factor
- Issue 14; 2026
- Issue 13; 2026
- Issue 12; 2026
- Issue 11; 2026
- Issue 10; 2026
- Volume 16; 2026
- Advance Articles
- Past Issues
- Cover Images
- Cover Suggestion
- Index & Coverage
- Special Issues
Introduction
Methods
Results
Discussion
Abbreviations
Supplementary Material
Acknowledgements
References
International Journal of Biological Sciences
International Journal of Medical Sciences
 Global reach, higher impact

Theranostics 2020; 10(25):11707-11718. doi:10.7150/thno.50565 This issue Cite
Research Paper
Early response evaluation using primary tumor and nodal imaging features to predict progression-free survival of locally advanced non-small cell lung cancer
Nasha Zhang1,2, Rachel Liang1, Michael F. Gensheimer1, Meiying Guo2, Hui Zhu1, Jinming Yu2, Maximilian Diehn1, Bill W Loo Jr1, Ruijiang Li1, Jia Wu1,3 ![]()
1. Department of Radiation Oncology, Stanford University School of Medicine, 1070 Arastradero Rd, Palo Alto, CA 94304
2. Department of Radiation Oncology, Shandong Cancer Hospital and Institute, Shandong First Medical University and Shandong Academy of Medical Sciences, Jinan, China
3. Imaging Physics, Thoracic/Head & Neck Medical Oncology (joint appointment), MD Anderson Cancer Center, 1400 Pressler St., Unit 1472, Houston, Texas 77030
Received 2020-7-11; Accepted 2020-9-8; Published 2020-9-23
Abstract

Prognostic biomarkers that can reliably predict early disease progression of non-small cell lung cancer (NSCLC) are needed for identifying those patients at high risk for progression, who may benefit from more intensive treatment. In this work, we aimed to identify an imaging signature for predicting progression-free survival (PFS) of locally advanced NSCLC.
Methods: This retrospective study included 82 patients with stage III NSCLC treated with definitive chemoradiotherapy for whom both baseline and mid-treatment PET/CT scans were performed. They were randomly placed into two groups: training cohort (n=41) and testing cohort (n=41). All primary tumors and involved lymph nodes were delineated. Forty-five quantitative imaging features were extracted to characterize the tumors and involved nodes at baseline and mid-treatment as well as differences between two scans performed at these two points. An imaging signature was developed to predict PFS by fitting an L1-regularized Cox regression model.
Results: The final imaging signature consisted of three imaging features: the baseline tumor volume, the baseline maximum distance between involved nodes, and the change in maximum distance between the primary tumor and involved nodes measured at two time points. According to multivariate analysis, the imaging model was an independent prognostic factor for PFS in both the training (hazard ratio [HR], 1.14, 95% confidence interval [CI], 1.04-1.24; P = 0.003), and testing (HR, 1.21, 95% CI, 1.10-1.33; P = 0.048) cohorts. The imaging signature stratified patients into low- and high-risk groups, with 2-year PFS rates of 61.9% and 33.2%, respectively (P = 0.004 [log-rank test]; HR, 4.13, 95% CI, 1.42-11.70) in the training cohort, as well as 43.8% and 22.6%, respectively (P = 0.006 [log-rank test]; HR, 3.45, 95% CI, 1.35-8.83) in the testing cohort. In both cohorts, the imaging signature significantly outperformed conventional imaging metrics, including tumor volume and SUVmax value (C-indices: 0.77-0.79 for imaging signature, and 0.53-0.73 for conventional metrics).
Conclusions: Evaluation of early treatment response by combining primary tumor and nodal imaging characteristics may improve the prediction of PFS of locally advanced NSCLC patients.
Keywords: locally advanced NSCLC, pre and mid-treatment PET, radiomics, imaging model, PFS
Introduction
Lung cancer ranks first in cancer-related deaths throughout the world [1]. Non-small cell lung cancer (NSCLC) accounts for about 85% of all lung cancer cases and is a rapidly proliferating tumor. Thirty percent of NSCLCs are diagnosed at a locally advanced TNM stage (stage III) [2], for which concurrent chemoradiotherapy (CCRT) is the clinical standard treatment regimen according to National Comprehensive Cancer Network guidelines [3]. Nevertheless, the median overall survival remains poor for locally advanced NSCLC (10-14 months) [4]. In these patients, tumor heterogeneity is a crucial factor for poor prognosis, with intra-tumoral heterogeneity and tumor evolution resulting in therapy resistance and disease progression [5]. Even in patients diagnosed at identical clinical stages, the distinct biological components and evolution trajectories of individual tumors lead to significant discrepancies in their response to standard treatment regimens [5, 6]. Therefore, biomarkers that can effectively predict treatment failure at individual patient level are of great value for precisely treating them. Results of a phase 3 randomized clinical trial (RTOG 0617) underscored the importance of prognostic biomarkers. In that study, patients with locally advanced NSCLC who received high-dose radiotherapy (RT) did not have a survival benefit when compared with those receiving standard-dose. Contrary to the original hypothesis of the trial, escalating RT dose or adding cetuximab for all enrolled stage III NSCLCs was harmful, whereas adverse events of grade 3 or higher adverse events occurred in 79% of cases in treatment intensified group [7]. In such situations, reliable biomarkers are urgently needed to identify NSCLC patients at high risk for disease progression and who may benefit from a RT dose boost or other intensive treatments.
In recent years, 18F-fluorodeoxyglucose (18F-FDG) positron emission tomography (PET) has been increasingly applied to clinical management of NSCLC, including diagnosis, staging, target volume delineation before RT, treatment response assessment, and progression risk stratification for patients [8-10]. In preliminary studies, some univocal imaging features of PET, such as the maximum standardized uptake value (SUVmax) and metabolic tumor volume (MTV), demonstrated prognostic values for NSCLC [11-15]. However, these results were not universally consistent. For example, according to the ACRIN 6668/RTOG 0235 trial, pretreatment MTV as assessed by 18F-FDG PET/CT is a prognostic factor in patients with stage III NSCLC after definitive chemoradiation [11]. However, Guberina et al. failed to validate this result in the German phase 3 trial ESPATUE, and they reported no differences in the survival curves for patients with high and low MTVs [12]. Additionally, treatment individualization according to MTV was not supported by this study [12]. However, Huang et al. studied 53 patients with stage IIIA-IIIB NSCLC who underwent radical chemoradiotherapy and reported that decreased MTV during treatment was associated with improved overall survival (OS) [14]. Furthermore, in a study by Kong et al., a greater reduction in mid-treatment 18F-FDG PET volume predicted worse survival of locally advanced NSCLC [15]. Possible reasons accounting for these conflicting results are that simple volumetric features may not represent the landscape of complicated, heterogeneous NSCLC tumors. In addition, up to date, most of radiomics studies have focused on the analysis of primary tumors and neglected involved lymph nodes, which contain critical information for staging and treatment planning and are closely linked with prognosis for stage III NSCLC [16].
Computational radiomics analysis has extracted diverse information from images acquired in routine clinical practice and played increasingly essential roles in the response prediction and survival prognostication for several types of cancer, including NSCLC [17-20]. Therefore, in the present work, we sought to determine the prognostic ability of combined pre-RT and mid-RT PET imaging features in stage III NSCLC patients in the most extensive such series reported to date. We hypothesized that a radiomic signature integrating quantitative imaging characteristics of the tumors and lymph nodes extracted from 18F-FDG PET and CT scans to depict their longitudinal variations can provide a complete, dynamic evaluation of the disease burden and thus better predict clinical outcomes at the individual level than conventional imaging metrics.
Methods
Study design
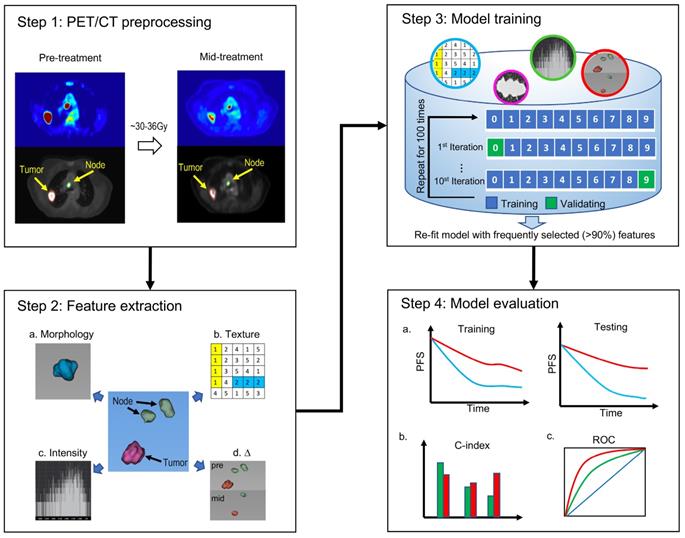
As Figure 1 shows, this retrospective study was conducted in four steps. First, non-small cell lung tumors and involved nodes were segmented on both baseline and mid-treatment fused 18F-FDG PET/CT scans. Second, quantitative image features were extracted from PET/CT scans. Third, an imaging signature was developed to predict progression-free survival (PFS) by fitting an L1-regularized Cox regression model based on a training cohort of the study patients. Fourth, the model performance was assessed in the training cohort and validated in a testing cohort. The C-index and receiver operating characteristic curve (ROC) were applied to evaluate the performance of the imaging model.
The overall study design. The study was conducted in four steps. Step 1: tumors and lymph nodes were segmented and delineated on both baseline and mid-RT fused PET/CT scans. Step 2: quantitative image features were extracted from 3D ROIs. Step 3: we developed an imaging signature to predict progression-free survival by fitting an L1-regularized Cox regression model. Step 4: the model performance was assessed in the training cohort and validated in the testing cohort. The C-index and receiver operating characteristic curve were applied to evaluate the performance of the imaging model. ROI = region of interest.
Study population
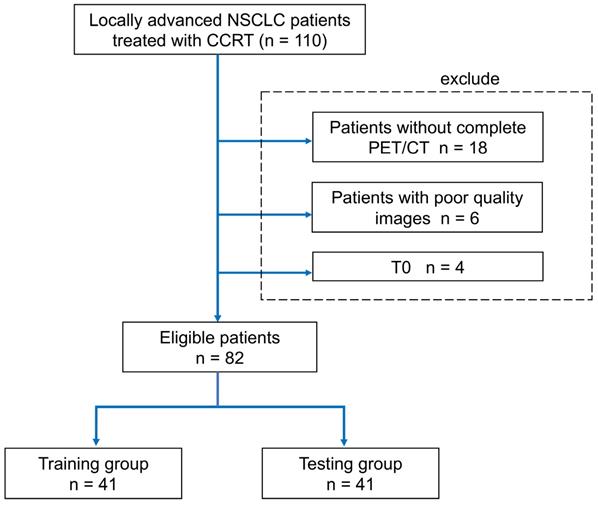
With Institutional Review Board approval, we retrospectively collected data on patients with stage III NSCLC treated consecutively at Stanford University Medical Center from October 2005 to July 2017. The inclusion criteria were 1) biopsy-confirmed NSCLC, 2) 6-7 weeks of radiation therapy (RT) with concurrent platinum-based doublet chemotherapy, and 3) a baseline 18F-FDG PET/CT scan before treatment and a second 18F-FDG PET/CT examination half-way through RT. Exclusion criteria included 1) previous induction chemotherapy or surgery, 2) no primary tumor (T0), and 3) incomplete or poor-quality 18F-FDG PET/CT. After balancing various clinical and pathological risk factors, patients were equally divided into the training cohort (n=41) and testing cohort (n=41). To mitigate random effects and ensure balanced splitting, patients were stratified by matching them according to age, sex, TNM stage, and Karnofsky performance score (KPS).
18F-FDG PET/CT image acquisition and segmentation
The PET/CT scans were performed using either a Siemens Biograph mCT scanner (Siemens, Erlangen, Germany) or a GE Discovery scanner (GE Medical Systems, Milwaukee, WI, USA). CT scans were acquired at a tube potential of 120 kV and current of 250 mA. CT images had a slice thickness of 1.25 mm, and in-plane spatial resolution of 1.02×1.02 mm2. Patients fasted for at least 8 hours before the examinations to ensure their blood glucose levels were below 180 mg/dL. Afterward, each patient received an intravenous injection of 10-18 mCi of 18F-FDG and underwent PET/CT 45-60 min later. The PET images were then reconstructed with time-of-flight and point-spread function modeling or an ordered set expectation maximization algorithm expectation method, with the CT data for attenuation correction. The original PET image spatial resolution was 2.34 × 2.34 × 3.27 mm3. The detailed imaging protocols were reported in previous studies [21, 22].
PET/CT images archived in the PACS were exported in DICOM format. The mediastinal staging was evaluated by PET/CT imaging and image-guided biopsy according to the specific location of lymph nodes. The primary tumors and involved lymph nodes were separately delineated on pre-RT and mid-RT PET/CT scans by an attending radiation oncologist specializing in lung cancer. The contour structure data were extracted for further analyses using validated in-house software in MATLAB (MathWorks, Natick, MA, USA) [23].
Extraction of quantitative image features of primary tumors and involved lymph nodes
High-throughput parameter-based extraction of regions of interest (ROI) on pre-RT and mid-RT PET/CT scans and assessment of the differences between the two scans were performed using MATLAB. All imaging features were calculated based on 3D ROIs. To reduce variability in the PET SUV map, the PET SUV was normalized according to the average background activity in a circular region of interest in the aortic arch. All images were then resampled at an isotropic spatial resolution of 1.0 mm3 using the imresize3 function in Matlab (version R2017b).
As shown in Table 1, 45 quantitative imaging features were extracted, including morphology, boundary sharpness, intensity, and gray-level co-occurrence matrix (GLCM) texture features measuring intra-tumoral heterogeneity of primary tumors, as well as volume, border sharpness, and intensity of lymph nodes. A similar set of features has been used in the assessment of breast and head and neck cancer [23, 24]. For lymph nodes, three additional features were used to characterize the nodal burden and locoregional invasion of disease: 1) the total number of involved lymph nodes (Nmorph.num); 2) nodal spread, which is the maximum distance among the lymph nodes (Nmorph.spread1); and 3) node-tumor spread, which is the longest distance from the tumor border to the edge of the farthest lymph node (Nmorph.spread2). The changes in tumor volume, lymph node volume, node number, nodal spread, and node-tumor spread during treatment were also calculated as important Δ radiomics features, which reflect the early therapeutic response as determined between the pre-RT and mid-RT PET/CT scans.
Forty-five radiomic features extracted from patients' PET/CT scans.
| Tumor at pre- and mid-RT (n=22) | Lymph Node at pre- and mid-RT (n=18) | Δ Features, mid - pre (n=5) |
|---|---|---|
| Morphology | Morphology | Tumor |
| Volume (Tmorph.vol) | Volume (Nmorph.vol) | Δ Volume (Δ. Tmorph.vol) |
| Sphericity (Tmorph.sphericity) | Number (Nmorph.num) | Lymph Node |
| Boundary Sharpness | Nodal Spread (Nmorph.spread1) | Δ Volume (Δ.Nmorph.vol) |
| Mean (Tbound.mean) | Node-Tumor Spread (Nmorph.spread2) | Δ Number (Δ. Nmorph.num) |
| Standard Deviation (Tbound.std) | Boundary Sharpness | Δ Nodal Spread (Δ. Nmorph.spread1) |
| Intensity | Mean (Nbound.mean) | Δ Node-Tumor Spread (Δ. Nmorph.spread2) |
| Mean (Tih.mean) | Standard Deviation (Nbound.std) | |
| Standard Deviation (Tih.std) | Intensity | |
| Entropy (Tih.entropy) | Mean (Nih.mean) | |
| GLCM Texture | Standard Deviation (Nih.std) | |
| Contrast (Tcm.contrast) | Entropy (Nih.entropy) | |
| Homogeneity (Tcm.homogeneity) | ||
| Correlation (Tcm.corr) | ||
| Energy (Tcm.energy) |
Construction of an imaging signature for predicting NSCLC progression
Based on the 45 quantitative imaging features, a multivariate Cox proportional hazard regression model was fitted to predict PFS in the training cohort. To avoid over-fitting, the Least Absolute Shrinkage and Selection Operator (LASSO) algorithm was used to select features. During this process, the 10-fold cross-validation scheme was performed 100 times to minimize selection bias. The importance of these features was determined during the model construction as to be their selection probability. Image features with a selected frequency greater than 90% were used to re-fit the final imaging model.
Evaluation of the imaging model
The value of imaging signature in predicting PFS was validated in the hold out testing cohort. The ability to predict 2-year PFS was assessed using survival receiver operating characteristic (ROC) analysis and area under the curve (AUC). In a previous study, the 5-year overall survival rate in stage IIIA NSCLC patients was 19%, whereas that in stage IIIB patients was 7% [4]. The performance of the proposed imaging signature was compared to different TNM stage, i.e. stage IIIA versus stage IIIB. Next, the prognostic performance of the proposed imaging signature was compared to conventional PET/CT metrics, including pre-RT tumor volume, mid-RT tumor volume, Δtumor volume, pre-RT SUVmax, mid-RT SUVmax, and ΔSUVmax. The survival data were censored at 2 year as a clinically meaningful endpoint. Moreover, we have carried ablation study to include the proposed imaging features solely from pre-RT PET/CT (n=20) or mid-RT PET/CT (n=20), and repeated the whole process of model construction. The ablated models were compared to the model constructed with all 45 radiomics features.
Statistics
The Cox proportional hazards model was used to calculate C-index, hazard ratio (HR), and 95% confidence interval (CI). Kaplan-Meier analysis and log-rank test were used for evaluating patient stratification into different risk groups regarding disease progression, where their survival differences were measured by HR and 95% CI. Receiver operating characteristic analysis was applied to evaluate the prognostic accuracy of the predictive models. In these analyses, P values less than 0.05 were considered significant, and all statistical tests were two-sided. Statistical analysis was performed in the R (R Foundation, Vienna, Austria).
Results
Patients characteristics
Eighty-two patients with stage III NSCLC were enrolled in this study (Figure 2). Patients received an initial radiation doses ranging from 60.0 Gy to 80.4 Gy (median, 66.0 Gy). PET/CT scans were performed half-way through RT for re-planning purpose. By the time of mid-RT PET/CT, the radiation doses ranged from 22.0 Gy to 48.4 Gy. The patients' clinical characteristics are shown in Table 2. In the training cohort, the median age of patients was 68.2 years (range, 41.5-89.2 years). Twenty of these patients (48.8%) had stage IIIA disease, and 21 patients (51.2%) had stage IIIB disease. Forty-four percent of the patients had adenocarcinoma, and 39% of them had squamous cell carcinoma. In the testing group, the median age was 67.9 years (range, 47.2-89.7 years). Eighteen of these patients (43.9%) had stage IIIA disease, and 23 patients (56.1%) had stage IIIB disease. Also, 44% of these patients had adenocarcinoma, and 24.4% had squamous cell carcinoma. At the end of the follow-up period, the disease progression rates were 48.8% in the training cohort and 51.2% in the testing cohort. We did not observe significant differences in the clinical factors between the stratified training and testing cohorts.
Protocol enrollment and analysis diagram for the study. CCRT=concurrent chemoradiotherapy.
Demographic and clinical characteristics of the study patients
| Parameter | Training (n=41) | Testing (n=41) | P value |
|---|---|---|---|
| Age (years) | 68.2 (41.5-89.2) | 67.9 (47.2-89.7) | 0.253 |
| Sex | 0.736 | ||
| Male | 25 (61.0%) | 23 (56.1%) | |
| Female | 16 (39.0%) | 18 (43.9%) | |
| T Stage | 0.121 | ||
| T1 | 12 (29.2%) | 9 (22.0%) | |
| T2 | 9 (22.0%) | 15 (36.6%) | |
| T3 | 5 (12.2%) | 11 (26.8%) | |
| T4 | 15 (36.6%) | 6 (14.6%) | |
| N Stage | 0.493 | ||
| N0 | 2 (4.9%) | 1 (2.4%) | |
| N1 | 2 (4.9%) | 2 (4.9%) | |
| N2 | 24 (58.5%) | 21 (51.2%) | |
| N3 | 13 (31.7%) | 17 (41.5%) | |
| TNM Stage | 0.732 | ||
| IIIA | 20 (48.8%) | 18 (43.9%) | |
| IIIB | 21 (51.2%) | 23 (56.1%) | |
| Histology | 0.213 | ||
| Adenocarcinoma | 18 (43.9%) | 18 (43.9%) | |
| SCC | 16 (39.0%) | 10 (24.4%) | |
| NSCLC-NOS | 7 (17.1%) | 13 (31.7%) | |
| KPS Score | 80 (60-100) | 80 (50-100) | 0.237 |
| PFS | 0.942 | ||
| Event | 20 (48.8%) | 21 (51.2%) | |
| No event | 21 (51.2%) | 20 (48.8%) | |
| Follow-up (year) | 0.659 | ||
| Median, std | 2.0 (0.8) | 1.9 (0.6) |
Details on the construction of imaging signature
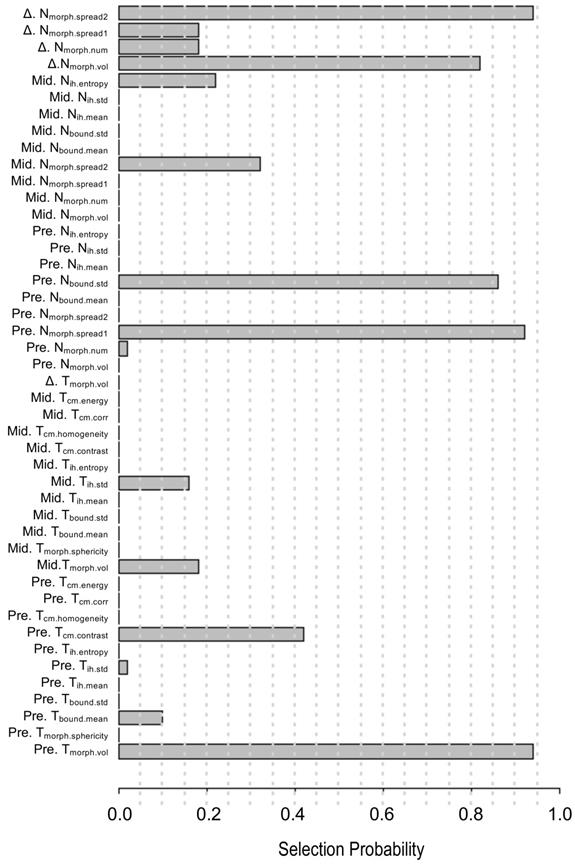
A pair-wise correlation heat map of the proposed 45 quantitative imaging features showed that these features were largely independent of each other (Figure S1). Also, a feature importance plot (Figure 3) showed that the most important features were the tumor volume measured at baseline (Pre.Tmorph.vol) and the change in maximum distance between the tumor and involved lymph nodes measured at two time points (Δ.Nmorph.spread2), followed by the nodal spread measured before RT (Pre. Nmorph.spread1). The features extracted from lymph nodes, including Pre.Nbound.std and nodal volume differences between the pre-RT and mid-RT (Δ.Nmorph.vol), had important prognostic value, ranking 4th and 5th, respectively. Moreover, the mid-RT nodal-tumor spread (Mid. Nmorph.spread2), Mid.Nih.entropy, and delta radiomics features of node number (Δ.Nmorph.num) and nodal spread (Δ.Nmorph.spread1) were important radiomic features, suggesting great value of mid-RT imaging features in predicting patient outcomes. The final imaging signature contained three features, including Pre. Tmorph.vol, Δ. Nmorph.spread2 and Pre. Nmorph.spread1 (see their detailed definition in Table 3), each of which were significantly associated with PFS (P < 0.05).
The 45 quantitative imaging features selected for predicting PFS. The selection probability represents the importance of individual features.
Details of the three imaging features in the final cox model for predicting PFS
| Selected PET features | HR | 95% CI | P value |
|---|---|---|---|
| Baseline tumor volume (Pre. Tmorph.vol) | 5.23 | 2.04 - 13.41 | <0.001 |
| Change in maximum distance between the primary tumor and involved nodes measured at two time points (Δ. Nmorph.spread2) | 2.19 | 1.25 - 3.86 | 0.007 |
| Baseline maximum distance between involved nodes (Pre. Nmorph.spread1) | 1.99 | 1.15 - 4.44 | 0.014 |
Performance of the imaging signature in predicting PFS
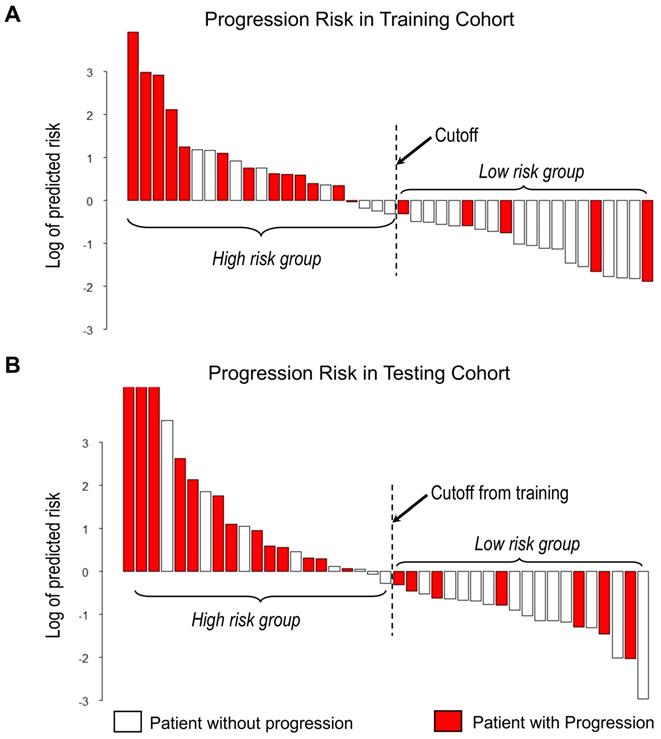
With the median as the cut-off value (Figure 4A), the imaging signature stratified 41 patients in the training cohort into two groups at low and high risk for disease progression (P = 0.004 [log-rank test]; Figure 5A). The two patient groups had significantly different prognoses. Specifically, the 2-year PFS rates were 61.9% in the low-risk group and 33.2% in the high-risk group. Also, the median PFS duration was 19.3 months in the low-risk group and 10.5 months in the high-risk group.
Waterfall plot of predicted risk of PFS according to the proposed imaging signature for A) Training cohort and B) Testing cohort.
Kaplan-Meier curves of PFS in the study patients. At the cut-off value in the imaging model, patients were stratified into low-risk and high-risk groups regarding disease progression. A) Training cohort. B) Testing cohort.
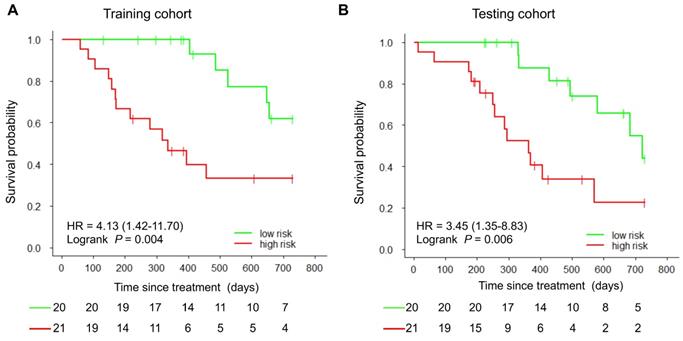
Using the same cut-off value, we independently validated the imaging model in the testing cohort stratified into low- and high-risk groups (Figure 4B). The results showed that the patients in the low and high-risk groups had significantly different PFS (P = 0.006 [log-rank test]; HR, 3.45, [95% CI, 1.35-8.83]; Figure 5B). The 2-year PFS rate in the low-risk group was 43.8%, whereas that in the high-risk group was 22.6%. Also, the median PFS duration was 16.4 months in the low-risk group and 9.5 months in the high-risk group.
The proposed imaging signature outperformed ablated models based on solely pre-RT or mid-RT PET/CT features
Similarly, we built two ablated imaging signatures from features extracted from pre-RT or mid-RT images, where the feature importance was shown in Figure S2. For the ablated model based on pre-RT features, nodal spread, tumor volume, and node boundary sharpness were the three most important ones. In contrast, for the ablated model from mid-RT features, node-tumor spread, tumor volume, and nodal spread were the three most important ones. The proposed imaging signature achieved higher prediction accuracy than two ablated models for predicting PFS (Figure S3). Further, the performance of individual selected features in the proposed imaging signature for predicting PFS was shown in Figure S3.
The proposed imaging signature outperformed conventional clinical and imaging markers in predicting PFS
We compared the performance of the proposed imaging model and TNM stage (IIIA vs. IIIB) in classifying 2-year PFS, the resulting receiver operating characteristic curves for which are presented in Figure S4. In both the training and testing cohorts, the imaging model better predicted disease progression (AUC, 0.74 or 0.71) than did the TNM stage (AUC, 0.66 or 0.60). Furthermore, in a univariate analysis, the proposed imaging signature outperformed available clinical factors, including age, sex, histological type, and KPS (Table 4). During validating in the testing cohort, the imaging signature-based risk score remained significantly associated with PFS (HR, 1.40 [95% CI, 1.04-1.88]; P = 0.027).
Results of univariate and multivariate analyses of the proposed imaging signature and clinical factors in predicting PFS
| Predictors | Training cohort | Testing cohort | ||||||||||
|---|---|---|---|---|---|---|---|---|---|---|---|---|
| Univariate | Multivariate | Univariate | Multivariate | |||||||||
| HR | 95% CI | P value | HR | 95% CI | P-value | HR | 95% CI | P-value | HR | 95% CI | P value | |
| Imaging model | 1.14 | 1.03 - 1.27 | 0.013 * | 1.14 | 1.04 - 1.24 | 0.003 * | 1.40 | 1.04 - 1.88 | 0.027 * | 1.21 | 1.10 - 1.33 | 0.048 * |
| Age | 1.03 | 0.98 - 1.08 | 0.248 | 1.03 | 0.98 - 1.08 | 0.275 | 0.97 | 0.93 - 1.02 | 0.240 | 0.97 | 0.92 - 1.03 | 0.281 |
| Sex | 0.96 | 0.40 - 2.31 | 0.921 | 1.75 | 0.58 - 5.26 | 0.323 | 0.83 | 0.35 - 1.98 | 0.674 | 0.78 | 0.27 - 2.24 | 0.643 |
| Stage | 1.49 | 0.62 - 3.57 | 0.376 | 1.23 | 0.42 - 3.57 | 0.699 | 1.39 | 0.62 - 3.33 | 0.424 | 1.32 | 0.21 - 1.47 | 0.236 |
| Histology | 1.37 | 0.54 - 3.47 | 0.511 | 2.06 | 0.70 - 6.03 | 0.187 | 1.17 | 0.48 - 2.84 | 0.725 | 1.85 | 0.68 - 5.04 | 0.230 |
| KPS | 0.96 | 0.91 - 1.00 | 0.068 | 0.97 | 0.92 - 1.02 | 0.266 | 0.96 | 0.92 - 1.01 | 0.132 | 0.97 | 0.92 - 1.02 | 0.243 |
Note: 1. male as 1, female as 0; 2. IIIA as 0, IIIB as 1; 3. KPS as continuous value; 4. Adenocarcinoma as 1, others as 0.
Moreover, in the multivariate Cox regression, the imaging model was an independent predictor of PFS in the training cohort (HR, 1.14 [95% CI, 1.04-1.24]; P = 0.003) adjusting for available clinical factors (Table 4). In contrast, patient age, sex, TNM stage, and KPS were not significantly associated with PFS. We observed a similar trend in the testing cohort, as the imaging signature demonstrated a significant association of PFS (HR, 1.21 [95% CI, 1.10-1.33]; P = 0.048).
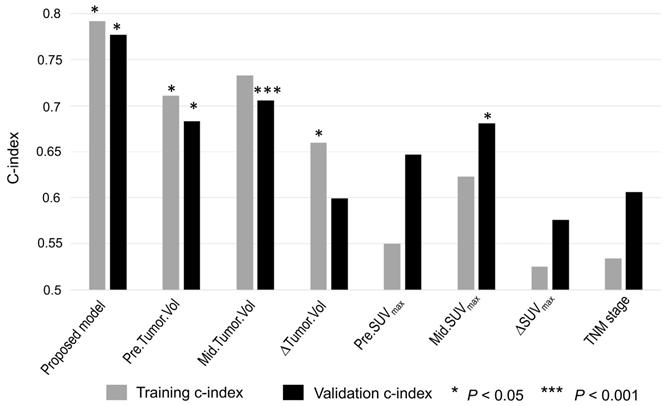
As shown in Figure 6, the proposed imaging signature outperformed conventional PET/CT metrics, including tumor volume and SUVmax, and the TNM stage in both the training and testing cohorts, with C-indices of 0.79 and 0.76, respectively. In particular, the proposed imaging signature achieved a markedly higher accuracy than did mid-RT tumor volume, which was the single best predictor of PFS among the selected conventional imaging features.
Accuracy of predicting PFS as measured using the C-index for the imaging signature compared with six conventional imaging features and one clinical parameter. The conventional imaging features were pre-RT tumor volume, mid-RT tumor volume, change in tumor volume, pre-RT SUVmax, mid-RT SUVmax, and change in SUVmax. The clinical parameter was TNM stage.
Discussion
In this study, we constructed a prognostic PET/CT imaging signature in stage III NSCLC patients using a quantitative radiomics approach. In particular, we crafted new features to characterize tumor spread through analysis of the involved lymph nodes as well as to assess early treatment response by computing feature variations (i.e., delta radiomics) between baseline and mid-treatment scans. Based on these features, we developed a PET/CT radiomic signature that can stratify patients into distinct progression risk groups. We further demonstrated that the newly derived PET/CT model outperformed and complemented known clinical risk factors, including age, sex, TNM stage, and KPS. Another strength of our study is that we focused on stage III NSCLC patients who underwent similar RT treatments to mitigate potential confounding effects. With future validation, this imaging-based prognostic model may play a role in optimizing treatment intensity for locally advanced NSCLC patients with a high risk of disease progression.
To the best of our knowledge, this is the first study investigating the use of quantitative PET/CT features of both tumors and lymph nodes at pre-RT and mid-RT time points to predict the risk of disease progression in patients with stage III NSCLC. Previous PET radiomic studies of a similar population [12, 25-27] focused only on primary tumors and quantified few standard features, such as SUVmax and MTV. Lymph nodes are frequent sites of regional metastasis and represent critical information for cancer staging. Indeed, pilot studies proved that radiomic features of lymph nodes demonstrated superior prognostic value over those of the primary tumors in lung or head and neck cancer patients [23, 28]. In particular, the number and dispersed distance of involved lymph nodes were informative of NSCLC patients' survival [29, 30]. Our study corroborated these reported clinical values associated with lymph nodes, as nodal features make up four out of five top-ranked important features (Figure 3). Moreover, our PET/CT model has two nodal spread features that complement primary tumor volume, and combining them in the final imaging signature augmented PFS-predictive accuracy.
Also, we did not observe an association between the nodal volumetric burden and tumor progression, which was consistent with previous findings [29, 31].
The negative results of the RTOG 0617 multicenter trial described above highlighted the unmet need for effective prognostic markers to stratify patients with inoperable stage III NSCLC for individualized management. To address this, we examined the uniform cohort of 82 stage III NSCLC patients described herein, who were similar to the patients enrolled in RTOG 0617. Moreover, our patients received definitive chemoradiation using consistent, highly conformal techniques. Our proposed imaging signature achieved good performance for predicting tumor progression, outperforming conventional PET features and the TNM stage. Potentially, this signature can stratify stage III NSCLC patients into high and low-risk groups requiring different treatment strategies.
Our study contained the largest number of patients used to examine the clinical value of serial PET/CT scans at baseline and in the middle of RT of stage III NSCLC. Most previous radiomics studies focused on analyzing pre-treatment PET scans to characterize the metabolic heterogeneity of only primary tumors [22, 32-37]. Several pilot studies have investigated serial PET images acquired both at baseline and during treatment. Gensheimer et al. showed that pre-RT MTV and mid-RT MTV and total lesion glycolysis (TLG) were positively associated with local recurrence of stage III NSCLC [13]. Also, Yossi et al. showed that early assessment of TLG response via mid-RT PET was associated with survival [38]. Dong et al. reported that early changes in PET textural features might be valuable for predicting treatment response and survival of locally advanced NSCLC [39]. Building on but different from these studies, we proposed a set of forty-five quantitative imaging features that comprehensively describe both tumors and lymph nodes separately at pre-RT and mid-RT PET scans as well as the temporal changes between the two serial scans. Moreover, the extracted features are non-redundant, and all of them can be clearly interpreted. We found that mid-RT scans provided key information to complement features extracted from pre-RT images. In the proposed imaging signature, one out of three finally selected features was from mid-RT scans to describe the change in nodal spread as an early treatment response measure. One important advantage of our PET/CT model is that it relies on contour-based features and thus may be less dependent on the exact value of PET SUV intensity. In contrast, many features used in previous radiomic studies, such as histogram and texture, are sensitive to variations in PET SUV intensity, which can be caused by a variety of acquisition factors as well as reconstruction and value normalization algorithms.
Our study had some limitations. First, we studied a relatively small number of patients, which may have reduced the statistical power. However, to the best of our knowledge, our study had the largest number of patients in an investigation of quantitative PET/CT features of both primary tumors and lymph nodes at pre-RT and mid-RT time points for predicting the risk of disease progression in patients with stage III NSCLC. Second, it was a retrospective study with potential confounding factors. We followed a strict training and independent testing scheme by evenly partitioning the overall cohort in training and testing cohorts, which further reduced the sample size in the training cohort. Also, all enrolled patients were treated at a single research institution. However, although the PET scans were acquired using two scanners, they followed similar imaging protocols. Third, we included patients with two major histological subtypes of NSCLC: adenocarcinoma and squamous cell carcinoma. Due to the small sample size, we did not carry subgroup analysis and separate patients according to their histologic subtypes. Fourth, Steinfort and colleagues found that systematic node staging by EBUS-TBNA can detect PET-occult LN metastases in 5-10% of NSCLC patients [40]. Therefore, accurate lymph node staging by EBUS can potentially improve the performance of the imaging signature.
In the future, prospective multicenter validation of our proposed imaging signature will be needed to further confirm its prognostic value and potential role in guiding personalized RT for stage III NSCLC. In addition, the underlying biological mechanisms explaining the prognostic value of our imaging signature should be investigated. Integrating corresponding biological information on multiple spatial scales, such as molecular, cellular and tissue levels, we can explore the drivers behind high-risk patients as predicted by the PET imaging model using radiogenomic frameworks [41]. As more information on tumor is collected including molecular markers of NSCLC [42, 43], combining biospecimen-derived information with this imaging signature may achieve the highest level of accuracy in NSCLC patient risk stratification.
In conclusion, we constructed a quantitative imaging signature combining primary tumor and nodal imaging features from baseline and mid-RT PET/CT scans to predict disease progression in patients with stage III NSCLC. This imaging signature is a method of non-invasive evaluation of the dynamic phenotypes of NSCLC that has great potential for guiding individualized treatment of this disease.
Abbreviations
CI, confidence interval; CT, computed tomography; 18F-FDG, 18F-fluorodeoxyglucose; HR, hazard ratio; KPS, Karnofsky performance score; MTV, metabolic tumor volume; NSCLC, non-small cell lung cancer; PET, positron emission tomography; PFS, progression-free survival; RT, radiotherapy; SUVmax, maximum standardized uptake value.
Supplementary Material
Supplementary figures.
Acknowledgements
This work was partially supported by the National Institutes of Health grant R01 CA233578. We thank Scientific Publications, Research Medical Library at MD Anderson Cancer Center for the English language editing.
Ethics approval and consent to participate
All procedures in this study involving human participants were performed in accordance with the ethical standards of the institutional review board at Stanford University. Informed consent was waived by the board.
Funding
This work was partially supported by the National Institutes of Health grant R01 CA233578.
Competing Interests
The authors have declared that no competing interest exists.
References
1. Siegel RL, Miller KD, Jemal A. Cancer statistics, 2018. CA Cancer J Clin. 2018;68:7-30
2. Yang P, Allen MS, Aubry MC, Wampfler JA, Marks RS, Edell ES. et al. Clinical features of 5,628 primary lung cancer patients: experience at Mayo Clinic from 1997 to 2003. Chest. 2005;128:452-62
3. National Comprehensive Cancer Network. NCCN clinical practice guidelines in oncology. Non-small cell lung cancer (Version 2019) [EB/OL]. http://www.nccn.org.
4. Goldstraw P, Crowley J, Chansky K, Giroux DJ, Groome PA, Rami-Porta R. et al. The IASLC lung cancer staging project: proposals for the revision of the TNM stage groupings in the forthcoming (seventh) edition of the TNM classification of malignant tumours. J Thorac Oncol. 2007;2:706-14
5. Jamal-Hanjani M, Wilson GA, McGranahan N, Birkbak NJ, Watkins TBK, Veeriah S. et al. Tracking the evolution of non-small-cell lung cancer. N Engl J Med. 2017;376:2109-21
6. Cook GJ, O'Brien ME, Siddique M, Chicklore S, Loi HY, Sharma B. et al. Non-small cell lung cancer treated with Erlotinib: heterogeneity of (18)F-FDG uptake at PET-association with treatment response and prognosis. Radiology. 2015;276:883-93
7. Bradley JD, Paulus R, Komaki R, Masters G, Blumenschein G, Schild S. et al. Standard-dose versus high-dose conformal radiotherapy with concurrent and consolidation carboplatin plus paclitaxel with or without cetuximab for patients with stage IIIA or IIIB non-small-cell lung cancer (RTOG 0617): a randomised, two-by-two factorial phase 3 study. Lancet Oncol. 2015;16:187-99
8. Fischer B, Lassen U, Mortensen J, Larsen S, Loft A, Bertelsen A. et al. Preoperative staging of lung cancer with combined PET-CT. N Engl J Med. 2009;361:32-9
9. Vanuytsel LJ, Vansteenkiste JF, Stroobants SG, De Leyn PR, De Wever W, Verbeken EK. et al. The impact of (18)F-fluoro-2-deoxy-D-glucose positron emission tomography (FDG-PET) lymph node staging on the radiation treatment volumes in patients with non-small cell lung cancer. Radiother Oncol. 2000;55:317-24
10. Machtay M, Duan F, Siegel BA, Snyder BS, Gorelick JJ, Reddin JS. et al. Prediction of survival by [18F]fluorodeoxyglucose positron emission tomography in patients with locally advanced non-small-cell lung cancer undergoing definitive chemoradiation therapy: results of the ACRIN 6668/RTOG 0235 trial. J Clin Oncol. 2013;31:3823-30
11. Bazan JG, Duan F, Snyder BS, Horng D, Graves EE, Siegel BA. et al. Metabolic tumor volume predicts overall survival and local control in patients with stage III non-small cell lung cancer treated in ACRIN 6668/RTOG 0235. Eur J Nucl Med Mol Imaging. 2017;44:17-24
12. Guberina M, Eberhardt W, Stuschke M, Gauler T, Aigner C, Schuler M. et al. Pretreatment metabolic tumour volume in stage IIIA/B non-small-cell lung cancer uncovers differences in effectiveness of definitive radiochemotherapy schedules: analysis of the ESPATUE randomized phase 3 trial. Eur J Nucl Med Mol Imaging. 2019;46:1439-47
13. Gensheimer MF, Hong JC, Chang-Halpenny C, Zhu H, Eclov NCW, To J. et al. Mid-radiotherapy PET/CT for prognostication and detection of early progression in patients with stage III non-small cell lung cancer. Radiother Oncol. 2017;125:338-43
14. Huang W, Fan M, Liu B, Fu Z, Zhou T, Zhang Z. et al. Value of metabolic tumor volume on repeated 18F-FDG PET/CT for early prediction of survival in locally advanced non-small cell lung cancer treated with concurrent chemoradiotherapy. J Nucl Med. 2014;55:1584-90
15. Kong FS, Li L, Wang W, Campbell J, Waller JL, Piert M. et al. Greater reduction in mid-treatment FDG-PET volume may be associated with worse survival in non-small cell lung cancer. Radiother Oncol. 2019;132:241-9
16. Markovina S, Duan F, Snyder BS, Siegel BA, Machtay M, Bradley JD. Regional lymph node uptake of [(18)F] fluorodeoxyglucose after definitive chemoradiation therapy predicts local-regional failure of locally advanced non-small cell lung cancer: results of ACRIN 6668/RTOG 0235. Int J Radiat Oncol Biol Phys. 2015;93:597-605
17. Aerts HJ, Velazquez ER, Leijenaar RT, Parmar C, Grossmann P, Carvalho S. et al. Decoding tumour phenotype by noninvasive imaging using a quantitative radiomics approach. Nat Commun. 2014;5:4006
18. Lambin P, Leijenaar RTH, Deist TM, Peerlings J, de Jong EEC, van Timmeren J. et al. Radiomics: the bridge between medical imaging and personalized medicine. Nat Rev Clin Oncol. 2017;14:749-62
19. Gillies RJ, Kinahan PE, Hricak H. Radiomics: images are more than pictures, they are data. Radiology. 2016;278:563-77
20. Liu Z, Wang S, Dong D, Wei J, Fang C, Zhou X. et al. The applications of radiomics in precision diagnosis and treatment of oncology: opportunities and challenges. Theranostics. 2019;9:1303-22
21. Wu J, Gensheimer MF, Dong X, Rubin DL, Napel S, Diehn M. et al. Robust intratumor partitioning to identify high-risk subregions in lung cancer: a pilot study. Int J Radiat Oncol Biol Phys. 2016;95:1504-12
22. Wu J, Aguilera T, Shultz D, Gudur M, Rubin DL, Loo BW Jr. et al. Early-stage non-small cell lung cancer: quantitative imaging characteristics of (18)F fluorodeoxyglucose PET/CT allow prediction of distant metastasis. Radiology. 2016;281:270-8
23. Wu J, Gensheimer MF, Zhang N, Han F, Liang R, Qian Y. et al. Integrating tumor and nodal imaging characteristics at baseline and mid-treatment computed tomography scans to predict distant metastasis in oropharyngeal cancer treated with concurrent chemoradiotherapy. Int J Radiat Oncol Biol Phys. 2019;104:942-52
24. Wu J, Li X, Teng X, Rubin DL, Napel S, Daniel BL. et al. Magnetic resonance imaging and molecular features associated with tumor-infiltrating lymphocytes in breast cancer. Breast Cancer Res. 2018;20:101
25. Kang SR, Song HC, Byun BH, Oh JR, Kim HS, Hong SP. et al. Intratumoral metabolic heterogeneity for prediction of disease progression after concurrent chemoradiotherapy in patients with inoperable stage III non-small-cell lung cancer. Nucl Med Mol Imaging. 2014;48:16-25
26. Huang W, Liu B, Fan M, Zhou T, Fu Z, Zhang Z. et al. The early predictive value of a decrease of metabolic tumor volume in repeated (18)F-FDG PET/CT for recurrence of locally advanced non-small cell lung cancer with concurrent radiochemotherapy. Eur J Radiol. 2015;84:482-8
27. Krarup MMK, Nygard L, Vogelius IR, Andersen FL, Cook G, Goh V. et al. Heterogeneity in tumours: Validating the use of radiomic features on (18)F-FDG PET/CT scans of lung cancer patients as a prognostic tool. Radiother Oncol. 2019;144:72-8
28. Coroller TP, Agrawal V, Huynh E, Narayan V, Lee SW, Mak RH. et al. Radiomic-based pathological response prediction from primary tumors and lymph nodes in NSCLC. J Thorac Oncol. 2017;12:467-76
29. Dehing-Oberije C, De Ruysscher D, van der Weide H, Hochstenbag M, Bootsma G, Geraedts W. et al. Tumor volume combined with number of positive lymph node stations is a more important prognostic factor than TNM stage for survival of non-small-cell lung cancer patients treated with (chemo)radiotherapy. Int J Radiat Oncol Biol Phys. 2008;70:1039-44
30. Fried DV, Mawlawi O, Zhang L, Fave X, Zhou S, Ibbott G. et al. Stage III non-small cell lung cancer: prognostic value of FDG PET quantitative imaging features combined with clinical prognostic factors. Radiology. 2016;278:214-22
31. Basaki K, Abe Y, Aoki M, Kondo H, Hatayama Y, Nakaji S. Prognostic factors for survival in stage III non-small-cell lung cancer treated with definitive radiation therapy: impact of tumor volume. Int J Radiat Oncol Biol Phys. 2006;64:449-54
32. Ohri N, Duan F, Snyder BS, Wei B, Machtay M, Alavi A. et al. Pretreatment 18F-FDG PET textural features in locally advanced non-small cell lung cancer: secondary analysis of ACRIN 6668/RTOG 0235. J Nucl Med. 2016;57:842-8
33. Salavati A, Duan F, Snyder BS, Wei B, Houshmand S, Khiewvan B. et al. Optimal FDG PET/CT volumetric parameters for risk stratification in patients with locally advanced non-small cell lung cancer: results from the ACRIN 6668/RTOG 0235 trial. Eur J Nucl Med Mol Imaging. 2017;44:1969-83
34. Cook GJ, Yip C, Siddique M, Goh V, Chicklore S, Roy A. et al. Are pretreatment 18F-FDG PET tumor textural features in non-small cell lung cancer associated with response and survival after chemoradiotherapy? J Nucl Med. 2013;54:19-26
35. Ahn HK, Lee H, Kim SG, Hyun SH. Pre-treatment (18)F-FDG PET-based radiomics predict survival in resected non-small cell lung cancer. Clin Radiol. 2019;74:467-73
36. Dissaux G, Visvikis D, Da-Ano R, Pradier O, Chajon E, Barillot I. et al. Pre-treatment (18)F-FDG PET/CT radiomics predict local recurrence in patients treated with stereotactic radiotherapy for early-stage non-small cell lung cancer: a multicentric study. J Nucl Med. 2020;61:814-20
37. Mu W, Tunali I, Gray JE, Qi J, Schabath MB, Gillies RJ. Radiomics of (18)F-FDG PET/CT images predicts clinical benefit of advanced NSCLC patients to checkpoint blockade immunotherapy. Eur J Nucl Med Mol Imaging. 2020 47;1168-82
38. Yossi S, Krhili S, Muratet JP, Septans AL, Campion L, Denis F. Early assessment of metabolic response by 18F-FDG PET during concomitant radiochemotherapy of non-small cell lung carcinoma is associated with survival: a retrospective single-center study. Clin Nucl Med. 2015;40:e215-21
39. Dong X, Sun X, Sun L, Maxim PG, Xing L, Huang Y. et al. Early change in metabolic tumor heterogeneity during chemoradiotherapy and its prognostic value for patients with locally advanced non-small cell lung cancer. PLoS One. 2016;11:e0157836
40. Steinfort DP, Siva S, Leong TL, Rose M, Herath D, Antippa P. et al. Systematic endobronchial ultrasound-guided mediastinal staging versus positron emission tomography for comprehensive mediastinal staging in NSCLC before radical radiotherapy of non-small cell lung cancer: a pilot study. Medicine. 2016;95:e2488
41. Wu J, Tha KK, Xing L, Li R. Radiomics and radiogenomics for precision radiotherapy. J Radiat Res. 2018;59:i25-i31
42. Herbst RS, Morgensztern D, Boshoff C. The biology and management of non-small cell lung cancer. Nature. 2018;553:446-54
43. Skoulidis F, Heymach JV. Co-occurring genomic alterations in non-small-cell lung cancer biology and therapy. Nat Rev Cancer. 2019;19:495-509
Author contact
![]() Corresponding author: Jia Wu, Assistant Professor, Imaging Physics, Thoracic/Head & Neck Medical Oncology (joint appointment), MD Anderson Cancer Center, 1400 Pressler St., Unit 1472, Houston, Texas 77030. Tel: (713) 563-2719; E-mail: JWu11org
Corresponding author: Jia Wu, Assistant Professor, Imaging Physics, Thoracic/Head & Neck Medical Oncology (joint appointment), MD Anderson Cancer Center, 1400 Pressler St., Unit 1472, Houston, Texas 77030. Tel: (713) 563-2719; E-mail: JWu11org