Impact Factor
- Issue 13; 2026
- Issue 12; 2026
- Issue 11; 2026
- Issue 10; 2026
- Issue 9; 2026
- Volume 16; 2026
- Advance Articles
- Past Issues
- Cover Images
- Cover Suggestion
- Index & Coverage
- Special Issues
Introduction
Experimental Section
Results and Discussion
Conclusion
Supplementary Material
Acknowledgements
References
International Journal of Biological Sciences
International Journal of Medical Sciences
 Global reach, higher impact

Theranostics 2019; 9(14):3992-4005. doi:10.7150/thno.32715 This issue Cite
Research Paper
Rod-shape MSN@MoS2 Nanoplatform for FL/MSOT/CT Imaging-Guided Photothermal and Photodynamic Therapy
Lifang Yang, Jinping Wang, Shan Yang, Qianglan Lu, Peishan Li, Nan Li ![]()
Tianjin Key Laboratory of Drug Delivery & High-Efficiency, School of Pharmaceutical Science and Technology, Tianjin University, 300072, Tianjin, PR China
Received 2019-1-1; Accepted 2019-4-9; Published 2019-5-31
Abstract

Rod-shape nanoplatform have received tremendous attention owing to their enhanced ability for cell internalization and high capacity for drug loading. MoS2, widely used in electronic devices, electrocatalysis, sensor and energy-storage, has been studied as photothermal agents over the years. However, the efficacy of rod-shape MoS2 based photothermal agents for photothermal therapy has not been studied before. Here, a near-infrared (NIR) light-absorbing MoS2 nanosheets coated mesoporous silica nanorods with human serum albumin (HSA) modifying and Ce6 loading (MSNR@MoS2-HSA/Ce6) were constructed for combined photothermal and photodynamic therapy.
Methods: The near-infrared (NIR) light was used to trigger the synergistic anti-tumor therapy. In addition, breast cancer cell line was applied to evaluate the in vitro anti-tumor activity. The multi-modal imaging capacity and tumor-killing efficiency of the designed nanocomposites in vivo was also demonstrated with the 4T1 tumor-bearing mouse model.
Results: These nanocomposites could not only perform NIR light triggered photodynamic therapy (PDT) and photothermal therapy (PTT), but also achieve in vivo fluorescence (FL) /multispectral optical tomography (MSOT)/X-ray computed tomography (CT) triple-model bioimaging. What's more, the rod-shape nanoplatform could be endowed with better anti-tumor ability based on the EPR effect and HSA-mediated active tumor targeting. At the same time, the hyperthermia generated by MoS2 could synergistically improve the PDT effect with the acceleration of the blood flow, leading to the increase of the oxygen level in tumor tissue.
Conclusion: MSNR@MoS2-HSA/Ce6 proves to be a promising multi-functional nanoplatform for effective treatment of tumor.
Keywords: Rod-shape, MoS2, Mesoporous silica nanorod, MSOT imaging, Combined anti-tumor therapy
Introduction
Over the years, the application of integrating therapeutic and imaging constituents in one platform has been attached great importance for precision cancer therapy [1-4]. However, the poor biocompatibility, low efficacy of drug loading and cellular uptake of some nanocomposites limit their bioapplications [5-6]. Recently, mesoporous silica nanoparticles (MSNs) proved to be a promising nanoplatform due to the adjustable sizes, large surface area, great modification capability, good biocompatibility, etc [7-8]. MSNs with different morphologies, including particles, hollow structure, yolk-shell, films and rods have been reported for various bioapplications, such as drug delivery and diagnostic imaging [9]. Noticeably, it has been proved that suitable aspect ratio and size of nanoparticles could increase the cellular uptake by the enhanced permeability and retention (EPR) effect [10-13]. Therefore, MSNRs could integrate different nanoagents in one nanoplatform for better synergetic diagnosis and therapy compared to other shapes of nanocomposites for the enhanced cellular uptake. In addition, MSNRs have been studied as template to synthesize rod-shape PTT agents, such as gold nanoshell-coated MSNRs and Au nanorods-capped MSNRs [6,14-16]. In our previous work, the MSNR was synthesized by adjusting the feeding amount of Ce6, which fixed the drug loading amount to a degree. Therefore, the MSNR used in this work was prepared directly.
Graphene-like 2D nanomaterials molybdenum disulfide (MoS2) nanomaterials with unique electronic, optical, physicochemical properties have been demonstrated to be promising photothermal agents for photothermal therapy (PTT) because of the low cost, good biocompatibility, and efficient photothermal energy conversion [17-19]. Besides, MoS2 nanosheets show great potential in MSOT imaging and CT imaging owing to its strong absorbance in the NIR region and high X-ray attenuation coefficient of Mo, respectively [20]. With all these unique properties, various morphologies of MoS2 based nanocarries have been synthesized for cancer treatment, such as MoS2 nanodots, MoS2 nanoflowers, hollow MoSx nanospheres and so on [21-24]. To our best known, the anti-tumor capacity of this kind of rod-shape MoS2-based nanomaterials have not been explored yet.
Hence, we first constructed MoS2 nanosheets coated mesoporous silica nanorods (MSNR@MoS2) via a one-step hydrothermal method, using silica nanorods as template [25]. The MSNR@MoS2 nanocomposites could not only combine the MOST imaging and CT imaging with photothermal therapy (PTT), but also achieve tumor targeting and cellular uptake based on the rod shape of the nanocomposites, thus enhancing the “specificity” of photothermal therapy in vivo. However, only the passive targeting and mono PTT effect possess limited therapeutic efficacy to destroy the tumor tissue [26].
To further improve the therapeutic efficacy of the MSNR@MoS2 nanocomposites, Human serum albumin (HSA), an endogenous protein, was utilized as active tumor-targeting agents to promote the bioavailability and reduce toxicity [27]. It have been reported that HSA could increase the intratumoral accumulation by utilizing albumin receptor (gp60)-mediated transcytosis and then target the albumin-binding protein SPARC overexpressed in most tumor cells [28-29]. In addition, there exist many reactive amino-groups in HSA for further modification [30]. Next, the hydrophobic photosensitizer (PS), chlorin e6 (Ce6) with fluorescence ability was chemically conjugated to MSNR@MoS2-HSA (MSNR@MoS2-HSA/Ce6) to endow the nanocomposites with the ability to perform PTT/PDT with the NIR irradiation [31-33]. At the same time, this strategy could quench the activity of the Ce6 to a degree during the in vivo circulation, thus reducing the phototoxicity [34-35].
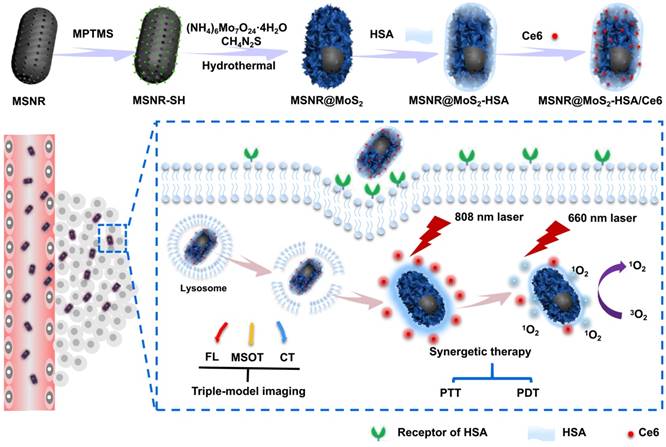
Herein, we utilize MSNR@MoS2-HSA/Ce6 nanocomposites to perform FL/MSOT/CT multi-modal imaging and NIR laser triggered PTT/PDT synergistic therapy in 3 major steps (Scheme 1): (1) Under the irradiation of 808 nm NIR light, a local hyperpyrexia generated by MoS2 can perform photothermal effect, resulting in direct destruction of tumor tissue. (2) The hyperthermia could accelerate the release of Ce6 from MSNR@MoS2-HSA/Ce6, thus dequenching Ce6 and promptly activating the subsequent PDT effect. (3) Photodynamic reaction of Ce6 was triggered to produce reactive oxygen species (ROS) upon 660 nm NIR laser irradiation to perform PDT treatment. These smart MSNR@MoS2-HSA/Ce6 nanocomposites possess several unique features: (1) Superior tumor cellular uptake: rod-shape nanocarrier modified with active targeting agents, promoting cellular uptake via EPR effect and gp60/SPARC receptor-mediated transcytosis. (2) Stimuli response: local hyperthermia generation and enhanced Ce6 release under the NIR laser irradiation. (3) Imaging-guided therapy: MSNR@MoS2-HSA/Ce6 could efficiently integrate FL/MSOT/CT imaging mode and PTT/PDT treatment. Therefore, the design of MSNR@MoS2-HSA/Ce6 was promising to effectively inhibit the tumor growth under the NIR irradiation.
Schematic illustration of MSNR@MoS2-HSA/Ce6 nanocomposites for multi-imaging guided PTT and PDT synergetic treatment upon NIR laser irradiation.
Experimental Section
Materials
Ethanol (99.5%), Cetyltrimethyl ammonium bromide (CTAB), Tetraethyl orthosilicate (TEOS, 28%) were obtained from Tianjin Yuanli Chemical Co. Ltd. (China). Aqueous ammonia (NH3·H2O, 25%), (NH4)6Mo7O24·4H2O and thiourea (CN2H4S) were obtained from Aladdin Reagent (Shanghai, China). 3-mercaptopropyltrimethoxysilane (MPTMS), Human serum albumin (HSA), 3- (4, 5-dimethyl-2-thiazolyl)-2,5-diphenyl-2-Htetrazolium bromide (MTT), were purchased from Sigma-Aldrich (USA). Chlorine e6 (Ce6) was obtained from J&K Scientific Ltd. All chemical reagents were of analytical grade and used as received without further purification.
Synthesis of MSNR@MoS2-HSA/Ce6
The synthesis procedures are shown in Scheme 1. Firstly, MSNRs were synthesized as previously reported [16]. 0.151 g of CTAB was dispersed in 35 mL of deionized water and then NH3·H2O (28%~30%) and TEOS were added in succession, stirring at 80 °C for 5 h. The obtained product was dispersed in concentrated HCl/MeOH (1:10, v/v) and refluxed at 60 °C for 24 h to remove CTAB. The resultant MSNRs were washed with ethanol for three times. Secondly, a amount of obtained MSNRs were dispersed into 50 mL of ethanol, stirring for 10 min. After MPTMS was added, the solution was kept stirring at 70 ℃ for 2 h. The MSNR-SH particles were then collected by centrifuging and washed with ethanol twice. Thirdly, to prepare the MSNR@MoS2 nanoparticles, 0.7 g of (NH4)6Mo7O24·4H2O and 1.52 g of thiourea were dissolved in 20 mL of deionized water and sonicated with MSNR-SH prepared in the last step. Then the solution was transferred into a 100 mL Teflon-lined stainless steel autoclave and kept at 160 °C for 8 h. The final product (MSNR@MoS2) were then collected and washed three times with deionized water. Fourthly, 40 mg of LA was dispersed into 2 mL of MSNR@MoS2 and stirred overnight. After washing with deionized water, 2 mg of EDC and 40 mg of HSA was added into the LA-coated MSNR@MoS2 nanosystem obtained above. The solution was stirred for 2 h, followed by adding another 2 mg of EDC to stir for another 6 h. The MSNR@MoS2-HSA particles were obtained by centrifuging and washed three times with deionized water. Finally, 1 mg of Ce6 was activated by EDC and NHS in a predetermined amount of DMSO. Then 5 mL of MSNR@MoS2-HSA nanoparticles solution was added with different weight ratios and reacted at room temperature overnight. The mixture was treated with ultrafiltration to remove excessive free Ce6 at 4000 rpm for 10 min. The MSNR@MoS2-HSA/Ce6 particles were then collected by centrifugation and washed with water twice. Then brown-green powder was acquired after lyophilization.
Characterization of MSNR@MoS2-HSA/Ce6
TEM images were collected using the JEM-100 CX (Jeol Ltd., Tokyo, Japan) instrument. The XPS measurements were obtained by a PHI-5000 CESCA system (PerkinElmer) with radiation from an Al Kα (1486.6 eV) X-ray source. Element mapping images results were collected by a JEM-2100F (Jeol Ltd., Tokyo, Japan) transmission electron microscope. IR spectra were obtained by a IR spectrophotometer (TENSOR 27, Bruker, German). The CD spectra were obtained by a spectropolarimeter system (BioLogic, MOS-450).
In vitro Ce6 Release test
To investigate the effect of acidity and laser irradiation on Ce6 release, the in vitro Ce6 release study was performed in PBS with different pH values (pH 5.0 and pH 7.4) using a dialysis method. Four groups of MSNR@MoS2-HSA/Ce6 (1 mL) were respectively placed in dialysis bags (MWCO = 14 kDa), followed by immersing in 50 mL of the release medium. Two groups (pH 5.0 and pH 7.4) were exposed to the NIR light irradiation (808 nm, 5 min) at 0.5 h and 2 h, respectively. Periodically, samples (0.5 mL) were collected from the four groups to measure the amount of released Ce6 by UV-vis spectrometer, respectively.
Singlet oxygen generation detection
1,3-diphenyl isobenzofuran (DPBF) was selected to quantitatively measure the amount of 1O2 in vitro. DPBF, MSNR@MoS2-HSA + DPBF, free Ce6 + DPBF were used as control groups. 20 μL DPBF (2.5 mg/mL, acetonitrile) was added to MSNR@MoS2-HSA/Ce6 (2 mg/mL, 3 mL) under dark condition. When irradiated by the 660 nm (1.0 W/cm2) NIR light, the absorption at 410 nm wavelength of the mixture was recorded by a Ultraviolet spectrophotometer (Agilent, Santa Clara, USA) at every specific time.
Laser-responsive properties in vitro
A NIR light source (808 nm, LASERGLOW Technologies, China) was applied during the evaluation of the laser-responsive properties of the PBS, MSNR, MSNR@MoS2 and MSNR@MoS2-HSA. In addition, several concentrations of MSNR@MoS2-HSA aqueous dispersion were further exposed to NIR (808 nm, 1.5 W/cm2) irradiation for 5 min. Meanwhile, a digital thermometer was used to measure the temperatures of the formulation at different time points.
In vitro photo-cytotoxicity
MTT assay was applied to test the cytotoxicity of MSNR@MoS2-HSA/Ce6 under different concentrations using 4T1 cells (5 ×10³/well). When the adherent cells accounted for 80% of the total cells seeded in 96-wells plates, the culture medium was replaced with MSNR@MoS2-HSA, MSNR@MoS2-HSA/Ce6 or free Ce6 diluted with culture medium to pre-designed concentrations. And 4T1 cells were incubated with different formulations of different concentrations diluted in advance for 24 h to evaluate the dark toxicity. For the groups with different treatment, the 4T1 cells were irradiated by 808 nm (1.5 W/cm2) or 660 nm (1.0 W/cm2) laser for 5 min at 6 h. Then the cells were incubated with MTT dispersion (5 mg/mL, 20 μL) for 4 h. Afterwards, DMSO was added before the absorbance at 490 nm was measured by an ELISA instrument.
Calcein-AM/PI staining assays were performed to monitor the therapeutic efficiency in vitro. The 4T1 cells seeded into culture dishes (5 × 10⁵/plate) were incubated with four different formulations (PBS, free Ce6, MSNR@MoS2-HSA and MSNR@MoS2-HSA/Ce6) for 6 h. Then the dishes were irradiated by 808 nm (1.5 W/cm2) or 660 nm (1.0 W/cm2) laser for 5 min before incubating another 18 h. Afterwards, a prepared solution which contained calcein-AM (2 μM) and PI (4.5 μM) were added, followed by the incubation in incubator for 15 min. Then the dishes were observed using the CLSM to monitor the proportion of live/dead cells.
Cellular uptake and intracellular ROS detection
To investigate the cellular uptake of our final formulation, different formulations (PBS, free Ce6, MSNR@MoS2-HSA, and MSNR@MoS2-HSA/Ce6) were diluted to a concentration (20 μg/mL of Ce6) with serum-free medium. The cells seeded in CLSM culture dishes were incubated for 24 h before the pre-configured formulations were added. For free HSA competition experiments, HSA (1 mM) was added before the pre-incubation described above. After incubated for another 6 h, the cells were fixed by 4% paraformaldehyde, followed by the staining with DAPI (10 mg/mL). Afterwards, the cells were observed using CLSM to monitor the cellular uptake.
DCFH-DA was employed to monitor the ROS generation in cells. The cells seeded in the culture dishes were dealt in the same way as calcein-AM/PI staining assays. Then the ROS-sensitive probe was added and incubated for 20 min. Finally, each plate were washed three times with DMEM medium and detected by CLSM.
Hemolysis assay
Blood sample (1 mL) was acquired from volunteers. The RBCs were separated by centrifugation at 2000 rpm for 10 min and washed several times. Then PBS (10 mL) was added to dilute the RBCs to a degree. Afterwards, 400 μL of the cells suspension was added to 2 mL of PBS (negative control), deionized water (positive control), and MSNR@MoS2-HSA/Ce6 of different concentrations, respectively. After being incubated for 2 h at 37 °C, the supernatant were separated by centrifugation at 12000 rpm for 10 min, followed by the measuring of absorbance at 570 nm using UV-vis spectrometer. The percentage hemolysis was calculated as followed:
hemolysis ratio(%) = (Asample - Anegative) ∕ (Apositive - Anegative) × 100 %
Animal model
All animal experiments were in accordance with the protocols approved by Tianjin University. The mice were injected with 4T1 cells. When the tumor volume reached ~100 mm3, the mice were randomly divided into 4 groups (n=5), namely, (1) saline with exposure to the 808 and 660 nm NIR light; (2) free Ce6 with irradiation of the 660 nm NIR light; (3) MSNR@MoS2-HSA with irradiation of 808 nm NIR light; (4) MSNR@MoS2-HSA/Ce6 with exposure to the 808 and 660 nm NIR light. Note that, the NIR light was given 12 h post injection.
In vivo infrared thermal imaging
After the intravenous injection of 200 μL of different formulations (PBS, MSNR@MoS2-HSA, and MSNR@MoS2-HSA/Ce6), the 808 nm NIR light (1.5 W/cm2) was given for 5 min at 12 h. In the subsequent process, an IR camera (TiS55, Fluke, USA) was used to monitor the central temperature of the tumor at different time point.
In vivo & ex vivo fluorescence and MSOT/CT imaging
The fluorescence imaging study was obtained on imaging system (Perkin-Elmer). The mice were i.v. injected with free Ce6 and MSNR@MoS2-HSA/Ce6 (200 μL, 2 mg/mL), respectively. The fluorescence images were obtained at varied time points within 24 h. Subsequently, major organs and tumor tissues were excised before ex vivo imaging was conducted.
The final formulation, MSNR@MoS2-HSA/Ce6 (200 μL, 20 mg/kg) was i.v. injected into mice in MSOT imaging study. The MSOT images were obtained at various points in time. It could provide sufficient resolution of 50 μm, suitable for the visualization of nanoparticle distribution, heterogeneous vasculature and other information within the tumors in small-animal models.
The in vivo CT imaging was completed on a micro CT scanner for imaging (Quantum FX, PerkinElmer, Hopkinton, MA, USA). The MSNR@MoS2-HSA/Ce6 nanoparticles were diluted to a series of pre-designed concentrations for in vitro CT imaging. 4T1 tumor-bearing mice were administered by MSNR@MoS2-HSA/Ce6 (50 μL, 10 mg/mL) via intratumoral injection. What's more, the CT images were acquired before and after the injection, respectively.
In Vivo Blood Circulation, Biodistribution
4T1 tumor-bearing mice were divided into two groups and intravenously injected with free Ce6 and MSNR@MoS2-HSA/Ce6 (2 mg/mL, 200 µL), respectively. Afterwards, blood samples (10 µL) in MSNR@MoS2-HSA/Ce6 treated group were taken out from the tail of anesthetized mice at pre-designed time points and weighted, followed by digesting to determine the concentration of Mo by ICP-AES. Meantime, the blood samples (10 µL) in free Ce6 treated group were also collected in the same way and the concentration of Ce6 was calculated from calibration curves obtained from fluorescence measurements of a series of Ce6 with known concentrations.
For biodistribution evaluation, the mice were sacrificed at pre-designed time point after intravenous injection of MSNR@MoS2 and MSNR@MoS2-HSA/Ce6 nanoparticles, respectively. The major organs and tumor were collected and weighted. In addition, a portion of samples were weighted, digested and analysed for the content of Si and Mo in different samples using ICP-AES.
Therapeutic efficacy evaluation
The tumor-bearing mice were treated with the pre-designed treatment regimens mentioned above (Animal model section). And in the course of treatment, the tumor size and body weight was measured every three days. As for the tumor size, it could be obtained using the following formula: V =a*b2/2 (a: width, b: length). In addition, the survival rate of mice in different groups were obtained when the treatment was completed. What's more, the mice with different treatment were sacrificed to collect the tumor as well as major organs (heart, liver, spleen, lungs, and kidneys). These collected tissues were fixed in 4% formalin for hematoxylin and eosin (H&E) staining experiment to evaluate the therapeutic efficacy.
Results and Discussion
Synthesis and Characterization of MSNR@MoS2-HSA/Ce6
In this work, we constructed MoS2 nanosheets coated mesoporous silica nanorods (MSNR@MoS2) using mesoporous silica nanorods as templates. The preparation process of MSNR@MoS2-HSA/Ce6 is shown in Scheme 1, The mesoporous silica nanorods were synthesized via the hydrolysis of TEOS, catalyzed by NH3·H2O. Next, MPTMS was used to introduce thiol groups (-SH) to the surface of MSNR to enhance the growing of MoS2 nanosheets. MSNR@MoS2 core-shell nanocomposites were prepared by in-situ growth of MoS2 nanosheets via a hydrothermal method. Lipoic acid (LA) acted as linking agents to assist the covalently conjugation of HSA to MSNR@MoS2. Finally, Ce6 was loaded on the MSNR@MoS2-HSA via amide bonds in the presence of activator EDC and NHS.
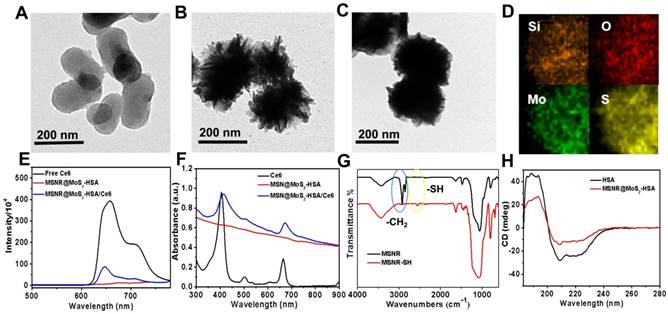
The TEM image in Figure 1A showed that mesoporous silica nanorods (MSNR) exhibited an uniform size around 200 nm. And obvious obscure edges and sharp edges could be observed on the smooth surface of MSNR, (Figure 1B), which was consistent with the SEM image (Figure S1). The results presented above both revealed the successful coating of MoS2 nanosheets onto MSNR. In addition, the TEM image in Figure 1C showed that the edges turned smoother, indicating successful preparation of MSNR@MoS2-HSA. The elemental composition was further confirmed in elemental mapping images (Figure 1D) of MSNR@MoS2, containing Si, O, S and Mo elements, which was consistent with the TEM results. To demonstrate that Ce6 has been covalently attached to the MSNR@MoS2-HSA, the UV-vis spectra and fluorescence spectra of Ce6, MSNR@MoS2-HSA, MSNR@MoS2-HSA/Ce6 were measured, respectively. It was found that Ce6 possessed strong fluorescence ability, while MSNR@MoS2-HSA/Ce6 exhibited an obvious decrease of the fluorescence intensity, suggesting the successful loading of Ce6 (Figure 1E). There existed quenching effect between the Ce6 and MSNR@MoS2-HSA. Besides, there was no characteristic peak of MSNR@MoS2-HSA at 404 nm compared with free Ce6. On the contrary, the characteristic peaks of Ce6 appeared on the UV-vis spectra of MSNR@MoS2-HSA/Ce6, verifying the successful loading of Ce6 on the nanocarrier (Figure 1F). Furthermore, the size distribution profile of MSNR@MoS2-HSA/Ce6 was determined by the dynamic light scattering (DLS). As shown in Figure S2A, a bit larger size of was observed compared to the TEM image result, which may be attributed to the existence of hydration shell. The dispersion stability of MSNR@MoS2-HSA/Ce6 was further investigated. It was found that MSNR@MoS2-HSA/Ce6 exhibited good physiological stability in varied solutions (water, saline and cell culture medium), which was the precondition to the further biomedical application (Figure S2B-C). The IR spectra of the MSNR were obtained before and after extraction of CTAB to detect the extent of the removal of CTAB. As shown in Figure 1G, the strong infrared absorption peak at 2922 cm-1 and 2850 cm-1 of CH stretching vibrations exhibited a sharp decrease after the CTAB extraction, indicating the effectual remove of CTAB. Meanwhile, a weak peak was observed at the wavelength of 2550 cm-1, which belonged to the -SH stretching vibrations, suggesting the successful modification with MPTMS. And the absorption band of both samples at around 1075 cm-1 was belonged to the typical stretching vibration peak of Si-O-Si. In addition, circular dichroism (CD) characterizations were used to further demonstrate the coating of HSA. As shown in Figure 1H, compared to the CD spectra of pure HSA, the peak at 210 nm of MSNR@MoS2-HSA exhibited a slight blue shift and apparent disappearance of the peak at 221 nm, indicating an increase in random coil structures [36].
TEM images of (A) mesoporous silica nanorods, (B) MSNR@MoS2. (C) MSNR@MoS2-HSA. (D) HRTEM image of MSNR@MoS2. The element maps shown the distribution of Si (orange), O (red), Mo (green) and S (yellow). (E) Fluorescence spectra of aqueous solution of free Ce6, MSNR@MoS2-HSA and MSNR@MoS2-HSA/Ce6. (F) UV-vis spectra of Ce6, MSNR@MoS2-HSA, MSNR@MoS2-HSA/Ce6. (G) IR spectra of MSNR and MSNR-SH. (H) CD spectra of pure HSA and MSNR@MoS2-HSA.
To investigate the constitution of the MSNR@MoS2-HSA/Ce6 nanocomposites, the Mo concentrations and HSA content were measured by ICP-AES and Bradford protein assay, respectively. And the MoS2: SiO2 (w/w) was 1 : 0.4 calculated by converting the ICP results to particle concentrations. In addition, the HSA content was determined with the corresponding standard calibration curve of Coomassie Brilliant Blue G-250 (Figure S3). Finally, it was estimated that the mass ratio of MoS2 : SiO2 : HSA : Ce6 was 1 : 0.4 : 0.24 : 0. 17 (w/w/w/w/w) in the final formulation.
To further examine the chemical composition of MSNR@MoS2, X-ray photoelectron spectra (XPS) analysis was employed in this work. As evident in Figure 2A, two peaks centered at 228.59 eV and 232.64 eV could be assigned to the bonding energies of Mo3d5/2 and Mo3d3/2 of Mo(IV), respectively. While the two main peaks at 231.6 eV and 235.4 eV were corresponded to the bonding energies of Mo3d5/2 and Mo3d3/2 of Mo(VI), implying the existence of MoO3 or MoO42-, which might be inherited from the molybdate precursor because of the insufficient reaction process induced by the low synthesis temperature. And the component at 226.0 eV was corresponded to S 2s of MoS2. Moreover, in XPS S 2p core-level spectrum (Figure 2B), the main peaks located at 161.3 eV and 163.6 eV were corresponded to the S 2p3/2 and S 2p1/2 of MoS2. In addition, the binding energy at 162.43 suggested the existence of terminal S2- for the MoS2 site. What's more, the high-energy peak at 168.2 eV could be attributed to S4+ species in sulfate groups (SO32-), which might also result from the oxidation of sulfur during the hydrothermal process. Therefore, the composition of this nanocomposites could be assigned as MoS2 [25,37].
High-resolution of (A) Mo 3d and (B)S 2p. (C) Ce6 loading weight ratios obtained at varied feeding concentrations. (D) UV-vis spectra of MSNR@MoS2-HSA at various feeding Ce6 concentrations. (E) Singlet oxygen generation capacity of different formulations when exposed to 660 nm laser. (F) Temperature change curves of different MSNR@MoS2-HSA concentrations over 5 min irradiation of NIR laser (808 nm, 1.5 W/cm2). (G) Photothermal effect of the irradiation of the aqueous solution of MSNR@MoS2-HSA under NIR irradiation (808 nm, 1.5 W/cm2), in which the irradiation lasted for 660 s and then the laser was shut off. (H) Linear time data versus -ln(θ) obtained from the cooling period of (G). The photothermal conversion efficiency is calculated to be 23.59%. (I) Thermographic images of MSNR@MoS2-HSA at different concentrations under 808 nm laser (1.5 W/cm2, 5 min).
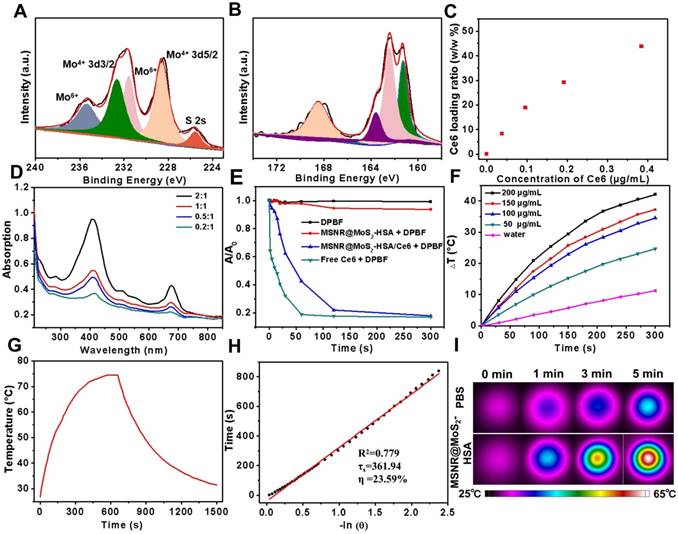
The drug loading capacity of MSNR@MoS2-HSA was examined by adjusting the weight ratios (Ce6:MSNR@MoS2-HSA = 0.2:1, 0.5:1, 1:1, and 2:1) during the Ce6 loading step. Then the UV-vis spectrum was obtained after the removal of excess free Ce6 (Figure 2D). Meanwhile, the absorbance of supernatant containing removed Ce6 after centrifugal filtration was measured as well, which was converted to calculate the loading ratio of Ce6 (Figure 2C). It was found that the loading capacities of Ce6 on MSNR@MoS2-HSA increased as a function of drug amounts. The highest drug-loading ratio was determined to be ∼45% according to the standard curve of Ce6 (Figure S4). The drug release behavior was also studied in 5% DMSO/PBS. As shown in the Figure S5, when the pH value decreased to 5.0, the released Ce6 from MSNR@MoS2-HSA/Ce6 slightly increased. And higher released rate of Ce6 was also observed after laser irradiation at the same pH value.
The ability to produce ROS is an important index to measure the potency of killing tumor cells. Therefore, DPBF was used as a sensitive probe of ROS to detect 1O2 amount generated by MSNR@MoS2-HSA/Ce6 under 660 nm laser (1.0 W/cm2) irradiation. As shown in the UV-vis spectra (Figure 2E), both MSNR@MoS2-HSA/Ce6 and free Ce6 exhibited an obvious decrease in DPBF absorbance at about 410 nm when exposed to 660 nm laser for 5 min. Moreover, free Ce6 showed sharper decreasing rate compared to MSNR@MoS2-HSA/Ce6 within 2 min due to the quenching of Ce6 by MSNR@MoS2-HSA. However, the DPBF absorbance remained stable in another two formulations (MSNR@MoS2-HSA, DPBF), suggesting the excellent ROS generation capacity of MSNR@MoS2-HSA/Ce6.
In vitro photothermal effect
The photothermal properties of different formulations were investigated, including PBS, MSNR, MSNR@MoS2, MSNR@MoS2-HSA. As depicted in Figure S6A, MSNR@MoS2 and MSNR@MoS2-HSA nanocomposites both showed remarkable temperature increase after irradiation. In contrast, there was no significant rise in the temperature of PBS and MSNR, with only a temperature change of around 10 °C. In addition, temperature change within 5 min of a series of MSNR@MoS2-HSA solutions (0, 50, 100, 150, and 200 μg/mL) under the 808 nm NIR laser irradiation (1.5 W/cm2) was further recorded (Figure 2F). The results exhibited a concentration and time dependent mode. What's more, the temperature of MSNR@MoS2-HSA solution (200 μg/mL) showed a dramatic increase by nearly 40°C, which was sufficient to kill cancer cells. In addition, the temperature changes of the aqueous solutions of MSNR@MoS2-HSA (200 μg/mL) were explored as a function of time under 808 nm (1.5W/cm2) laser irradiation (Figure 2G-H). The results indicated that the photothermal conversion efficiency of MSNR@MoS2-HSA could reach 23.59%, suggesting great photothermal conversion efficiency. And the photothermal conversion and photostability of MSNR@MoS2-HSA was further explored. After exposed to the 808 nm laser (1.5 W/cm2) irradiation within 5 min, the solution was cooling to room temperature naturally, which was replicated four times. As shown in Figure S6B, MSNR@MoS2-HSA possessed good properties, which was precondition in the long-term clinical treatment. Besides, real-time thermal images of PBS and MSNR@MoS2-HSA (200 μg/mL) was recorded by an infrared thermal camera at different time points (Figure 2I). The thermographic images indicated good photothermal conversion efficiency of MSNR@MoS2-HSA, which were in accordance with the results displayed in Figure 2F.
In vitro cytotoxicity, cellular uptake studies and intracellular ROS detection
Before in vivo application, the standard methyl thiazolyl tetrazolium (MTT) assay was carried out to evaluate the cytotoxicity of different formulations, including free Ce6, MSNR@MoS2-HSA and MSNR@MoS2-HSA/Ce6. As displayed in Figure 3A, the cell viabilities decreased with the increasing concentration of different formulations. However, all remained above 80% after incubation for 24 h, suggesting the low cytotoxicity of the final formulation even at the highest concentration (200 μg/mL). In addition, the hemolysis ratio was < 4% at the maximum experimental concentration (200 μg/mL), indicating that the MSNR@MoS2-HSA/Ce6 were hemocompatible and could be administered intravenous injection for in vivo anti-tumor treatment (Figure S7). The HSA encapsulation might offer the nanoparticles good biocompatibility [38]. To verified the associative effect of PDT/PTT in vitro, the 4T1 cells were incubated with varied concentrations of the above three formulations and received different treatment, followed by the determination of cell viability. As the results shown in Figure 3B, all of the cells with different treatment group possessed concentration-dependent cancer cell killing ability. Notably, the cell viability of MSNR@MoS2-HSA/Ce6 + 808/660 nm treated group at the highest concentration decreased much sharply compared with the other two groups at the same dose. Moreover, calcein-AM/PI fluorescence co-staining was employed to directly differentiate the live (green)/dead (red) cells in Figure 3C. Red fluorescence could be barely observed in the PBS group. In addition, only few cells were killed and exhibited red fluorescence in the single PTT or PDT treated groups. Obviously, the combination therapy group treated with MSNR@MoS2-HSA/Ce6 + 808/660 nm possessed superior antitumor efficacy, indicating the best cellular cytotoxicity compared with any other mono-therapy group.
(A) Cell viability of 4T1 cells incubated with various concentrations of free Ce6, MSNR@MoS2-HSA and MSNR@MoS2-HSA/Ce6 for dark toxicity. (B) Cell viability of 4T1 for different groups after the incubation with varied concentrations of free Ce6 + 660 nm, MSNR@MoS2-HSA +808 nm and MSNR@MoS2-HSA/Ce6 +808/660 nm. (C) Fluorescence images of calcein-AM and PI co-staining cells after different treatments. Scale bar: 100 μm. (D) CLSM images of 4T1 cells after the incubation with different formulations with or without NIR irradiation. Scale bars: 25 μm.
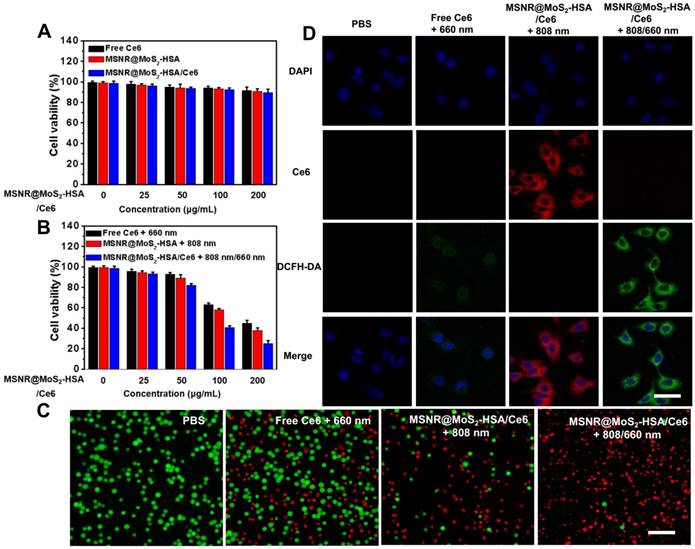
The cellular uptake efficiency and intracellular ROS generation ability of MSNR@MoS2-HSA/Ce6 were both important factors for antitumor evaluation. As displayed in Figure S8, brighter red fluorescence could be observed in the MSNR@MoS2-HSA/Ce6 treated group, demonstrating that more nanoparticles could be taken by cells after 6 h incubation compared with free Ce6 treated group. And much brighter red fluorescence was observed under the 808 nm (1.5 W/cm2) laser irradiation for 5 min (Figure 3D). This phenomenon might be attributed to the PTT effect enhanced Ce6 release [39]. In addition, ROS sensitive probe DCFH-DA was used to evaluate the intracellular ROS generation. As shown in Figure 3D, strong green fluorescence signals could be observed in the MSNR@MoS2-HSA/Ce6 + 808/660 nm treated group, which was much brighter than that in the free Ce6 + 660 nm treated group due to the self-destruction of free Ce6 caused by the aggregates based on hydrophobic π-π interactions in aqueous solution [40-41]. It was noteworthy that red fluorescence of Ce6 significantly decreased, which may result from the photobleaching of the PS [42-43]. All these results proved that MSNR@MoS2-HSA/Ce6 could be internalized by cancer cells without significant cytotoxicity. Therefore it could generate hyperthermia and ROS in the presence of the 808/660 nm NIR laser, thus achieving synergetic therapy in vitro. Additionally, in order to confirm the HSA-mediated active targeting capability of our nanoplatform, MSNR@MoS2-HSA/Ce6 was incubated with free HSA as competitor. As shown in Figure S9, there were decreased endocytosed nanocomposites after incubation with MSNR@MoS2-HSA/Ce6 in the presence of free HSA, indicating the modified HSA could effectively strengthen the active targeting ability of the nanoplatform.
In vivo FL/PA/CT triple-modality imaging
Multimodal imaging that combines different imaging modalities possesses superior ability to detect the location of tumors site [44]. In our work, the MSNR@MoS2-HSA/Ce6 was endowed with FL/MSOT/CT triple-modal imaging. To evaluate the FL imaging ability of loaded Ce6 in MSNR@MoS2-HSA/Ce6, 4T1 tumor-bearing nude mice were treated with free Ce6 and MSNR@MoS2-HSA/Ce6, respectively. Afterwards, the fluorescence signal was recorded at different time points (0, 6, 8, 12, and 24 h) (Figure 4A). At 6 h, the fluorescence signals of Ce6 distributed partly in free Ce6 and MSNR@MoS2-HSA/Ce6 treated mice. As time went by, MSNR@MoS2-HSA/Ce6 gradually accumulated in the tumor site after 8 h and reached a peak at 12 h, indicating the good targeting ability of MSNR@MoS2-HSA/Ce6. However, the fluorescence signals of mice with injection of free Ce6 exhibited much lower fluorescence intensity and faster elimination rate compared to MSNR@MoS2-HSA/Ce6 treated mice. The fluorescence of free Ce6 was almost negligible at 24 h post-injection, while the fluorescence intensity of MSNR@MoS2-HSA/Ce6 was still strong, further confirming the targeting ability of our final formulation. In addition, major organs and tumors were excised at 24 h post-injection for in vitro fluorescence imaging. As shown in Figure 4B, The semi-quantitative biodistribution based on ex vivo imaging of tumors and major organs examined at 24 h post-injection further confirmed the efficient tumor uptake of MSNR@MoS2-HSA/Ce6 because of the EPR effect and active tumor targeting.
(A) Fluorescence images of nude mice at different time points after administration of free Ce6 and MSNR@MoS2-HSA/Ce6; the right panel shows the ex vivo images examined at 24 h. (B) Average fluorescence signals of Ce6 in major organs examined at 24 h. (C) MSOT images of 4T1 tumor-bearing mice after being intravenously injected with MSNR@MoS2-HSA/Ce6. (D) Photoacoustic intensity linearly fit to the concentration of MSNR@MoS2-HSA/Ce6 aqueous solutions; inset: the corresponding PA images. (E) CT images of tumor site before and after intratumor injection with MSNR@MoS2-HSA/Ce6. (F) Corresponding HU value of MSNR@MoS2-HSA/Ce6 nanocomposites in the tumor before injection and 12 h after injection.
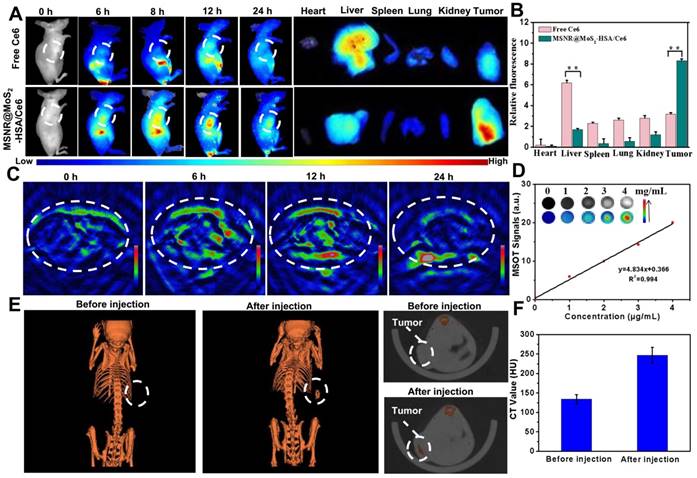
In view of the excellent tumor uptake efficiency of the MSNR@MoS2-HSA/Ce6 displayed in FL imaging results, we assumed that the nanoparticles with strong absorption in the NIR range could act as effective contrast agent for MSOT imaging. For in vivo MSOT imaging, the mice with intravenous injection of MSNR@MoS2-HSA/Ce6 (4 mg/mL, 200 μL) were imaged by a MSOT system at different time points. As shown in Figure 4C, the MSOT signal at tumor site was increased over time and exhibited maximum accumulation at 12 h, proving that MSNR@MoS2-HSA/Ce6 could accumulate in tumor efficiently. For in vitro MOST imaging (Figure 4D), the MSNR@MoS2-HSA/Ce6 induced intense optoacoustic signals followed a concentration-dependent relationship. What's more, the MSOT signal intensity also suggested that the maximal accumulation of MSNR@MoS2-HSA/Ce6 was observed at 12 h post-injection, which was in accord with the FL imaging. Therefore, MSOT imaging could also efficiently monitor the time-dependent distribution and tumor accumulation of MSNR@MoS2-HSA/Ce6.
Utilizing the large attenuation of X-rays by Mo, the potential of the MSNR@MoS2-HSA/Ce6 for CT imaging was also applied here [45]. The in vitro CT imaging ability of MSNR@MoS2-HSA/Ce6 was presented in Figure S10A, the CT signal exhibited a sharp growth with the concentration increased. In addition, the linear relationship between Hounsfield units (HU) values and concentration possesses a large slope of 28.709 (Figure S10B). As shown in Figure 4E, a significant tumor contrast was observed after injection, indicating the outstanding CT imaging ability of MSNR@MoS2-HSA/Ce6. What's more, the HU value, representing the CT contrast effect, increased sharply after injection compared to the value before injection (Figure 4F), which further demonstrated the excellent CT-imaging capability and sufficient tumor accumulation of MSNR@MoS2-HSA/Ce6. These results all demonstrated that MSNR@MoS2-HSA/Ce6 possessed excellent capability to act as multifunctional contrast agents for imaging.
In Vivo Blood Circulation, Biodistribution
As shown in Figure S11, the blood concentration of Ce6 dropped to a fairly low level and remained stable at 12 h post-injection of free Ce6, which showed that the elimination rate of Ce6 was relatively fast. In contrast, the blood circulation half-life of MSNR@MoS2-HSA/Ce6 was about 4.2±0.3 h, which demonstrated a better ability to accumulate at tumor site compared to free Ce6.
What's more, the ICP-AES was also used to measure the Si and Mo levels in major organs and tumor. As shown in Figure S12A, it was found that the efficient accumulation of Mo was observed in MSNR@MoS2-HSA/Ce6 treated group, indicating the effective active tumor targeting. Meantime, high Mo level was detected in reticuloendothelial systems (RES) including liver. The fluorescence quenching/dequenching, saturation and differential decay rates of fluorescence in different organs might be the cause of the discrepancy in Figure 4B and Figure S12A [46-48]. It's was noteworthy that the MSNR@MoS2-HSA/Ce6 administrated group exhibited better accumulation in tumor tissues at both points (12 h, 24 h), which further illustrated the better targeting ability of MSNR@MoS2-HSA/Ce6 compared to MSNR@MoS2.
In vivo anti-tumor efficacy
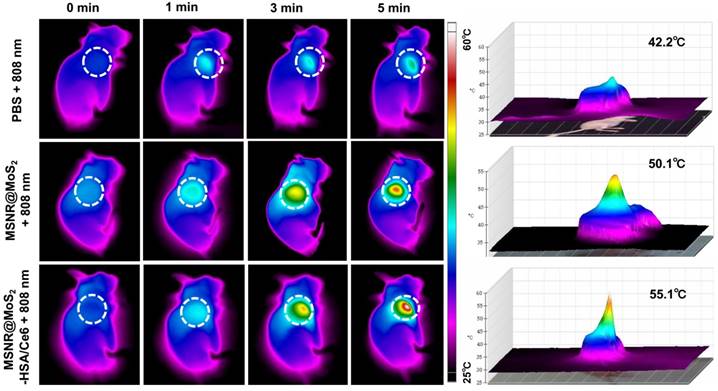
In view of the good PTT effect of MSNR@MoS2-HSA/Ce6 in vitro, the in vivo photothermal capacity was further explored. 4T1 tumor-bearing mice were intravenously injected with three different formulations (PBS, MSNR@MoS2, MSNR@MoS2-HSA/Ce6), respectively. Then the temperature changes of tumor sites were recorded using an IR thermal camera at different time points after exposed to 808 nm laser (1.5 W/cm2) irradiation for 5 min at 12 h post-injection. As displayed in Figure 5, the temperature at tumor site of MSNR@MoS2 and MSNR@MoS2-HSA/Ce6 treated group exceeded 50 °C within 5 min. In addition, MSNR@MoS2-HSA/Ce6 treated group exhibited better temperature-rising ability compared to MSNR@MoS2 treated group due to the active tumor-targeting effect of HSA, which is in line with the results shown in Figure S12B. In contrast, the PBS group only showed mild temperature change of around 4 ~ 5 °C after the NIR irradiation for the same time. All these results proved that MSNR@MoS2-HSA/Ce6 possessed good ability to perform PTT effect both in vitro an in vivo.
In vivo thermal images of mice post injection of PBS, MSNR@MoS2-HSA and MSNR@MoS2-HSA/Ce6 after 808 nm laser (1.5 W/cm2) irradiation during 5 min. The right panel shows the 3D-IRTM of the corresponding thermal images.
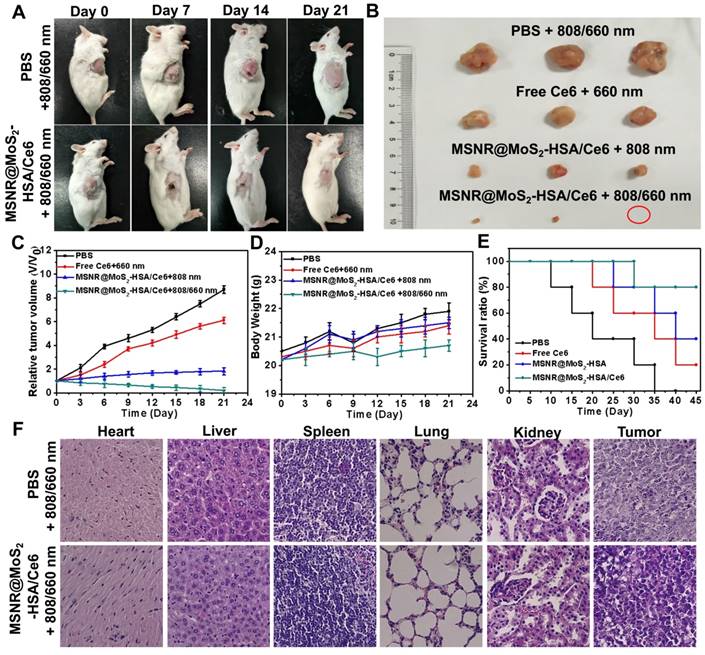
The therapeutic efficacy of the optimal formulation was evaluated. As shown in Figure 6A, the tumor growth in the MSNR@MoS2-HSA/Ce6 + 808/660 nm treated group were significantly suppressed to the maximum extent compared to the other groups. The tumors were collected from the four groups at the end of the treatments (Figure 6B), from the results we could conclude that the MSNR@MoS2-HSA/Ce6 treated group performed the best antitumor efficiency, with the combined PDT/PTT. In addition, the tumor volume, body weight and survival rate of each group were quantitively recorded. It was found that the optimal formulation group exhibited the best great antitumor effect with the smallest tumor volume (Figure 6C), the most slightly weight change (Figure 6D) as well as highest survival rate (Figure 6E), indicating its superior biocompatibility and lower systemic toxicity. Besides, H&E staining was further applied to evaluate the damage of MSNR@MoS2-HSA/Ce6 +808/660 nm treatment caused to normal organs and tumor. As displayed in Figure 6F, no obvious cell necrosis was observed in normal organs. In contrast, the final formulation treated group experienced evident necrosis and apoptosis in tumor tissue compared to the control group. All these results indicated that MSNR@MoS2-HSA/Ce6 possessed excellent anti-tumor capability with decreased side effect.
(A) Photos of 4T1 cell-bearing mice with different treatments. (B) Photographs of tumor tissues peeled from groups treated with different formulations at the end of treatment. (C) Tumor volumes changes (D) Body weight changes (E) Percent survival of tumor-bearing mice of different groups (n = 5) with different treatments. (F) H&E stained images of major organs and tumor collected from different groups.
Conclusion
In conclusion, a kind of rod-shape MoS2 nanocomposites, MSNR@MoS2-HSA/Ce6 was successfully synthesized for multi-model imaging guided PTT/PDT combined anti-tumor therapy. Besides, the special rod-shape and modified HSA could enhance the cellular uptake and tumor-targeting effect, respectively. The MSNR@MoS2-HSA/Ce6 was demonstrated to possess excellent biocompatibility, real-time FL monitoring imaging, high-contrast MSOT and CT imaging ability. Under the NIR laser irradiation, MoS2 could efficiently generate hyperthermia and accelerate the release of Ce6, achieving PTT/PDT synergetic therapy. Overall, the as-prepared MSNR@MoS2-HSA/Ce6 nanoplatform was promising to serve as a theranostic agent for precise diagnosis and cancer therapy.
Supplementary Material
Supplementary figures.
Acknowledgements
We acknowledge financial supports from the National Basic Research Project (973 Program) of China (2014CB932200), National Natural Science Foundation of China (81503016, 81771880, 81401453), Application Foundation and Cutting-edge Technologies Research Project of Tianjin (Young Program) (15JCQNJC13800).
Competing Interests
The authors have declared that no competing interest exists.
References
1. Lv G, Guo W, Zhang W, Zhang T, Li S, Chen S. et al. Near-Infrared Emission CuInS/ZnS Quantum Dots: All-in-One Theranostic Nanomedicines with Intrinsic Fluorescence/Photoacoustic Imaging for Tumor Phototherapy. ACS Nano. 2016;10:9637-9645
2. Li J, Zhen X, Lyu Y, Jiang Y, Huang J, Pu K. Cell Membrane Coated Semiconducting Polymer Nanoparticles for Enhanced Multimodal Cancer Phototheranostics. ACS Nano. 2018;12(8):8520-8530
3. Ao L, Wu C, Liu K, Wang W, Fang L, Huang L. et al. Polydopamine-Derivated Hierarchical Nanoplatforms for Efficient Dual-Modal Imaging-Guided Combination in Vivo Cancer Therapy. ACS Appl Mater Interfaces. 2018;10:12544-12552
4. Gusain R, Mungse HP, Kumar N, Ravindran TR, Pandian R, Sugimurac H. et al. Covalently attached graphene-ionic liquid hybrid nanomaterials: synthesis, characterization and tribological application. J Mater Chem A Mater. 2016;4:926-937
5. Lv M, Su S, He Y, Huang Q, Hu W, Li D. et al. Long-Term Antimicrobial Effect of Silicon Nanowires Dec orated with Silver Nanoparticles. Adv Mater. 2010;22:5463-5467
6. Sun Q, You Q, Pang X, Tan X, Wang J, Liu L. et al. A photoresponsive and rod-shape nanocarrier: Single wavelength of light triggered photothermal and photodynamic therapy based on AuNRs-capped & Ce6-doped mesoporous silica nanorods. Biomaterials. 2017;122:188-200
7. Argyo C, Weiss V, Brauchle C, Bein T. Multifunctional Mesoporous Silica Nanoparticles as a Universal Platform for Drug Delivery. Chem Mater. 2014;26:435-451
8. Trewyn BG, Slowing II, Giri S, Chen H, Lin VS. Synthesis and Functionalization of a Mesoporous Silica Nanoparticle Based on the Sol-Gel Process and Applications in Controlled Release. Acc Chem Res. 2007;40:846-853
9. Li Y, Guo W, Su X, Ou-Yang L, Dang M, Tao J. et al. Small size mesoporous organosilica nanorods with different aspect ratios: Synthesis and cellular uptake. J Colloid Interface Sci. 2018;512:134-140
10. Huang X, Teng X, Chen D, Tang F, He J. The effect of the shape of mesoporous silica nanoparticles on cellular uptake and cell function. Biomaterials. 2010;31:438-448
11. Truong PL, Kima BW, Sim SJ. Rational aspect ratio and suitable antibody coverage of gold nanorod for ultra-sensitive detection of a cancer biomarker. Lab Chip. 2012;12:1102-1109
12. Yang H, Chen Z, Zhang L, Yung W, Leung KC, Chan HYE. et al. Mechanism for the Cellular Uptake of Targeted Gold Nanorods of Defined Aspect Ratios. Small. 2016;12:5178-5189
13. Tsai C, Hung Y, Chou Y, Huang D, Hsiao J, Chang C. et al. High-Contrast Paramagnetic Fluorescent Mesoporous Silica Nanorods as a Multifunctional Cell-Imaging Probe. Small. 2008;4:186-191
14. Fouad DM, El-Said WA, Ali MH, El-Gahami MA. Silica-Gold Nanocomposite for Removal of Organophosphorous Pesticides. Plasmonics. 2017;12:869-875
15. Ahmad H. Biocompatible SiO2 in the Fabrication of Stimuli-Responsive Hybrid Composites and Their Application Potential. J Chem. 2015:19
16. Zhao R, Han X, Li Y, Wang H, Ji T, Zhao Y. et al. Photothermal Effect Enhanced Cascade Targeting Strategy for Improved Pancreatic Cancer Therapy by Gold Nanoshell@Mesoporous Silica Nanorod. ACS Nano. 2017;11:8103-8113
17. Zhao W, Li A, Chen C, Quan F, Sun L, Zhang A. et al. Transferrin-decorated, MoS2-capped hollow mesoporous silica nanospheres as a self-guided chemo-photothermal nanoplatform for controlled drug release and thermotherapy. J Mater Chem B. 2017;5:7403-7414
18. Liu B, Li C, Chen G, Liu B, Deng X, Wei Y. et al. Synthesis and Optimization of MoS2@Fe3O4-ICG/Pt(IV) Nanoflowers for MR/IR/PA Bioimaging and Combined PTT/PDT/Chemotherapy Triggered by 808 nm Laser. Adv Sci. 2017;4:1600540
19. Chou SS, Kaehr B, Kim J, Foley BM, De M, Hopkins PE. et al. Chemically Exfoliated MoS2 as Near-Infrared Photothermal Agents. Angew Chem Int Ed. 2013;52:4160-4164
20. Wang J, Tan X, Pang X, Liu L, Tan F, Li N. MoS2 Quantum Dot@Polyaniline Inorganic-Organic Nanohybrids for in Vivo Dual-Modal Imaging Guided Synergistic Photothermal/Radiation Therapy. ACS Appl Mater Interfaces. 2016;8(37):24331-24338
21. Xu S, Li D, Wu P. One-Pot, Facile, and Versatile Synthesis of Monolayer MoS2/WS2 Quantum Dots as Bioimaging Probes and Effi cient Electrocatalysts for Hydrogen Evolution Reaction. Adv Funct Mater. 2015;25:1127-1136
22. Feng W, Chen L, Qin M, Zhou X, Zhang Q, Miao Y. et al. Flower-like PEGylated MoS2 nanoflakes for near-infrared photothermal cancer therapy. Sci Rep. 2015;5:17422
23. Wang J, Liu L, You Q, Song Y, Sun Q, Wang Y. et al. All-in-One Theranostic Nanoplatform Based on Hollow MoSx for Photothermally-maneuvered Oxygen Self-enriched Photodynamic Therapy. Theranostics. 2018;8(4):955-971
24. Zhao J, Xie P, Ye C, Wu C, Han W, Huang M. et al. Outside-in synthesis of mesoporous silica/molybdenum disulfide nanoparticles for antitumor application. Chem Eng J. 2018;351:157-168
25. Lin T, Wang J, Guo L, Fu F. Fe3O4@MoS2 Core-Shell Composites: Preparation, Characterization, and Catalytic Application. J Phys Chem C. 2015;119:13658-13664
26. Yong Y, Cheng X, Bao T, Zu M, Yan L, Yin W. et al. Tungsten Sulfide Quantum Dots as Multifunctional Nanotheranostics for In Vivo Dual-Modal Image-Guided Photothermal/Radiotherapy Synergistic Therapy. ACS Nano. 2015;9(12):12451-12463
27. Khan F, Moinuddin, Mir AR, Islam S, Abidi M, Husain MA. et al. Unsaturated aldehyde, 4-hydroxynonenal (HNE) alters the structural integrity of HSA with consequences in the immuno-pathology of rheumatoid arthritis. Int J Biol Macromol. 2018;112:306-314
28. Desai N. Nanoparticle albumin bound (nab) technology: targeting tumors through the endothelial gp60 receptor and SPARC. Nanomedicine. 2007;3(4):339-339
29. Elzoghby AO, Samy WM, Elgindy NA. Albumin-based nanoparticles as potential controlled release drug delivery systems. J Control Release. 2012;157:168-182
30. Liu F, Mu J, Xing B. Recent Advances on the Development of Pharmacotherapeutic Agents on the Basis of Human Serum Albumin. Curr Pharm Des. 2015;21(14):1866-88
31. Yoon HY, Koo H, Choi KY, Lee SJ, Kim K, Kwon IC. et al. Tumor-targeting hyaluronic acid nanoparticles for photodynamic imaging and therapy. Biomaterials. 2012;33(15):3980-3989
32. Yue C, Zhang C, Alfranca G, Yang Y, Jiang X, Yang Y. et al. Near-Infrared Light Triggered ROS-activated Theranostic Platform based on Ce6-CPT-UCNPs for Simultaneous Fluorescence Imaging and Chemo-Photodynamic Combined Therapy. Theranostics. 2016;6(4):456-469
33. Jeong H, Huh M, Lee SJ, Koo H, Kwon IC, Jeong SY. et al. Photosensitizer-Conjugated Human Serum Albumin Nanoparticles for Effective Photodynamic Therapy. Theranostics. 2011;1:230-239
34. Wang N, Zhao Z, Lv Y, Fan H, Bai H, Meng H. et al. Gold nanorod-photosensitizer conjugate with extracellular pH-driven tumor targeting ability for photothermal/photodynamic therapy. Nano Res. 2014;7:1291-1301
35. Slowing II, Vivero-Escoto JL, Wu C, Lin VS. Mesoporous silica nanoparticles as controlled release drug delivery and gene transfection carriers. Adv Drug Deliv Rev. 2008;60:1278-1288
36. Sun S, Dong L, Cao Y, Sun H, Yan X. Fabrication of Multifunctional Gd2O3/Au Hybrid Nanoprobe via a One-Step Approach for Near-Infrared Fluorescence and Magnetic Resonance Multimodal Imaging in Vivo. Anal Chem. 2013;85:8436-8441
37. Yoon T, Kim KS. One-Step Synthesis of CoS-Doped β-Co(OH)2@Amorphous MoS2+x Hybrid Catalyst Grown on Nickel Foam for High-Performance Electrochemical Overall Water Splitting. Adv Funct Mater. 2016;26:7386-7393
38. Yang W, Guo W, Le W, Lv G, Zhang F, Shi L. et al. Albumin-Bioinspired Gd:CuS Nanotheranostic Agent for In Vivo Photoacoustic/Magnetic Resonance Imaging-Guided Tumor-Targeted Photothermal Therapy. ACS Nano. 2016;10:10245-10257
39. Tian B, Wang C, Zhang S, Feng L, Liu Z. Photothermally Enhanced Photodynamic Therapy Delivered by Nano-Graphene Oxide. ACS Nano. 2011;5:7000-7009
40. Paul S, Selvam S, Heng PWS, Chan LW. Elucidation of Monomerization Effect of PVP on Chlorin e6 Aggregates by Spectroscopic, Chemometric, Thermodynamic and Molecular Simulation Studies. J Fluoresc. 2013;23:1065-1076
41. Liu K, Liu Y, Yao Y, Yuan H, Wang S, Wang Z. et al. Supramolecular Photosensitizers with Enhanced Antibacterial Efficiency. Angew Chem Int Ed. 2013:52 8285-8289
42. Spikes JD. Quantum yields and kinetics of the photobleaching of hematoporphyrin, photofrin II, tetra(4-sulfonatophenyl)-porphine and uroporphyrin. Photochem Photobiol. 1993;58:346-350
43. Yang H, Wang F, Zhang Z. Photobleaching of chlorins in homogeneous and heterogeneous media. Dyes Pigm. 1999;43(2):109-117
44. Lee D, Koo H, Sun I, Ryu JH, Kim K, Kwon IC. Multifunctional nanoparticles for multimodal imaging and theragnosis. Chem Soc Rev. 2012;41:2656-2672
45. Yin W, Yan L, Yu J, Tian G, Zhou L, Zheng X. et al. High-Throughput Synthesis of SingleLayer MoS2 Nanosheets as a NearInfrared Photothermal-Triggered Drug Delivery for Effective Cancer Therapy. ACS Nano. 2014;8:6922-33
46. Meng F, Wang J, Ping Q, Yeo Y. Quantitative assessment of nanoparticle biodistribution by fluorescence imaging, revisited. ACS Nano. 2018;12:6458-6468
47. Liu Y, Tseng Y, Huang L. Biodistribution Studies of Nanoparticles Using Fluorescence Imaging: A Qualitative or Quantitative Method? Pharm Res. 2012;29(12):3273-3277
48. Yue J, Liu S, Xie Z, Xing Y, Jing X. Size-dependent biodistribution and antitumor efficacy of polymer micelle drug delivery systems. J Mater Chem B. 2013;1:4273
Author contact
![]() Corresponding author: Email addresses: linan19850115com (N. Li).
Corresponding author: Email addresses: linan19850115com (N. Li).