Impact Factor
- Issue 14; 2026
- Issue 13; 2026
- Issue 12; 2026
- Issue 11; 2026
- Issue 10; 2026
- Volume 16; 2026
- Advance Articles
- Past Issues
- Cover Images
- Cover Suggestion
- Index & Coverage
- Special Issues
Introduction
Methods
Results
Discussion
Abbreviations
Supplementary Material
Acknowledgements
References
International Journal of Biological Sciences
International Journal of Medical Sciences
 Global reach, higher impact

Theranostics 2018; 8(11):3022-3037. doi:10.7150/thno.23046 This issue Cite
Research Paper
PIAS3-mediated feedback loops promote chronic colitis-associated malignant transformation
Junting Ma1, Yaping Yang1, Yong Fu1, Feilong Guo2, Xiaoyi Zhang 1, Shuke Xiao1, Weiming Zhu2, Zhen Huang1 ![]() , Junfeng Zhang1,
, Junfeng Zhang1, ![]() , Jiangning Chen1,3
, Jiangning Chen1,3 ![]()
1. State Key Laboratory of Pharmaceutical Biotechnology, School of Life Sciences, Nanjing University, Nanjing, Jiangsu 210046, China
2. Department of General Surgery, Jinling Hospital, School of Medicine, Nanjing University, Nanjing, Jiangsu 210002, China
3. State Key Laboratory of Analytical Chemistry for Life Sciences and Collaborative Innovation Center of Chemistry for Life Sciences, Nanjing University, Nanjing, Jiangsu 210046, China
Received 2017-9-27; Accepted 2018-4-2; Published 2018-4-30
Abstract

Rationale: Colitis-associated colorectal cancer (CAC) usually exhibits an accelerated disease progression, an increased resistance to therapeutic drugs and a higher mortality rate than sporadic colorectal cancer (CRC). PIAS3 is a member of the protein inhibitor of activated STAT (PIAS) family; however, little is known about the expression and biological functions of PIAS3 in CAC. The aim of our study was to investigate the biological mechanisms of PIAS3 in CAC.
Methods: PIAS3 expression was examined in colon tissues of CAC/CRC patients and azoxymethane-dextran sulfate sodium (AOM-DSS)-induced mice. The role of PIAS3 was studied using a series of in vitro, in vivo and clinical approaches.
Results: Downregulated PIAS3 expression, upregulated miR-18a expression and highly activated NF-κB and STAT3 were observed in colon tissues of CAC/CRC patients and AOM-DSS-induced mice. In vitro experiments revealed that PIAS3 significantly inhibited the activation of NF-κB and STAT3 and demonstrated that activated NF-κB and STAT3 transcriptionally regulated miR-18a level, and up-regulation of miR-18a expression led to defective PIAS3 expression. Moreover, PIAS3-mediated autoregulatory feedback loops (PIAS3/NF-κB/miR-18a and PIAS3/STAT3/miR-18a) were verified in vitro and were found to regulate cell proliferation. Additionally, modulation of the feedback loops via overexpression of PIAS3 or knockdown of miR-18a significantly inhibited cell proliferation in a mouse CRC xenograft model. Furthermore, upregulation of PIAS3 by intracolonic administration of PIAS3 lentivirus or anti-miR-18a lentivirus in AOM-DSS-induced mice led to dramatically reduced tumor sizes/numbers, whereas knockdown of PIAS3 in CAC mice significantly promoted tumor growth.
Conclusion: Our data clearly show that PIAS3-mediated feedback loops control cell proliferation and function as robust driving forces for CAC progression. Targeting these highly activated feedback loops might offer promising therapeutic strategies for CAC.
Keywords: PIAS3, miR-18a, STAT3, NF-κB, colitis-associated colorectal cancer
Introduction
Inflammatory bowel disease (IBD) is a chronic, relapsing and remitting inflammatory disorder of the gastrointestinal tract that greatly affects patient quality of life due to the associated pain, diarrhea, vomiting and other undesirable symptoms [1]. Moreover, IBD-associated sustained colonic inflammation could greatly increase the risk of colon cancer via enhancing mutagenesis [2]. IBD-related colon cancer, also known as colitis-associated colorectal cancer (CAC), usually exhibits accelerated disease progression, increased resistance to therapeutic drugs and an increased mortality rate compared with sporadic colorectal cancer (CRC) [3]. Thus, investigating the molecular pathogenesis of CAC and identifying novel therapeutic targets may improve CAC treatment.
Activation of NF-κB and members of the JAK/STAT signaling pathway is suspected to be an essential link between persistent intestinal inflammation and tumor initiation [4-7]. As a member of the protein inhibitor of activated STAT (PIAS) protein family, PIAS3 acts as a SUMO (small ubiquitin-like modifier)-E3 ligase and can directly interact with several transcriptional factors to influence their activities [8, 9]. Although the expression changes and biological functions of colonic PIAS3 during CAC progression remains unclear, the dysregulated PIAS3 has been found to play a key role in inflammatory diseases such as rheumatoid arthritis and a variety of cancers, including gastric cancer, non-small cell lung cancer and malignant mesothelioma [10-13]. PIAS3 was found to suppress NF-κB and STAT3 activation in mouse myeloblast cells and human MCF-7 cells [14, 15]. Genetic deletion of NF-κB and STAT3 significantly reduced disease severity in an azoxymethane and dextran sulfate sodium (AOM-DSS)-induced mouse model of CAC [16, 17]. Moreover, high activation of NF-κB and STAT3 was detected in both UC-associated high-grade dysplasia patients and CAC mice [18-20]. Therefore, investigating whether PIAS3 is involved in CAC through regulating NF-κB and STAT3 will enhance understanding of the pathogenesis of CAC.
It is well known that abnormal expression of miRNAs is involved in a broad spectrum of human malignancies [21]. Altered miRNA levels have been detected in mucosa of CAC patients and AOM-DSS-treated mice, suggesting that dysregulated miRNAs might have significant effects on the development of CAC[19, 22]. Some miRNAs are able to regulate NF-κB or STAT3 activity by targeting members of the NF-κB or STAT3 pathways [23, 24]. Meanwhile, several miRNAs are also transcriptionally regulated by NF-κB and STAT3 [25, 26]. These findings suggest that aberrantly expressed miRNAs may interact with NF-κB or STAT3 to form positive feedback loops that maintain the irreversible activation of inflammatory and oncogenic signaling pathways, thus contributing to CAC progression.
In the present study, we first examined PIAS3/miR-18a expression changes and NF-κB and STAT3 activity in colon tissues of CAC/CRC patients and AOM-DSS-induced mice. Then, we showed that PIAS3 was regulated by miR-18a and that miR-18a was also the transcriptional product of NF-κB or STAT3 in two colorectal cancer cell lines. Furthermore, the PIAS3-mediated feedback loops (PIAS3/NF-κB/miR-18a and PIAS3/STAT3/miR-18a) were theoretically presumed and experimentally verified in vitro. The role of the PIAS3-mediated feedback loops was further investigated by upregulating/inhibiting PIAS3 expression or inhibiting miR-18 level using a series of in vitro, in vivo and clinical approaches. Our findings show that PIAS3-mediated feedback loops control cell proliferation and function as robust driving forces during CAC progression, suggesting that disruption of PIAS3-mediated feedback loops represents a potential therapeutic approach that may be valuable for CAC treatment.
Methods
Reagents
Human TNF-α and IL-6 were purchased from PeproTech (Rocky Hill, NJ, USA). miR-18 precursors (pre-miR-18a), miR-18a inhibitors (anti-miR-18a) and their controls (pre-scramble or anti-scramble) were purchased from Gene Pharma (Shanghai, China). A full-length human PIAS3 cDNA expression plasmid (pcDNA3.1-PIAS3) was purchased from Real Gene (Nanjing, China). Stattic, and azoxymethane (AOM) were purchased from Sigma-Aldrich (St. Louis, MO, USA). Dextran sulfate sodium (DSS) (36-40 kDa) was purchased from MP Bio-medicals (Solon, Ohio, USA). All primers, siRNAs and shRNA used in the experiments were synthesized by Real Gene (Table S1).
Clinical samples and cell lines
Colon tissue samples were acquired from patients who underwent radical resection at Jinling Hospital (Nanjing, China) (Table S2 and Table S3). All tissue samples were collected in accordance with an Institutional Review Board-approved protocol (2015NZKY-025-02). Written informed consent was obtained from each patient. Caco-2 cells (ATCC, Manassas, Virginia, USA) were cultured in high-glucose DMEM containing 15% FBS and 1% MEM non-essential amino acids (Life Technologies, Grand Island, NY, USA), and HT-29 cells (ATCC) were cultured in RPMI 1640 medium containing 10% FBS (Life Technologies).
Construction of stable cell lines and luciferase reporter plasmids
Cells were infected with recombinant lentiviruses carrying NF-κB or STAT3 luciferase reporters (Gene Operation, Ann Arbor, Michigan, USA) with the addition of polybrene (8 μg/mL) for 12 h, after which the medium was replaced with fresh medium containing 3 μg/mL puromycin. FACS (BD Biosciences, San Jose, CA, USA) was used to further purify the stable cell lines. Similarly, HT-29 stable cell lines expressing PIAS3 or anti-miR-18a were also constructed. Additionally, luciferase reporter plasmids containing the PIAS3 3'-UTR or a mutant version (the binding site ACACTGGG was replaced with CCCAGTGT) were constructed using the p-MIR-reporter plasmid. Luciferase reporter plasmids containing 1,370 bp of the C13orf25 promoter or mutant versions (the binding site CGGAATTTCC was replaced with GCCTTAAAGG for NF-κB, and the binding site TTCTGAGAA was replaced with AAGACTCTT for STAT3) were constructed using the pGL3 basic vector.
Cell treatments
Cell transfection and the luciferase assays were performed as previously described [27]. To examine the influence of PIAS3 on the activity of NF-κB and STAT3, a PIAS3 expression plasmid or PIAS3 siRNA was transfected into stable cells carrying the NF-κB or STAT3 luciferase reporter. Then, the cells were serum-starved overnight (all cells were serum-starved overnight before cytokine stimulation) and further stimulated with 20 ng/mL TNF-α or 50 ng/mL IL-6 for 12 h. Finally, the cells were lysed to measure luciferase activity or to extract protein for western blotting or ELISA to detect p65 binding activity.
For target validation, pre-miR-18a or anti-miR-18a was transfected into cells prior to determining the protein level of PIAS3. Additionally, luciferase plasmids containing the PIAS3 3'-UTR were co-transfected into cells with pre-miR-18a or anti-miR-18a, and luciferase activity was measured. To examine whether activated NF-κB and STAT3 directly upregulated miR-18a by binding to its promoter, luciferase plasmids containing the C13orf25 promoter were transfected into cells for 24 h and then stimulated with 20 ng/mL TNF-α or 50 ng/mL IL-6 for 12 h prior to measuring luciferase activity.
Cells were pretreated with 10 μmol/L BAY-117082 or stattic for 24 h and then stimulated with 20 ng/mL TNF-α or 50 ng/mL IL-6 for another 12 h to examine the influence of activated NF-κB and STAT3 on miR-18a expression. Cells were transfected with pcDNA3.1-PIAS3 for 48 h and then stimulated with 20 ng/mL TNF-α or 50 ng/mL IL-6 for 12 h prior to determining miR-18a level. Meanwhile, cells were transfected with PIAS3 siRNA for 48 h and then treated with 10 μmol/L BAY-117082 or stattic for another 24 h prior to determining miR-18a level.
Cells were transfected with anti-miR-18a and PIAS3 siRNA for 48 h and stimulated with 20 ng/mL TNF-α or 50 ng/mL IL-6; then, the cells were harvested to examine the activity of NF-κB/STAT3.
Cells were pretransfected with anti-miR-18 and then stimulated with 20 ng/mL TNF-α or 50 ng/mL IL-6 for 12 h. The cells were collected to detect the protein expression level of PIAS3 via western blotting.
Proliferation and colony formation assays
Cells were seeded onto 96-well plates (103 cell/well). A growth curve for the cells was constructing using a Cell Counting Kit-8 (CCK-8, Dojindo, Japan). Absorbance was measured at 450 nm using a microplate spectrometer (Thermo Fisher Scientific, USA).
Cells (1x10³) were mixed into 1.5 mL of top agar, and then, the top agar was added onto base agar in each well of a six-well plate. Complete medium (2 mL) was supplemented twice a week. After 3 weeks, colonies were stained with 0.5 mL of 0.1% Crystal Violet for 1 h, and colonies ≥ 0.5 mm were counted using a dissection microscope (Nikon, SMZ745T, Japan).
Establishment of mouse models
The mice were purchased from the Laboratory Animal Center of Nanjing University (Nanjing, China). All animal procedures were performed in accordance with the Guidelines for Care and Use of Laboratory Animals of Nanjing University and approved by the Animal Ethics Committee of Nanjing University.
A mouse model of CAC was induced by AOM/DSS as previously described [28]. Briefly, 8-week-old male C57BL/6 mice were intraperitoneally injected with 10 mg/kg AOM. Then, the mice were given drinking water containing 2% DSS for 1 week and regular distilled water for the following 2 weeks. This treatment cycle was repeated 3 times. To examine the effect of PIAS3 and miR-18a on the development of CAC, mice were starved overnight at the beginning of each DSS cycle, and mice were intracolonically administered with lentiviruses of PIAS3-LV (lentivirus carrying PIAS3), shRNA-PIAS3-LV (lentivirus carrying PIAS3 shRNA), or anti-miR-18a-LV (lentivirus carrying miR-18a inhibitor) (GenePharma Company, Shanghai, China) at a volume of 100 μL (109 PFU/mL); then drinking water containing 2% DSS was given to mice one day after lentivirus administration. In addition, to evaluate the therapeutic effect of PIAS3 on CAC, the PIAS3-LV lentivirus at a volume of 100 μL (109 PFU/mL) was intracolonically administrated into CAC mice for two times, respectively on day 52 and day 56 during the third DSS treatment cycle. The different treated mice were sacrificed and colon tissues were collected for examination.
A mouse CRC xenograft model was established using 5-week-old female BALB/C nude mice. A total of 1x10⁶ cells in 100 μL of phosphate-buffered saline (PBS) were subcutaneously injected into the right armpit of each mouse. Both the maximum (L) and minimum (W) lengths of each tumor were measured using a slide caliper. The tumor volume was calculated as ½LW2. The mice were sacrificed 3 weeks after cell inoculation.
Histology and immunohistochemical analyses
Tissues were fixed in 4% paraformaldehyde, embedded in paraffin and sectioned at 5-μm thickness. For histological examination, the sections were stained with hematoxylin and eosin (H&E). For immunohistochemical analysis, the sections underwent antigen retrieval followed by incubation with Ki67 or PIAS3 antibodies overnight at 4 °C. Then, biotinylated anti-rabbit secondary antibodies were incubated with the tissues for 20 min followed by incubation with streptavidin-biotin complexes at 37 °C for 20 min. The immunohistochemical staining was then revealed using diaminobenzidine as the chromogen. The sections were counterstained with hematoxylin to label nuclei. Apoptosis was evaluated using a terminal deoxynucleotidyl transferase dUTP nick end labeling (TUNEL) BrightRed Apoptosis Detection Kit (Vazyme Biotech, Nanjing, China). Information regarding the antibodies used is listed in Table S4.
Isolation of colonic epithelium and stroma
As previously described [29], the mid-distal colon tissues of control mice and AOM/DSS treated mice (cycle 1 to cycle 3) were cut into pieces and incubated with 1×HBSS containing 5 mM EDTA (Sigma-Aldrich) and 1 mM DTT(Sigma-Aldrich) at 37 ℃ for 45 min. The colonic epithelium was then separated from the stromal layer via shaking, and the remaining stroma was washed twice with PBS. Both fractions were collected for protein extraction. In order to ensure the purity of epithelial and stromal fractions, western blotting assay was used to examine α-SMA in the epithelial fraction and detect Pan-Keratin in the stromal fraction.
Western blotting and qRT-PCR
Western blotting was performed as previously described [27, 30]. Information regarding the antibodies used in this study is listed in Table S4. Total RNA was isolated using TRIzol reagent (Life Technologies) and was converted to cDNA using reverse transcriptase (Takara-Bio, Shiga, Japan). qRT-PCR was performed using a 7300 real-time PCR System (Applied Bio-systems, Foster City, CA). β-actin was used as an internal control for gene expression, and the expression of miR-18a was examined relative to the expression of U6.
NF-κB p65 activity assay
Nuclear extracts were prepared using a Nuclear Extract Kit (Cayman Chemical, #10009277, Ann Arbor, MI, USA). The DNA-binding activity of NF-κB was quantified using an NF-κB (p65) Transcription Factor Assay Kit (Cayman Chemical, #10007889) according to the manufacturer's instructions.
Statistical analysis
The results are expressed as mean ± standard error (SEM). Data was statistically analyzed using Prism software (GraphPad Software Inc. La Jolla, CA, USA) and assessed for normality or homogeneity of variance. Differences between multiple groups were compared using one-way ANOVA with Dunnett's tests or, if appropriate, using one-way ANOVA with post-hoc Bonferroni correction. Differences between two groups were evaluated using the two-tailed Student's t-test. A value of p < 0.05 was considered significant; ns = not significant.
Results
Correlation analysis between PIAS3 and miR-18a and examination of NF-κB/STAT3 activity in colon tissues of CAC and CRC patients
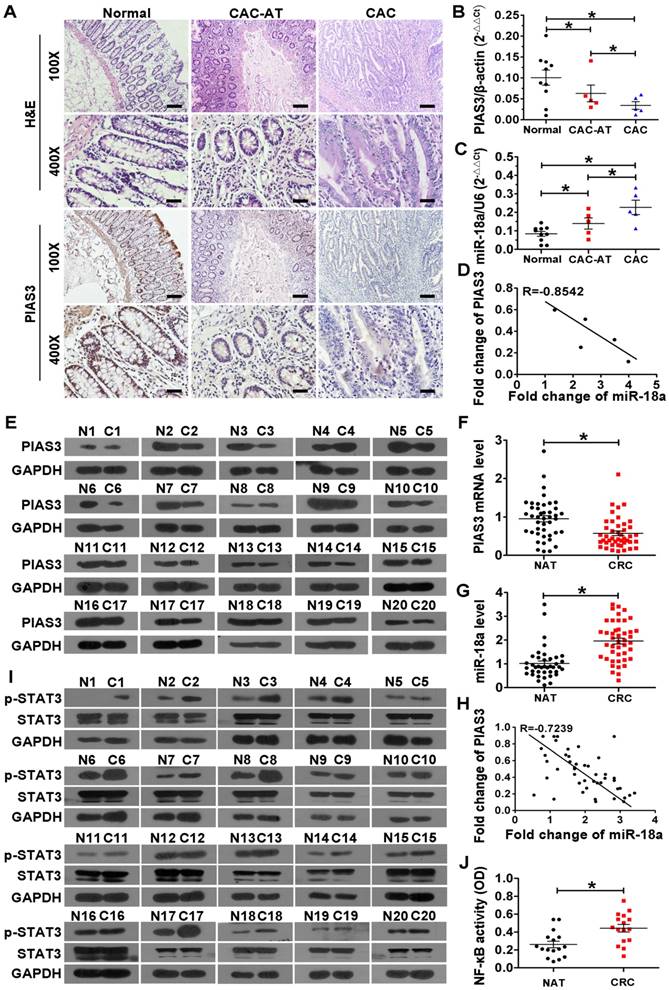
As shown in Figure 1A-B, colonic PIAS3 expression was gradually decreased from CAC-adjacent tissues (CAC-AT) to CAC tissues compared with normal colonic epithelium. Meanwhile, colonic miR-18a expression was progressively increased in CAC-AT to CAC tissues (Figure 1C). Pearson analysis showed an inverse correlation between the levels of PIAS3 and miR-18a in CAC patients (Figure 1D). Consistent with the changing trends in CAC patients, both the mRNA level and the protein level of PIAS3 were significantly decreased in CRC tissues compared with normal adjacent tissues (NATs) (Figure 1E-F). The results in Figure 1G showed the significant elevation of colonic miR-18a in CRC patients. An inverse correlation between PIAS3 and miR-18a was also observed in CRC patients (Figure 1H). Enhanced p-STAT3 levels indicated highly activated STAT3 in CRC tissues (Figure 1I). The results from an NF-κB (p65) DNA-binding assay indicated that the overall NF-κB activity was greatly increased in CRC tissues (Figure 1J).
Correlation analysis between PIAS3 and miR-18a and examination of NF-κB/STAT3 activity in colon tissues of CAC and CRC patients. (A) H&E staining and immunohistochemical staining for PIAS3 in colon sections from healthy individuals (Normal), CAC-adjacent tissues (CAC-AT) and malignant tissues (CAC). (magnification: 100x, scale bar = 100 μm; and magnification: 400x, scale bar = 25 μm). (B) The mRNA levels of PIAS3 and (C) miR-18a expression levels in colon tissues of CAC patients were examined by qRT-PCR (n=5; (B) two-tailed Student's t-test; (C) two-tailed Student's t-test). (D) Pearson's correlation scatter plot showing fold changes in the expression of PIAS3 and miR-18a in CAC samples. The correlation coefficient (R) is shown. (E) PIAS3 expression in CRC and NAT samples was examined by western blotting (n=20). (F) The mRNA levels of PIAS3 and (G) miR-18a expression levels in CRC and NAT samples (n=46) were determined using qRT-PCR, and the results are shown in scatter plots ((F-G) two-tailed Student's t-test). (H) Pearson's correlation scatter plot showing the fold changes in expression of PIAS3 and miR-18a in CRC patients (n=46). The correlation coefficient (R) is shown. (I) The expression level of p-STAT3 was examined by western blotting, and (J) NF-κB (p65) DNA-binding activity in CRC and NAT samples (n=20) was determined using an ELISA kit ((J) two-tailed Student's t-test). The western blotting data shown are representative of three individual analyses. Values are expressed as the mean ± SEM. *P < 0.05.
Identification of PIAS3/miR-18a expression and NF-κB/STAT3 activity in colon tissues of CAC mice
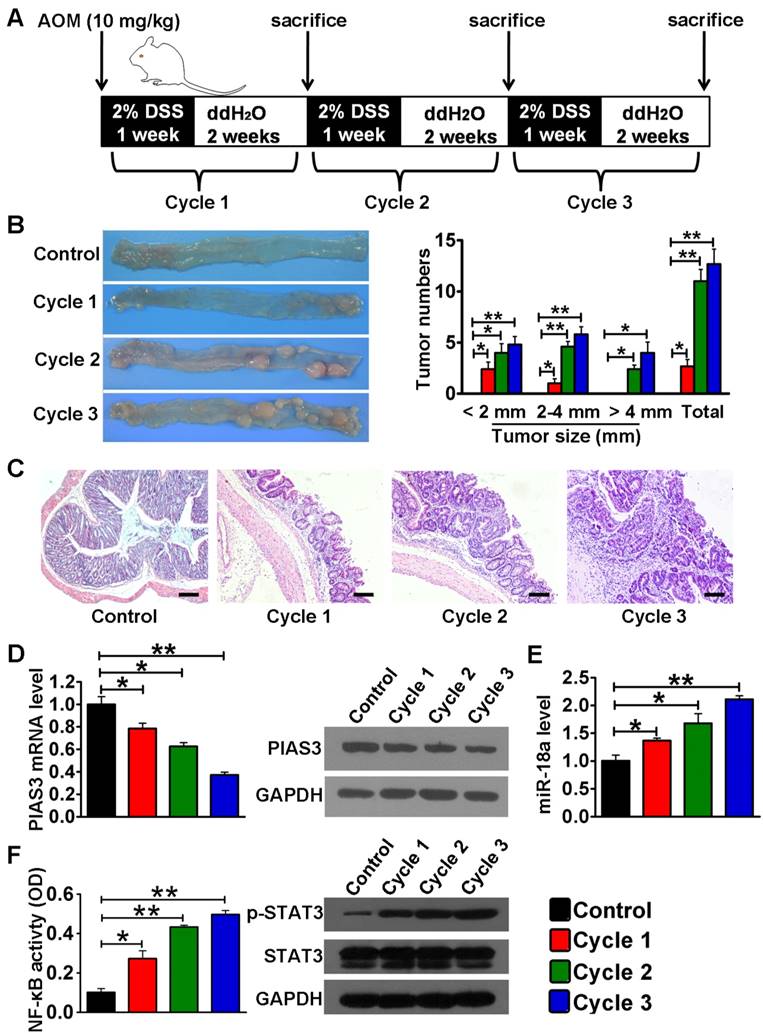
In AOM/DSS-induced mice, colon tissues were collected for examination at the end of every DSS/ddH2O cycle (Figure 2A). Macroscopic observation indicated that both tumor size and tumor number gradually increased as the treatment cycle increased (Figure 2B). The pathological features of the AOM/DSS-induced mice from cycle 1 to cycle 3 agree with previous studies [28] (Figure 2C). Both the mRNA and protein levels of PIAS3 progressively decreased from cycle 1 to cycle 3 (Figure 2D), whereas the miR-18a expression level (Figure 2E) and the activity of NF-κB (determined by the NF-κB (p65) DNA-binding activity) and STAT3 (determined by the level of p-STAT3) continued to increase as the treatment cycle progressed (Figure 2F). These data demonstrated that the changes of PIAS3/miR-18a expression and NF-κB/STAT3 activity in CAC mice followed the same trends as those observed in CAC and CRC patients. Additionally, we analyzed the expression level of PIAS3 in colonic epithelium and stroma in healthy and CAC mice. As shown in Figure S1, the results indicated abundantly expressed PIAS3 in colonic epithelium rather than in stromal layer. Moreover, the expression level of PIAS3 in colonic epithelium significantly decreased from cycle 1 to cycle 3 in CAC mice, whereas the PIAS3 expression in colonic stroma did not show a significant change from cycle 1 to cycle 3 in CAC mice.
Expression or activity examination of components of the PIAS3-mediated feedback loops in colon tissues of CAC mice. (A) Schematic overview of the CAC mouse model and sample collection. (B) Representative images of colons harvested from mice after every DSS/ddH2O cycle. Tumor numbers were counted, and tumor sizes were measured using a caliper (> 2 mm) or a dissection microscope (< 2 mm) (n=5 per cycle; (B) One-way ANOVA with Dunnett's test). (C) Sections of colons collected from mice after every DSS/ddH2O cycle were examined by H&E staining (scale bar = 100 μm). (D) The mRNA and protein levels of PIAS3 and (E) miR-18a expression level as well as (F) NF-κB activity (determined by the p65 subunit DNA-binding ability) and STAT3 activation (examined by the p-STAT3 expression level) were examined in colon tissues after every DSS/ddH2O cycle ((D-F) one-way ANOVA with Dunnett's test). The western blotting data shown are representative of three individual analyses. Values are expressed as the mean ± SEM. *P<0.05; **P<0.01.
Interaction between components of the presumed PIAS3-mediated feedback loops in vitro
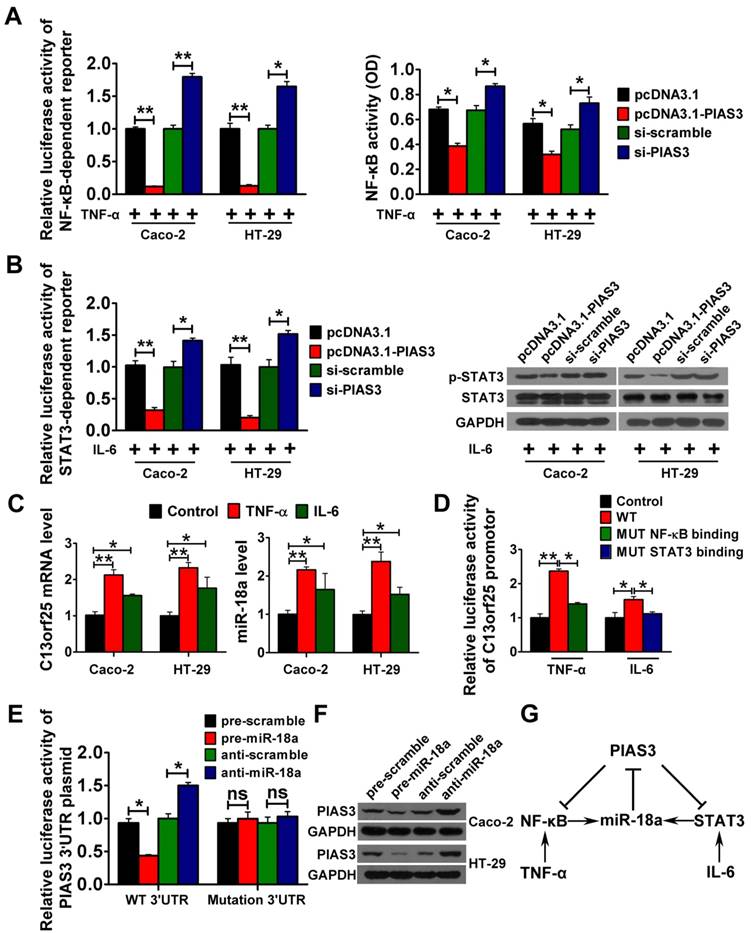
To study the interaction between PIAS3 and NF-κB in vitro, pcDNA3.1-PIAS3 or siRNA against PIAS3 was transfected into TNF-α-treated cells. The results indicated that overexpression of PIAS3 led to a significant reduction in NF-κB activity and that inhibition of PIAS3 enhanced NF-κB activity (Figure 3A). Additionally, PIAS3 overexpression led to a significant decrease in IL-6-stimulated STAT3 activity, and inhibition of PIAS3 increased STAT3 activity, which indicated an interaction between PIAS3 and STAT3 in vitro (Figure 3B). We further investigated whether activated NF-κB or STAT3 could promote miR-18a expression. As shown in Figure 3C, enhanced levels of C13orf25 (the primary transcript of miR-18a) and miR-18a were observed in TNF-α- or IL-6-treated cells. As shown in Figure 3D, luciferase activity from the C13orf25 promoter construct was greatly enhanced in Caco-2 cells after TNF-α and IL-6 treatment, whereas mutagenesis of the reported NF-κB- or STAT3-binding sites restored the luciferase expression to a normal range. The results of the luciferase reporter assay implied that activated NF-κB or STAT3 could induce the expression of miR-18a by binding to the C13orf25 promoter. Moreover, overexpression of miR-18a reduced the luciferase activity produced by the PIAS3 3'-UTR construct, whereas inhibition of miR-18a resulted in the upregulation of reporter activity. Meanwhile, mutagenesis of the predicted miR-18a-binding sites abrogated the above effects (Figure 3E). An inverse correlation between the levels of miR-18a and PIAS3 was also found in CRC cells (Figure 3F), which indicated that miR-18a could negatively regulate PIAS3. Taken together, the presumed PIAS3-mediated feedback loops (PIAS3/NF-κB/miR-18a and PIAS3/STAT3/miR-18a) were outlined, which may play key roles during the development of CAC (Figure 3G).
Interactions among components of the PIAS3-mediated feedback loops in vitro. (A) NF-κB-responsive luciferase activity in stably transfected Caco-2/HT-29 cells carrying the NF-κB luciferase reporter (left), and NF-κB (p65) DNA-binding activity in normal Caco-2/HT-29 cells (right) after transfection with PIAS3 plasmid/PIAS3 siRNA for 48 h and treatment with 20 ng/mL TNF-α for another 12 h ((A) two-tailed Student's t-test). (B) STAT3-responsive luciferase activity in stably transfected Caco-2/HT-29 cells carrying the STAT3 luciferase reporter (left) and p-STAT3 levels in normal Caco-2/HT-29 cells (right) after transfection with PIAS3 plasmid/PIAS3 siRNA for 48 h and treatment with 50 ng/mL IL-6 for another 12 h ((B) two-tailed Student's t-test). (C) C13orf25 and miR-18a levels in Caco-2/HT-29 cells after stimulation with 20 ng/mL TNF-α or 50 ng/mL IL-6 for 12 h ((C) one-way ANOVA with Dunnett's test). (D) Caco-2 cells were transfected with luciferase reporter plasmids encoding the C13orf25 promoter with wild-type (WT) or mutated (MUT) NF-κB- and STAT3-binding sites. At 24 h post-transfection, the cells were stimulated with 20 ng/mL TNF-α or 50 ng/mL IL-6 for another 12 h, and then, the luciferase activity was detected ((D) one-way ANOVA with post-hoc Bonferroni correction). (E) The relative luciferase activity of the PIAS3 3'-UTR reporter plasmid was assayed in Caco-2 cells after transfection with pre/anti-miR-18a or the corresponding control ((E) two-tailed Student's t-test). (F) The level of PIAS3 in Caco-2/HT-29 cells was evaluated by western blotting 48 h after transfection with pre/anti-miR-18a or the corresponding control. (G) Schematic diagram showing the presumed PIAS3-mediated feedback loops involved in CAC progression. For the cell experiments, five samples were analyzed per condition, and the experiments were performed in triplicate. The western blotting data shown are representative of three individual analyses. Values are expressed as the mean ± SEM of three individual experiments. *P<0.05; **P<0.01.
In vitro validation of the PIAS3-mediated feedback loops and their regulation of cell proliferation
To validate the PIAS3/NF-κB(STAT3)/miR-18a pathway in vitro, NF-κB inhibitor (Bay-11702) or STAT3 inhibitor (stattic) was first used to investigate whether activated NF-κB or STAT3 upregulated miR-18a expression. The results indicated that treatment with Bay-11702 or stattic could reduce the levels of C13orf25 and miR-18a in Caco-2 and HT-29 cells with or without stimulation with TNF-α and IL-6. (Figure 4A-B). Second, we examined whether altered PIAS3 level affected the expression of miR-18 in Caco-2 cells with or without TNF-α/IL-6 treatment. As shown in Figure 4C, upregulation of PIAS3 in Caco-2 cells reduced miR-18 expression, whereas TNF-α/IL-6 treatment rescued miR-18 expression. Meanwhile, PIAS3 siRNA increased miR-18 expression, but treatment with Bay-11702 or stattic abolished the effect of PIAS3 siRNA (Figure 4D). These results suggest that PIAS3 regulates miR-18 expression in an NF-κB/STAT3-dependent manner. To determine whether miR-18a modulates the activity of NF-κB/STAT3 in a PIAS3-dependent manner, we co-transfected anti-miR-18a and PIAS3 siRNA into Caco-2 cells, which were then treated with TNF-α or IL-6. The results indicated that treatment with anti-miR-18a suppressed NF-κB/STAT3 activation, whereas co-treatment with PIAS3 siRNA and anti-miR-18a increased NF-κB/STAT3-responsive luciferase activity (Figure S2A-B), p65 subunit DNA-binding ability (Figure 4E) and p-STAT3 expression (Figure 4F).
The PIAS3-mediated feedback loops promote colorectal cell proliferation. (A) C13orf25 and miR-18a levels in Caco-2 cells and HT-29 cells pretreated with 10 μmol/L BAY-117082 for 24 h and then stimulated with 20 ng/mL TNF-α for another 12 h or (B) pretreated with 10 μmol/L stattic for 24 h and then stimulated with 50 ng/mL IL-6 for another 12 h ((A-B) two-tailed Student's t-test). (C) Caco-2 cells were transfected with PIAS3 plasmid for 48 h and then stimulated with 20 ng/mL TNF-α or 50 ng/mL IL-6 for another 12 h prior to detecting the miR-18a expression level ((C) One-way ANOVA with post-hoc Bonferroni correction). (D) The expression level of miR-18a in Caco-2 cells after transfection with PIAS3 siRNA for 48 h and subsequent treatment with 10 μmol/L BAY-117082 or static for 24 h ((D) one-way ANOVA with post-hoc Bonferroni correction). (E) Caco-2 cells were co-transfected with 50 nmol anti-miR-18a and 50 nmol PIAS3 siRNA for 48 h and then stimulated with 20 ng/mL TNF-α for another 12 h prior to analysis via an NF-κB (p65) DNA-binding activity assay ((E) one-way ANOVA with post-hoc Bonferroni correction); alternatively, (F) the cells were stimulated with 50 ng/mL IL-6 for 12 h after transfection and harvested to determine the p-STAT3 expression level. (G) The level of PIAS3 in Caco-2 cells transfected with 50 nmol anti-miR-18a for 24 h and subsequently stimulated with 20 ng/mL TNF-α or 50 ng/mL IL-6 for another 12 h. (H) Caco-2 cells were transfected with PIAS3 plasmid or co-transfected with PIAS3 plasmid and pre-miR-18a for 24 h (left); transfected with PIAS3 plasmid for 24 h and then stimulated with 20 ng/mL TNF-α or 50 ng/mL IL-6 for another 12 h (middle); or transfected with anti-miR-18a for 24 h and then stimulated with 20 ng/mL TNF-α or 50 ng/mL IL-6 for another 12 h (right). Cell proliferation rate was assayed following the different treatments using a CCK-8 assay ((H) one-way ANOVA with post-hoc Bonferroni correction). For cell experiments, five samples were analyzed per condition, and the experiments were performed in triplicate. The western blotting data shown are representative of three individual analyses. Values are expressed as the mean ± SEM of three individual experiments. *P<0.05; **P<0.01.
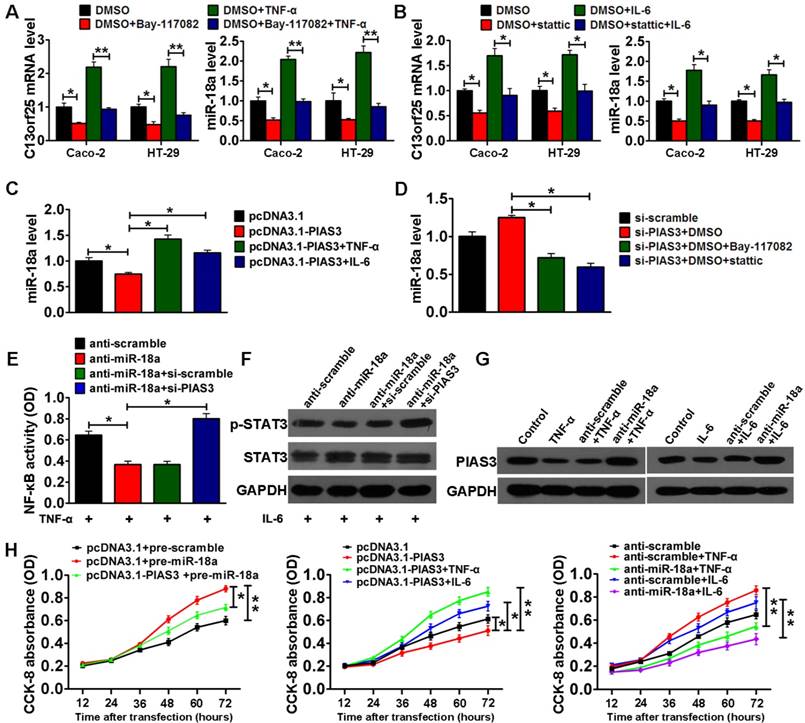
Collectively, these findings suggested the existence of an miR-18a/PIAS3/NF-κB(STAT3) pathway. To study whether activation of NF-κB/STAT3 reduces PIAS3 expression in an miR-18a-dependent manner, miR-18a inhibitor was transfected into TNF-α- or IL-6-treated Caco-2 cells. As shown in Figure 4G, compared with the reduced PIAS3 level in Caco-2 cells after TNF-α or IL-6 treatment, co-treatment with anti-miR-18a and TNF-α/IL-6 restored PIAS3 expression, thus providing evidence for the existence of an NF-κB(STAT3)/miR-18a/PIAS3 signaling axis.
We next investigated the effect of PIAS3-mediated feedback loops on cell proliferation in vitro. As shown in Figure 4H, CCK-8 assay results indicated that a change in the expression of any signal molecule in the feedback loops led to the expected effect on cell proliferation; for example, overexpression of PIAS3 antagonized the effect of pre-miR-18a, activation of NF-κB/STAT3 via TNF-α or IL-6 antagonized the effect of PIAS3 overexpression, and supplementation with anti-miR-18a antagonized the effect of NF-κB/STAT3 activation. These results further emphasized the importance of the feedback loops in promoting colorectal cell proliferation.
PIAS3-mediated feedback loops promote cell growth and reduce cell apoptosis in a mouse xenograft colorectal tumor model
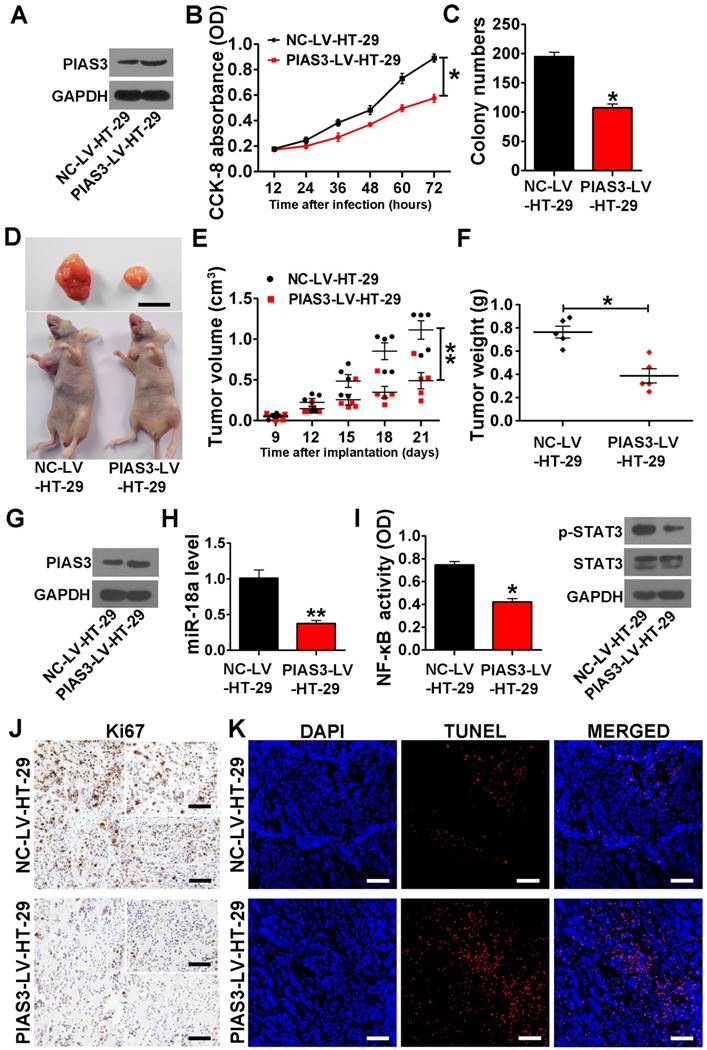
PIAS3-LV-HT-29 cells exhibited a significant increase in the cellular PIAS3 level (Figure 5A), and anti-miR-18a-LV-HT-29 cells showed a significantly reduced level of miR-18a (Figure S3A). The results of CCK-8 assay and colony formation assay indicated that either overexpression of PIAS3 or knockdown of miR-18a markedly inhibited HT-29 cell proliferation (Figure 5B-C and Figure S3B-C). As shown in Figure 5D-F and Figure S3D-F, the tumor volume and tumor weight in the PIAS3-LV-HT-29 group and the anti-miR-18a-HT-29 group were significantly smaller than those in the NC-LV-HT-29 or anti-scramble-LV-HT-29 groups. Moreover, the results from western blotting, qRT-PCR and ELISA experiments indicated that tumor tissues from the PIAS3-LV-HT-29 group exhibited enhanced PIAS3 expression, decreased miR-18a level and reduced NF-κB and STAT3 activity (Figure 5G-I). Histopathological analysis indicated that either upregulation of PIAS3 or downregulation of miR-18a decreased the number of Ki67-positive cells and increased the number of TUNEL-positive cells (Figure 5J-K and Figure S3G-H). These results further suggested that the PIAS3-mediated feedback loops could stimulate cell growth and prevent cell apoptosis in the mouse CRC xenograft model.
The effect of PIAS3 on the proliferation and apoptosis of colorectal cells. (A) The expression level of PIAS3 was detected by western blotting in stably transfected HT-29 cells overexpressing PIAS3 (PIAS3-LV-HT-29 cells) or the corresponding control (NC-LV-HT-29 cells). (B) Cell proliferation was assayed in PIAS3-LV-HT-29 cells using a CCK-8 ((B) two-tailed Student's t-test). (C) A colony formation assay was performed using PIAS3-LV-HT-29 cells, and the colony numbers were counted 21 days after seeding ((C) two-tailed Student's t-test). (D) A representative image of tumors from tumor-bearing mice at 21 days post-implantation with PIAS3-LV-HT-29 cells. Scale bar = 1 cm (n=5). (E) The volumes of the xenograft tumors in nude mice determined at 21 days post-implantation ((E) two-tailed Student's t-test). (F) The weights of the xenograft tumors in nude mice measured at 21 days post-implantation ((F) two-tailed Student's t-test). (G) The PIAS3 expression level, (H) miR-18 expression level, (I) NF-κB activity (determined by p65 subunit DNA-binding ability) and p-STAT3 level in the tumor tissue from nude mice were assayed at 21 days post-implantation ((H-I) two-tailed Student's t-test). (J) Immunohistochemical staining for Ki67 and (K) a TUNEL assay were performed using tumor tissue from nude mice at 21 days post-implantation (magnification: 200x, scale bar = 50 μm; and insert magnification: 400x, scale bar = 50 μm). The representative images of tumors are shown. For cell experiments, five samples were analyzed per condition, and the experiments were performed in triplicate. The western blotting data shown are representative of three individual analyses. Values are expressed as the mean ± SEM. *P<0.05; **P<0.01.
PIAS3-mediated feedback loops drove the transition from colitis to dysplasia in an AOM-DSS mouse model
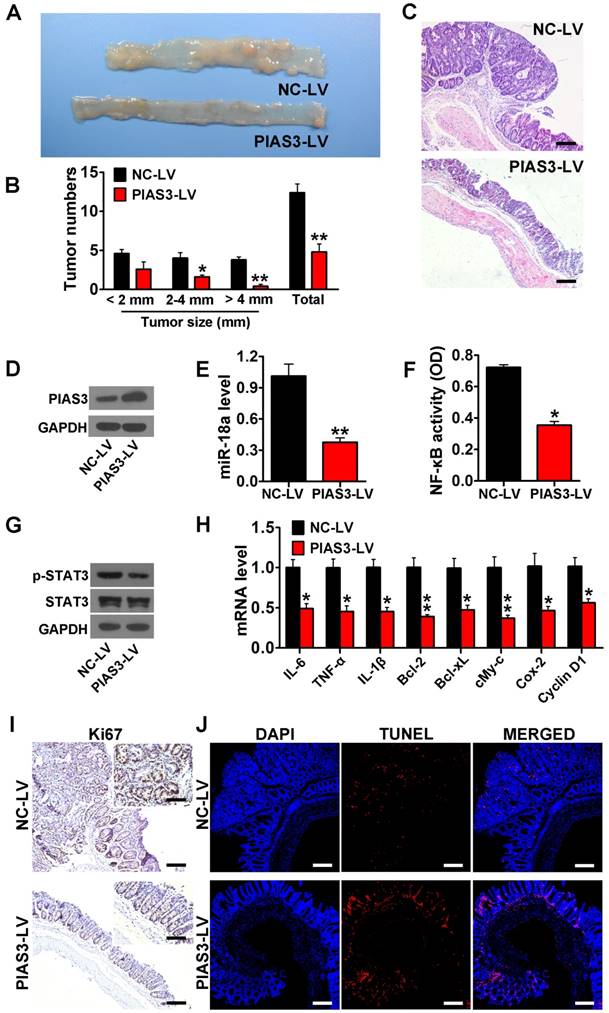
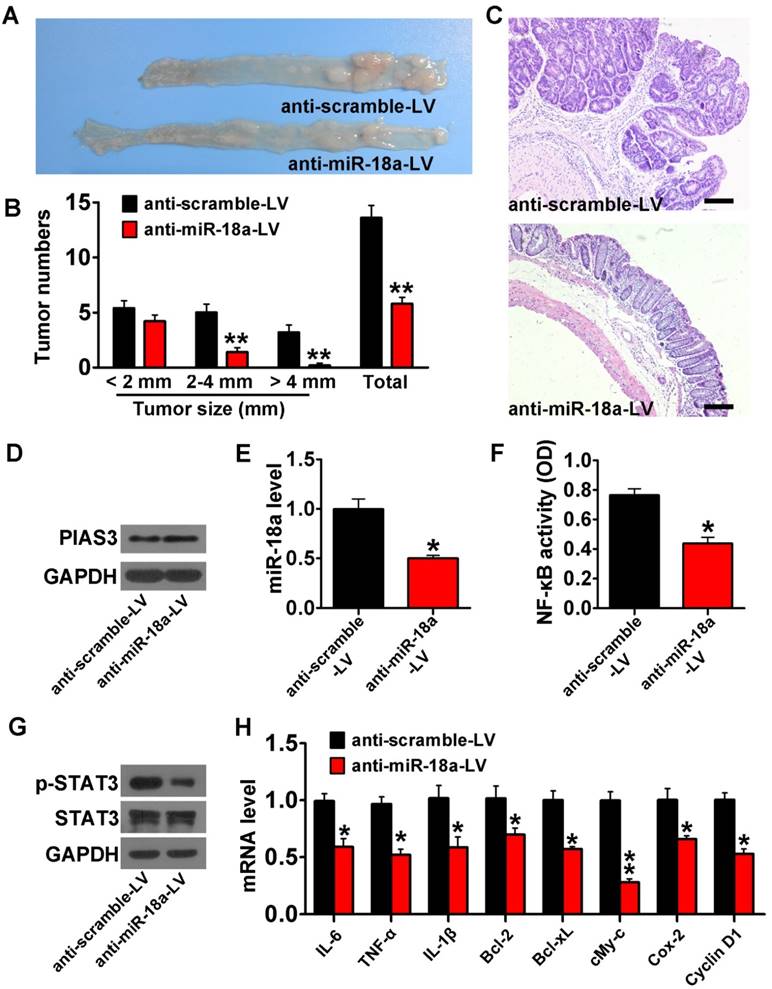
PIAS3-LV or anti-miR-18a-LV treatment dramatically reduced tumor size and tumor number and increased colon length (Figure 6A-B and Figure 7A-B). H&E staining also indicated a significantly reduced adenoma volume in colon tissues from mice treated with PIAS3-LV or anti-miR-18a-LV (Figure 6C and Figure 7C). Injection of PIAS3-LV increased colonic PIAS3 expression and reduced colonic miR-18a level (Figure 6D-E). Meanwhile, administration of anti-miR-18A-LV downregulated colonic miR-18a expression and upregulated colonic miR-18a level (Figure 7D-E). ELISA and western blotting results indicated that both the upregulation of PIAS3 and the downregulation of miR-18a remarkably impaired NF-κB/STAT3 activity and decreased the mRNA levels of downstream cytokine and oncogenic genes (Figure 6F-H and Figure 7F-H). The results of Ki-67 immunohistochemistry and TUNEL staining demonstrated that the PIAS3-LV treatment markedly suppressed malignant cell growth and promoted cell apoptosis (Figure 6I-J). Furthermore, administration of shRNA-PIAS3-LV promoted tumor growth, as judged by the tumor number and tumor size (Figure S4A-C) and decreased colonic PIAS3 expression and upregulated colonic miR-18a level (Figure S4D-E). PIAS3-LV was given to CAC mice on day 52 and on day 56 to evaluate the therapeutic effect of PIAS3-LV. The results showed the decreased tumor numbers/sizes (Figure S5A-C), the enhanced colonic PIAS3 expression and the reduced miR-18a level (Figure S5D-E).
Overexpression of PIAS3 protected against the development of CAC. (A) The representative images of colons harvested from AOM-DSS mice after PIAS3-LV treatment (n=5 per group). (B) Tumor numbers were counted, and tumor sizes were determined using a caliper (> 2 mm) or a dissection microscope (< 2 mm) ((B) two-tailed Student's t-test). (C) Colon sections from AOM-DSS mice that received PIAS3-LV treatment were examined by H&E staining (magnification: 100x, scale bar = 100 μm). (D) The PIAS3 expression level, (E) miR-18a expression level, (F) NF-κB activity (determined by p65 subunit DNA-binding ability), (G) p-STAT3 expression level and (H) the mRNA levels of inflammatory cytokines and oncogenic genes (IL-6, TNF-α, IL-1β, Bcl-2, Bcl-xL, c-Myc, Cox-2 and cyclin D1) in colon tissues from mice following PIAS3-LV treatment ((E-F) and (H) two-tailed Student's t-test). (I) Immunohistochemical staining of Ki67 and (J) TUNEL assay were performed in colon sections from PIAS3-LV-treated mice (magnification: 100x, scale bar = 100 μm; insert magnification: 400x, scale bar = 50 μm). The western blotting data shown are representative of three individual analyses. Values are expressed as the mean ± SEM. *P<0.05; **P<0.01.
Inhibition of miR-18a protected against the development of CAC. (A) Lentiviruses encoding anti-miR-18a (anti-miR-18a-LV) were intracolonically administered into AOM-treated C57BL/6J mice before every DSS-drinking cycle. Images of the colons harvested from AOM-DSS mice after three treatments with anti-miR-18a-LV. (B) Tumor numbers were counted, and tumor sizes were determined using a caliper (> 2 mm) or a dissection microscope (< 2 mm) ((B) two-tailed Student's t-test). (C) Colon sections from AOM-DSS mice that received anti-miR-18a-LV treatment were examined by H&E staining (magnification: 100x, scale bar = 100 μm). (D) The PIAS3 expression level, (E) miR-18a expression level, (F) NF-κB activity (determined by p65 subunit DNA-binding ability), (G) p-STAT3 expression level and (H) mRNA levels of inflammatory cytokines and oncogenic genes (IL-6, TNF-α, IL-1β, Bcl-2, Bcl-xL, c-Myc, Cox-2 and cyclin D1) in colon tissues from AOM-DSS mice that received anti-miR-18a-LV treatment ((E-G) and (H) two-tailed Student's t-test). For the cell experiments, five samples were analyzed per condition, and the experiments were performed in triplicate. The western blotting data shown are representative of three individual analyses. A total of 5 mice were examined per group; values are expressed as the mean ± SEM. *P<0.05; **P<0.01.
Discussion
Emerging evidence supports that acute inflammatory responses eradicate established tumor cells rather than promote tumor growth, and thus, they are not considered a risk factor for the induction of neoplastic transformation [31]. However, chronic inflammation induces pro-neoplastic mutations, promotes premalignant cell proliferation and enhances cell resistance against apoptosis [32]. These findings imply that inflammatory signaling activation and immune regulatory defects maintain colonic inflammatory response and contribute to inflammation-induced neoplastic transformation.
PIAS3 is a member of PIAS family and little is known about its expression and biological functions during CAC progression. Previous reports on the PIAS3 expression change in colon malignant tissues are not consistent [33, 34]. Our data demonstrated that the transcript and protein levels of PIAS3 significantly decreased in CAC patients (Figure 1A -B), which showed the same change trend as that in a large cohort of CRC patients (Figure 1E -F) [34]. Importantly, in this present study, PIAS3 dysregulation was found to be closely related to CAC progression based on the gradually reduced PIAS3 from CAC-AT to CAC tissues. The reduced PIAS3 level was found to be associated with highly activated STAT3 and NF‑κB, not only in malignant mesothelioma and gastric adenocarcinoma [10, 12] but also in CRC/CAC (Figure 1I -J and Figure 2F). Moreover, our findings indicated the role of PIAS3 in regulating cell proliferation and cell apoptosis during CAC progression (Figure 6I -J), which concurred with previous studies reporting the antitumor role of PIAS3 in lung cancer squamous cells and mesothelioma cells [10, 35].
The evidence indicates that both STAT3 and NF-κB not only modulate the transcription of multiple sets of genes involved in the cell cycle, apoptosis and immune responses but also regulate the expression of miRNAs [36, 37]. As a member of the miR-17-92 cluster, miR-18a is transcriptionally controlled by STAT3 or NF‑κB in a gastric cancer cell line and inflamed hepatocytes [12, 38]. In this study, our findings showed that activation of STAT3 or NF‑κB resulted in significantly upregulated miR-18a level in colonic epithelial cells (Figure 3C-D and Figure 4C); whereas, addition of inhibitors targeting STAT3 or NF‑κB suppressed the miR-18a level (Figure 4A-B and Figure 4D). miR-18a is involved in several oncogenic pathways via targeting TBPL1, ATM and other genes in CRC [39, 40]. Wu et al. reported that miR-18a was significantly overexpressed in CRC and that miR-18a might be used as a marker of poor prognosis in CRC patients [40]. Our data indicated that miR-18a was increased in patients with UC-associated dysplasia or cancer and CAC mice (Figure 1C, G and Figure 2E). These results suggest that STAT3/NF‑κB-activated miR-18a is intimately involved in colitis-induced neoplastic transformation. Moreover, miR-18a was found to regulate STAT3/NF‑κB activity by suppressing PIAS3 (Figure 4E-F and Figure S2A-B). Thus, in the present study, miR-18a worked within a positive feedback loop whereby a reduction in PIAS3 expression increased STAT3 and NF‑κB activity (Figure 3G).
Although PIAS3/STAT3 (NF‑κB)/miR-18a autoregulatory loops were found in CAC, these circuits might affect other oncogenic signaling pathways. For example, STAT3 and NF‑κB were found to promote the transcription of other miRNAs, such as miR-21 and miR-301a [19, 41]. These genes and miRNAs were reported to be involved in activation of colonic immune system during CAC progression [18, 19]. Furthermore, miR-18a may have multiple targets in addition to PIAS3. Previously reported genes targeted by miR-18a, such as KRAS, Bcl-2, p53 and phosphatase and tensin homolog (PTEN), might be involved in regulating the survival and growth of premalignant cells during CAC progression [42-44]. Taken together, these findings showed that the PIAS3-mediated feedback loops had a key role in the maintenance of sustained intestinal inflammation, which might consequently lead to malignant transformation.
Our findings indicated that PIAS3 was abundantly expressed in colonic epithelium rather than in stroma and demonstrated that the PIAS3-mediated feedback loops regulated cell proliferation in CAC (Figure S1 and Figure 6I). Nevertheless, these results did not mean that these feedback loops promoted CAC development simply by activating colonic epithelial cells. As the signaling molecules in the above-mentioned feedback loops may be expressed in other colonic cell subsets such as colonic immune cells [45-47], it is possible that these self-promoting loops may work in other cell types such as macrophages to maintain their aberrant activation or Th17 cells to promote their expansion. However, treatment of PIAS3-LV or anti-miR-18a-LV in CAC mice at the beginning of each DSS cycle significantly prevented the formation and growth of colonic tumors (Figure 6A-C and Figure 7A-C). Meanwhile, treatment of PIAS3-LV in CAC mice on day 52 and on day 56 also prevented the growth of colonic tumors (Figure S5A-C). These results imply that the PIAS3-mediated feedback loops play a crucial role in both initial and advanced stages of CAC.
In summary, the PIAS3-mediated positive-feedback loops contributed to the sustained activation of inflammatory and oncogenic pathways during CAC progression; thus, these feedback loops acted as a driving force of CAC. In this regard, a therapeutic strategy based on PIAS3 overexpression or miR-18a inhibition to disrupt the feedback loops represents a promising approach that may be valuable for CAC treatment.
Abbreviations
AOM-DSS: azoxymethane and dextran sulfate sodium; CAC: colitis-associated colorectal cancer; CAC-AT: CAC-adjacent tissues; CCK-8: Cell Counting Kit-8; C13orf25: chromosome 13 open reading frame 25; CRC: colorectal cancer; H&E: hematoxylin and eosin; IBD: inflammatory bowel disease; IL: interleukin; miRNAs: microRNAs; NAT: normal adjacent tissues; NF-κB: nuclear factor κB; PIAS3-LV: lentivirus carrying PIAS3; shRNA-PIAS3-LV: lentivirus carrying PIAS3 shRNA; anti-miR-18a-LV: lentivirus carrying miR-18a inhibitor; pre-miR-18a: miR-18 precursors; anti-miR-18a: miR-18a inhibitor; PIAS: protein inhibitor of activated STAT; PTEN: phosphatase and tensin homolog; TNF: tumor necrosis factor; TUNEL: terminal deoxynucleotidyl transferase dUTP nick end labeling; 3'-UTR: 3'-untranslated regions.
Supplementary Material
Supplementary figures and tables.
Acknowledgements
This work was supported by the National Natural Science Foundation of China (31571458, 31771550, 81673380, 31400671, J1103512, J1210026), the National Key Research and Development Program of China (2017YFC0909700), and the Fundamental Research Funds for the Central Universities (020814380040, 020814380054).
Competing Interests
The authors have declared that no competing interest exists.
References
1. Long MD, Hutfless S, Kappelman MD, Khalili H, Kaplan GG, Bernstein CN. et al. Challenges in designing a national surveillance program for inflammatory bowel disease in the United States. Inflamm Bowel Dis. 2014;20:398-415
2. Li Y, de Haar C, Chen M, Deuring J, Gerrits MM, Smits R. et al. Disease-related expression of the IL6/STAT3/SOCS3 signalling pathway in ulcerative colitis and ulcerative colitis-related carcinogenesis. Gut. 2010;59:227-35
3. Lennerz JK, van der Sloot KWJ, Le LP, Batten JM, Han JY, Fan KC. et al. Colorectal cancer in Crohn's colitis is comparable to sporadic colorectal cancer. Int J Colorectal Dis. 2016;31:973-82
4. Cooks T, Pateras IS, Tarcic O, Solomon H, Schetter AJ, Wilder S. et al. Mutant p53 prolongs NF-kappaB activation and promotes chronic inflammation and inflammation-associated colorectal cancer. Cancer cell. 2013;23:634-46
5. Polytarchou C, Hommes DW, Palumbo T, Hatziapostolou M, Koutsioumpa M, Koukos G. et al. MicroRNA214 is associated with progression of ulcerative colitis, and inhibition reduces development of colitis and colitis-associated cancer in mice. Gastroenterology. 2015;149:981-92
6. Jayakumar A, Bothwell ALM. Stat6 promotes intestinal tumorigenesis in a mouse model of adenomatous polyposis by expansion of MDSCs and inhibition of cytotoxic CD8 response. Neoplasia. 2017;19:595-605
7. Leon-Cabrera SA, Molina-Guzman E, Delgado-Ramirez YG, Vazquez-Sandoval A, Ledesma-Soto Y, Perez-Plasencia CG. et al. Lack of STAT6 attenuates inflammation and drives protection against early steps of colitis-associated colon cancer. Cancer Immunol Res. 2017;5:385-96
8. Onishi A, Peng GH, Hsu C, Alexis U, Chen S, Blackshaw S. Pias3-dependent SUMOylation directs rod photoreceptor development. Neuron. 2009;61:234-46
9. Spoden GA, Morandell D, Ehehalt D, Fiedler M, Jansen-Durr P, Hermann M. et al. The SUMO-E3 ligase PIAS3 targets pyruvate kinase M2. J Cell Biochem. 2009;107:293-302
10. Dabir S, Kluge A, Kresak A, Yang M, Fu PF, Groner B. et al. Low PIAS3 expression in malignant mesothelioma is associated with increased STAT3 activation and poor patient survival. Clin Cancer Res. 2014;20:5124-32
11. Duarte JH. Rheumatoid arthritis: PIAS3 inhibition blocks FLS activity. Nat Rev Rheumatol. 2016;12:70-1
12. Wu W, Takanashi M, Bodigin N, Ohno SI, Fujita K, Hoshino S. et al. MicroRNA-18a modulates STAT3 activity through negative regulation of PIAS3 during gastric adenocarcinogenesis. Br J Cancer. 2013;108:653-61
13. Kluge A, Dabir S, Vlassenbroeck I, Eisenberg R, Dowlati A. Protein inhibitor of activated STAT3 expression in lung cancer. Mol Oncol. 2011;5:256-64
14. Chung CD, Liao JY, Liu B, Rao XP, Jay P, Berta P. et al. Specific inhibition of Stat3 signal transduction by PIAS3. Science. 1997;278:1803-5
15. Jang HD, Yoon K, Shin YJ, Kim J, Lee SY. PIAS3 suppresses NF-kappa B-mediated transcription by interacting with the p65/RelA subunit. J Biol Chem. 2004;279:24873-80
16. Grivennikov S, Karin E, Terzic J, Mucida D, Yu GY, Vallabhapurapu S. et al. IL-6 and Stat3 are required for survival of intestinal epithelial cells and development of colitis-associated cancer. Cancer cell. 2009;15:103-13
17. Greten FR, Eckmann L, Greten TF, Park JM, Li ZW, Egan LJ. et al. IKKbeta links inflammation and tumorigenesis in a mouse model of colitis-associated cancer. Cell. 2004;118:285-96
18. Liu S, Sun X, Wang M, Hou Y, Zhan Y, Jiang Y. et al. A microRNA 221- and 222-mediated feedback loop maintains constitutive activation of NFkappaB and STAT3 in colorectal cancer cells. Gastroenterology. 2014;147:847-59 e11
19. Shi C, Yang Y, Xia Y, Okugawa Y, Yang J, Liang Y. et al. Novel evidence for an oncogenic role of microRNA-21 in colitis-associated colorectal cancer. Gut. 2016;65:1470-81
20. Tang A, Li N, Li X, Yang H, Wang W, Zhang L. et al. Dynamic activation of the key pathways: linking colitis to colorectal cancer in a mouse model. Carcinogenesis. 2012;33:1375-83
21. Svoronos AA, Engelman DM, Slack FJ. OncomiR or tumor suppressor? The duplicity of microRNAs in cancer. Cancer Res. 2016;76:3666-70
22. Gao Y, Li X, Yang M, Zhao Q, Liu X, Wang G. et al. Colitis-accelerated colorectal cancer and metabolic dysregulation in a mouse model. Carcinogenesis. 2013;34:1861-9
23. Ma X, Becker Buscaglia LE, Barker JR, Li Y. MicroRNAs in NF-kappaB signaling. J Mol Cell Biol. 2011;3:159-66
24. Sugimura K, Miyata H, Tanaka K, Hamano R, Takahashi T, Kurokawa Y. et al. Let-7 expression is a significant determinant of response to chemotherapy through the regulation of IL-6/STAT3 pathway in esophageal squamous cell carcinoma. Clin Cancer Res. 2012;18:5144-53
25. Cao Q, Li YY, He WF, Zhang ZZ, Zhou Q, Liu X. et al. Interplay between microRNAs and the STAT3 signaling pathway in human cancers. Physiol Genomics. 2013;45:1206-14
26. Yuan Y, Tong LY, Wu SY. microRNA and NF-kappa B. Adv Exp Med Biol. 2015;887:157-70
27. Sun DF, Yu F, Ma YT, Zhao R, Chen X, Zhu J. et al. MicroRNA-31 activates the RAS pathway and functions as an oncogenic microRNA in human colorectal cancer by repressing RAS p21 GTPase activating protein 1 (RASA1). J Biol Chem. 2013;288:9508-18
28. Wirtz S, Neufert C, Weigmann B, Neurath MF. Chemically induced mouse models of intestinal inflammation. Nat Protoc. 2007;2:541-6
29. Weigmann B, Tubbe I, Seidel D, Nicolaev A, Becker C, Neurath MF. Isolation and subsequent analysis of murine lamina propria mononuclear cells from colonic tissue. Nat Protoc. 2007;2:2307-11
30. Huang Z, Shi TG, Zhou Q, Shi S, Zhao R, Shi H. et al. MiR-141 regulates colonic leukocytic trafficking by targeting CXCL12 beta during murine colitis and human Crohn's disease. Gut. 2014;63:1247-57
31. Grivennikov SI, Greten FR, Karin M. Immunity, inflammation, and cancer. Cell. 2010;140:883-99
32. Karin M, Greten FR. NF kappa B: Linking inflammation and immunity to cancer development and progression. Nat Rev Immunol. 2005;5:749-59
33. Li H, Gao H, Bijukchhe SM, Wang Y, Li T. PIAS3 may represent a potential biomarker for diagnosis and therapeutic of human colorectal cancer. Medical hypotheses. 2013;81:1151-4
34. Yu T, Lu Q, Ou X, Cao D, Yu Q. Association of sedentary behavior with the expression levels of biomarkers in colorectal cancer: clinical analysis of 228 patients. Tohoku J Exp Med. 2014;232:167-76
35. Abbas R, McColl KS, Kresak A, Yang M, Chen YW, Fu PF. et al. PIAS3 expression in squamous cell lung cancer is low and predicts overall survival. Cancer Med. 2015;4:325-32
36. Iliopoulos D. MicroRNA circuits regulate the cancer-inflammation link. Sci Signal. 2014;7:pe8
37. Fan YH, Mao RF, Yang JH. NF-kappa B and STAT3 signaling pathways collaboratively link inflammation to cancer. Protein Cell. 2013;4:176-85
38. Brock M, Trenkmann M, Gay RE, Gay S, Speich R, Huber LC. MicroRNA-18a enhances the interleukin-6-mediated production of the acute-phase proteins fibrinogen and haptoglobin in human hepatocytes. J Biol Chem. 2011;286:40142-50
39. Liu GH, Liu YH, Yang Z, Wang JX, Li DY, Zhang XF. Tumor suppressor microRNA-18a regulates tumor proliferation and invasion by targeting TBPL1 in colorectal cancer cells. Mol Med Rep. 2015;12:7643-8
40. Wu CW, Dong YJ, Liang QY, He XQ, Ng SSM, Chan FKL. et al. MicroRNA-18a attenuates DNA damage repair through suppressing the expression of ataxia telangiectasia mutated in colorectal cancer. PLoS One. 2013;8:e57036
41. Ma X, Yan F, Deng Q, Li F, Lu Z, Liu M. et al. Modulation of tumorigenesis by the pro-inflammatory microRNA miR-301a in mouse models of lung cancer and colorectal cancer. Cell discovery. 2015;1:15005
42. Chen YJ, Wu H, Zhu JM, Li XD, Luo SW, Dong L. et al. MicroRNA-18a modulates P53 expression by targeting IRF2 in gastric cancer patients. J Gastroen Hepatol. 2016;31:155-63
43. Zhang WG, Lei CP, Fan JL, Wang J. miR-18a promotes cell proliferation of esophageal squamous cell carcinoma cells by increasing cylin D1 via regulating PTEN-PI3K-AKT-mTOR signaling axis. Biochem Biophys Res Commun. 2016;477:144-9
44. Luo ZH, Dai YF, Zhang LY, Jiang C, Li Z, Yang JB. et al. miR-18a promotes malignant progression by impairing microRNA biogenesis in nasopharyngeal carcinoma. Carcinogenesis. 2013;34:415-25
45. Brackett CM, Kojouharov B, Veith J, Greene KF, Burdelya LG, Gollnick SO. et al. Toll-like receptor-5 agonist, entolimod, suppresses metastasis and induces immunity by stimulating an NK-dendritic-CD8(+) T-cell axis. Proc Natl Acad Sci U. 2016;113:E874-E83
46. Oh JH, Cho MC, Kim JH, Lee SY, Kim HJ, Park ES. et al. IL-32 gamma inhibits cancer cell growth through inactivation of NF-kappa B and STAT3 signals. Oncogene. 2011;30:3345-59
47. Kryczek I, Lin YW, Nagarsheth N, Peng DJ, Zhao LL, Zhao ED. et al. IL-22(+)CD4(+) T cells promote colorectal cancer stemness via STAT3 transcription factor activation and induction of the methyltransferase DOT1L. Immunity. 2014;40:772-84
Author contact
![]() Corresponding author: Jiangning Chen, State Key Laboratory of Pharmaceutical Biotechnology, School of Life Sciences, Nanjing University, Nanjing, Jiangsu 210046, China. Tel: +86 25 89681319; FAX: +86 25 89684060; Email: jnchenedu.cn; Junfeng Zhang, State Key Laboratory of Pharmaceutical Biotechnology, School of Life Sciences, Nanjing University, Nanjing, Jiangsu 210046, China. Tel: +86 25 89682502; FAX: +86 25 89684060; Email: jfzhangedu.cn; Zhen Huang, State Key Laboratory of Pharmaceutical Biotechnology, School of Life Sciences, Nanjing University, Nanjing, Jiangsu 210046, China. Tel: +86 25 89681322; FAX: +86 25 89684060; Email: zhenhuangedu.cn
Corresponding author: Jiangning Chen, State Key Laboratory of Pharmaceutical Biotechnology, School of Life Sciences, Nanjing University, Nanjing, Jiangsu 210046, China. Tel: +86 25 89681319; FAX: +86 25 89684060; Email: jnchenedu.cn; Junfeng Zhang, State Key Laboratory of Pharmaceutical Biotechnology, School of Life Sciences, Nanjing University, Nanjing, Jiangsu 210046, China. Tel: +86 25 89682502; FAX: +86 25 89684060; Email: jfzhangedu.cn; Zhen Huang, State Key Laboratory of Pharmaceutical Biotechnology, School of Life Sciences, Nanjing University, Nanjing, Jiangsu 210046, China. Tel: +86 25 89681322; FAX: +86 25 89684060; Email: zhenhuangedu.cn