Impact Factor
- Issue 14; 2026
- Issue 13; 2026
- Issue 12; 2026
- Issue 11; 2026
- Issue 10; 2026
- Volume 16; 2026
- Advance Articles
- Past Issues
- Cover Images
- Cover Suggestion
- Index & Coverage
- Special Issues
Introduction
Results
Discussion
Materials and methods
Supplementary Material
Abbreviations
Acknowledgements
References
International Journal of Biological Sciences
International Journal of Medical Sciences
 Global reach, higher impact

Theranostics 2018; 8(8):2171-2188. doi:10.7150/thno.22565 This issue Cite
Research Paper
Adipocyte-Derived Exosomal MiR-27a Induces Insulin Resistance in Skeletal Muscle Through Repression of PPARγ
Yang Yu1, Hongwei Du2, Shengnan Wei1, Linjing Feng1, Junnan Li1, Fan Yao1, Ming Zhang1* ![]() , Grant M. Hatch3, Li Chen1*
, Grant M. Hatch3, Li Chen1* ![]()
1. Department of Pharmacology, College of Basic Medical Sciences, School of nursing, Jilin University, Changchun 130021, China
2. Research Institution of Paediatrics, Department of Pediatric Endocrinology, The First Clinical Hospital Affiliated to Jilin University, Changchun, Jilin 130021, China
3. DREAM, Children's Hospital Research Institute of Manitoba, Center for Research and Treatment of Atherosclerosis, Department of Pharmacology & Therapeutics, University of Manitoba, Winnipeg, Manitoba, Canada.
*Both authors contributed equally to this work
Received 2017-8-27; Accepted 2018-1-31; Published 2018-3-8
Abstract

The mechanism by which adipocyte-derived endocrine factors promote insulin resistance in skeletal muscle are not fully understood. MiR-27a is highly expressed in sera of obese individuals with prediabetes and T2DM, and mainly derived by adipose tissues. Thus, miR-27a secreted into circulation by adipose tissue may regulate insulin resistance in skeletal muscle.
Methods: The association between miR-27a and insulin resistance in skeletal muscle was determined in obese children, high-fat diet-induced miR-27a knockdown obese mice, db/db mice and C2C12 cells overexpressing miR-27a. The crosstalk mediated by exosomal miR-27a between adipose tissue and skeletal muscle was determined in C2C12 cells incubated with conditioned medium prepared from palmitate-treated 3T3-L1 adipocytes.
Results: We showed that serum miR-27a level correlated positively with obesity and insulin resistance in obese children, and that elevated serum miR-27a levels correlated with insulin resistance in leptin receptor-deficient db/db mice, and with obesity and insulin resistance in high-fat diet-fed C57BL/6J mice. MiR-27a released from adipocytes of high-fat diet-fed C57BL/6J mice was associated with triglyceride accumulation. MiR-27a derived from these adipocytes induced insulin resistance in C2C12 skeletal muscle cells through miR-27a-mediated repression of PPARγ and its downstream genes involved in the development of obesity.
Conclusions: These results identify a novel crosstalk signaling pathway between adipose tissue and skeletal muscle in the development of insulin resistance, and indicate that adipose tissue-derived miR-27a may play a key role in the development of obesity-triggered insulin resistance in skeletal muscle.
Keywords: miR-27a, adipocyte, skeletal muscle, insulin resistance, exosome, PPARγ
Introduction
Obesity-induced insulin resistance results in impairment of insulin signaling in insulin target tissues and insulin resistance in skeletal muscle is a precursor in the development of type 2 diabetes mellitus (T2DM) [1, 2]. Adipose tissue has been linked to the pathogenesis of obesity-related insulin resistance in skeletal muscle [3]. Many works have focused on adipose-derived adipokines or adipocyte-induced macrophage recruitment as potential factors regulating the crosstalk between adipose and skeletal muscle [4, 5]. However, these known factors that promote insulin resistance only partially explain the complex network of signals interconnecting adipose and skeletal muscle.
Adipose tissues synthesize and secrete non-coding microRNAs (miRNAs). MiRNAs have emerged as an important class of post-transcriptional regulators of metabolic diseases. Although miRNAs exist stably in circulation, they are also secreted by donor cells, and may reach distal receptor cells to regulate their gene expressions [6, 7]. MiR-27a is highly expressed in adipose tissue, and was initially proposed as a negative regulator of adipogenic and lipogenic pathways [8, 9]. MiR-27a is highly expressed in sera of obese individuals with prediabetes and T2DM [10]. In patients with metabolic syndrome, serum miR-27a levels were positively correlated with fasting blood glucose and obesity [11]. A significant fraction of miRNAs existing in circulation is in the form of 50-200 nm vesicles, known as exosomes. Exosomes carrying miRNAs are internalized by recipient cells through endocytosis or pinocytosis [12, 13]. Recently, it was demonstrated that adipose tissue is a major source of circulating exosomal microRNAs in the obese state [14]. However, whether exosomal miR-27a secreted into circulation by adipose tissue regulates insulin resistance and its targets downstream genes in skeletal muscle is unknown.
MiR-27a is a negative regulator of peroxisome proliferator-activated receptor γ (PPARγ) [8, 15]. PPARγ is a potent modulator of whole-body lipid metabolism and insulin sensitivity. Activated PPARγ heterodimerizes with RXR to maintain glucose homeostasis through direct regulation of genes harboring PPAR response elements (PPREs), including the glucose transporter GLUT4 and the insulin receptor substrate IRS-1 [16]. Loss of skeletal muscle PPARγ was shown to result in severe insulin resistance [17]. Whether PPARγ is a target of miR-27a in the development of insulin resistance in skeletal muscle is unknown.
In this study, the association between miR-27a and insulin resistance in skeletal muscle was determined in obese children, high-fat diet-induced miR-27a knockdown obese mice, db/db mice and C2C12 cells overexpressing miR-27a. The crosstalk mediated by exosomal miR-27a between adipose tissue and skeletal muscle was determined in C2C12 cells incubated with conditioned medium prepared from palmitate-treated 3T3-L1 adipocytes. We show that adipocyte-derived exosomal miR-27a results in insulin resistance in skeletal muscle through targeting PPARγ.
Results
Serum miR-27a level is associated with obesity-induced insulin resistance
Body weight, weight circumference, BMI and the levels of all adipocytokines, except adiponectin, were elevated in obese compared to non-obese children (Table 2 and Table S1). MiR-27a was elevated in serum of obese children (OB) compared to normal-weight children (NW) in agreement with previous clinical studies (Figure 1A) [10, 11]. Serum miR-27a level was positively correlated with BMI, fasting blood glucose level (Figure 1B-C) and serum resistin, IL-6 and TNF-α levels (Figure S1). Thus, expression of miR-27a is associated with obesity in children.
Serum level of adipocytokines in non-obese and obese children
| Non-obese | Obese | |
|---|---|---|
| ADPN (μg/mL) | 20.82±1.77 | 13.13± 0.90** |
| IL-6 (pg/mL) | 12.98±0.76 | 24.73± 0.91** |
| Leptin (ng/mL) | 21.48±1.30 | 37.40± 2.33** |
| Resisitin (ng/mL) | 29.24±2.45 | 56.07± 3.01** |
| Subfatin (ng/mL) | 14.36±3.5 | 19.05± 1.93* |
| TNF-α (pg/mL) | 22.88±0.92 | 37.24± 1.83** |
| Visfatin (ng/mL) | 8.06±0.41 | 17.89± 1.68** |
Statistical analyses were performed using Student's t-test followed by F-test to compare the variances. Values are presented as mean ± SEM, n=45, *p<0.05, **p<0.01 compared to the non-obese subject group.
Serum miR-27a is associated with progressive systemic insulin resistance in obese children, and sera miR-27a levels are elevated in high-fat diet-fed mice and in db/db mice. (A) The miR-27a levels in serum of obese and normal weight children. NW: normal weight group; OB: obese group. Statistical analysis was performed using Student's t-test. Data are presented as mean ± SEM, n=45, *p<0.05 compared to non-obese group. (B) Correlation between serum miR-27a levels and BMI. n=45. (C) Correlation between serum miR-27a levels and fasting blood glucose. n=45. (D) The percent body fat distribution at 2, 4, 8 and 12 weeks in HF and LF diet-fed mice. HF: high-fat diet group; LF: low-fat diet group. The week-group interaction was F=26.73, p<0.01. (E) The relative expressions of miR-27a in sera of HF and LF groups. The week-group interaction was F=7.06, p<0.05. (F) The area under the curve of OGTT in the HF and LF groups. OGTT: oral glucose tolerance test. The week-group interaction was F=36.86, p<0.01. (G) The area under the curve of ITT in the HF and LF groups. ITT: insulin tolerance test. The week-group interaction was F=5.59, p<0.01. Statistical analyses of D-G were performed using a Student's t-test. Data represent mean ± SD, n=5, **p<0.01 compared to LF group. (H) Body weight of db/m and db/db mice. (I) Lee's index of db/m and db/db mice. (J) Fasting blood glucose of db/m and db/db mice. (K) The relative expressions of miR-27a in serum of db/m and db/db mice. (L) The area under the curve of OGTT in db/m and db/db mice. OGTT: oral glucose tolerance test. Statistical analyses of H-L were performed using Student's t-test. Data for H-J represent mean ± SEM, n=10, **p<0.01 compared to db/m. Data for K-L represent mean ± SD, n=5, **p<0.01 compared to db/m.
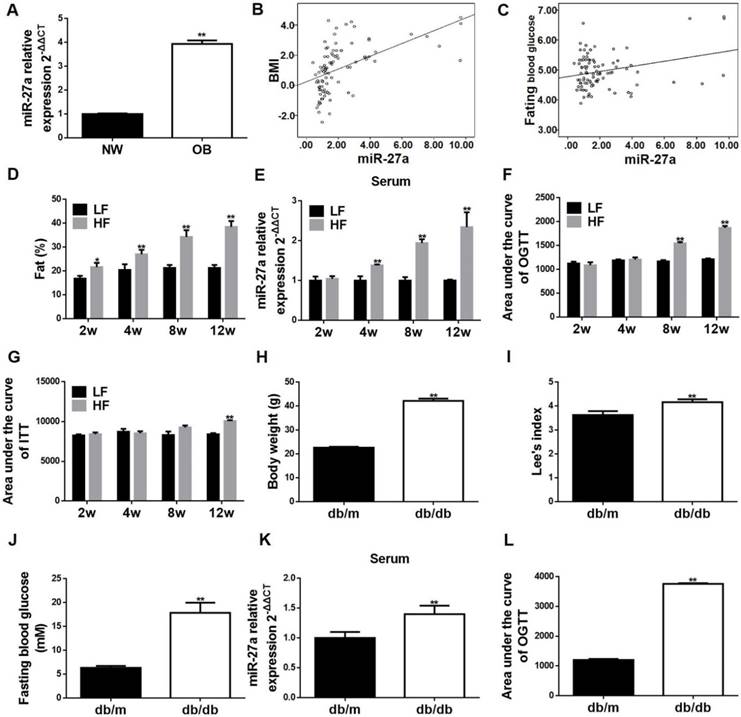
Temporal increases in percent body fat distribution (Figure 1D and Figure S2A), and area under the glucose concentration curve (AUC) of OGTT and ITT (Figure 1F-G and Figure S3A-B), were observed in C57BL/6J mice fed for up to 12 weeks a high-fat diet (HF) compared to a low-fat diet (LF). These increases correlated with an increase in serum level of miR-27a in the HF group (Figure 1E). High-fat diet induced significant elevations in TAG, CHOL, insulin and homeostasis model assessment of insulin resistance (HOMA-IR), and a decrease in the slope of ITT (KITT) compared to that of the LF group for up to 12 weeks (Table 3). In addition, body weight, fasting blood glucose, Lee's index, AUC of OGTT and serum miR-27a level were significantly increased in leptin receptor-deficient (db/db) mice compared to control (db/m) (Figure 1H-L and Figure S3E). Thus, circulating miR-27a levels are associated with obesity-induced insulin resistance in C57BL/6J mice fed a high-fat diet and in leptin receptor-deficient mice.
Serum biochemical parameters of LF and HF diet-fed C57BL/6J mice
| Parameter | LF (2w) | HF (2w) | LF (4w) | HF (4w) | LF (8w) | HF (8w) | LF (12w) | HF (12w) |
|---|---|---|---|---|---|---|---|---|
| CHOL (mM) | 3.57±0.33 | 4.22±0.23** | 4.08±0.16 | 5.91±0.17** | 3.96±0.26 | 6.16±0.19** | 3.83±0.29 | 7.17±0.35** |
| FBG (mM) | 4.52±0.32 | 4.58±0.43 | 4.33±0.33 | 4.92±0.29 | 4.65±0.54 | 5.42±0.39 | 4.81±0.16 | 5.69±0.28* |
| HOMA-IR | 1.39±0.11 | 1.51±0.16 | 1.48±0.11 | 2.28±0.20** | 2.24±0.33 | 4.43±0.44** | 2.42±0.07 | 6.91±0.29** |
| INS (mIU/L) | 6.93±0.22 | 7.44±0.82 | 7.74±0.14 | 10.46±0.80** | 10.62±0.58 | 18.31±1.11** | 11.34±0.25 | 27.52±0.52** |
| KITT (%/min) | 3.27±0.27 | 3.23±0.36 | 3.14±0.31 | 3.09±0.25 | 3.34±0.35 | 3.17±0.10 | 3.13±0.25 | 1.79±0.43** |
| TAG (mM) | 0.95±0.09 | 1.03±0.10 | 1.13±0.07 | 1.35±0.09* | 1.14±0.07 | 1.42±0.06* | 1.28±0.07 | 1.87±0.07** |
Mice were treated with LF or HF diet for 2, 4, 8 and 12 weeks, and FBG, TAG, CHOL, INS, HOMA-IR and KITT were determined. HF: high-fat diet group; LF: low-fat diet group. The interactions between week and group were cholesterol (CHOL; F=5.485, p<0.05), fasting blood glucose (FBG; F=0.088, p>0.05), homeostasis model assessment of insulin resistance (HOMA-IR; F=28.025, p<0.01), insulin (INS; F=46.773, p<0.01), the slope of insulin tolerance test (KITT; 0-15 min; F=3.157, p<0.05) and triglyceride (TAG; F=4.579, p<0.05). Analyses were performed by two-way ANOVA, followed by a post-hoc Bonferroni test to determine individual differences among groups. Values are presented as mean ± SEM, n=10, *p<0.05 and **p<0.01 compared to the corresponding LF group.
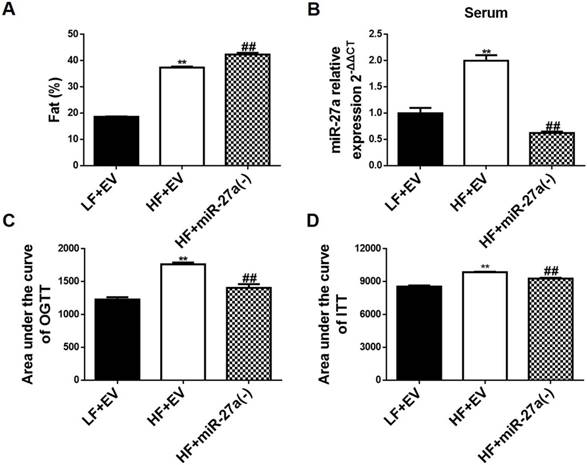
C57BL/6J mice fed a HF diet (HF+EV) exhibited an increase in percent body fat distribution compared to LF fed mice (LF+EV) (Figure 2A and Figure S2B). Knockdown of miR-27a in C57BL/6J mice fed a HF diet (HF+miR-27a(-)) resulted in an additional increase in percent body fat distribution compared to HF+EV mice. Serum miR-27a was increased in HF+EV mice compared to LF+EV mice (Figure 2B). Knockdown of miR-27a in HF+miR-27a(-) mice resulted in a decrease in serum miR-27a compared to HF+EV mice. Serum TAG, CHOL, insulin and HOMA-IR were increased, and KITT was decreased in HF+EV mice compared to LF+EV mice (Table 4). Knockdown of miR-27a in HF+miR-27a(-) mice resulted in a decrease in serum TAG, CHOL, insulin and HOMA-IR, and an increase in KITT compared to HF+EV mice. The AUC of OGTT and ITT were elevated in HF+EV mice compared to LF+EV mice (Figure 2C-D and Figure S3C-D). In contrast, the AUC of OGTT and ITT were reduced in HF+miR-27a(-) mice compared to HF+EV mice, confirming a role for miR-27a in the development of systemic insulin resistance.
Knockdown of miR-27a reduces sera miR-27a levels and improves glucose and insulin tolerance, but not percentage body fat distribution, in high-fat diet-fed mice. (A) The percent body fat distribution of low-fat diet+empty vector mice (LF+EV), high-fat diet+empty vector mice (HF+EV) and high-fat diet+miR-27a knockdown mice (HF+miR-27a(-)). (B) The relative expressions of serum miR-27a in each group. (C) The area under the curve of OGTT in each group. OGTT: oral glucose tolerance test. (D) The area under the curve of ITT in each group. ITT: insulin tolerance test. Data were analyzed using one-way ANOVA. All data are shown as the mean ± SD, n=5, **p<0.01 compared to LF+EV, ##p<0.01 compared to HF+EV.
Serum biochemical parameters of LF, HF and HF+miR-27a(-) mice
| Parameter | LF+EV | HF+ EV | HF+miR-27a(-) |
|---|---|---|---|
| CHOL (mM) | 3.54±0.19 | 7.21±0.17** | 5.98±0.15**,# |
| FBG (mM) | 4.78±0.11 | 5.3±0.21 | 4.82±0.06 |
| HOMA-IR | 2.12±0.11 | 6.21±0.36** | 3.71±0.06**,## |
| INS (mIU/L) | 9.97±0.36 | 26.29±0.59** | 17.34±0.18**,## |
| KITT (%/min) | 3.23±0.52 | 1.96±0.20** | 2.50±0.11# |
| TAG (mM) | 1.10±0.05 | 1.79±0.04** | 1.13±0.03**,## |
CHOL: cholesterol; FBG: fasting blood glucose; HF+ EV: high-fat diet+empty vector group; HF+miR-27a(-): high-fat diet+miR-27a knockdown group; HOMA-IR: insulin resistance score; INS: insulin; KITT: the slope of insulin tolerance test (0-15 min); LF+EV: low-fat diet+empty vector group; TAG: triglyceride. Data were analyzed using one-way ANOVA, followed by a post hoc Bonferroni test to determine individual differences among groups. Values are presented as mean ± SEM, n=10, *p<0.05 and **p<0.01 compared to LF+EV group, #p<0.05 and ##p<0.01 compared to HF+EV group.
MiR-27a alters insulin signaling in skeletal muscle
Insulin resistance in skeletal muscle is primarily manifested through impaired insulin-dependent glucose uptake. Hence, miR-27a level and expressions of key proteins in insulin-dependent glucose uptake were determined in skeletal muscle of HF and LF mice. Skeletal muscle miR-27a expression was significantly elevated at 8 and 12 weeks in HF compared to LF mice (Figure 3A). In addition, mRNA expressions of IRS-1 and GLUT4 in 12-week HF mice were significantly decreased compared to LF mice (Figure 3B). The protein expressions of skeletal muscle p-IRS-1 and p-Akt were lower in HF mice compared to LF mice after insulin injection (Figure 3C). Thus, insulin signaling in skeletal muscle is impaired after 12 weeks of high-fat diet, and this is associated with elevated expression of miR-27a.
MiR-27a promotes insulin resistance in skeletal muscle. (A) The miR-27a levels in skeletal muscle of LF and HF mice at 2, 4, 8 and 12 weeks. The week-group interaction was F=8.10, p<0.01. (B) The mRNA expressions of IRS-1, Akt and GLUT4 in 12-week LF and HF mice. (C) Protein expressions of p-IRS-1, IRS-1, p-Akt, Akt, and GAPDH in skeletal muscle of 12-week LF and HF mice treated (+) or untreated (-) with insulin. (D) MiR-27a levels in skeletal muscle of LF+EV, HF+EV and HF+miR-27a(-) mice. (E) The mRNA expressions of IRS-1, Akt and GLUT4 in LF+EV, HF+EV and HF+miR-27a(-) mice. (F) Protein expressions of p-IRS-1, IRS-1, p-Akt, Akt, and GAPDH in skeletal muscle of LF+EV, HF+EV and HF+miR-27a(-) mice. Data for A and B represent the mean ± SD, n=5, *p<0.05, **p<0.01 compared to LF mice. Data for D and E represent mean ± SD, n=5, **p<0.01 compared to LF+EV mice, #p<0.05 and ##p<0.01 compared to HF+EV mice.
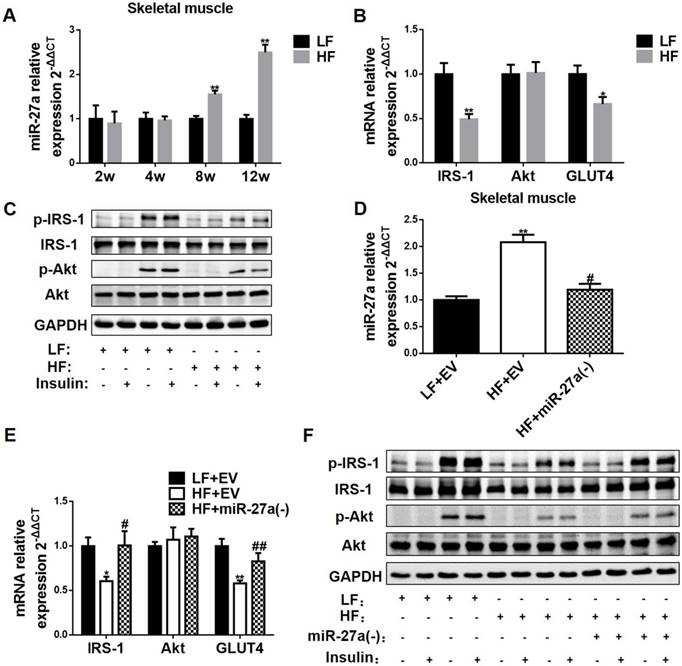
To confirm the involvement of miR-27a in the development of insulin resistance in skeletal muscle of 12-week HF mice, we knocked down miR-27a and determined expressions of key proteins in insulin-dependent glucose uptake in skeletal muscle. MiR-27a expression was higher in HF+EV mice compared to LF+EV mice, and adenoviral knockdown of miR-27a in HF+miR-27a(-) mice reduced miR-27a expression in skeletal muscle (Figure 3D). The mRNA expressions of IRS-1 and GLUT4 were decreased in HF+ EV mice compared to LF+ EV mice, and adenoviral knockdown of miR-27a in HF+miR-27a(-) mice restored IRS-1 and GLUT4 mRNA levels to that observed in LF+ EV mice (Figure 3E). Adenoviral knockdown of miR-27a in HF+miR-27a(-) mice increased insulin-stimulated p-IRS-1 and p-Akt protein expressions compared to HF+ EV mice (Figure 3F). These results suggest that miR-27a may play a key role in the development of insulin resistance in skeletal muscle.
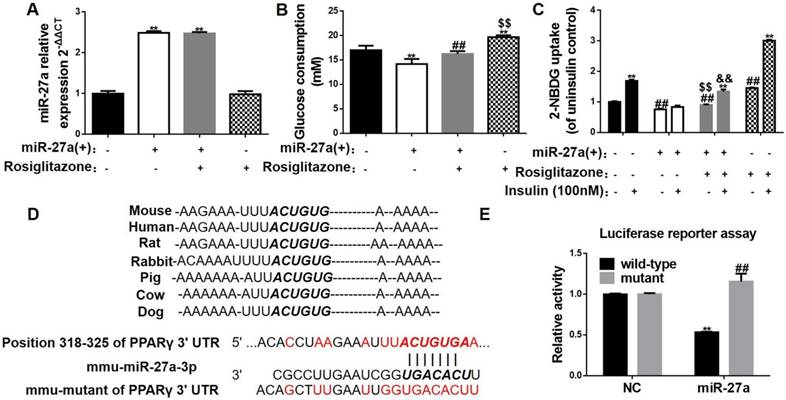
To further confirm a role for miR-27a in promoting an insulin signaling disorder in skeletal muscle and key insulin signaling pathway proteins, glucose uptake and consumption were determined in C2C12 cells overexpressing miR-27a. MiR-27a was increased 2.48-fold in cells overexpressing miR-27a [miR-27a(+)] compared to control (NC) (Figure 4A). Glucose consumption and glucose uptake were reduced in miR-27a(+) cells compared to control (Figure 4B-C). Insulin stimulation failed to increase glucose uptake in miR-27a(+) cells compared to control (Figure 4C). The mRNA expressions of IRS-1 and GLUT4 were lower in miR-27a(+) cells compared to control (NC) (Figure 5H). Protein expression of IRS-1 was lower in miR-27a(+) cells compared to control (Figure 5I-K). In addition, insulin-stimulated p-IRS-1 and p-Akt were lower in miR-27a(+) cells compared to control (NC) (Figure 5I, K-L). Together, the above data indicate that miR-27a may impair insulin signaling and lead to insulin resistance in skeletal muscle.
MiR-27a impairs glucose consumption in C2C12 cells by targeting PPARγ. (A) Expressions of miR-27a in control (black), miR-27a(+) (open), miR-27a+rosiglitazone (grey), and rosiglitazone (hatched) C2C12 cells. Data represent mean ± SD, n=4, **p<0.01 compared to control. (B) Glucose consumption in the above C2C12 cells. Data represent mean ± SD, n=6, **p<0.01 compared to control, ##p<0.01 compared to miR-27a(+), $$p<0.01 compared to miR-27a(+)+rosiglitazone. (C) Glucose uptake in the above C2C12 cells incubated with (+) or without (-) 100 nM insulin for 30 min. Data represent mean ± SD, n=6, **p<0.01 compared to its corresponding basal group without insulin stimulation, ##p<0.01 compared to control without insulin stimulation, $$p<0.01 compared to miR-27a(+) without insulin stimulation, &&p<0.01 compared to miR-27a(+) insulin stimulation. (D) The sequences of mmu-miR-27a-3p and position 318-325 of PPARγ 3'UTR complement each other by the prediction of targetscan. (E) Luciferase reporter test of miR-27a and PPARγ. Data represent mean ± SD, n=3, **p<0.01 compared to negative control (NC) wild-type PPARγ.
MiR-27a impairs insulin-mediated signal transduction in skeletal muscle via PPARγ inhibition. The mRNA (A) and protein (B-C) expressions of PPARγ in skeletal muscle of 12-week LF and HF mice. Data represent mean ± SD, n=5, *p<0.05 and **p<0.01 compared to LF. The mRNA (D) and protein (E-F) expressions of PPARγ in skeletal muscle of LF+EV, HF+EV and HF+miR-27a(-) mice. Data represent mean ± SD, n=5, **p<0.01 compared to LF+EV; ##p<0.01 compared to HF+EV. (G) Protein expressions of PPARγ in control (black), miR-27a(+) (open), miR-27a+Rosiglitazone (hatched), and Rosiglitazone (grey)-treated C2C12 cells. Data represent mean ± SD, n=4, **p<0.01 compared to control, ##p<0.01 compared to miR-27a(+), &&p<0.01 compared to miR-27a(+)+Rosiglitazone. (H) The mRNA expressions of PPARγ, IRS-1, Akt and GLUT4 in control (black), miR-27a(+) (open) and miR-27a(+) plus Rosiglitazone (hatched)-treated C2C12 cells. (I) Protein expression of PPARγ, p-IRS-1, IRS-1, p-Akt, Akt and GAPDH in control and miR-27a(+) cells treated with (+) or without (-) Rosiglitazone or insulin. Relative expressions of PPARγ/GAPDH (J), p-IRS-1/IRS-1, IRS-1/GAPDH (K) and p-Akt/Akt, Akt/GAPDH (L) for the above cells. I: 100 nM insulin. Data for H-L represent mean ± SD, n=4, *p<0.05 and **p<0.01 compared to control, #p<0.05 and ##p<0.01 compared to miR-27a(+), &&p<0.01 compared to miR-27a(+)+Rosiglitazone, $$ p<0.01 compared to miR-27a(+)+insulin.
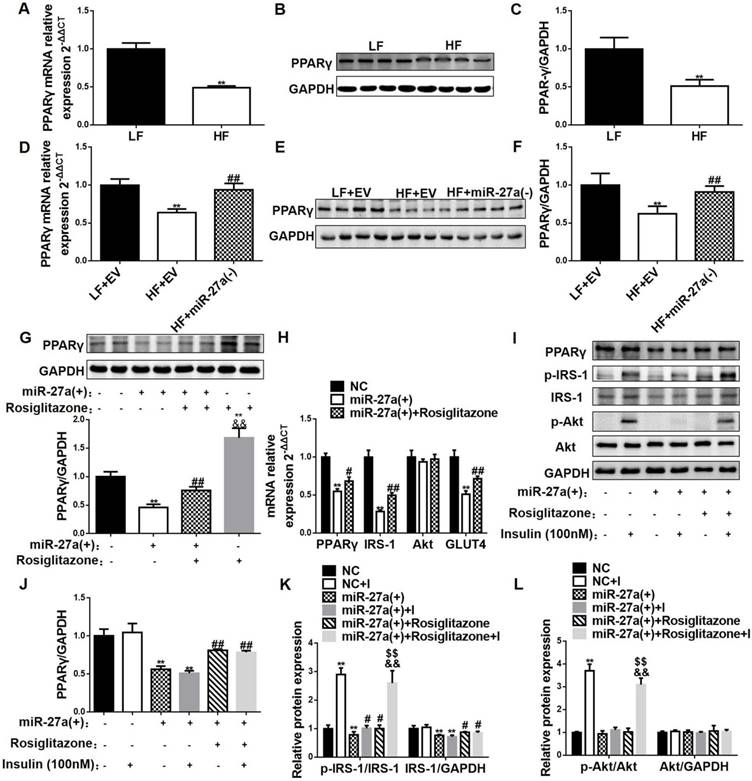
MiR-27a impairs insulin signaling in skeletal muscle through PPARγ inhibition
PPARγ is a potent modulator of whole-body insulin sensitivity, and promotes glucose uptake in skeletal muscle. Bioinformatic prediction indicated that miR-27a may negatively regulate PPARγ (Figure 4D). The results of the luciferase assay test showed that miR-27a significantly decreased luciferase density via binding to the sequence of wild-type PPARγ 3'UTR, while no reduction was found with the mutant PPARγ 3'UTR (Figure 4E), confirming that PPARγ is indeed a direct target of miR-27a. The mRNA and protein expressions of PPARγ in skeletal muscle were lower in 12-week HF mice compared with LF mice (Figure 5A-C). MiR-27a knockdown in HF mice increased mRNA and protein expressions of PPARγ, and this coincided with increased insulin sensitivity of skeletal muscle (Figure 5D-F). These data indicate that PPARγ might be a target of miR-27a in the impairment of insulin signaling in skeletal muscle.
To identify a key role for PPARγ in the miR-27a-mediated impairment of insulin signaling, expressions of key insulin signaling proteins, glucose consumption and uptake were determined in C2C12 cells overexpressing miR-27a treated with or without the PPARγ activator rosiglitazone. Rosiglitazone treatment increased glucose consumption in both control cells and cells overexpressing miR-27a compared to untreated cells (Figure 4B), and increased glucose uptake and insulin-stimulated glucose uptake in both control cells and cells overexpressing miR-27a (Figure 4C). Rosiglitazone treatment partially increased PPARγ mRNA and protein expressions in cells overexpressing miR-27a (Figure 5G-J). In addition, rosiglitazone treatment increased mRNA expressions of IRS-1 and GLUT4 in cells overexpressing miR-27a (Figure 5H), and increased insulin-stimulated p-IRS-1 protein and its downstream p-Akt protein expressions in cells overexpressing miR-27a (Figure 5K-L). Overall, these results demonstrate that PPARγ may serve as a key target of miR-27a-induced insulin resistance in skeletal muscle.
Lipid-laden adipocytes, but not macrophages, secrete miR-27a into exosomes
Adipose tissue is recognized as a main source of circulating miRNAs in the obese state [17]. Serum miR-27a levels were increased temporally in HF mice compared to LF mice, and increased in db/db mice compared to db/m mice (Figure 1E, K). MiR-27a expression was increased in visceral adipose tissue of mice fed a high-fat diet for 2 weeks compared to LF fed mice (Figure 6A). Surprisingly, visceral adipose tissue miR-27a expression was lower in HF mice compared to LF mice after 4 weeks of feeding. In addition, db/db mice exhibited lower expression of miR-27a in visceral adipose compared to db/m mice (Figure 6B). MiR-27a knockdown in HF fed mice resulted in a decrease in miR-27a level in visceral adipose tissue (Figure 6C).
Adipocytes from HF diet-fed mice release miR-27a, and palmitate-treated 3T3-L1 adipocytes secrete miR-27a. (A) Relative expressions of miR-27a in visceral adipose tissue of LF and HF mice at 2, 4, 8 and 12 weeks. Data represent mean ± SD, n=4, *p<0.05 and **p<0.01 compared to LF. The week-group interaction was F=11.2, p<0.01. (B) Relative expressions of miR-27a in visceral adipose tissue of db/m and db/db mice. Data represent mean ± SD, n=4, *p<0.05 compared to db/m. (C) The miR-27a levels in visceral adipose tissue of LF+EV, HF+EV and HF+miR-27a(-) mice. Data represent mean ± SD, n=5, **p<0.01 compared to LF+EV, ##p<0.01 compared to HF+EV. (D) Oil red O staining of control (Con) and palmitate (Pal)-treated 3T3-L1 cells. Upper panel, 100x magnification; lower panel, 400x magnification. The OD of oil red O staining (E) and triglyceride concentration (F) of the above cells. The relative expressions of miR-27a in cells (G) and supernatant (H) of control (Con) and palmitate (Pal)-treated cells. Data for E-H represent mean ± SD, n=6, **p<0.01 compared to Con.
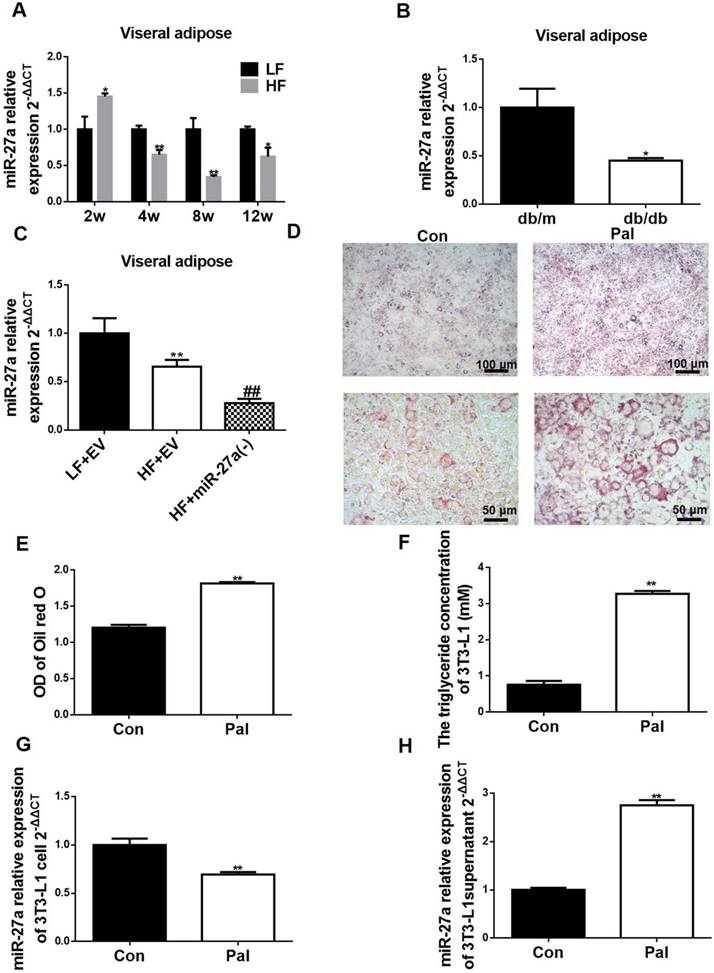
We determined if the elevated serum miR-27a in these animal models of obesity could be derived from secretion of miR-27a from adipocytes. Differentiated 3T3-L1 cells were treated in the absence or presence of 0.3 mM palmitate for 48 h to mimic lipid drop accumulation in adipose of HF mice, and miR-27a expression and secretion were determined. An increase in lipid accumulation was observed in palmitate-treated cells (Pal) compared to control (Figure 6D-E). This coincided with an increase in TAG concentration (Figure 6F). Consistent with the in vivo animal models of obesity, miR-27a expression was lower in palmitate-treated 3T3-L1 cells compared to control (Figure 6G). In contrast, miR-27a levels in the supernatant of palmitate-treated cells was 2.7-fold higher than control cells (Figure 6H). Macrophages are present in adipose tissue of obese individuals. To determine whether miR-27a secreted from adipose tissue in the obese state was derived from macrophages or adipocytes, RAW264.7 macrophages were incubated with various concentrations of palmitate (0-0.4 mM) for up to 48 h, and cell viability and expression of miR-27a were determined. Treatment of RAW264.7 cells with palmitate did not affect miR-27a release into the supernatant under all conditions examined (Figure S4). Thus, the elevated expression of miR-27a in the supernatant is likely due to its release from adipocytes in the obese state.
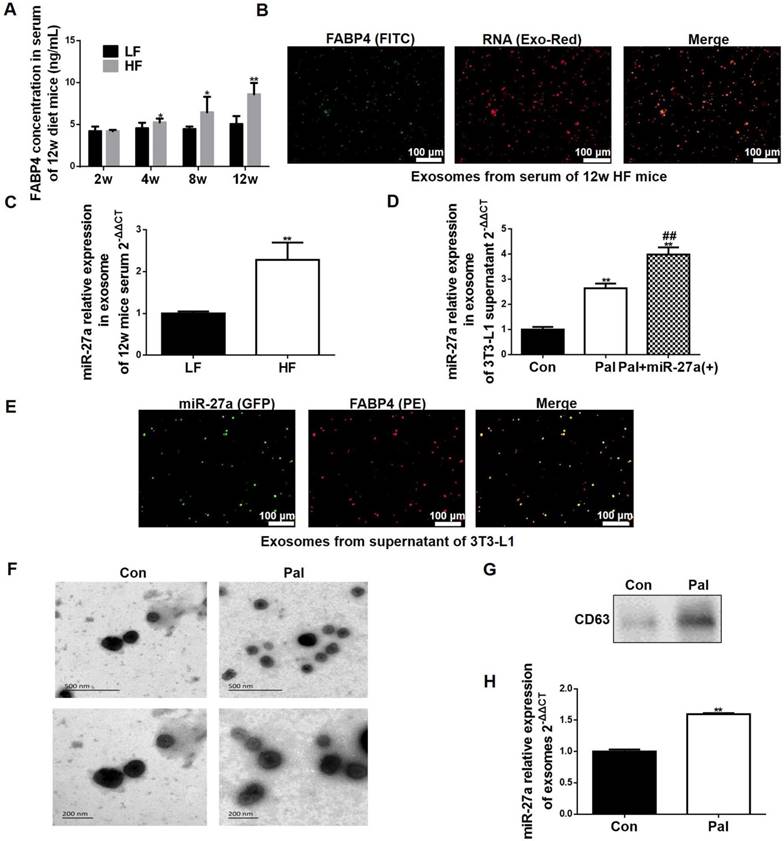
FABP4 is a specific marker of adipocyte-derived exosomes [18]. We examined serum FABP4 levels in LF and HF animals. Serum FABP4 levels were increased in the HF group compared to the LF group by 4 weeks of feeding (Figure 7A). In addition, serum exosomes were FABP4 positive, and miR-27a accumulation in these exosomes from the serum of HF mice were higher compared to LF mice (Figure 7B-C). We next examined if lipid loading of adipocytes expressing miR-27a increased miR-27a release in exosomes. Treatment of 3T3-L1 cells with palmitate increased miR-27a release into the supernatant compared to controls (Figure 7D). Treatment of 3T3-L1 cells overexpressing miR-27a with palmitate increased miR-27a mRNA release into the supernatant to a greater extent than control cells treated with palmitate. In supernatant of 3T3-L1 cells overexpressing miR-27a treated with palmitate, miR-27a was co-localized with FABP4 (Figure 7E). This was further confirmed by scanning electron microscopy of exosomes and identification of the exosome marker CD63 in the supernatant of 3T3-L1 treated with palmitate (Figure 7F-H). Thus, lipid-laden adipocytes secrete miR-27a into exosomes.
Lipid-loaded adipocyte-derived miR-27a is secreted in exosomes. (A) FABP4 concentration in sera of 2, 4, 8 and 12-week LF and HF mice. Data represent mean ± SEM, n=10, *p<0.05, **p<0.01 compared to LF. (B) Fluorescence images of FITC-labeled FABP4 and Exo-Red-stained exosomes extracted from serum of 12 week HF mice. Bar: 100 nm. (C) MiR-27a levels in exosomes extracted from serum of 12-week LF and HF mice. Data represent mean ± SD, n=6, **p<0.01 compared to LF. (D) MiR-27a levels in exosomes extracted from the supernatant of control (Con), or palmitate (Pal)-treated 3T3-L1 cells expressing miR-27a (Pal+miR-27a(+)). Data represent mean ± SD, n=6, **p<0.01 compared to Con, ##p<0.01 compared to Pal. (E) Fluorescence images of PE-labeled FABP4 and miR-27a containing GFP in exosomes extracted from medium of Pal+miR-27a(+) cells. Bar: 100 nm. (F) Scanning electron micrographs of exosomes from 3T3 cells incubated in the absence (Con) or presence (Pal) of 0.3 mM palmitate for 48 h. Top panel bar: 500 nm, Bottom panel bar: 200 nm. (G) CD63 in the above cells. (H) miR-27a expressions in exosomes of the above cells. Data represent mean ± SD, n=3, **p<0.01 compared to Con.
Adipocyte-derived exosomal miR-27a is taken up by C2C12 skeletal muscle cells
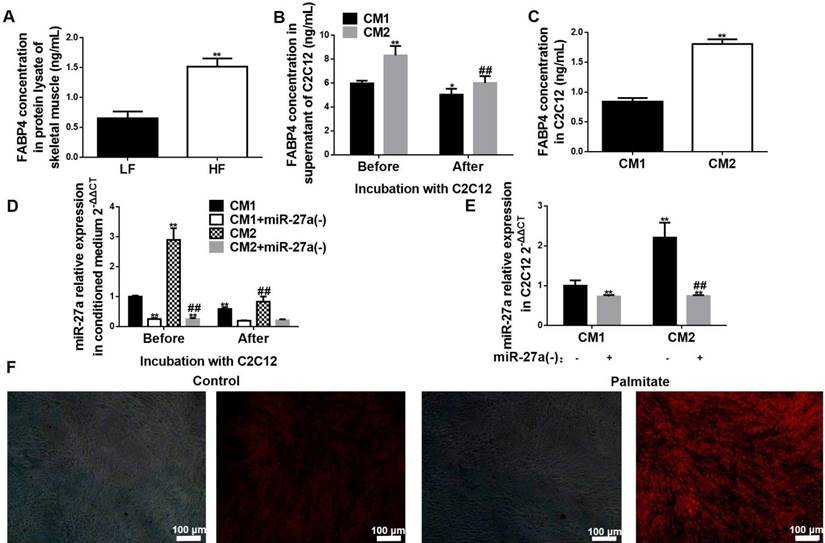
We next determined if exosome-derived miR-27a from adipocytes could be taken up by skeletal muscle. We initially determined if FABP4 was expressed in skeletal muscle. Expression of FABP4 protein was increased in lysates of skeletal muscle of HF compared to LF mice (Figure 8A). Next, C2C12 cells were incubated for 48 h with conditioned medium prepared from either control (CM1) or palmitate-treated (CM2) adipocytes. FABP4 and miR-27a levels in the supernatant were reduced after incubation of C2C12 cells with either CM1 or CM2 medium for 48 h (Figure 8B, D). In contrast, FABP4 protein and miR-27a levels were elevated in C2C12 cells incubated with CM2 compared to CM1 (Figure 8C, E). To determine whether other components of the medium resulted in miR-27a generation within C2C12 cells, C2C12 were incubated with conditioned medium prepared from control or palmitate-treated 3T3-L1 cells in which miR-27a was knocked down. There was minimal expression of miR-27a in C2C12 cells incubated with conditioned medium prepared from either control or palmitate-treated 3T3-L1 cells in which miR-27a was knocked down (Figure 8E). Next, fluorescently labeled exosomes isolated from the supernatant of either control or palmitate-treated adipocytes were co-incubated with C2C12 cells for 48 h. Fluorescence intensity was greater in C2C12 incubated with supernatant from palmitate-treated adipocytes compared to control (Figure 8F). These data suggest that lipid-loaded adipocytes secrete more miR-27a containing exosomes than normal adipocytes, and that adipocyte-derived exosomal miR-27a is taken up by skeletal muscle cells.
Adipocyte-secreted exosomal miR-27a is taken up by C2C12 cells. (A) FABP4 concentrations in skeletal muscle of LF and HF mice. Data represent mean ± SD, n=5, **p<0.01 compared to LF. The week-group interaction was F=7.02, p<0.01. (B) FABP4 concentrations in the supernatant of C2C12 cells before or after incubation with CM1 or CM2 medium. Data represent mean ± SD, n=6, *p<0.05 and **p<0.01 compared to CM1 before treatment, ##p<0.01 compared to CM2 before treatment. (C) FABP4 concentrations in C2C12 cells after incubation with CM1 or CM2. Data represent mean ± SD, n=6, **p<0.01 compared to CM1. (D) MiR-27a levels in medium of C2C12 cells after incubation with CM1 (black), CM1+miR-27a(-) (open), CM2 (hatched) or CM2+miR-27a(-) (grey) before or after incubation. Data represent mean ± SD, n=6, **p<0.01 compared to CM1 before treatment, ##p<0.01 compared to CM2 before treatment. (E) MiR-27a levels in C2C12 cells after incubation with CM1, CM1+miR-27a(-), CM2 or CM2+miR-27a(-) conditioned medium. Data represent mean ± SD, n=6, **p<0.01 compared to CM1, ##p<0.01 compared to CM2. (F) Fluorescence images of C2C12 cells co-incubated with Exo-Red-labeled exosomes from control (Con) or palmitate-treated 3T3-L1 cells (Pal). Bar: 100 nm.
Adipocyte-derived miR-27a accumulates in skeletal muscle cells, and impairs insulin signaling via repression of PPARγ
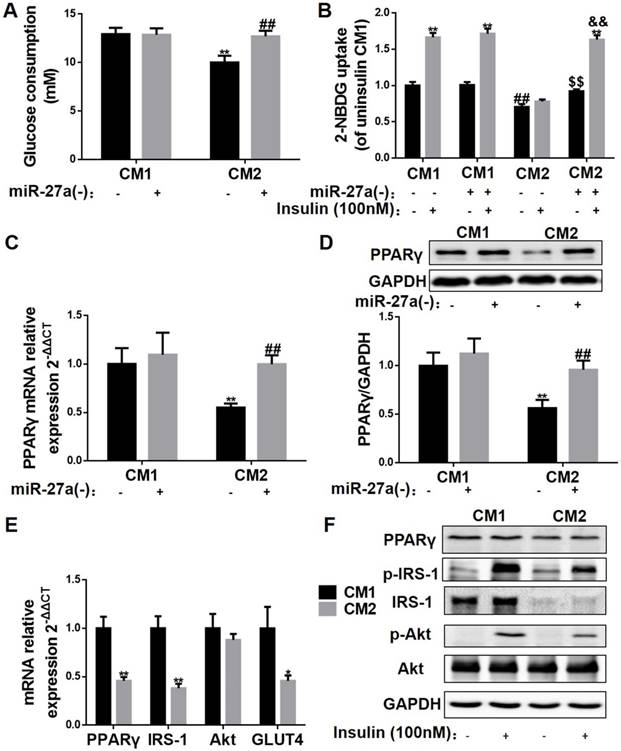
To determine the mechanism of the miR-27a-induced impairment in insulin signaling in skeletal muscle, C2C12 cells were incubated with conditioned medium prepared from control (CM1) and palmitate-treated 3T3-L1 (CM2) adipocytes, and glucose uptake, glucose consumption and expressions of key insulin signaling proteins were determined. Glucose consumption, glucose uptake and insulin-stimulated glucose uptake were reduced in CM2-treated C2C12 cells compared to CM1-treated cells (Figure 9A-B). In contrast, glucose consumption, glucose uptake and insulin-stimulated glucose uptake were unaltered in C2C12 cells incubated with CM1 or CM2 medium prepared from 3T3-L1 cells in which miR-27a was knocked down (Figure 9A-B). Moreover, obvious reductions in PPARγ mRNA and protein levels were observed in the CM2 group compared to the CM1 group, which were restored by miR-27a knockdown in the CM2 group (Figure 9C-D). To determine whether palmitate incubation itself altered miR-27a expression in skeletal muscle, C2C12 cells were incubated with various concentrations of palmitate (0-0.5 mM) for 48 h, and cell viability, glucose uptake, and expression of miR-27a were determined. No alteration in glucose consumption nor miR-27a expression in the supernatant were observed in cells incubated with concentrations of palmitate that did not alter cell viability (Figure S5). Finally, we examined expressions of key factors involved in the regulation of insulin signaling in skeletal muscle. PPARγ, IRS-1 and GLUT4 mRNA expressions were reduced, and insulin-stimulated p-IRS-1 and p-AKT were reduced in CM2-treated C2C12 cells compared to CM1-treated cells (Figure 9E-F). Collectively, the above results suggest that adipose tissue-derived miR-27a impairs insulin signaling via repression of PPARγ in skeletal muscle.
Adipocyte-derived miR-27a increases miR-27a, and impairs insulin signaling in C2C12 cells. (A) Glucose consumption of C2C12 cells incubated with CM1 or CM2 medium prepared from 3T3-L1 cells with or without knockdown of miR-27a. Data represent mean ± SD, n=6, **p<0.01 compared to CM1, ##p<0.01 compared to CM2. (B) C2C12 cells were incubated under the above conditions in the absence (-) or presence (+) of insulin, and 2-NBDG uptake was determined. Data represent mean ± SD, n=6, **p<0.01 compared to their related basal group without insulin stimulation, ##p<0.01 compared to CM1 without insulin stimulation, $$p<0.01 compared to CM2 without insulin stimulation, &&p<0.01 compared to CM2 with insulin stimulation. The mRNA (C) and protein (D) expressions of PPARγ in C2C12 cells incubated with CM1 or CM2 medium prepared from 3T3-L1 cells with or without knockdown of miR-27a. Data represent mean ± SD, n=4, **p<0.01 compared to CM1 without insulin stimulation, ## p<0.01 compared to CM2 without insulin stimulation. (E) The mRNA expressions of PPARγ IRS-1, Akt and GLUT4 in C2C12 incubated with CM1 or CM2. Data represent mean ± SD, n=6, *p<0.05, **p<0.01 compared to CM1. (F) Protein expressions of PPARγ, p-IRS-1, IRS-1, p-Akt, Akt and GAPDH in C2C12 incubated with CM1 or CM2 and incubated with (+) or without (-) insulin. n=4.
Discussion
Substantial experimental evidences have confirmed an endocrine crosstalk between adipose tissue and skeletal muscle [19-21]. However, the molecular mechanism by which adipocyte-derived endocrine factors promote insulin resistance of skeletal muscle are not fully understood. In the current study, we demonstrated that adipose-derived exosomal miR-27a is taken up by skeletal muscle, and this results in impairment of insulin-dependent glucose uptake into skeletal muscle in the obesity-triggered insulin resistance state. The principal findings of our study are 1. MiR-27a plays a key role in obesity-induced insulin resistance in skeletal muscle; 2. MiR-27a is secreted by lipid-loaded adipocytes in exosomal form, and is taken up by skeletal muscle cells; and 3. Adipose-derived miR-27a induces insulin resistance in skeletal muscle via PPARγ repression.
MiR-27a is an adipogenic and lipogenic regulator known to alter macrophage polarization, brown adipogenesis, CHOL homeostasis and production of inflammatory factors [8, 22-25]. Microarray analysis and meta-analysis indicated that serum miR-27a is elevated and positively correlated with the level of fasting glucose in obese and obese-related T2DM patients [10, 11]. The result from our clinical observations in obese children (positive correlation of miR-27a with BMI) was consistent with a previous report in obese adults [26]. We previously demonstrated a correlation between miR-27a and insulin resistance in high-fat diet-induced obese mice [27]. In the current study, we also showed that miR-27a was positively associated with insulin resistance in a genetic model of T2DM, the db/db mice. Unexpectedly, miR-27a knockdown in high-fat diet-fed mice resulted in an increase in percentage fat distribution, but improvement of insulin resistance. MiR-27a has been shown to repress adipogenesis and adipocyte differentiation by directly targeting PPARγ [8, 9]. PPARγ activation increases the number of small adipocytes, which are more sensitive to insulin [28]. This may explain why miR-27a knockdown induced an increase in fat distribution, but resulted in a beneficial effect on insulin resistance in the current study. These studies suggest that an increase in circulating miR-27a may play a key role in the development of obesity-induced insulin resistance.
Adipose tissue is the major source of circulating exosomal miRNAs, and adipocyte-derived exosomes may contribute to the development of insulin resistance in the obese state [14, 29, 30]. Thus, it is possible that elevated miR-27a in the serum of obese patients may be derived from exosomes secreted by adipose tissue. In our study, adipose tissue miR-27a expression was initially increased after 2 weeks of feeding mice with a high-fat diet, then reduced after 4 weeks of feeding, supporting a previous observation in adipose tissue of obese humans [31]. We confirmed that serum exosomes were FABP4 positive, and that miR-27a was expressed in both serum and serum exosomes of obese mice. A previous study demonstrated that adipose tissue macrophages in obese mice secreted miRNA-containing exosomes [32]. In that study, the authors performed deep sequencing analysis of miRNAs from both lean and obese adipose tissue macrophage-derived exosomes, and observed no miR-27a in differential expression of exosomal miRNAs [32]. In the current study, we did not observe the alteration in miR-27a secretion into the supernatant of RAW264.7 macrophages treated with various doses of palmitate. These data suggest that the increase in miR-27a in the serum of obese mice is not due to secretion from adipocyte tissue macrophages. These data suggest that increased levels of circulating exosomal miR-27a in the obese state may be derived from adipose tissue.
Skeletal muscle is the major tissue for disposal of ingested glucose in normal glucose-tolerant individuals, and dysfunction of glucose disposal in skeletal muscle results in systemic insulin resistance [33]. A previous study indicated that co-silencing of miR-106b, miR-27a and miR-30d enhanced glucose consumption and glucose uptake in L6 skeletal muscle cells [34]. In the current study, in mice fed a high-fat diet for 12 weeks, decreases in expressions and activities of key proteins of insulin signaling and insulin-dependent glucose uptake were observed, and whole-body knockdown of miR-27a attenuated these effects. In vitro overexpression of miR-27a in C2C12 cells inhibited glucose consumption and glucose uptake. These data suggest that miR-27a may play a key role in the development of insulin resistance in skeletal muscle.
Whether miR-27a may serve as a messenger between adipose tissue and skeletal muscle was unknown. Adipocytes from high-fat diet-induced obese mice secreted significant miR-27a into circulation, and miR-27a was elevated in skeletal muscle of these mice. FABP4, an exosomal marker, was elevated in serum exosomes of mice fed a HF diet, and this coincided with an increase in exosomal miR-27a. Moreover, FABP4 levels were elevated in the skeletal muscle of these mice. Incubation of 3T3-L1 adipocytes with palmitate increased FABP4-labeled miR-27a secretion into the medium, and incubation of C2C12 skeletal muscle cells with this medium resulted in an increase in miR-27a taken up into C2C12 cells from the medium. MiR-27a expression was not elevated in C2C12 skeletal muscle cells incubated with palmitate alone. Finally, there was no alteration in the level of miR-27a taken up into C2C12 cells incubated with medium derived from palmitate-treated 3T3-L1 cells with miR-27a knockdown in which exosomal secretion of miR-27a was reduced. Together, these data indicate that adipocyte-derived exosomal miR-27a can be taken up by skeletal muscle cells. Thus, the elevated levels of miR-27a observed in skeletal muscle in the obese insulin-resistant state are likely due to uptake of miR-27a derived from adipocytes, and not through endogenous production in skeletal muscle. Hence, modulation of miR-27a expression in skeletal muscle may serve as an approach to prevent obesity-triggered insulin resistance.
PPARγ is closely associated with insulin resistance in skeletal muscle, and plays a key role in the glucose uptake pathway of skeletal muscle through modulation of GLUT4 and IRS-1 expressions [16]. Thiazolidinediones (TZDs) are canonical PPARγ-dependent trans-activators that are used clinically as insulin sensitizers [35, 36]. A previous study showed that induction of PPARγ expression in adipocytes improved insulin resistance in obese mice [37]. In addition, knockout of PPARγ in mouse skeletal muscle was shown to result in progressive insulin resistance [17]. Moreover, rosiglitazone has been reported to not only induce activity of endogenous PPARγ, but also increase the expression of PPARγ [38-40]. PPARγ has been identified as a direct target of miR-27a through bioinformatic prediction. MiR-27a inhibited lipid synthesis and adipocyte differentiation through inhibition of PPARγ [8, 41]. However, it was unknown if PPARγ is a direct target of miR-27a involved in the development of insulin resistance in skeletal muscle. In the current study, miR-27a knockdown in high-fat diet-fed mice increased mRNA and protein expression of PPARγ, and this coincided with increased insulin sensitivity of skeletal muscle. We used rosiglitazone to determine the interaction between miR-27a and PPARγ in insulin resistance in skeletal muscle. In C2C12 cells overexpressing miR-27a, glucose consumption and uptake were reduced, and rosiglitazone treatment of these cells partially reversed this. In addition, rosiglitazone treatment increased mRNA expressions of PPARγ, IRS-1 and GLUT4 in C2C12 cells overexpressing miR-27a. These results suggest that PPARγ might serve as a key target in miR-27a-mediated insulin resistance in skeletal muscle. In conclusion, adipose tissue-derived miR-27a may play a key role in development of obesity-triggered insulin resistance in skeletal muscle.
In conclusion, this study contributes to our current understanding of the crosstalk between adipose tissue and skeletal muscle in obesity-triggered insulin resistance. The negative effects of adipocyte tissue-derived exosomal miR-27a in promoting insulin resistance of skeletal muscle suggest that modulation of miR-27a expression may serve as a therapeutic approach to obesity-triggered metabolic syndrome and type 2 diabetes.
Materials and methods
Clinical subject study
The clinical subject study was performed in The First Clinical Hospital, affiliated with Jilin University, from September 2013 to May 2014. 45 children, 6-15 years old with diagnosed obesity (OB group) and 45 age-matched non-obese controls (NW group) were recruited. The height (m) and weight (kg) were measured during each clinic visit. BMI was calculated as weight (kg)/height2 (m2), and was converted into age- and gender-specific BMI percentiles based on the CDC growth chart. Overweight was defined as BMI > 85%, and obesity defined as BMI > 95% [42]. Patients with chronic systemic disorders, such as Cushing's syndrome, cystic fibrosis, and cardiac, renal or gastrointestinal diseases, or patients who had been treated with insulin sensitizers including metformin were excluded from the study. The study was approved by the Ethics Review Board of Jilin University and written informed consent was obtained from all subjects and their parents before participation in the study. Blood samples were obtained after a 12 h fast, placed into serum tubes, which were centrifuged at 3,500 × g for 15 min at 4 °C, and the resulting serum samples were split and stored at minus 80 °C until needed.
Animal studies
C57BL/6J male mice and db/db leptin receptor-deficient male mice were obtained from Beijing HFK Bioscience Co. Ltd (SCXK(Jing)2014-0004). All mice were housed individually on a 12 h light-dark cycle in the temperature-controlled animal room. C57BL/J6 mice were fed a low-fat diet (LF, n=40) (10% kcal% fat, D12450B) or high-fat diet (HF, n=40) (60% kcal% fat, D12492i, Research Diets, USA) for up to 12 weeks. Body weight and food intake were measured biweekly. At 2, 4, 8 and 12 weeks post treatment, mice were fasted for 12 h, and blood was collected from the orbital venous plexus. Serum was separated by centrifugation at 3500 × g for 15 min. Serum fasting blood glucose (FBG), glucose, total cholesterol (CHOL), triglyceride (TAG) (Nanjing Jiancheng, China) and insulin (ALPCO, USA) were determined as per the manufacturer's instructions. Oral glucose tolerance test (OGTT) and insulin tolerance test (ITT) were measured at 2, 4, 8 and 12 weeks as described below. Fat distribution was determined using a Dexa Scanner. Eight-week-old db/m mice (control, n=10) and db/db mice(n=10) were housed for 4 weeks, then body weight, Lee's index, fasting blood glucose, miR-27a expression and OGTT area under the curve were measured as described below.
For miR-27a knockdown in C57BL/J6 mice, mice were separated into three groups: empty adenoviral vector (hU6-MCS-Ubiquitin-EGFP-IRES-puromycin-mmu-miR-27a-3p-inhibition) fed low-fat diet (LF+EV, n=10), empty adenoviral vector fed high-fat diet (HF+EV, n=10), and miR-27a adenoviral knockdown (mmu-miR-27a-3p-inhibition sequence 5'-GCGGAACTTAGCCACTGTGAA-3') fed high-fat diet (HF+miR-27a(-), n=10)). After 8 weeks of feeding, adenovirus (100 μL adenovirus, 2 × 10⁷ TU/mL, Genechem, China) was injected via the tail vein. 4 weeks post-injection, OGTT, ITT, and fat distribution were determined. In some experiments, half of each group of animals was injected with 0.75 IU/kg body weight insulin (Novolin R, Denmark) (i.p.) 15 min before sacrifice, and the serum was obtained for biochemical analysis.
OGTT and ITT
For OGTT, mice were fasted overnight for 12 h, then orally gavaged with 2 g/kg body weight of glucose dissolved in water. 10 uL blood was obtained from the tail tip, and glucose measured at 0, 30, 60, 90, 120 min using a glucometer (Roche, USA). For ITT, mice were fasted for 2 h, and then injected with 0.5 IU/kg body weight insulin (i.p.). 10 uL blood was obtained from the tail tip, and glucose measured at 0, 15, 30, 60, 120 min as above.
Cell culture studies
Mouse pre-adipocyte fibroblast 3T3-L1 and mouse myoblast C2C12 cell lines (ATTC, USA) were cultured in Dulbecco's modified Eagle's medium (DMEM) and 10% bovine calf serum (Gibco, USA) in an atmosphere of 5% CO2 at 37 °C. For differentiation studies, 3T3-L1 cells were incubated with DMEM containing 10 % FBS, 1 μM dexamethasone (Sigma, USA), 0.5 mM IBMX (Sigma, USA) and 10 μg/mL insulin or DMEM containing 10% FBS and 10 μg/mL insulin or DMEM containing 10% FBS in turn. Cell culture medium was changed every two days until the 8th day. Mouse myoblast C2C12 cells (ATCC, USA) (grown to 70% confluence) were cultured in DMEM, and differentiated by incubation with DMEM containing 2% horse serum (Gibco, USA) for 4 days.
3T3-L1 or C2C12 were seeded in 96-well plates at a density of 5 × 10³ per well, and allowed to attach for 24 h at 37 °C. Cells were then incubated with various concentrations of rosiglitazone (0-80 μM) or palmitate (0-0.5 mM) for 48 h. The culture medium was replaced by MTT (0.5 mg/mL), and incubated at 37 ℃ for 4 h. DMSO was added to dissolve the formazan crystals, and the absorbance was measured using an Epoch microplate reader (Biotek, USA) at 562 nm.
In some experiments, differentiated 3T3-L1 cells were incubated with 0.3 mM palmitate for 48 h to mimic adipocytes in the obese state [43]. Cells were then washed with PBS, and fixed in 4% formaldehyde for 30 min, and then stained with 60% oil red O (Sigma, USA) at 37 °C for a further 30 min. Excess stain was washed with distilled water, and the cells were photographed using an Olympus microscope (Tokyo, Japan). The staining solution was redissolved in isopropanol, and absorbance was measured at 510 nm. Intracellular TAG content was determined using a TAG determination kit as per the manufacturer's instructions (Nanjing Jiancheng, China).
MiR-27a overexpression plasmid and shRNA plasmid construction
The expression vectors containing mmu-miR-27a-3p, and its complementary sequence were purchased from GenePharma (China). The mmu-miR-27a-3p sequences were as follows: GTTCACAGTGGCTAAGTTCCGC; the mmu-miR-27a-3p shRNA sequences were as follows: GCGGAACTTAGCCACTGTGAA. The sequence was inserted into pGPU6-GFP-NEO (GenePharma, China). 3T3-L1 cells were incubated with miR-27a plasmid or shRNA plasmid, and treated with without 0.3 mM palmitate for 48 h.
Determination of glucose consumption and glucose uptake in C2C12 cells
Differentiated C2C12 cells were incubated with miR-27a plasmid in the absence or presence of 20 μM rosiglitazone for 48 h. Cells were then cultured in FBS-free DMEM (15 mM D-glucose) supplemented with 0.2% BSA for 48 h. The Glucose concentration in the medium was determined as above. Glucose consumption was calculated from the difference between the initial glucose concentration and the residual glucose concentration of the culture medium. For glucose uptake determination, cells were washed three times with KRB, and incubated with or without 100 nM insulin in glucose-free DMEM for 10 min, and 100 μM 2-[N-(7-nitrobenz-2-oxa-1,3-diazol-4-yl)amino]-2-deoxy-D-glucose (2-NBDG; Invitrogen, USA) was added to the medium for 30 min. The medium was removed, and the cells then were washed twice with ice-cold PBS. The fluorescence intensity in each well was then measured at 485 nm/535 nm (excitation wavelength/emission wavelength) using an Epoch fluorescence microplate reader (Biotek, USA).
MiR-27a transfection of 3T3-L1 and C2C12 cells
Differentiated 3T3-L1 cells were transfected with miR-27a overexpression plasmid, and palmitate-treated 3T3-L1 cells were transfected with miR-27a shRNA plasmid ormiR-27a overexpression plasmid using Lipofectamine 2000 (Invitrogen, USA) for 6 h. The cell medium was replaced by DMEM containing 10% FBS, and incubated for 48 h. Differentiated C2C12 cells were transfected with miR-27a overexpression plasmid using Lipofectamine 2000 for 6 h. Cells were then treated plus or minus 20 μM rosiglitazone for a further 48 h. Then the cells were washed with PBS in preparation for real-time polymerase chain reaction (RT-PCR) analysis or Western blot analysis.
Luciferase reporter test
Cells were grown overnight in 12-well plates, and cotransfected with PPARγ-wild type-3' Luc or PPARγ-Mutant-3' Luc and mmu-miR-27a or negative control (synthesis by v-solid, China) using DharmaFECTDuo transfection reagent (Thermo Scientific, USA) for 48 h, and fluorescence intensity was determined.
MiR-27a quantification
Total RNA isolation from serum, cell supernatant, and exosome solution was performed as described previously [44]. Expression of miRNAs was normalized to ath-miR-156a, which was added exogenously, and was considered the reference miRNA [44]. Primers of miR-27a and miR-156a were obtained from Ribobio (Guangzhou, China). Reverse transcription was performed with a first strand cDNA synthesis kit (Transgen Biotech, China) according to the manufacturer's instructions. RT-PCR was performed on an ABI 7300 using Fast Start Universal SYBR Green Master (Roche, USA) at 95 °C for 10 min, followed by 40 cycles of 95 °C for 15 s and 60 °C for 1 min. The expression levels relative to control were estimated by calculating 2-ΔΔCT (ΔCTsample - ΔCTcontrol). For isolation of total RNA in cells and tissues, total RNA was extracted from 2 × 10⁴/well cell or 100 mg frozen tissue by Trizol reagent (Invitrogen, USA). Reverse transcription and RT-PCR were performed as mentioned above. U6 was used as the internal reference of miR-27a. The expression levels relative to control were estimated by calculating 2-ΔΔCT (ΔCTsample - ΔCTcontrol).
mRNA quantification in cells and tissue
PCR primers used for mRNA quantitation are indicated in Table 1, and were synthesized from Sangon Biotech (China). Total RNA was extracted from 2 × 10⁴ per well cells or 100 mg frozen tissues by Trizol reagent (Invitrogen, USA). Reverse transcription and RT-PCR were performed as above. GAPDH was used as the internal mRNA reference. The expression levels relative to control were estimated by calculating 2-ΔΔCT (ΔCTsample - ΔCTcontrol).
Primer sequences
| Target gene | Forward sense | Reverse sense |
|---|---|---|
| Akt | ATCCCCTCAACAACTTCTCAGT | CTTCCGTCCACTCTTCTCTTTC |
| GAPDH | TGTGTCCGTCGTGGATCTGA | CCTGCTTCACCACCTTCTTGAT |
| GLUT4 | AAGATGGCCACGGAGAGAG | GTGGGTTGTGGCAGTGAGTC |
| IRS-1 | TATGCCAGCATCAGCTTCC | TAAAAACGCACCTGCTGTGA |
| PPARγ | CTGGCCTCCCTGATGAATAA | CGCAGGTTTTTGAGGAACTC |
| miR-27a | TGCGCTTCACAGTGGCTAAGT | CCAGTGCAGGGTCCGAGGTATT |
| miR-156a | GCGGCGGTGACAGAAGAGAGT | CCAGTGCAGGGTCCGAGGTATT |
| U6 | CGCTTCGGCAGCACATATAC | AAATATGGAACGCTTCACGA |
Western blot analysis
Total proteins were extracted from gastrocnemius muscle tissue and C2C12 cells following the manufacturer's protocols (Beyotime, China). Protein concentration was quantified using the BCA protein assay kit (Thermo Fisher Scientific, USA). 80-120 μg protein was separated in a 12% SDS polyacrylamide gel, and electro-transferred onto polyvinylidene difluoride (PVDF) membranes (Bio-Rad, USA). Membranes were blocked with 5% (w/v) BSA for 2 h at room temperature, and then incubated with primary antibodies with light shaking overnight at 4 °C [(PPARγ, sc-7196; IRS-1, sc-7200; Akt, sc-8312; pSer473-Akt, sc-7985-R, Santa Cruz, USA), (pY612-IRS-1,ab66153, abcam, UK), (GAPDH, KM9002, Sungene, China)]. The membranes were washed 3 times for 5 min each with 10 mL of TBST (10 mM Tris-HCl, 150 mM NaCl and 0.1% (v/v) Tween-20), and then incubated with secondary antibody (SA00001-1 and SA00001-2, Proteintech, USA) at room temperature for 2 h. Protein was visualized with enhanced chemiluminescence, and images were generated with a GENE Imaging system (Tannon, China).
C2C12 cell incubation with conditioned medium obtained from palmitate-treated 3T3-L1 cells
Differentiated 3T3-L1 cells were incubated in the absence or presence of 0.3 mM palmitate for 48 h in exosome-free serum. During the differentiated process, the medium of 3T3-L1 was collected every 48 h for the detection of miR-27a. The resulting supernatants were mixed with an equal volume of DMEM medium (containing 2% exosome-free horse serum). Medium from untreated cells was defined as conditioned medium 1 (CM1) and medium from palmitate-treated cells as conditioned medium 2 (CM2). C2C12 cells were then incubated for 48 h with CM1 or CM2. Conditioned medium was collected before and after treatment with C2C12 for the detection of miR-27a expression. Subsequent to incubation, glucose consumption and glucose uptake were determined, and RNA and protein expressions were determined as described above.
To determine whether other components of the medium resulted in miR-27a generation within C2C12 cells, C2C12 were incubated with conditioned medium prepared from control or palmitate-treated 3T3-L1 cells in which miR-27a was knocked down, addressed as CM1+miR-27a(-) and CM2+miR-27a(-), respectively. Subsequent to incubation, glucose consumption and glucose uptake, and RNA and protein expressions were determined. To exclude the effects of palmitate on skeletal muscle in conditioned medium, the effects of palmitate on cell viability, glucose consumption and miR-27a expression in C2C12 were examined, too.
Exosome isolation
Differentiated 3T3-L1 cells were incubated in the absence or presence of 0.3 mM palmitate as above. 10 mL cell culture media was collected and centrifuged at 3,500 × g for 30 min to remove cells and large debris. The resulting supernatants were filtered using a 0.22 μm pore filter, and exosomes were isolated utilizing an Exoquick-TC reagent (System Biosciences, USA) as per the manufacturer's instructions. The resulting pellet was suspended in PBS for exosome applications or further processed for mRNA analysis or protein determination as described above.
Exosome identification
For determination of CD63 expression in exosomes, 30 μg of protein from each sample was separated in a 12% SDS-PAGE gel, transferred to PVDF membrane, and Western blot analysis was performed as described above using CD63 antibody (ab193349, abcam, UK). For determination of miR-27a expression in exosomes, total RNA of exosome solution was extracted and levels of miR-27a determined as described above. For electron microscopy, exosomes were fixed in 4 % paraformaldehyde, and then adsorbed onto formvar-coated copper grids for 20 min in a dry environment. Samples were stained with uranyl oxalate for 5 min followed by methyl cellulose uranyl acetate for 10 min on ice. Excess liquid was wicked off by filter paper, and imaging was performed by electron microscopy (Hitachi H-7600, Japan).
Incubation of C2C12 cells with labeled exosomes from 3T3-L1 cells
Exosomes from control and palmitate-treated 3T3-L1 were extracted and suspended in 500 μL PBS, then labeled with 50 μL Exo-Red by incubating at 37 °C for 10 min. 100 μL ExoQUICK-TC was added to stop the reaction. The mixtures were then incubated at 4 °C for 30 min and centrifuged at 14,000 × g for 10 min. Fluorescently labeled exosomes were suspended in 500 μL PBS. Differentiated C2C12 cells were incubated with labeled exosomes from control or hypertrophic 3T3-L1 for 48 h, then photographed using an IX-71 fluorescence microscope (Olympus, Japan).
Determination of fatty acid binding protein 4 (FABP4) level
The levels of FABP4 in serum, gastrocnemius muscle, culture medium and lysates of C2C12 cells were measured using ELISA according to the manufacturer's instructions (Abnova, China). For extraction of serum samples, blood was taken immediately after sacrifice, and the serum was collected after centrifugation at 3,500 × g for 15 min at 4 °C. Protein lysates were measured with a BCA protein assay kit. The concentration of FABP4 was then calculated based on absorption density determined at 450 nm.
Immunofluorescence of FABP4 and RNA or miR-27a and FABP4 in exosomes
Exosomes from serum were extracted as described above for culture medium. Then the RNA in the exosomes were labeled using Exo-Red and fixed in 2% paraformaldehyde on ice for 30 min. Exosomes were then centrifuged and incubated with 1:20 diluted anti-FABP4 antibody (ab92501, abcam, UK) for 1 h. Exosomes were washed with PBS, and then incubated with 1:200 diluted FITC Goat-anti-Rabbit IgG (GR200G-02C, Sungene, China) for 1 h. After washing, exosomes were examined under an IX-71 fluorescence microscope. For exosomes extracted from culture medium, 3T3-L1 cells were first transfected with miR-27a overexpression plasmid (including GFP), and treated with palmitate for 48 h. Exosomes were then extracted and incubated with anti-FABP4 antibody and PE Goat-anti-Rabbit IgG, and fluorescence microscopy was performed as described above.
Statistical analysis
Data (n>6) are expressed as mean ± standard error (SE). Data (n≤6) are expressed as mean ± standard deviation (SD). Between two groups, analyses were performed using Student's t-test followed by F-test to compare the variances; among three or more groups, analyses were performed using one-way or two-way ANOVA, followed by a post hoc Bonferroni-test to determine individual differences among groups. p<0.05 was considered statistically significant. p<0.01 was considered significantly different. Statistical analyses were carried out using GraphPad Prism version 5.01 for Windows (USA).
Supplementary Material
The supplementary information includes detailed descriptions of correlation analyses between miR-27a and adipocytokines in obese children, body fat distribution, oral glucose tolerance test and insulin tolerance test in high-fat diet-induced obese mice, and the effects of palmitate on miR-27a expressions in RAW264.7 and 3T3-L1. It also contains Figures S1-S5 and Table S1.
Abbreviations
CHOL: cholesterol; CM: conditional medium; EV: empty adenoviral vector; FBG: fasting blood glucose; HF: high-fat diet; HOMA-IR: insulin resistance score; ITT: insulin tolerance test; LF: low-fat diet; INS: insulin; NW: normal weight; OB: obesity; OGTT: oral glucose tolerance test; TAG: triglyceride.
Acknowledgements
This work was conducted in Preclinical Pharmacology R&D Center of Jilin Province and Key Lab of Traditional Medicine for Diabetes of Jilin Province. This study was supported by funds from science and technology development projects of Jilin Province (20140203011YY, 20150311013YY, 20170623062TC), Norman Bethune Program of Jilin University (2015224) and the Heart and Stroke Foundation of Canada (to GMH). G.M.H. is the Canada Research Chair in Molecular Cardiolipin Metabolism.
Ethics Committee Approval and Patient Consent
Approval was obtained for all animal studies under the guidelines of the IACUC of Jilin University. All clinical study was approved by the Ethics Review Board of Jilin University, and written informed consent was obtained from all subjects and their parents before participation in the study.
Competing Interests
The authors declare no competing financial interests.
References
1. Gallagher EJ, Leroith D, Karnieli E. Insulin resistance in obesity as the underlying cause for the metabolic syndrome. Mt Sinai J Med. 2010;77:511-23
2. Broussard JL, Castro AV, Iyer M, Paszkiewicz RL, Bediako IA, Szczepaniak LS. et al. Insulin access to skeletal muscle is impaired during the early stages of diet-induced obesity. Obesity (Silver Spring). 2016;24:1922-8
3. Indrakusuma I, Sell H, Eckel J. Novel Mediators of Adipose Tissue and Muscle Crosstalk. Curr Obes Rep. 2015;4:411-7
4. Meijer RI, Bakker W, Alta CL, Sipkema P, Yudkin JS, Viollet B. et al. Perivascular adipose tissue control of insulin-induced vasoreactivity in muscle is impaired in db/db mice. Diabetes. 2013;62:590-8
5. dos Santos B, Estadella D, Hachul AC, Okuda MH, Moreno MF, Oyama LM. et al. Effects of a diet enriched with polyunsaturated, saturated, or trans fatty acids on cytokine content in the liver, white adipose tissue, and skeletal muscle of adult mice. Mediators Inflamm. 2013;2013:594958
6. Rottiers V, Naar AM. MicroRNAs in metabolism and metabolic disorders. Nat Rev Mol Cell Biol. 2012;13:239-50
7. Liu C, Yao MD, Li CP, Shan K, Yang H, Wang JJ. et al. Silencing Of Circular RNA-ZNF609 Ameliorates Vascular Endothelial Dysfunction. Theranostics. 2017;7:2863-77
8. Kim SY, Kim AY, Lee HW, Son YH, Lee GY, Lee JW. et al. miR-27a is a negative regulator of adipocyte differentiation via suppressing PPARgamma expression. Biochem Biophys Res Commun. 2010;392:323-8
9. Kajimoto K, Naraba H, Iwai N. MicroRNA and 3T3-L1 pre-adipocyte differentiation. RNA. 2006;12:1626-32
10. Villard A, Marchand L, Thivolet C, Rome S. Diagnostic Value of Cell-free Circulating MicroRNAs for Obesity and Type 2 Diabetes: A Meta-analysis. J Mol Biomark Diagn. 2015;6:251
11. Karolina DS, Tavintharan S, Armugam A, Sepramaniam S, Pek SL, Wong MT. et al. Circulating miRNA profiles in patients with metabolic syndrome. J Clin Endocrinol Metab. 2012;97:E2271-6
12. Lawson C, Vicencio JM, Yellon DM, Davidson SM. Microvesicles and exosomes: new players in metabolic and cardiovascular disease. J Endocrinol. 2016;228:R57-71
13. Guo SC, Tao SC, Yin WJ, Qi X, Yuan T, Zhang CQ. Exosomes derived from platelet-rich plasma promote the re-epithelization of chronic cutaneous wounds via activation of YAP in a diabetic rat model. Theranostics. 2017;7:81-96
14. Thomou T, Mori MA, Dreyfuss JM, Konishi M, Sakaguchi M, Wolfrum C. et al. Adipose-derived circulating miRNAs regulate gene expression in other tissues. Nature. 2017;542:450-5
15. Li S, Li J, Fei BY, Shao D, Pan Y, Mo ZH. et al. MiR-27a promotes hepatocellular carcinoma cell proliferation through suppression of its target gene peroxisome proliferator-activated receptor gamma. Chin Med J (Engl). 2015;128:941-7
16. Ahmadian M, Suh JM, Hah N, Liddle C, Atkins AR, Downes M. et al. PPARgamma signaling and metabolism: the good, the bad and the future. Nat Med. 2013;19:557-66
17. Hevener AL, He W, Barak Y, Le J, Bandyopadhyay G, Olson P. et al. Muscle-specific Pparg deletion causes insulin resistance. Nat Med. 2003;9:1491-7
18. Ferrante SC, Nadler EP, Pillai DK, Hubal MJ, Wang Z, Wang JM. et al. Adipocyte-derived exosomal miRNAs: a novel mechanism for obesity-related disease. Pediatr Res. 2015;77:447-54
19. Bleau C, Karelis AD, St-Pierre DH, Lamontagne L. Crosstalk between intestinal microbiota, adipose tissue and skeletal muscle as an early event in systemic low-grade inflammation and the development of obesity and diabetes. Diabetes Metab Res Rev. 2015;31:545-61
20. Trayhurn P, Drevon CA, Eckel J. Secreted proteins from adipose tissue and skeletal muscle - adipokines, myokines and adipose/muscle cross-talk. Arch Physiol Biochem. 2011;117:47-56
21. Pierce JR, Maples JM, Hickner RC. IL-15 concentrations in skeletal muscle and subcutaneous adipose tissue in lean and obese humans: local effects of IL-15 on adipose tissue lipolysis. Am J Physiol Endocrinol Metab. 2015;308:E1131-9
22. Saha B, Bruneau JC, Kodys K, Szabo G. Alcohol-induced miR-27a regulates differentiation and M2 macrophage polarization of normal human monocytes. J Immunol. 2015;194:3079-87
23. Xie N, Cui H, Banerjee S, Tan Z, Salomao R, Fu M. et al. miR-27a regulates inflammatory response of macrophages by targeting IL-10. J Immunol. 2014;193:327-34
24. Alvarez ML, Khosroheidari M, Eddy E, Done SC. MicroRNA-27a decreases the level and efficiency of the LDL receptor and contributes to the dysregulation of cholesterol homeostasis. Atherosclerosis. 2015;242:595-604
25. Sun L, Trajkovski M. MiR-27 orchestrates the transcriptional regulation of brown adipogenesis. Metabolism. 2014;63:272-82
26. Nunez Lopez YO, Garufi G, Seyhan AA. Altered levels of circulating cytokines and microRNAs in lean and obese individuals with prediabetes and type 2 diabetes. Mol Biosyst. 2016;13:106-21
27. Yao F, Yu Y, Feng L, Li J, Zhang M, Lan X. et al. Adipogenic miR-27a in adipose tissue upregulates macrophage activation via inhibiting PPARgamma of insulin resistance induced by high-fat diet-associated obesity. Exp Cell Res. 2017;355:105-12
28. Xu C, Wang LL, Liu HY, Zhou XB, Cao YL, Li S. C333H, a novel PPARalpha/gamma dual agonist, has beneficial effects on insulin resistance and lipid metabolism. Acta Pharmacol Sin. 2006;27:223-8
29. Deng ZB, Poliakov A, Hardy RW, Clements R, Liu C, Liu Y. et al. Adipose tissue exosome-like vesicles mediate activation of macrophage-induced insulin resistance. Diabetes. 2009;58:2498-505
30. Aswad H, Forterre A, Wiklander OP, Vial G, Danty-Berger E, Jalabert A. et al. Exosomes participate in the alteration of muscle homeostasis during lipid-induced insulin resistance in mice. Diabetologia. 2014;57:2155-64
31. Kloting N, Berthold S, Kovacs P, Schon MR, Fasshauer M, Ruschke K. et al. MicroRNA expression in human omental and subcutaneous adipose tissue. PLoS One. 2009;4:e4699
32. Ying W, Riopel M, Bandyopadhyay G, Dong Y, Birmingham A, Seo JB. et al. Adipose Tissue Macrophage-Derived Exosomal miRNAs Can Modulate In Vivo and In Vitro Insulin Sensitivity. Cell. 2017;171:372-84 e12
33. Abdul-Ghani MA, DeFronzo RA. Pathogenesis of insulin resistance in skeletal muscle. J Biomed Biotechnol. 2010;2010:476279
34. Zhou T, Meng X, Che H, Shen N, Xiao D, Song X. et al. Regulation of Insulin Resistance by Multiple MiRNAs via Targeting the GLUT4 Signalling Pathway. Cell Physiol Biochem. 2016;38:2063-78
35. Pershadsingh HA, Moore DM. PPARgamma Agonists: Potential as Therapeutics for Neovascular Retinopathies. PPAR Res. 2008;2008:164273
36. Karak M, Bal NC, Bal C, Sharon A. Targeting peroxisome proliferator-activated receptor gamma for generation of antidiabetic drug. Curr Diabetes Rev. 2013;9:275-85
37. Soares FL, de Oliveira Matoso R, Teixeira LG, Menezes Z, Pereira SS, Alves AC. et al. Gluten-free diet reduces adiposity, inflammation and insulin resistance associated with the induction of PPAR-alpha and PPAR-gamma expression. J Nutr Biochem. 2013;24:1105-11
38. Rak-Mardyla A, Karpeta A. Rosiglitazone stimulates peroxisome proliferator-activated receptor gamma expression and directly affects in vitro steroidogenesis in porcine ovarian follicles. Theriogenology. 2014;82:1-9
39. Sharma I, Monga R, Singh N, Datta TK, Singh D. Ovary-specific novel peroxisome proliferator activated receptors-gamma transcripts in buffalo. Gene. 2012;504:245-52
40. Wei J, Li Z, Yuan F. Evodiamine might inhibit TGF-beta1-induced epithelial-mesenchymal transition in NRK52E cells via Smad and PPAR-gamma pathway. Cell Biol Int. 2014;38:875-80
41. Tang KQ, Wang YN, Zan LS, Yang WC. miR-27a controls triacylglycerol synthesis in bovine mammary epithelial cells by targeting peroxisome proliferator-activated receptor gamma. J Dairy Sci. 2017;100:4102-12
42. Kuczmarski RJ, Ogden CL, Grummer-Strawn LM, Flegal KM, Guo SS, Wei R. et al. CDC growth charts: United States. Adv Data. 2000;314:1-27
43. Takahashi N, Yao R, Kang MS, Senda M, Ando C, Nishimura K. et al. Dehydroabietic acid activates peroxisome proliferator-activated receptor-gamma and stimulates insulin-dependent glucose uptake into 3T3-L1 adipocytes. Biofactors. 2011;37:309-14
44. Kroh EM, Parkin RK, Mitchell PS, Tewari M. Analysis of circulating microRNA biomarkers in plasma and serum using quantitative reverse transcription-PCR (qRT-PCR). Methods. 2010;50:298-301
Author contact
![]() Corresponding author: Dr. Li Chen, Professor and Director, Tel: +86-0431-85619799, E-mail: chensubmitcom; Dr. Ming Zhang, Associated Professor, Tel: +86-0431-85619799, E-mail: zhangming_00com.
Corresponding author: Dr. Li Chen, Professor and Director, Tel: +86-0431-85619799, E-mail: chensubmitcom; Dr. Ming Zhang, Associated Professor, Tel: +86-0431-85619799, E-mail: zhangming_00com.