Impact Factor
- Issue 14; 2026
- Issue 13; 2026
- Issue 12; 2026
- Issue 11; 2026
- Issue 10; 2026
- Volume 16; 2026
- Advance Articles
- Past Issues
- Cover Images
- Cover Suggestion
- Index & Coverage
- Special Issues
Introduction
Methods and Materials
Results
Discussion and Conclusion
Supplementary Material
Acknowledgements
References
International Journal of Biological Sciences
International Journal of Medical Sciences
 Global reach, higher impact

Theranostics 2012; 2(9):827-839. doi:10.7150/thno.4334 This issue Cite
Research Paper
Image-Based Quantification of Benzoporphyrin Derivative Uptake, Localization, and Photobleaching in 3D Tumor Models, for Optimization of PDT Parameters
Michael D. Glidden1,2, Jonathan P. Celli1,2, Iqbal Massodi1, Imran Rizvi1, Brian W. Pogue3, Tayyaba Hasan1 ![]()
1. Wellman Center for Photomedicine, Massachusetts General Hospital, Boston, MA 02114, USA;
2. Department of Physics, University of Massachusetts Boston, Boston, MA 02125, USA;
3. Thayer School of Engineering, Dartmouth College, Hanover, NH 03755, USA.
Received 2012-3-6; Accepted 2012-6-19; Published 2012-9-5
Abstract
Photodynamic therapy (PDT) is a light-based treatment modality in which wavelength specific activation of a photosensitizer (PS) generates cytotoxic response in the irradiated region. PDT response is critically dependent on several parameters including light dose, PS dose, uptake time, fluence rate, and the mode of light delivery. While the systematic optimization of these treatment parameters can be complex, it also provides multiple avenues for enhancement of PDT efficacy under diverse treatment conditions, provided that a rational framework is established to quantify the impact of parameter selection upon treatment response. Here we present a theranostic technique, combining the inherent ability of the PS to serve simultaneously as a therapeutic and imaging agent, with the use of image-based treatment assessment in three dimensional (3D) in vitro tumor models, to comprise a platform to evaluate the impact of PDT parameters on treatment outcomes. We use this approach to visualize and quantify the uptake, localization, and photobleaching of the PS benzoporphyrin derivative monoacid ring-A (BPD) in a range of treatment conditions with varying uptake times as well as continuous and fractionated light delivery regimens in 3D cultures of AsPC-1 and PANC-1 cells. Informed by photobleaching patterns and correlation with cytotoxic response, asymmetric fractionated light delivery at 4 hours BPD uptake was found to be the most effective regimen assessed. Quantification of the spatial profile of cell killing within multicellular nodules revealed that these conditions also achieve the highest depth of cytotoxicity along the radial axis of 3D nodules. The framework introduced here provides a means for systematic assessment of PDT treatment parameters in biologically relevant 3D tumor models with potential for broader application to other systems.
Keywords: Photodynamic therapy, PDT, photosensitizer imaging, fractionation, verteporfin, BPD, in vitro 3D tumor model.
Introduction
Photodynamic therapy (PDT) is an emerging anticancer treatment [1-5] that uses a light-activated chemical, or photosensitizer (PS) which localizes somewhat preferentially in neoplastic tissue and induces a cytotoxic response upon activation by the appropriate wavelength of light [6]. The cytotoxic response generated by PDT can be enhanced by adjusting a panoply of parameters which include light dose, photosensitizer dose, uptake time, irradiance, and light delivery modulation. This large set of therapeutic parameters simultaneously elevates the complexity of the treatment and provides multiple avenues for customization and optimization. Importantly, most PDT agents are intrinsically theranostic as they are useful both for therapeutic and for diagnostic purposes. This is because the photosensitizing species used for PDT, in addition to generating cytotoxicity, also almost universally have a finite quantum yield for fluorescence emission, providing a powerful intrinsic capability for monitoring of uptake, localization, and photobleaching, which can in turn be utilized to inform these critical variables in treatment design. In addition, the fluorescence can be used for diagnostic applications such as image-guided resection [6, 7]. Here, we present a methodology which combines the unique ability of the PS to serve simultaneously as an imaging agent and a light-activated therapeutic; with 3D tumor models that restore physiologically-relevant tumor architecture and are conducive to interrogation by optical imaging. Building on the previous development of high-content image processing for therapeutic assessment in 3D cancer models [8, 9], we integrate a new set of analyses for in situ quantification of photosensitizer uptake, localization, and photobleaching to comprise a new theranostic approach for spatio-temporal correlation of PDT parameters and treatment effects across populations of individual in vitro 3D tumor micronodules that resemble multifocal nodular studding in vivo. We further demonstrate the ability of this integrative platform to inform the optimization PDT parameters.
Optimization of dosimetry in PDT is a complex process that is usually system specific and depends on many parameters that are closely interrelated. Such parameters include light dose, light fluence rate, concentration of photosensitizer administered, and photosensitizer uptake time [10, 11]. To address the difficulties that dosimetry presents, many prior studies have focused on quantification of photosensitizer photobleaching as an indicator of treatment efficacy [12-14]. Others studies have involved imaging photosensitizer localization and uptake [15, 16] while fewer have attempted to monitor singlet oxygen generation and/or triplet oxygen depletion to determine optimal irradiation times [17, 18]. Singlet oxygen detection is arguably the most direct way of predicting treatment efficacy in oxygen-dependent PDT and thus optimizing treatment regimens, but it is very difficult to accurately measure in practice. Photobleaching, while less direct, generally correlates well with cytotoxic response, is affected by nearly all of the adjustable parameters (e.g., light dose, irradiance, photosensitizer dose, etc.), and is far easier to quantify and, in some cases, visualize.
Another adjustable parameter, the determination of which can be aided by our technique, is modulation of light delivery. An extensively studied [18-20] adjustment is the fractionation of delivered light, which involves irradiating with interspersed rest periods in which no light is administered until a total fluence is achieved (e.g., a 33s on/33s off/33s on schedule to achieve a 10 J/cm2 light dose at 150 mW/cm2). Though the benefit from fractionated irradiation observed, if any, is highly dependent on the system studied (e.g., photosensitizer used, oxygenation conditions, etc.) [21-23], it has been suggested that the effect is mainly due to reoxygenation of hypoxic tumor regions [24, 25]. Increased PPIX production during the dark intervals of fractionated ALA-PDT has also been suggested [26]. Consequently, any enhancement in cytotoxic response would be expected to correlate with photobleaching patterns. Therefore, fractionation regimens can be chosen based on informed analyses from our imaging-based technique. To demonstrate this utility, we pursued asymmetric in addition to symmetric fractionation regimens on the seconds scale as we hypothesized shorter irradiation intervals would result in less photobleaching while longer dark intervals would allow greater reoxygenation, a methodology somewhat similar to radiotherapy treatments. Asymmetric fractionation regimens would consist of 33s on/66s off, 33s on/99s off, et cetera, irradiation schemes.
In this study, we explore each of the PDT parameters mentioned above in a three-dimensional cancer model. As a result of the current interest in PDT as a potential treatment for pancreatic ductal adenocarcinoma [27], we have elected to use the pancreatic cancer cell lines AsPC-1 and PANC-1 for the development and demonstration of our imaging-based method. Three-dimensional in vitro cell culture models have, in recent years, been developed into more physiologically relevant and more reliable reporters of treatment response than conventional monolayer cultures [9]. Here we employ a 3D culture overlay geometry adapted from a system previously characterized using ovarian cancer lines that is conducive to high-content imaging [8, 9, 28]. In addition to the new imaging approaches introduced here, we also utilize previously described [8, 9, 27, 29] imaging-based techniques to quantify cytotoxic response in large fields consisting of thousands of nodules. The capabilities of the imaging-based method to be presented will thus be leveraged to visualize and quantify the results of PDT parameter adjustment by monitoring uptake, localization, and photobleaching patterns.
Methods and Materials
Cell Lines and Reagents
AsPC-1 and PANC-1 cell lines were obtained from American Type Culture Collection (ATCC, Rockville, MD) and grown according to ATCC descriptions. Cell media and fetal bovine serum were obtained from Mediatech (Herndon, VA) and Invitrogen (Carlsbad, CA), respectively. To all cell media was added 50 IU/mL penicillin and 50 mg/mL streptomycin (Mediatech). PDT treatments were conducted using the photosensitizer benzoporphyrin derivative monoacid ring-A (BPD, common name Verteporfin, VWR, Radnor, PA). Quoted concentrations of BPD were confirmed using its UV-VIS absorbance spectrum and previously characterized photophysical properties [30].
Growth of 3D Tumor Nodules on Basement Membrane
Cells were grown in overlay on a bed of Growth Factor Reduced (GFR) Matrigel™ (BD Biosciences, Bedford, MA) as a basement membrane to mimic stromal interactions in pancreatic cancer, as previously described [8, 27, 31]. In this work, 250 μL of Matrigel was deposited into each well of a 24-well plate so that beds several hundred microns in thickness completely covered the well bottoms. As cells were plated in overlay and not embedded in the matrix, any variations in the bed thickness will not affect growth and/or treatment outcomes. Cells were grown for 10 to 12 days prior to initiation of treatment and/or imaging of BPD uptake. Media changes with 2% GFR Matrigel-supplemented media were performed once every third day during the growth process. To illustrate the three-dimensional structure of the nodules, comprehensive Z-stack images of cleaved Calcein and Propidium Iodide fluorescence, which label viable and dead cells, respectively, were taken on the Olympus FV-1000 confocal at 40X for treated and untreated day 12 AsPC-1 nodules. Images acquired at representative Z-positions as well as 3D renderings of each Z-stack are presented in Additional File 1: Supplemental Figure 1. At the time of imaging and PDT treatment, the 3D cultures for both cell lines had adopted a highly reproducible bimodal Gaussian distribution of nodule sizes (see Additional File 1: Supplemental Figure 2).
Imaging of Verteporfin (BPD) Uptake and Localization
On the day of imaging, cells were incubated with 1 μM BPD in cell media for various time intervals quoted in the text. BPD media was then replaced with BPD-free media. To quantify verteporfin uptake and localization within tumor nodules, an imaging-based method was developed for the three-dimensional model to quantify uptake and localization of BPD using fluorescence imaging. Images were obtained using an Olympus FV-1000 confocal microscope. The photosensitizer was excited with the 488 nm line from an Argon ion laser. Optimal dichroic mirror, filter, and detector settings for the fluorescence channel were established by imaging BPD, the spectrum of which was verified in hyperspectral scans. For all BPD fluorescence images, an objective magnification of 4X (NA = 0.16) was used to collect single-images that were digitally zoomed by a factor of 1.4. Each imaged area was 2.3 mm x 2.3 mm in size and consisted of approximately one hundred nodules. Individual treatment groups were performed in triplicate, yielding statistics across hundreds of nodules. While a confocal microscope was used for image acquisition, the confocality of the instrument was not necessary for our technique: the confocal pinhole diameter was opened to 600 μm to collect the maximal amount of fluorescence signal. With this aperture size, the in-plane resolution and optical section thickness were estimated to be 1.5 μm and 310 μm, respectively. Individual image fields were saved for offline processing using routines that we developed in MATLAB.
The analysis routine first calculates mean pixel intensities of each individual fluorescence image. The average fluorescence intensities from the no treatment groups are then assumed to be background and subtracted from the mean fluorescence intensities of groups which received photosensitizer. The background subtracted fluorescence intensities are then used as a metric for reporting the relative mean concentration of photosensitizer in the nodules. In addition, individual matrix elements of post-treatment images are subtracted from each pre-treatment image element to generate photobleaching maps.
Quantification of Verteporfin (BPD) Photobleaching
Photobleaching effects were visualized by imaging each well of the plates pre- and post- PDT treatment. Identical imaged areas were acquired directly before and after PDT treatment and during evaluation of cytotoxic response. Using the aforementioned MATLAB routines, mean fluorescence intensity of the pre- and post- treatment images was calculated and the mean residual BPD in each group reported as the ratio of the residual BPD of each treatment group to that of the BPD only control. Photobleaching maps were also generated by subtracting each element of the post-treatment image matrix from each element of the pre-treatment's image and visualized with the “hot” color map in MATLAB. Pixel intensity line scans of individual nodules from raw fluorescence images were performed using the public domain image analysis software ImageJ [32].
PDT Treatments
Cell cultures were incubated with medium containing 1 μM BPD for time intervals of 1.5, 4, and 24 hours. Prior to irradiation, the medium was replaced with BPD-free medium. Cells were irradiated at specified doses using a 690 nm laser diode source (Model 7401; Intense, North Brunswick, NJ) at a fluence rate of 150 mW/cm2 as measured via a VEGA laser power energy meter (Ophir Laser Measurement Group, LLC) and then allowed to incubate for 24 hours prior to evaluation of treatment response. Laser irradiation was delivered through the bottom of each well on a clear plastic tray via a vertically mounted Thorlabs FT600EMT multimode fiber (Thorlabs, Newton, NJ), which was collimated to overfill the dish area for nearly uniform light delivery.
A robust system that integrates an electronic TTL logic shutter and computer code was used to provide highly reproducible light doses. The irradiation times corresponding to specified light doses were calculated to the nearest hundredth of a second using a custom routine written in C and compiled in Igor Pro (Wavemetrics, Lake Oswego, OR). The program also runs a USB-6210 counter/timer board (National Instruments), which creates +5V TTL pulse trains to operate an Ocean Optics INLINE-TTL-S fiber-coupled shutter (Ocean Optics, Dunedin, FL) to deliver light consistently for the calculated irradiation interval. For continuous irradiation treatments, the pulse train from the counter/timer board consisted of one pulse in HIGH logic (+5V, open shutter) for the duration of the treatment. For fractionated light delivery, irradiation periods correspond to the time in which the pulse train is in HIGH logic, while LOW logic (-5V, closed shutter) corresponds to dark intervals. Fractionation regimens were determined by splitting the counterpart continuous light dose in half (i.e., only one rest period), beginning with symmetric fractionation (e.g., 33s on/33s off) and then increasing the asymmetry of the light/dark interval (e.g., 33s on/66s off, etc.). A fluence of 10 J/cm2 is therefore accomplished by irradiating in a 33s on/33s off/33s on fractionation schedule.
Cell Viability Measurements
Viability of treated cultures was assessed using a previously described [8, 9] imaging-based technique to quantify cells positively stained with Calcein AM (Invitrogen) as a fluorescent label for viable cells and Propidium Iodide (Sigma Aldrich) as a marker for dead cells. All wells were incubated with Calcein AM and Propidium Iodide reagents for 40 minutes prior to imaging on an Olympus FV-1000 confocal microscope using a 0.16NA 4X objective to obtain single-image fields 2.3 mm x 2.3 mm in size consisting of many nodules. The 488 nm line from an Argon ion laser with paired with a FITC filter set and a 559 nm diode source paired with a TRITC filter set was used to detect cleaved Calcein and intercalated Propidium, labeling viable and dead cells respectively. Saved images were batch-processed in MATLAB using a routine to segment the fluorescence images, determine mean pixel intensities for the Calcein (live) and Propidium Iodide (dead) channels separately, and subsequently calculate viability from the mean intensities using the formula live/(live+dead) as previously described [8] and also using a complete killing control (fixed and permeablized cultures) to standardize the dynamic range of fluorescence intensity from the two channels [29]. Fractional viability was reported as the ratio of the viability of a given treatment group to that of the no treatment control group for identical plating conditions and growth period. Validation of this imaging-based approach to quantifying treatment response in the 3D model against common colorimetric assays is not straightforward as assay reagents (e.g., MTT) bind to the Matrigel substrate. However, the method has been used previously in monolayer cell cultures [9] and provided comparable viabilities to that obtained via the MTT assay (see Additional File 1: Supplemental Figure 3).
Results
Overview of PDT Treatment Parameters and the Imaging-Based Method
Figure 1 gives an overview of the parameters involved in a given PDT treatment as well as the capabilities of our imaging-based technique. PS fluorescence images are displayed based on a 12-bit colormap to easily identify areas of high pixel intensity. As expected, the No Treatment group contains no photosensitizer fluorescence (each image is nearly black) while the viability assessment image contains bright green nodules, signifying their health. Photobleaching of the photosensitizer can be qualitatively observed as a decrease in mean pixel intensity when comparing the pre- and post-treatment PS colormaps for a PDT treatment in which a fluence of 10 J/cm2 was delivered continuously.
Imaging-based Quantification of Photosensitizer Uptake, Localization and Photobleaching. Overview of PDT treatment parameters and the capabilities of the imaging-based approach. The “Change in PS” column denotes pixel-by-pixel subtraction of post-treatment from pre-treatment photosensitizer fluorescence images. The most intense pixels in these images correspond to the pixels that were the most photobleached by PDT. Green and red pixels in fluorescence images in the “Imaging Based Viability Assessment” column denote live and dead characteristics of the nodules, respectively. All data presented here was collected from day 12 AsPC-1 cultures that were allowed to uptake photosensitizer for 4 hours. All scale bars are 350 μm.
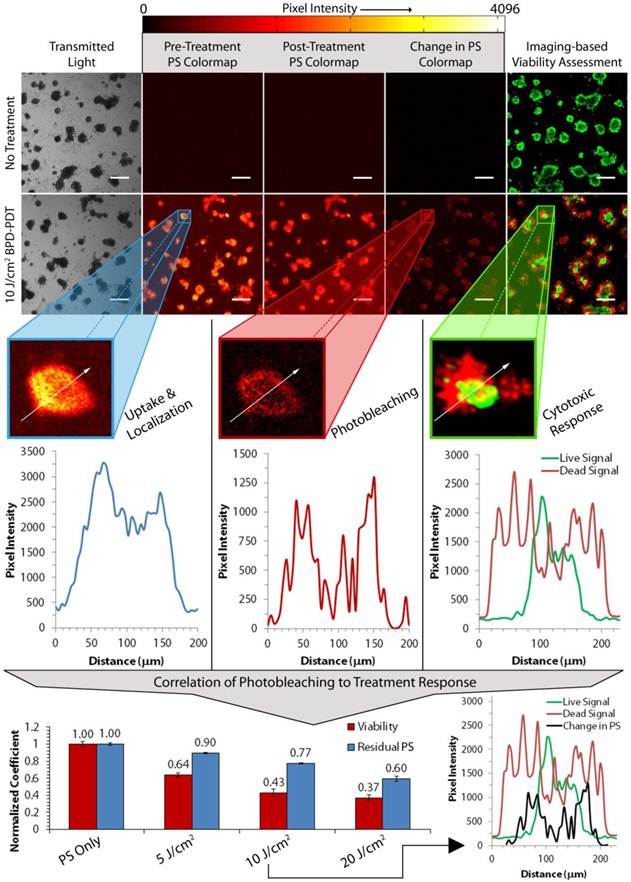
The “Change in PS” colormap is the result of subtracting the post-treatment image element-wise from the pre-treatment image and plotted on the same 12-bit colormap. Areas of high photobleaching are thus visualized here as areas of high pixel intensity. Though the mathematical basis for this image transformation does not scale pixels to give the percent photobleaching for each pixel, it is a useful reporter of the localization of photobleaching in the nodules, and will heretofore be referred to as the “photobleaching map.” Finally, dead regions of cells in the viability assessment can be qualitatively correlated to the high pixel intensities of the photobleaching map.
These raw fluorescence images and the calculated photobleaching map thus provide rich and thorough information about PDT parameters. Firstly, PS fluorescence images collected pre-treatment provide a means to quantify not only mean, but nodule-by-nodule photosensitizer uptake and localization. Pixel intensity line scans (shown as white arrows in each enlarged nodule images) of single nodules reveal the photosensitizer's localization within the acini. It can be seen in Figure 1 that photosensitizer is localized primarily on the outer edges of the nodule (blue plot, left). From this information, uptake curves are obtained by imaging selected groups of nodules that are administered photosensitizer at different uptake times and then taking the mean pixel intensity of each image (see Figure 2). Similar information is obtained regarding the degree and localization of nodule-by-nodule photobleaching. The plot profile of the same nodule in the photobleaching map shows that not only is photosensitizer primarily located on the periphery of the nodule, but that photobleaching is highest in the same region (red plot, middle). In the live and dead fluorescence images under the “Imaging-based Viability Assessment” panel in Figure 1, it can be seen that the same nodule has nearly no viable cells in the analogous region where photobleaching was maximal. Consequently, the most viable cells survive in the core of the nodule where photobleaching was minimal.
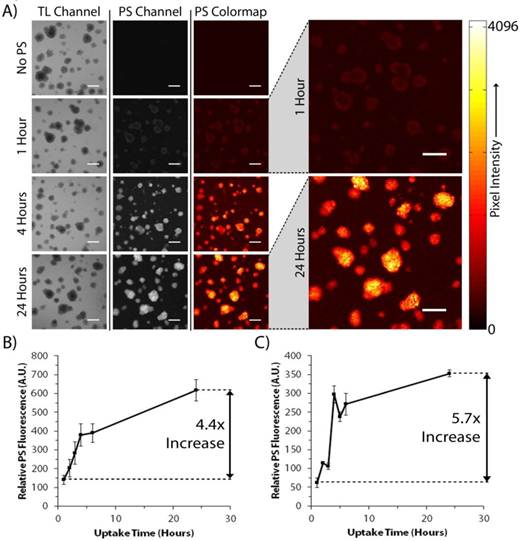
BPD Uptake Curves for PANC-1 and AsPC-1 3D Cultures. Method by which photosensitizer uptake curves are obtained in the 3D model, beginning with (A) BPD fluorescence images of day 10 PANC-1 cultures taken 5 minutes after media change to BPD-free media (images from AsPC-1 cultures not shown for the sake of clarity). Quantified uptake curves were generated by taking the mean pixel intensities of each image and are presented for (B) day 12 AsPC-1 and (C) day 10 PANC-1 nodules. Ratiometric increases in (B) and (C) are reported as the ratio of the mean pixel intensities of images collected at 24 hours of uptake to those collected at 1 hour of uptake. All scale bars are 350 μm.
Perhaps the most robust capability of our imaging-based technique is the correlation of photobleaching to treatment response, as shown at the bottom of Figure 1. In particular, the mean residual photosensitizer (blue bars, bottom graph) can be correlated to mean cytotoxic response (red bars) obtained from the viability assessment. Using this data, it can be seen that increasing the light dose results in enhanced cytotoxic response as well as increased mean photobleaching. Nodule-by-nodule photobleaching patterns can again be correlated to live and dead patterns seen during treatment evaluation. This is seen in the bottom right plot profile in Figure 1: the pixel intensity profile for the photobleaching map (black line) aligns with the live (green line) and dead (red line) profiles for a selected 10 J/cm2 continuous irradiation PDT treatment. It should be noted that the observed alignment at this point is only quasi-quantitative. The correlation cannot be perfect as the nodule surface area changes during the 24 hour period in between treatment and evaluation due to migration of dead cells from the nodule and continuing growth of viable cells within the acinus core. The extent of this fluctuation is visible in the bottom right plot profile presented in Figure 1.
Verteporfin Localization and Uptake in 3D AsPC-1 and PANC-1 Cultures
Figure 2 illustrates how photosensitizer uptake curves are obtained with our imaging methodology and how localization can be visualized. Acquired images from the transmitted light and BPD fluorescence channels from day 10 PANC-1 nodules (Figure 2A) show that no BPD is present in the No Treatment control, and that both the BPD concentration and localization within the nodules changes with uptake time. At early uptake durations (1-3 hours), the photosensitizer fluorescence is weak and localized primarily in the outer crust of the nodules. As uptake time increases, the inner-most cells in the acini gather more BPD from the cell medium while outer-most cells reach a relatively constant concentration soon after exposure to the drug. That is, the uptake time for the outermost cells is likely more rapid than for those in the nodule core, whose nutrient transport rates are limited by the presence of multiple cellular layers within the nodule. A similar trend is observed in the AsPC-1 cell line (not shown). Unlike uptake data taken with these cell lines grown in monolayer, where uptake is steep up to 4 hours, but then decreases sharply [27], the BPD concentration in three-dimensional nodules continues to intensify out to 24 hours of drug uptake.
Using our custom MATLAB routines, the mean fluorescence intensity in the raw images was determined, giving a relative estimation of the amount of photosensitizer in the nodules at each time point. The resulting uptake curves for day 12 AsPC-1 and day 10 PANC-1 cultures are presented in Figures 2B and 2C, respectively. The fluorescence intensities of PANC-1 and AsPC-1 cultures are not comparable as different dynamic ranges were used during imaging. However, the increase in relative fluorescence intensity between BPD uptake for 1 hour and 24 hours for the AsPC-1 and PANC-1 cultures was 4.4 and 5.7 fold, respectively. This shows that PANC-1 nodules acquire photosensitizer faster than AsPC-1 acini, another result that is different from patterns seen in monolayer data [27].
Optimization of Uptake-dependent PDT Treatment Parameters
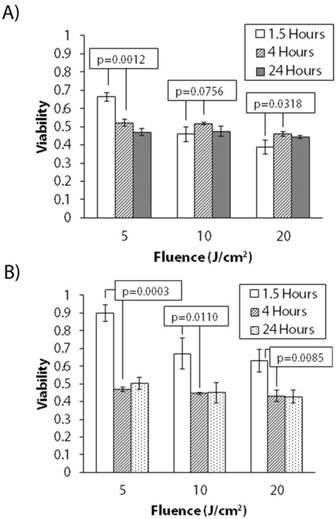
To determine the effect of uptake and localization on treatment response, we conducted continuous irradiation PDT treatments at 1.5 hour, 4 hour, and 24 hour uptake times for both AsPC-1 and PANC-1 cell lines. The 4 hour time point was chosen as the uptake curves in Figure 2 plateau around 4-5 hours while 1.5 hours was chosen as it has been previously studied in 3D cultures [27]. Though 24 hour BPD uptake is not practical in in vivo models because of BPD's pharmacokinetics [33], it was nevertheless informative to examine this upper limit in this mechanistic study. Figure 3 shows the results of these experiments. It is readily seen that cytotoxic response is dependent on uptake time for both cell lines. For AsPC-1 cells, at lower light doses (i.e., 5 J/cm2), there is a marked enhancement in killing with increasing uptake. However, killing is either worse or unchanged at higher light doses. PANC-1 cultures show similar behavior, though killing increases going from 1.5 hours to 4 hours with all light doses.
Uptake Dependent Treatment Response for PANC-1 and AsPC-1 Cultures (Continuous Irradiation). Variable treatment response for 5, 10, and 20 J/cm2 irradiance delivered continuously with increasing BPD uptake time for (A) day 12 AsPC-1 and (B) day 10 PANC-1 nodules.
Optimization of Fractionated Light Delivery from Photobleaching Patterns
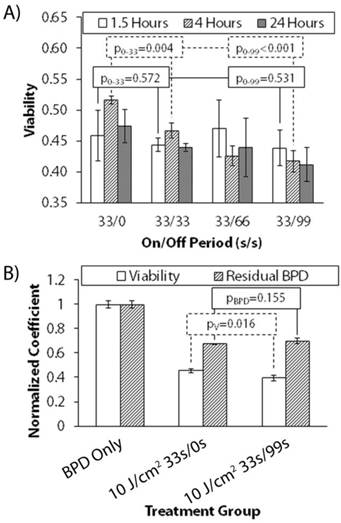
Figure 4 shows the change in treatment response of 10 J/cm2 delivered continuously and fractionated (symmetric and asymmetric regimens) with uptake time in day 12 AsPC-1 cultures. Fractionation schedules are reported as seconds on/seconds off (33/0 denotes continuous irradiation, no rest period). Reported p-values are subscript symbolized as the comparison between groups with two different dark intervals for clarity. At only 1.5 hours of verteporfin uptake, there is no discernable difference between any fractionation schedule and continuous irradiation. However, a significant benefit from symmetric fractionation is observed at 4 hours. A two-tailed student t-test reveals that comparing no dark interval (0s off, continuous irradiation) to symmetric (33s off) and asymmetric fractionation (99s off) at 1.5 hours uptake results in p-values of p0-33=0.572 and p0-99=0.531, respectively. The result of this same comparison at 4 hours uptake is p0-33=0.004 and p0-99<0.001. At 4 hours uptake, symmetric fractionation (33s on/33s off) does provide a modest enhancement, and increasingly asymmetric fractionation (33s on/99s off) provides even more. To determine why this occurs, we measured the mean photobleaching at 4 hours uptake in day 12 AsPC-1 cultures for 10 J/cm2 33s/0s and 33s/99s, and then correlated that to mean cytotoxic response. Figure 4B shows the result of this analysis and that the enhancement between continuous irradiation and asymmetric fractionation is present and significant (pV=0.016), but that there is an insignificant difference between the mean residual BPD in the wells (pBPD=0.115). From this data, it is clear that, in comparison to the absence of a dark interval, a statistically significant and greater cytotoxic response is obtained by fractionating delivered light. However, the reason for this enhancement cannot be readily elucidated by using mean field methods to quantify residual BPD or photobleaching.
Uptake Dependent Treatment Response for AsPC-1 Cultures (Fractionated Irradiation). (A) Variable treatment response with uptake time for a constant 10J/cm2 light dose delivered continuously (33s on/0s off) and with increasing rest-period asymmetry (33s on/33s off, 33s on/66s off, etc.) for day 12 AsPC-1 nodules. Fractionation schedules are reported as seconds on/seconds off. Reported p-values are subscript symbolized as the comparison between groups with two different dark intervals for clarity. (B) Correlation of mean residual BPD to mean viability in day 12 AsPC-1 nodules with 4 hours of BPD uptake. Mean residual BPD was normalized to the BPD-only control.
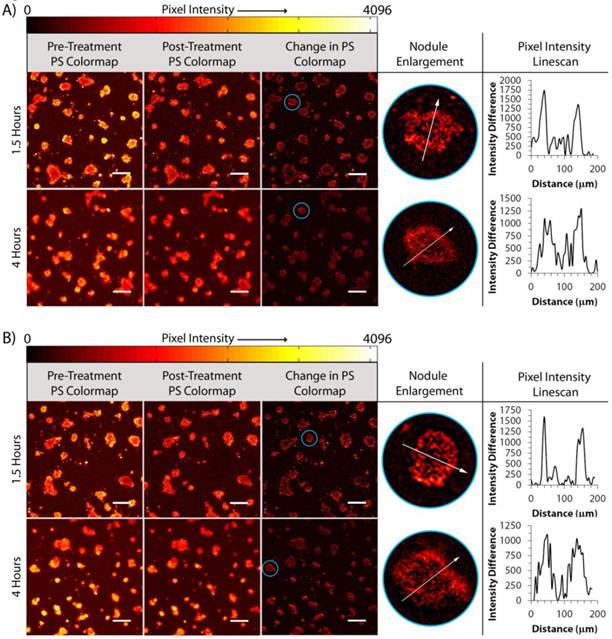
To determine why fractionation produces a larger cytotoxic response than continuous irradiation, we further leverage our imaging based approach to correlate spatial photobleaching patterns with uptake and light delivery parameters. Figure 5 summarizes the data extracted from treatments at 1.5 hours and 4 hours of uptake for day 12 AsPC-1 nodules. Photobleaching maps were generated for the continuous irradiation and 33s on/99s off regimens for both 1.5 hours and 4 hours of BPD uptake. Pixel intensity line scans of the photobleaching maps were taken from nodules that were determined to be of similar diameter along their minor axis (~200 μm) and aspect ratio. Each line profile presents two peaks on the periphery of the nodules while the acini cores contain a large dip in the pixel intensity. There is little difference in the distribution of photobleaching comparing only continuous and fractionated light delivery. However, the thickness of the photobleaching “depth” is dissimilar comparing 1.5 hours to 4 hours of BPD uptake. The width of the photobleaching peaks are ~10-40 μm for 1.5 hours uptake while peaks on similarly sized nodules are ~80-100 μm at 4 hours. Referring back to Figure 1, the depth of photobleaching roughly corresponds to regions of dead cells from the evaluation of cytotoxic response. This suggests that broader photobleaching peaks correspond to deeper penetration of cytotoxicity in the acini, as observed from the data in Figure 5.
Determination of Nodule-by-nodule Photobleaching. Progression from pre- and post-treatment and photobleaching difference map images to evaluation of the photobleaching pixel intensity profiles of selected nodules (circled in blue) for day 12 AsPC-1 cultures receiving 1.5 hours and 4 hours uptake and 10 J/cm2 of light delivered (A) continuously or (B) asymmetrically fractionated. All scale bars are 350 μm.
To confirm this assertion, multiple nodules were selected from each uptake and light delivery group and the extent by which dead cells protruded into the nodules was assessed. The “depth of cytotoxicity” was chosen as a metric instead of “photobleaching depth” as the viability assessment images were much cleaner for analysis than the photobleaching maps. Though there is some dilation in the nodules during the 24 hour period between PDT treatment and evaluation, it is assumed that most of the change in size is due to dead cells detaching from the nodules and, as a result, is systematic across all nodules. Fluorescence images of the live and dead channels were first binarized. The pixel intensities from the live fluorescence channel were subtracted element-wise from the dead channel, resulting in a difference mask consisting of the rings of white pixels (corresponding to dead regions) with inner cores (live regions) of black pixels (not shown). Using ImageJ, multiple line scans were performed on each of five selected nodules per treatment group which presented similar outer diameters along their minor axis. The outer and inner diameters along the minor axes of the nodules were measured and the depth of cytotoxicity defined as the difference between the outer and inner diameters divided by two.
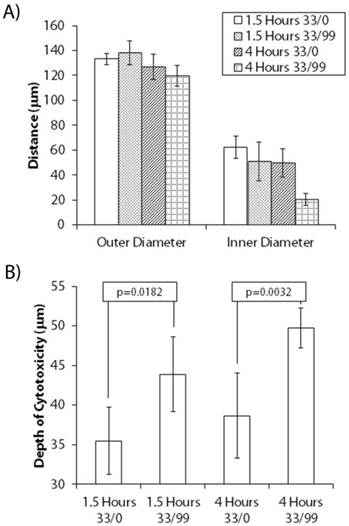
Figure 6 shows the results of this analysis for each group that received different BPD uptake time and irradiation schedules. A student's t-test analysis gave that there is no significant difference in the outer diameters (Figure 6A) of each group of nodules selected for line scan analysis. The inner diameter of the nodules collected from 4 hour uptake 10 J/cm2 33s/99s group, however, was significantly different (p=0.003) than the 1.5 hour fractionated group. This resulted in a significant difference in the depth of cytotoxicity (p=0.040), as presented in Figure 6B. The average cytotoxic depth of the 4 hour uptake fractionated group was also significantly thicker than in nodules that received both continuous irradiation treatments. There was a somewhat significant difference in the cytotoxic depth upon comparing continuous to fractionated light delivery (p=0.018) in the 1.5 hour uptake groups. Finally, there is a very significant change in cytotoxic depth when comparing continuous irradiation to fractionation with 4 hours of photosensitizer uptake (p=0.003).
Depth of Cytotoxicity for Different Uptake and Light Delivery Treatments. (A) Inner and outer diameters and (B) calculated depth of cytotoxicity, reported as (outer diameter - inner diameter)/2, for day 12 AsPC-1 nodules given 1.5 hours and 4 hours of BPD uptake time and treated with 10 J/cm2 delivered either continuously or asymmetrically fractionated. Error bars correspond to the standard deviation of the five individual nodules selected per treatment group.
Discussion and Conclusion
The unique juxtaposition of high-content quantitative imaging of parameter-dependent spatiotemporal photosensitizer distribution and biologically-relevant tumor models in this study yields several important insights that may be leveraged for enhanced PDT efficacy. The uptake curves of AsPC-1 and PANC-1 cell lines in these 3D cultures are useful for the optimization of uptake-dependent PDT treatment parameters, and are the first reported for this model. Our imaging-based technique shows that the localization of verteporfin in the nodules changes with increasing uptake time, quite dramatically within the first five hours. Given the large depth of focus in these images, it is probable that the nodule centers appear brighter than the cells in the periphery because more fluorescence is integrated from the thicker nodule cores at long uptake times. That is, while at certain time points, the cellular BPD concentration is indeed higher in the outermost cells of the acinus than in the cells constituting the nodule core, it is highly unlikely that the variation ranges across orders of magnitude. A future work might involve careful analysis of frozen sections obtained from a cyromicrotome thus allowing clearer visualization of cellular BPD concentrations in the acini cores at longer uptake times. Nevertheless, the increase in BPD concentration in the cells comprising the acini cores from 1.5 to 4 hours uptake is an especially significant observation as most PDT treatments conducted with this 3D model have utilized only ~1.5 hours of verteporfin uptake time, though in practice, pharmacokinetic considerations in vivo would determine the available window for uptake into the tumor [8]. A limitation of this model is the absence of any vasculature which, in vivo, would be a major source of PS delivery. The absence of blood flow in this model could also be particularly limiting when assessing various symmetric and asymmetric fractionation schemes as reoxygenation times may be longer than diffusion-limited estimates. That is, the vessels may need an extended period of time to reload with oxyhemoglobin when subjected to heavy photodynamic consumption. However, extravasation from the vessels and tumor cell uptake is a diffusion phenomenon, so the above analysis and methodology remains a useful tool.
The enhanced killing at low light doses with increased uptake time for both cell lines suggests that fractionation may be more potent in the 3D model at long uptake times (i.e., ≥4 hours) and with fluences ≤5 J/cm2 per light interval. For low light doses, an uptake time of 4 hours seems optimal as both cell lines show a marked plateau in BPD concentration, despite rising continuously out to 24 hours. Though the 24 hour data points for both uptake and cytotoxic response were important for this mechanistic study, the pharmacokinetics of verteporfin do not permit 24 hours of uptake in vivo [33]. While for AsPC-1 cells there was little dependence on uptake for treatment response at high light doses, the response of PANC-1 cultures to PDT treatment departs from AsPC-1 in that killing increases going from 1.5 hours to 4 hours with all light doses. This is an expected result, however, as Figure 2 shows there is far more photosensitizer in the PANC-1 nodules at 4 hours than at 1-2 hours of uptake.
Nodule-by-nodule photobleaching can be roughly correlated to cytotoxic response as shown in Figure 1. It is difficult to determine quantitatively, however, the correlation of the most photobleached regions of the acini to those regions containing the most dead cells. This is because the photobleaching maps presented here are derived from images collected directly before and after PDT treatment, whereas quantitative viability assessments are derived from images taken 24 hours post treatment. At this point, many of the dead cells have begun to migrate away from the acini due to PDT disruption of the nodule structure [9]. The living nodule core has also had ample time to grow due to continuing mitotic division of the viable cells. Moreover, the loss of cell volume regulation in damaged cells can cause more variation in nodule size 24 hours post-treatment. As a result, it can be said qualitatively that the areas of greatest photobleaching are localized on the nodule crust and that this corresponds to regions of the greatest death, but the fluorescence intensity distributions for the photobleaching map and dead channels will not line up perfectly with each other as the nodules' surface area systematically enlarges during the 24 hour lag between treatment and evaluation. This effect can be seen in the line scan profile superposition at the bottom of Figure 1. While this challenge remains to make the approach entirely quantitative, for rapid screening of optimal conditions, it remains a useful qualitative tool as the extent of the inner diameter of the nodule in the dead channel (i.e., the point in the profile in which the live channel begins to peak) matches fairly well to the corresponding inner diameter of the photobleaching scan (represented by the region of the nodule with the lowest degree of photobleaching).
The 4 hour BPD uptake group with fractionated light delivery had a significantly thicker depth of cytotoxicity than continuous irradiation treatment with the same uptake (p=0.003) whereas this comparison at 1.5 hours of uptake showed a much smaller (p=0.018), yet significant difference. This suggests that the depth of photobleaching is greater upon fractionation when sufficient BPD is available in the nodules. Fractionation likely does not show a significant benefit in mean cytotoxicity at 1.5 hours of uptake because of the scarcity of photosensitizer in the nodule cores. That is, reoxygenation of the nodule core would likely have little effect if there is not enough photosensitizer present to utilize it. At 4 hours, as shown by fluorescence imaging, the cellular BPD concentration is higher in the nodule core than at 1.5 hours, allowing any reoxygenation intervals to be of use toward achieving superior cytotoxic response.
The small enhancement granted by asymmetric fractionation is expected when the spatial extent of nodules in this 3D model is considered. Despite the presence of hypoxic nodule cores in other 3D models of this type [28], these acini are not quite large enough to require extensive reoxygenation as with the vascularized systems previously studied [13]. Theoretical oxygenation modeling studies with multicellular spheroids [34] and other in vivo geometries [24, 25] provide validity to this claim as optimal dark intervals for nodules of this size should be ≤5s. Despite these findings, it is interesting that cytotoxic response is enhanced with dark intervals as long as 99s; further exploration of fractionation in the 3D model using a refined version of our imaging-based technique may be performed in future work. In addition, though the enhancement in cytotoxicity between fractionated and continuous PDT treatment regimens is relatively modest in this 3D model, the result of unprecedented seconds-scale asymmetric fractionation merits further investigation in a model where reoxygenation is more important (i.e., murine mouse model). As the differences between continuous and symmetric fractionated light delivery were quite dramatic in previous in vivo studies [13, 25], it is possible that asymmetric fractionation could provide additional benefit.
In conclusion, the imaging-based approach presented here can be leveraged to visualize and quantify photosensitizer uptake characteristics, photobleaching patterns, and cytotoxic response to make informed decisions about in vitro PDT treatment parameters. Its utility may also be expanded to aid in optimization of in vivo PDT treatments of cancer. In addition, the result of asymmetric fractionation in the 3D model suggests it may have additional benefit in vivo. Future work with fractionation in the 3D model and further refinement of our imaging technique may also lead to greater efficiency and enhancement of treatment parameters in both fractionated and continuous irradiation schemes. Finally, though not studied here, the effects of increased photosensitizer dose administered to the nodules could also be determined using the imaging-based technique, leaving even more potential for further characterization and implementation of the method.
Supplementary Material
Additional File 1Supplemental Figure 1: 40X Z-stacks of 3D AsPC-1 Nodules during Viability. Supplemental Figure 2: Nodule Size Distributions of AsPC-1 and PANC-1 Pre-Treatment. Supplemental Figure 3: Comparison of Imaging-Based Viability Assessment to MTT Assay.
Acknowledgements
This work was supported by funding provided by the National Institutes of Health, though the Hasan Program Project Grant P01CA084203-06 (to T.H., B.W.P.) and a Howard Temin Pathway to Independence in Cancer Research Award K99CA155045-02 (to J.P.C.) and also a junior faculty career development award from the Eleanor and Miles Shore Scholars in Medicine Program at Harvard Medical School (to J.P.C.).
Competing Interests
The authors have declared that no competing interest exists.
References
1. Kostron H, Obwegeser A, Jakober R. Photodynamic therapy in neurosurgery: a review. Journal of Photochemistry and Photobiology B: Biology. 1996;36:157-68
2. Pass HI. Photodynamic Therapy in Oncology: Mechanisms and Clinical Use. Journal of the National Cancer Institute. 1993;85:443-56
3. Dolmans DEJGJ, Fukumura D, Jain RK. Photodynamic therapy for cancer. Nat Rev Cancer. 2003;3:380-7
4. Hasan T, Parrish JA. Photodynamic therapy of cancer; 4th ed. Williams & Wilkins. 1997
5. MacCormack MA. Photodynamic Therapy in Dermatology: An Update on Applications and Outcomes. Seminars in Cutaneous Medicine and Surgery. 2008;27:52-62
6. Celli JP, Spring BQ, Rizvi I, Evans CL, Samkoe KS, Verma S. et al. Imaging and Photodynamic Therapy: Mechanisms, Monitoring, and Optimization. Chemical Reviews. 2010;110:2795-838
7. Stummer W, Pichlmeier U, Meinel T, Wiestler OD, Zanella F, Reulen H-J. Fluorescence-guided surgery with 5-aminolevulinic acid for resection of malignant glioma: a randomised controlled multicentre phase III trial. The Lancet Oncology. 2006;7:392-401
8. Celli J, Rizvi I, Evans C, Abu Yousif A, Hasan T. Quantitative imaging reveals heterogeneous growth dynamics and treatment-dependent residual tumor distributions in a three-dimensional ovarian cancer model. Journal of biomedical optics. 2010;15:051603
9. Rizvi I, Celli JP, Evans CL, Abu-Yousif AO, Muzikansky A, Pogue BW. et al. Synergistic enhancement of carboplatin efficacy with photodynamic therapy in a three-dimensional model for micrometastatic ovarian cancer. Cancer research. 2010;70:9319-28
10. Wilson BC, Patterson MS, Lilge L. Implicit and explicit dosimetry in photodynamic therapy: a New paradigm. Lasers Med Sci. 1997;12:182-99
11. Wang KK, Mitra S, Foster TH. A comprehensive mathematical model of microscopic dose deposition in photodynamic therapy. Med Phys. 2007;34:282-93
12. Xue J, Li C, Liu H, Wei J, Chen N, Huang J. Optimal light dose and drug dosage in the photodynamic treatment using PHOTOCYANINE. Photodiagnosis Photodyn Ther. 2011;8:267-74
13. Iinuma S, Schomacker KT, Wagnieres G, Rajadhyaksha M, Bamberg M. In vivo fluence rate and fractionation effects on tumor response and photobleaching: Photodynamic therapy with two photosensitizers in an orthotopic rat tumor model. Cancer research. 1999;59:6164-70
14. Pogue BW, Sheng C, Benevides J, Forcione D, Puricelli B, Nishioka N. et al. Protoporphyrin IX fluorescence photobleaching increases with the use of fractionated irradiation in the esophagus. J Biomed Opt. 2008;13:034009
15. Lin C-W, Shulok JR, Wong Y-K, Schanbacher CF, Cincotta L, Foley JW. Photosensitization, Uptake, and Retention of Phenoxazine Nile Blue Derivatives in Human Bladder Carcinoma Cells. Cancer research. 1991;51:1109-16
16. Miller GG, Brown K, Moore RB, McPhee MS, Diwu ZJ, Liu J. et al. Uptake kinetics and intracellular localization of hypocrellin photosensitizers for photodynamic therapy: a confocal microscopy study. Photochem Photobiol. 1995;61:632-8
17. Jarvi MT, Niedre MJ, Patterson MS, Wilson BC. Singlet oxygen luminescence dosimetry (SOLD) for photodynamic therapy: current status, challenges and future prospects. Photochem Photobiol. 2006;82:1198-210
18. Curnow A, Haller JC, Bown SG. Oxygen monitoring during 5-aminolaevulinic acid induced photodynamic therapy in normal rat colon: Comparison of continuous and fractionated light regimes. Journal of Photochemistry and Photobiology B: Biology. 2000;58:149-55
19. van Geel IPJ, Oppelaar H, Marijnissen JPA, Stewart FA. Influence of Fractionation and Fluence Rate in Photodynamic Therapy with Photofrin or mTHPC. Radiation Research. 1996;145:602-9
20. Ascencio M, Estevez JP, Delemer M, Farine MO, Collinet P, Mordon S. Comparison of continuous and fractionated illumination during hexaminolaevulinate-photodynamic therapy. Photodiagnosis and Photodynamic Therapy. 2008;5:210-6
21. de Bruijn HS, de Haas ERM, Hebeda KM, van der Ploeg - van den Heuvel A, Sterenborg HJCM, Neumann HAM. et al. Light fractionation does not enhance the efficacy of methyl 5-aminolevulinate mediated photodynamic therapy in normal mouse skin. Photochemical & Photobiological Sciences. 2007;6:1325-31
22. Müller S, Walt H, Dobler-Girdziunaite D, Fiedler D, Haller U. Enhanced photodynamic effects using fractionated laser light. Journal of Photochemistry and Photobiology B: Biology. 1998;42:67-70
23. Babilas P, Schacht V, Liebsch G, Wolfbeis OS, Landthaler M, Szeimies RM. et al. Effects of light fractionation and different fluence rates on photodynamic therapy with 5-aminolaevulinic acid in vivo. Br J Cancer. 2003;88:1462-9
24. Foster TH, Murant RS, Bryant RG, Knox RS, Gibson SL. Oxygen consumption and diffusion effects in photodynamic therapy. Radiation Research. 1991;126:296-303
25. Pogue BW, Hasan T. A theoretical study of light fractionation and dose-rate effects in photodynamic therapy. Radiation Research. 1997;147:551-9
26. van den Boogert J, van Staveren HJ, de Bruin RW, Siersema PD, van Hillegersberg R. Fractionated illumination for oesophageal ALA-PDT: effect on blood flow and PpIX formation. Lasers Med Sci. 2001;16:16-25
27. Celli J, Solban N, Liang A, Pereira S, Hasan T. Verteporfin-Based Photodynamic Therapy Overcomes Gemcitabine Insensitivity in a Panel of Pancreatic Cancer Cell Lines. Lasers in surgery and medicine. 2011;43:565-74
28. Evans CL, Abu-Yousif AO, Park YJ, Klein OJ, Celli JP, Rizvi I. et al. Killing Hypoxic Cell Populations in a 3D Tumor Model with EtNBS-PDT. PLoS ONE. 2011;6:e23434
29. Celli J, Blanden A, Rizvi I, Abu-Yousif AO, Spring BQ, Hasan T. Biologically relevant 3D tumor arrays: imaging-based methods for quantification of reproducible growth and analysis of treatment response. Proceedings of SPIE. 2011:7886
30. Aveline B, Hasan T, Redmond RW. Photophysical and photosensitizing properties of benzoporphyrin derivative monoacid ring-A (BPD-MA). Photochemistry and photobiology. 1994;59:328-35
31. Lee GY, Kenny PA, Lee EH, Bissell MJ. Three-dimensional culture models of normal and malignant breast epithelial cells. Nat Meth. 2007;4:359-65
32. Abramoff M, Magelhaes P, Ram S. Image processing with ImageJ. Biophotonics International. 2004;11:36-42
33. Richter AM, Waterfield E, Jain AK, Canaan AJ, Allison BA, Levy JG. Liposomal delivery of a photosensitizer, benzoporphyrin derivative monoacid ring A (BPD), to tumor tissue in a mouse tumor model. Photochemistry and Photobiology. 1993;57:1000-6
34. Nichols MG, Foster TH. Oxygen diffusion and reaction-kinetics in the photodynamic therapy of multicell tumor spheroids. Physics in Medicine and Biology. 1994;39:2161-81
Author contact
![]() Corresponding author: thasanorg.
Corresponding author: thasanorg.