Impact Factor
- Issue 14; 2026
- Issue 13; 2026
- Issue 12; 2026
- Issue 11; 2026
- Issue 10; 2026
- Volume 16; 2026
- Advance Articles
- Past Issues
- Cover Images
- Cover Suggestion
- Index & Coverage
- Special Issues
Introduction
Material and Methods
Results
Discussion
Abbreviations
Supplementary Material
Acknowledgements
References
International Journal of Biological Sciences
International Journal of Medical Sciences
 Global reach, higher impact

Theranostics 2025; 15(9):4033-4053. doi:10.7150/thno.109771 This issue Cite
Research Paper
Hepatic stellate cell-derived microfibrillar-associated protein 2 prevents liver fibrosis by regulating extracellular matrix and inflammation
Wen Zhang1,2,3#, Wenyue Wu1,2,3#, Ning Zhang1,2,3, Hong Li2,3,4,5, Yameng Sun1,2,3,6, Xiaodong Ge7, Hui Han7, Shuyan Chen1,2,3, Anjian Xu2,3,4,5, Sai Santosh Babu Komakula7, Chao Wang7, Nithyananthan Subramaniyam7, Qi Han1,2,3, Aiting Yang2,3,4,5, Xuzhen Yan2,3,4,5, Natalia Nieto7,8* ![]() , Hong You1,2,3*
, Hong You1,2,3* ![]() , Wei Chen2,3,4,5,6,7
, Wei Chen2,3,4,5,6,7 ![]()
1. Liver Research Center, Beijing Friendship Hospital, Capital Medical University, Beijing 100050, China.
2. State Key Lab of Digestive Health, Beijing Friendship Hospital, Capital Medical University, Beijing 100050, China.
3. National Clinical Research Center of Digestive Diseases, Beijing Friendship Hospital, Capital Medical University, Beijing 100050, China.
4. Experimental and Translational Research Center, Beijing Friendship Hospital, Capital Medical University, Beijing 100050, China.
5. Beijing Clinical Research Institute, Beijing Friendship Hospital, Capital Medical University, Beijing 100050, China.
6. Chinese Institutes for Medical Research (CIMR), Beijing 100069, China.
7. Department of Pathology, University of Illinois Chicago, Chicago, IL 60612, USA.
8. Division of Gastroenterology and Hepatology, Department of Medicine, University of Illinois Chicago, Chicago, IL 60612, USA.
# These authors contributed equally.
* Authors share co-senior authorship.
Received 2025-1-2; Accepted 2025-2-28; Published 2025-3-10
Abstract

Microfibrillar-associated protein 2 (MFAP-2) is a crucial component of the extracellular matrix (ECM) microfibrils, yet its role in liver fibrosis remains elusive.
Methods: Human tissue arrays and mouse models of fibrosis progression and resolution were used to investigate MFAP-2 expression patterns. Mfap2 deficiency (Mfap2-/-) or overexpression (ovMfap2) mice were subjected to carbon tetrachloride (CCl4) injection or bile duct ligation (BDL) to induce liver fibrosis. Histological, biochemical, bulk, or single-cell RNA-sequencing (scRNA-seq), proteomics to analyze the matrisome, and in vitro studies were conducted.
Results: MFAP-2 was predominantly enriched in activated hepatic stellate cells (HSCs) and upregulated in advanced liver fibrosis. Although Mfap2 ablation had minimal impact on collagen deposition during CCl4 injection, it significantly delayed fibrosis regression after CCl4 cessation. The delayed fibrosis regression due to Mfap2 deficiency was likely linked to aggravated intrahepatic inflammation, ECM stabilization, and activated focal adhesion signaling in HSCs. Mechanically, inhibiting HSC-derived Mfap2 enhanced HSC interactions and increased matrisome protein production, while reducing the interaction between HSCs and liver-resident macrophages by decreasing macrophage migration inhibitory factor secretion from HSCs. Additionally, we validated the role of Mfap2 deletion in liver fibrosis using the BDL mouse model, demonstrating a more pronounced effect on fibrosis progression. Adeno-associated virus vector (serotype 6)-mediated Mfap2 overexpression in HSCs conferred protection against liver fibrosis in both models.
Conclusion: This study reveals the compensatory protective effects of HSC-derived MFAP-2 on liver fibrosis and its underlying mechanisms. Enhancing MFAP-2 in HSCs may therefore benefit patients with liver fibrosis.
Keywords: Liver fibrosis, extracellular matrix, hepatic stellate cell, macrophage, matrisome
Introduction
Excessive accumulation of extracellular matrix (ECM) during liver fibrosis results in increased matrix stiffness and viscoelasticity, ultimately culminating in cirrhosis and hepatocellular carcinoma [1, 2]. While histological fibrosis regression has demonstrated a notable reduction in the occurrence of clinical endpoint events in individuals with liver fibrosis [3, 4], there are currently no approved therapies specifically targeting liver fibrosis. Moreover, addressing the underlying cause alone is often insufficient for alleviating liver fibrosis [5]. Therefore, there is an urgent need for therapeutic targets that can either limit ECM deposition or promote its degradation in liver fibrosis.
Microfibrillar-associated protein 2 (MFAP-2) is a component of the ECM microfibrils, initially isolated from elastic tissues [6]. Despite its potential for non-covalent interaction with tropoelastin, fibrillins, biglycan, decorin, and the α3 chain of collagen VI, the absence of Mfap2 in mice does not disrupt the normal structure and function of elastin-rich tissues [7, 8]; thus, it is not essential for assembling elastic or other ECM fibrils. Instead, Mfap2-/- mice have delayed wound healing and bleeding diathesis [9]. These findings complicate the role of MFAP-2 in ECM assembly, and promote us to investigate the potential consequences of altered MFAP-2 expression on the recurring injury and healing that result in ECM remodeling during liver fibrosis.
Previous studies conducted by the Mecham group have revealed that the diverse pathological phenotypes observed in Mfap2-/- mice are closely linked to the upregulation of transforming growth factor (TGF) signaling [7-10]. MFAP-2 is known to remove active TGFβ1 from the cellular milieu and inhibit the binding of latent TGFβ1 to the ECM, functioning as an anti-inflammatory molecule. However, a recent study found that MFAP-2 inhibition via lentivirus-mediated shRNA deactivated TGFβ1 signaling in the liver, alleviating liver fibrosis and inflammation in carbon tetrachloride (CCl4) mouse models [11]. This finding contradicts the established understanding of MFAP-2 as a suppressor of inflammation through the inhibition of TGFβ1 signaling, which requires further comprehensive investigations.
In this study, we employed human liver tissue arrays, liver fibrosis mouse models, MFAP-2 (Mfap2) deficiency (Mfap2-/-) and overexpression (ovMfap2) mice, multiplex immunofluorescence (IF), multi-omics analyses, and in vitro studies to explore the role and mechanisms of MFAP-2 during the progression and, particularly, the regression of liver fibrosis across CCl4 and bile duct ligation (BDL) mouse models.
Material and Methods
Mice
Mfap2-/- mice were obtained from Cyagen Bioscience Inc. (Suzhou, China). Exons 2-to-9 of the Mfap2 gene were deleted using CRISPR/Cas-mediated genome engineering. Heterozygous Mfap2+/- mice were cross-bred to generate littermates (Mfap2+/+) as controls. C57BL/6J mice (6-8 weeks old, male, ~21.0±2.0 g, HFK Bioscience Co. Ltd., Beijing, China) were injected intravenously via the tail vein with 1.8 × 10¹¹ viral genomes of the AAV6-CMV-Mfap2-HA-EF1a-mNeonGreen-3×FLAG-WPRE vector (OBiO, Shanghai, China) to generate myofibroblast-specific Mfap2 overexpressed mice (ovMfap2). As a control (Null), the AAV6-CMV-MCS-EF1a-mNeonGreen-3×FLAG-WPRE vector (OBiO) was injected intravenously via the tail vein.
Induction of liver injury
The CCl4 (Innochem, Shanghai, China) was used to induce liver fibrosis progression and resolution. C57BL/6J, Mfap2+/+, Mfap2-/-, Null, and ovMfap2 mice received intraperitoneal injections twice a week with 12.5% CCl4 in mineral oil (MO, 1/7, v/v, Thermo Fisher Scientific, MA, USA) at a dose of 0.01 ml/g of body weight for one week (1W), four weeks (4W), six weeks (6W), eight weeks (8W), or an equal volume of MO as control. Liver fibrosis resolution was achieved after a three- or four-week cessation of CCl4 administration (R3W or R4W). Additionally, BDL was performed to induce cholestatic liver fibrosis, as previously reported [12]. All mice were sacrificed at the indicated time points, and serum and liver samples were collected for further analyses.
Human liver tissue array
A paraffin-embedded human liver tissue array, consisting of adjacent normal liver tissues (n = 26), cancer-adjacent liver tissues (n = 4), chronic hepatitis samples (n = 10), and cirrhosis specimens (n = 40), was obtained from US Biomax, Inc. (MD, USA).
General methodology
Measurement of serum ALT and AST levels, along with H&E staining and Sirius red staining, mRNA and protein isolation, qPCR, Western blot, immunohistochemistry (IHC), and IF staining were performed as reported in our prior study [13]. The isolation of mouse primary hepatocytes, macrophages (Møs), and hepatic stellate cells (HSCs) was performed using Percoll (Cytiva, MA, USA) or Nycodenz (AXELL, Stockholm, Switzerland) as previously reported [14, 15].
Multiplex IF
Multiplex IF staining was performed using a PANO 4-plex IHC Kit (Panovue, Beijing, China) following the manufacturer's instructions. Briefly, paraffin-embedded liver slices (7-μm) were dewaxed, rehydrated, and subjected to antigen retrieval following standard IHC procedures. After blocking with 10% bovine serum albumin, a series of distinct primary antibodies were sequentially applied, followed by incubation with horseradish peroxidase-conjugated secondary antibodies and tyramide signal amplification (TSA). Microwave heat treatment was applied to the slides following each TSA step. Nuclei were counterstained with DAPI after labeling all target antigens.
Histological image acquisition and semi-quantitation
Histological images were acquired using a 3DHISTECH Panoramic Scanner (3DHISTECH, Budapest, Hungary) or a laser scanning confocal microscope (Olympus, Tokyo, Japan). Semi-quantitative analysis of Sirius Red staining or IHC staining was conducted using Image-Pro Plus software (version 6.0, Media Cybernetics, MD, USA). The liver injury severity was assessed and graded based on H&E staining, employing the Suzuki score system on a scale from 0-to-4 [16].
Active TGFβ1 measurement
The quantitation of active TGFβ1 in mouse liver tissue was conducted using the commercially available LEGEND MAX™ Free Active TGFβ1 ELISA Kit (Biolegend, CA, USA) according to the manufacturer's instructions.
Cell culture and treatment
The human HSC line LX-2 cells were cultured in Minimum Essential Medium (Procell, Wuhan, China), supplemented with 10% fetal bovine serum (Sigma, MO, USA) and 100 U/mL penicillin and streptomycin (Gibco, NY, USA). The human monocyte THP-1 cells were cultured in RPMI-1640 Complete Medium (Procell). All cells were maintained in a humidified cell culture incubator at 37 °C with a 5% CO2 and 95% O2 atmosphere. Exponentially growing cells were seeded in 6-well plates. Upon reaching 70-80% confluence, they were transfected with the following substances using X-tremeGENE HP DNA Transfection Reagent (Roche, Basel, Switzerland): pRP[Exp]-EGFP/Puro-EF1A>hMFAP2/FLAG plasmid (2.0 μg/mL, Vectorbuilder, Guangzhou, China), Null plasmid (pRP[Exp]-EGFP/Puro-EF1A>ORF_Stuffer, Vectorbuilder, 2.0 μg/mL), human MFAP2 siRNA (target sequence: ACUGUACGAACACAGAUCUCCTTP, 50 nM, OBiO), or negative control (NC) siRNA (50 nM, OBiO). These transfections were performed with or without stimulation of recombinant human (rh)TGFβ1 (10 ng/mL, MCE, Shanghai, China). After incubation for the indicated times, cells or their conditioned media (CM) were collected for further analysis or co-culture.
Protein concentration
Proteins in the cell culture medium were concentrated using the Pierce™ Protein Concentrator PES 10K MWCO, 2-6 mL, 24PK (Thermo Fisher Scientific), following the vendor's instructions. The cell culture media were initially loaded into the concentrator sample chamber and placed inside a collection tube. Subsequently, the concentrator sample chamber was positioned in the rotor with appropriate counterbalance and centrifuged at 12,000 g until the desired concentration factor was attained. The concentrated sample from the bottom and center of the sample chamber was carefully aspirated using a pipette tip and utilized for Western blotting analyses.
Liver decellularization
Liver tissues (~100 mg) from Mfap2-/- and Mfap2+/+ mice injected with CCl4 for eight weeks were finely dissected into small pieces, weighed, and then transferred into pre-cooled tubes for decellularization following the method outlined by Baiocchini et al. [17]. Initially, plasma proteins were removed by overnight shaking (600 rpm, 4 ℃) in a solution containing 0.5 M NaCl (Sigma), 10 mM Tris base (Solarbio, Beijing, China), and 1X protease inhibitor (Yeasen, Shanghai, China). Following centrifugation, the pellets were incubated with 1% sodium dodecyl sulfate (SDS, Sigma) and 1X protease inhibitor, shaken at 800 rpm overnight at room temperature. The SDS decellularization process was repeated until the liver tissues were completely decellularized. Subsequently, 80% acetone (Sinopharm Chemical Reagent Co., Ltd, Beijing, China) was used to co-incubate with the pellets for 90 minutes to eliminate residual SDS. The quality of decellularized ECM scaffolds was evaluated through Sirius Red staining.
Proteolytic digestion of liver ECM scaffold
Following our previously described protocol, the liver ECM scaffold underwent in-solution digestion [18]. Initially, decellularized ECMs (~5-10 mg of dry weight) were resuspended and treated with 10 mM dithiothreitol (Thermo Fisher Scientific) in an 8M urea solution (Sigma) at 37 °C for 2 hours with continuous agitation for reduction. Subsequently, alkylation was performed by adding a 500 mM iodoacetamide solution (Thermo Fisher Scientific) to reach a final concentration of 25 mM in the urea solution, followed by a 30-minute incubation in the dark at room temperature. For de-glycosylation, the urea solution was diluted to 2 M with 100 mM ammonium bicarbonate (Sigma), and 1,000 U of Peptide-N-Glycosidase F (BioLabs, CA, USA) was added for a 2-hour incubation with continuous agitation. The ECM proteins were then enzymatically digested into peptides through sequential treatment with 1 μg of Lys-C (Wako, VA, USA) for 2 hours, 3 μg of trypsin (Promega, CA, USA) overnight, and an additional 2-hour treatment with 1.5 μg of trypsin the next day, all conducted at 37 ℃ with continuous shaking. The digestion process was terminated by acidification using freshly prepared 50% trifluoroacetic acid (Thermo Fisher Scientific) until the pH dropped to ≤ 2.0. The acidified samples were centrifuged at room temperature for 5 minutes at 15,000 g, and the peptide-containing supernatant was immediately used. Subsequently, the Sep-Pak C18 columns (Waters, MA, USA) were employed for desalting the peptide sample. The column was activated with 100% acetonitrile (Sigma), equilibrated with 0.1% formic acid (Sigma), and loaded with the peptide solution. Impurities were removed by washing with 0.1% formic acid, and elution was performed using 70% acetonitrile. The eluted fractions were freeze-dried in a vacuum freeze dryer, reconstituted in 2% acetonitrile/0.1% formic acid, and quantified using the Pierce BCA Protein Assay Kit (Thermo Fisher Scientific) following the manufacturer's guidelines.
Label-free liquid chromatography-tandem mass spectrometry (LC-MS/MS) analysis
The Nanoflow LC-MS/MS analysis employed a quadrupole Orbitrap mass spectrometer (Orbitrap Eclipse, Thermo Fisher Scientific), directly interfaced with an EASY nLC 1200 ultra-high-pressure system (Thermo Fisher Scientific) through a nano-electrospray ion source. Peptide samples, at 1 μg per injection, were loaded onto a 25 cm analytical column (150-μm inner diameter, filled with ReproSil-Pur C18-AQ 1.9-µm silica particles; Beijing Qinglian Biotech Co., Ltd, Beijing, China) and eluted using a solvent gradient. This gradient initiated at 6% and increased to 12% over 15 minutes, followed by an increase from 12% to 30% over the next 48 minutes, further rising to 40% for 10 minutes, and finally reaching a 10-min purge at 95% solvent, all at a flow rate of 300 nL/minutes (comprising 80% acetonitrile and 0.1% formic acid). The entire run lasted 85 minutes, during which a specially designed oven maintained the column at a constant temperature of 60°C. The MS instrument operated in data-dependent acquisition mode, acquiring MS spectra in the Orbitrap mass analyzer at a resolution of 120,000 over the 350-2000 m/z range, with an automatic gain control target of 4E5 and a maximum ion injection time of 50 milliseconds. Following higher-energy collisional dissociation at a normalized collision energy of 30%, MS/MS spectra were captured in the Orbitrap at a resolution of 15,000, with an automatic gain control target of 5E4 and a maximum ion injection time of 22 milliseconds.
MS data preprocessing
The raw data from MS was preprocessed using the Proteome Discoverer suite (version 2.4, Thermo Fisher Scientific). Tandem mass spectra were searched against the UniProt database (https://www.uniprot.org/) using the Sequest HT search engine with specific parameters: fully tryptic specificity, up to two missed cleavages allowed, a minimum peptide length of 6, fixed carbamidomethylation of cysteine residues (+57.02146Da), variable modifications for oxidation of methionine residues (+15.99492Da), a precursor mass tolerance of 15 ppm, and a fragment mass tolerance of 0.02Da for MS2 spectra collected in the Orbitrap. Peptide spectral matches and peptides were filtered to ensure a false discovery rate (FDR) < 1% using a percolator. Following spectral assignment, peptides were assembled into proteins and further refined based on the combined probabilities of their constituent peptides to achieve a final FDR of < 1%. The top matching protein or 'master protein' was determined to contain the highest count of unique peptides and the lowest percent peptide coverage. Unique and razor (i.e., parsimonious) peptides were utilized for quantification. Matrisome protein levels identified via LC-MS/MS were compared between Mfap2-/- and Mfap2+/+ mice.
Bulk RNA-seq analysis
Bulk RNA-seq analysis was conducted on frozen livers from CCl4-treated Mfap2+/+ and Mfap2-/- mice (8W and R4W, n = 4 for each group of mice) as previously described [19]. Initially, total RNA was extracted from mouse frozen liver tissues using the RNA simple Total RNA kit (Fastagen, Shanghai, China) following the manufacturer's protocol. Subsequently, poly(A) mRNAs were enriched using magnetic oligo (dT) beads (Invitrogen, CA, USA). According to the guidelines, cDNA libraries were constructed using the NEBNext Ultra RNA Library Prep Kit (New England Biolabs, Hitchin, UK) or the Illumina VAHTS® Universal V6 RNA-seq Library Prep Kit (Vazyme, Nanjing, China). 125 bp paired-end libraries from 8W mice were sequenced on the Illumina HiSeq2500 platform (Biomarker Technologies Co., Ltd, Beijing, China). 150-bp paired-end libraries from R4W mice were sequenced on the Illumina NovaSeq 6000 platform (Shanghai NextCODE Co., Ltd, Shanghai, China). The HISAT software [20] aligned clean reads to the mouse genome (mm10). Read counts and FPKM values for each identified gene were calculated using Cufflinks [21]. Differentially expressed genes in livers from Mfap2+/+ and Mfap2-/- mice were analyzed using student's t-test and fold change (FC). FC > 1.5 were set as statistically significant criteria. The enriched Kyoto Encyclopedia of Genes and Genomes (KEGG) pathways of the significantly downregulated or upregulated genes were determined using the DAVID web tool (https://david.ncifcrf.gov/). KEGG pathways with a Benjamini-corrected p value < 0.05 were visualized using the ggplot2 package. The mMCPcounter package [22] was used to estimate the abundance of infiltrating immune and stromal cell populations in mouse livers based on the bulk RNA-seq data.
Library preparation for scRNA-seq and sequencing
scRNA-seq of liver non-parenchymal cells (NPCs) isolated from mice injected with mineral oil (control), CCl4 (peak fibrosis, four weeks), and during fibrosis resolution (1-week recovery) was conducted using the NovaSeq 6000 system (University of Illinois at Urbana-Champaign DNA Sequencing Laboratory, IL, USA). The methodology for in vivo isolation of NPCs and scRNA-seq has been previously described in our prior study [19]. Additionally, scRNA-seq was performed on liver NPCs isolated from CCl4-injected Mfap2+/+ and Mfap2-/- mice (eight weeks) by Shanghai OE Biotech. Co. Ltd. (Shanghai, China). To isolate the NPCs, anesthetized mice underwent a slow infusion of ice-cold PBS through the hepatic portal vein to remove circulating red blood cells. Subsequently, the livers were carefully shredded on ice into small pieces (less than 1 mm cubic) and placed in a gentleMACS C tube (Miltenyi Biotec, Bergisch Gladbach, Germany) containing a solution of digestive enzymes (Mouse Liver Dissociation Kit; Miltenyi Biotec). The liver was then homogenized using a GentleMACS™ dissociation machine (Miltenyi Biotec). The resulting cell mixture was filtered through a 40-µm cell strainer (Miltenyi Biotec). After centrifugation (300 g, 5 minutes), the cell pellet was resuspended in a 40% Percoll solution (Cytiva). Following a second round of centrifugation (600 g, 15 minutes), the cell pellet was collected and then processed for GEM generation and barcoding, post-GEM-RT cleanup and cDNA amplification, and 3ʹ gene expression library construction. These steps involved the use of Chromium Single Cell 3' Library & Single Cell 3' v3 Gel Beads (10× Genomics, CA, USA), DynaBeads® MyOneTM Silane Beads (Life Technologies, MA, USA), SPRIselect Reagent Kit (Life Technologies), Qubit dsDNA Assay Kit (Life Technologies), and Agilent High Sensitivity DNA Kit (Agilent, CA, USA), according to the manufacturer's protocols. Finally, the cDNA libraries were sequenced using the MGISEQ-2000 sequencing platform (MGI Tech, Shenzhen, China).
Preprocessing and scRNA-seq data analysis
The raw scRNA-seq data underwent preprocessing using 10× Genomics software CellRanger (version 3.1.0), encompassing sample demultiplexing, alignment to the reference genome (mm10), filtering, and gene-level unique molecular identifier counting. Subsequently, the Seurat package was employed for quality control. Specifically, cells with nFeature_RNA > 1000 & percent_mito < 25% & percent_ribo > 3% & percent_hb < 1% were retained, and genes expressed in more than 5 cells were retained. The FindVariableGenes function in the Seurat package was used to identify highly variable genes, which were then subjected to principal component analysis for dimension reduction and visualized in two-dimensional space using uniform manifold approximation and projection for dimension reduction plot. Cell types were annotated according to the known marker genes. The FindMarkers function in the Seurat package was employed to identify marker genes that exhibited differential upregulation in each cell type compared to other cell groups (adjusted p-value < 0.05 and Log2[FC] > 0.5). To gain insights into biological pathways, KEGG pathway enrichment analysis was performed on the top 1,000 genes with the highest abundance using the ClusterProfiler package [23]. Lastly, the CellChat package [24] was utilized to analyze cell-to-cell interactions based on the expression of specific ligands and receptors.
Publicly available dataset analysis
Transcriptomic profiles associated with human or mouse liver fibrosis were publicly available from the GEO database. The datasets GSE84044 [25], GSE149601 [26], and GSE193066 [27] include gene expression profiles derived from human non-fibrotic and fibrotic liver tissues with various etiologies, including hepatitis B virus, hepatitis C virus, or metabolic dysfunction-associated steatotic liver disease. Datasets GSE55747 and GSE74605 consist of gene expression profiles derived from mouse livers treated with CCl4 or thioacetamide. MFAP2 gene expression, detected by microarray or bulk RNA-seq, underwent normalization using the robust multichip average algorithm [28] or was scaled into fragments per kilobase per million (FPKM), respectively. Additionally, GSE145086 [29] and GSE233751 [19, 30], which contain 10× Genomics scRNA-seq data of isolated NPCs from normal or CCl4-induced mouse fibrotic livers, were analyzed using Seurat package [31] to identify the cellular sources of liver Mfap2 gene expression.
Clinical relevance analysis of human liver MFAP2 expression
Liver transcriptomic profiles were obtained from 15 treatment-naïve patients with chronic HBV infection and a baseline Ishak score of ≥ 4, sourced from our previously published dataset (PRJCA010948) [19] as well as our unpublished transcriptomic dataset (available upon request). These patients underwent paired liver biopsies at baseline and after 78 weeks of antiviral treatment. The regression of liver fibrosis was histologically assessed as previously defined [19]. After correcting for batch effects using the ComBat package [32] and extracting MFAP2 gene expression levels, we analyzed the relationship between baseline liver MFAP2 expression and fibrosis regression following HBV suppression.
Ethical guidelines
Mice were housed and bred in a specific pathogen-free grade animal facility, maintained at a temperature of 23±2℃, under a 12-hour light-dark cycle, and provided with standard chow and water ad libitum. The Ethics Committee of Beijing Friendship Hospital, Capital Medical University, and the University of Illinois Chicago IACUC office approved studies involving mice. All in vivo mouse experiments were conducted per the ARRIVE guidelines [33]. Written informed consent was obtained from all enrolled patients prior to screening. The study protocols were approved by the Ethics Committees of all participating centers (2016-P2-021-04, 2018-P2-106-05) and adhered to the principles of the Declaration of Helsinki.
Data availability statement
Raw and processed data from bulk RNA RNA-seq or scRNA-seq have been deposited in the GEO database under accession numbers GSE272283 and GSE272284. Raw MS data and Proteome Discoverer output files containing protein identifications have been submitted to the ProteomeXchange consortium through the PRIDE partner repository with the dataset identifier PXD053782. Detailed information regarding the publicly available bulk and scRNA-seq datasets used in this study is presented in Table S1. Details of antibodies, chemicals, recombinant proteins, commercial kits and reagents, cell lines, organisms/strains, primers for qPCR, adeno-associated virus (serotype 6, AAV6) vectors, shRNAs, siRNAs, and the software used in this study are listed in Table S2.
Statistical analysis
Continuous variables are expressed as mean ± standard error (SEM). Student's t-test or Mann-Whitney U-test was utilized to compare continuous variables between groups. One-way ANOVA, followed by the least significant difference test, was employed to compare continuous variables among three or more groups. Categorical variables were presented as percentage and compared by Chi-square test or Chi-square trend test between any two groups. A p-value < 0.05 was considered statistically significant. All statistical analysis was performed using the GraphPad Prism version 9 (GraphPad Software, Inc., CA, USA) and R 4.2.1 software (https://www.r-project.org/).
Results
MFAP-2 is predominantly enriched in activated HSCs and upregulated in advanced fibrotic livers of humans and mice
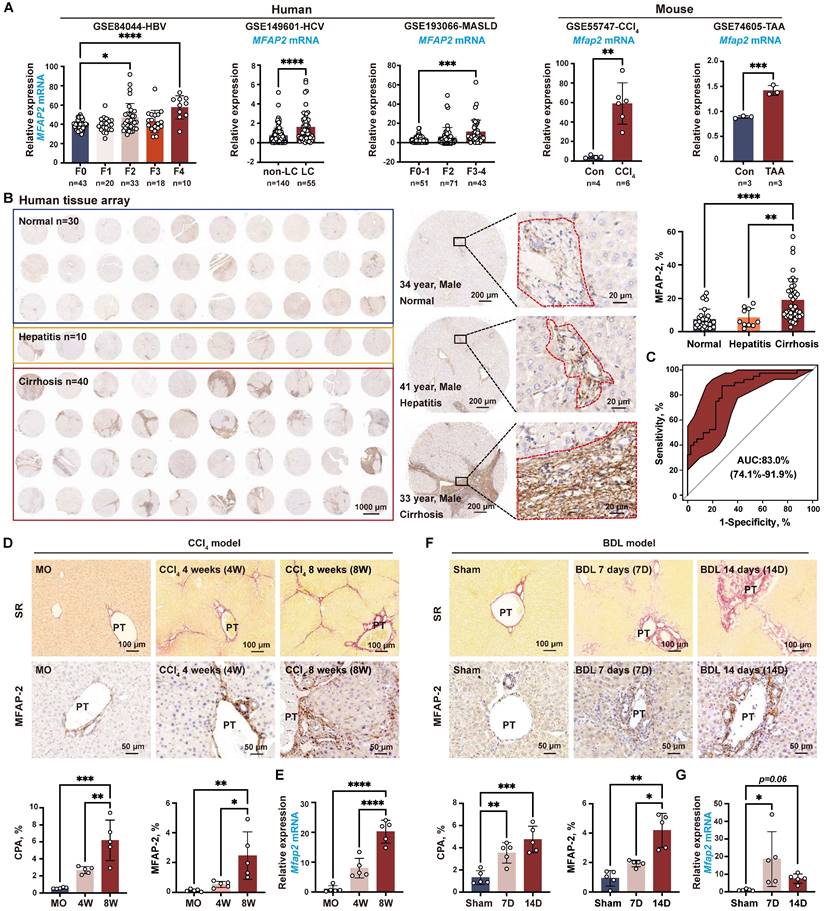
To investigate the expression pattern of MFAP-2 in liver fibrosis, we first analyzed publicly available transcriptomic datasets. As depicted in Figure 1A, Mfap2 was significantly upregulated in fibrotic livers compared to non-fibrotic livers from both humans and mice, irrespective of etiology. Immunostaining of a human liver tissue array showed a nearly twofold increase in MFAP-2 expression in cirrhotic livers compared to normal or hepatitis livers (Figure 1B). Notably, MFAP-2 expression demonstrated strong discriminatory power to effectively distinguish fibrotic from non-fibrotic livers, with an area under the curve of 0.83 (Figure 1C). We further validated the expression pattern of MFAP-2 in mouse models of liver fibrosis (CCl4 and BDL). Our results indicated that both Mfap2 gene expression and MFAP-2 protein levels were significantly elevated, particularly in advanced liver fibrosis (Figure 1D-G), as seen in humans. Moreover, MFAP-2 protein expression showed a strong correlation with liver fibrosis induced by BDL operation (r = 0.76, p < 0.01) and CCl4 injection (r = 0.66, p < 0.01) (Figure S1).
MFAP-2 is elevated in fibrotic livers from humans and mice. (A) Analysis of MFAP2/Mfap2 gene expression using publicly available datasets. The sample size for each group is indicated below the respective bar. (B) IHC and quantification of MFAP-2 expression in normal (n = 30), hepatitis (n = 10), and cirrhosis (n = 40) livers from a human tissue array. (C) ROC analysis based on MFAP-2 expression in liver slices from the human tissue array. (D-G) Sirius Red staining, IHC, and qPCR analyses of MFAP-2 (Mfap2) expression in liver tissues from CCl4 and BDL mouse models (n = 5/group). Data are expressed as mean ± SEM. *p < 0.05, **p < 0.01, ***p < 0.001, and ****p < 0.0001. CPA: collagen proportional area; LC: liver cirrhosis; MO: mineral oil; non-LC: non-liver cirrhosis; PT: portal tract; SR: Sirius Red staining; TAA: thioacetamide.
Previous studies have shown that MFAP-2 is mainly expressed in fibroblasts within adipose tissue and the dermis [34, 35]; thus, we investigated whether fibroblasts were the primary source of MFAP-2 in the liver. To this end, we analyzed the publicly available scRNA-seq dataset (GSE145086) [29] and our previously published scRNA-seq dataset (GSE233751) [19, 30] of NPCs from livers with CCl4-induced liver fibrosis. As anticipated, Mfap2 was abundantly expressed in HSCs from CCl4-induced liver fibrosis but showed a notable decrease during fibrosis regression (Figure 2A-B).
MFAP-2 is enriched and increased in activated HSCs. (A) scRNA-seq analysis of Mfap2 gene expression in CCl4-injected mouse livers, using the publicly available dataset GSE145086. The t-SNE plots, displayed from left to right, show cell types, samples (Con: control; 2W: two weeks; 4W: four weeks), and Mfap2 gene expression. (B) Comparison of Mfap2 gene expression in HSCs from control (MO), peak liver fibrosis, and fibrosis regression in mice, based on our published scRNA-seq data (GSE233751). (C) Immunofluorescent staining of α-SMA (green), LYVE1 (green), F4/80 (green), CD34 (green), CK19 (green), MFAP-2 (red), and DAPI (nucleus, blue) in liver tissues from CCl4-injected mice. Co-localization is indicated in yellow. (D-F) UMAP plots showing eleven annotated cell types along with Mfap2 gene expression, and a comparison of the proportion of Mfap2+ liver cells. (G) Immunofluorescent staining of MFAP-2 (red), α-SMA (green), and DAPI (nucleus, blue) in liver tissues from Mfap2+/+ and Mfap2-/- mice, with co-localization shown in yellow. Data are expressed as mean ± SEM. ****p < 0.0001.
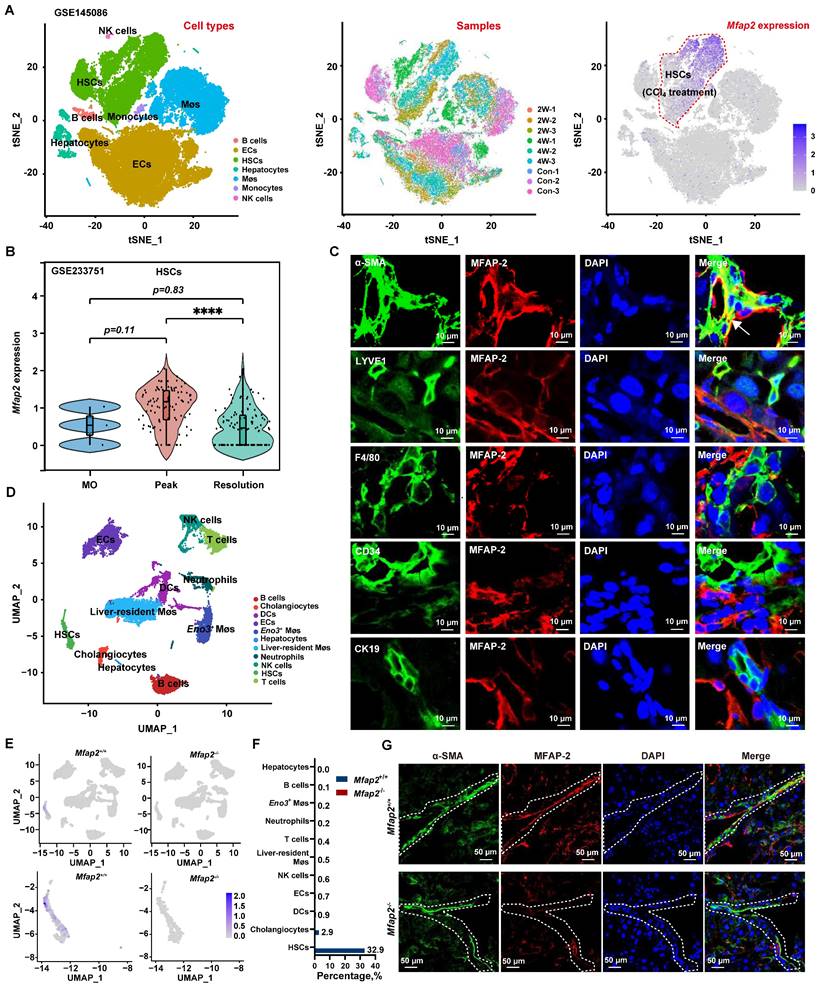
Subsequent co-localization studies revealed that α-SMA+ HSCs were the main cellular source of MFAP-2 expression, while LYVE1+ endothelial cells and F4/80+ Møs displayed minimal MFAP-2 expression (Figure 2C). To further pinpoint the cellular source of MFAP-2, we performed scRNA-seq on NPCs from Mfap2-/- and Mfap2+/+ mice injected with CCl4 for eight weeks (Figure S2). After quality control and filtering, clustering of 19,295 high-quality cells identified eleven cell lineages based on established cell makers (Figure 2D). We found that Mfap2 was predominantly expressed in 32.9% of HSCs and minimally expressed in other liver cells from Mfap2+/+ mice injected with CCl4 for eight weeks; while its expression was absent in Mfap2-/- mice (Figure 2E-F). Co-localization studies corroborated the findings from the scRNA-seq analysis (Figure 2G). These findings indicate that MFAP-2 is predominantly expressed and upregulated in activated HSCs within advanced fibrotic livers, but its role in the pathogenesis of liver fibrosis remains unknown.
Despite Mfap2 ablation shows minimal impact on collagen deposition during CCl4 injection, it delays fibrosis regression after CCl4 cessation
Given that activated HSCs were the main MFAP-2-producing cells in the liver, we used Mfap2-/- mice to explore the role of HSC-derived MFAP-2 in liver fibrosis. Mice were intraperitoneally injected with CCl4 twice a week for one, four, or eight weeks to induce acute liver injury, early fibrosis, and advanced fibrosis, respectively (Figure 3A). Although MFAP-2 (Mfap2) was almost deleted in the livers of Mfap2-/- mice at all time points (Figure 3B-C), continuous CCl4 injection had minimal effects on fibrosis progression, as indicated by comparable liver-to-body weight ratio, serum ALT and AST levels, ECM collagen deposition, and COL1 and α-SMA expression between Mfap2-/- and Mfap2+/+ mice injected with CCl4 for one, four, or eight weeks (Table S3 and Figure 3D-E).
Mfap2-/- mice show slower fibrosis regression after CCl4 cessation. Mfap2-/- and Mfap2+/+ mice were injected with CCl4 for one (1W), four (4W), or eight (8W) weeks, followed by a cessation period of four weeks (R4W). (A) Schematic diagram illustrating the model of CCl4-induced liver fibrosis and subsequent resolution. (B) qPCR analysis of Mfap2 gene expression (n = 5-6/group). (C) IHC analysis of MFAP-2 expression. (D) Sirius Red staining of liver sections and IHC analysis of COL1 expression (n = 5-6/group). (E) Immunoblotting analysis of COL1 and α-SMA expression (n = 5-6/group). Data are expressed as mean ± SEM. *p < 0.05, **p < 0.01, ***p < 0.001, and ****p < 0.0001. ns: not significant; PT: portal tract.
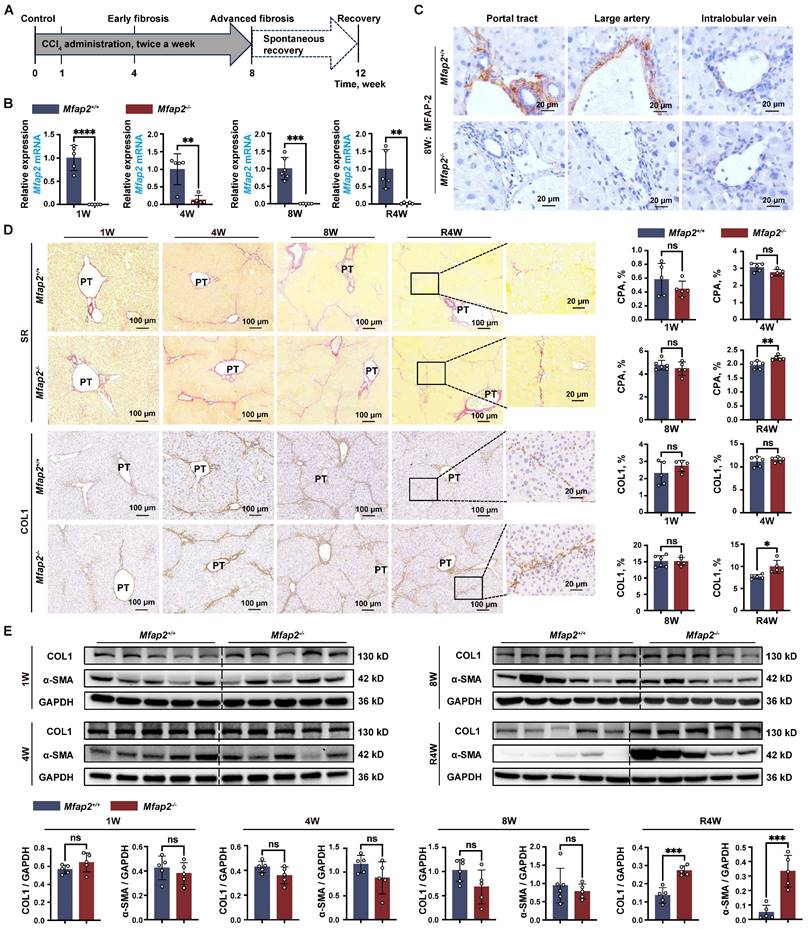
Given the well-established role of MFAP-2 as an ECM protein [6] and its upregulation in activated HSCs, we hypothesized that Mfap2 ablation could change the ECM, thereby affecting the regression of liver fibrosis after CCl4 cessation. To evaluate this, both Mfap2+/+ and Mfap2-/- mice that had been injected with CCl4 for eight weeks were allowed to recover. After a four-week recovery period following CCl4 cessation, the liver-to-body weight ratio and serum ALT and AST levels remained comparable between Mfap2-/- and Mfap2+/+ mice (Table S3). Surprisingly, immunostaining and morphometric analysis of COL1 revealed that Mfap2-/- mice exhibited more pronounced, thicker, and continuous collagen fibers in the liver septal areas compared to Mfap2+/+ mice (Figure 3D), suggesting a delayed fibrosis regression in Mfap2-/- mice. Moreover, intrahepatic COL1 expression was found to be two-fold higher, and α-SMA expression was 6.7-fold higher in Mfap2-/- mice than those in Mfap2+/+ mice after four weeks of resolution (Figure 3E). To precisely evaluate the role of Mfap2 in liver fibrosis regression, we conducted bulk RNA-seq on regressive liver tissues from both groups of mice. As illustrated in Figure S3, the upregulated genes (n = 468) in Mfap2-/- mice were predominantly linked to immune and FA signaling-related pathways when compared to Mfap2+/+ mice; while the downregulated genes (n = 84) in Mfap2-/- mice did not show significant enrichment in any pathways. These findings precisely highlight that Mfap2 ablation evidently delays liver fibrosis regression.
Mfap2 deficiency-induced intrahepatic inflammation aggravation contributes to the delayed fibrosis regression after CCl4 cessation
To elucidate the underlying cause of the delayed fibrosis regression observed in Mfap2-/- mice, we performed bulk RNA-seq analysis on the livers of Mfap2-/- and Mfap2+/+ mice that had been injected with CCl4 for eight weeks. This analysis unveiled that the absence of MFAP-2 did not significantly alter the gene expression of Col1a1 and Acta2, but notably increased the expression of several other collagen-encoding genes (Col1a2, Col3a1, Col4a1, Col4a2, Col5a1, Col5a2) as well as pro-inflammatory genes (Tnf, Il1a, Il1b, Ccl2), which were further validated by qPCR analysis (Figure 4A and S4A). Overall, a total of 930 genes were found to be upregulated in the livers of Mfap2-/- mice compared to Mfap2+/+ mice after injecting CCl4 for eight weeks, with a predominant enrichment in immune-related pathways (i.e., chemokine signaling pathway, cytokine-cytokine receptor interaction, NOD-like receptor signaling pathway, NF-kappa B signaling pathway); in contrast, only 77 genes were downregulated in the livers of Mfap2-/- mice, primarily associated with metabolic signaling (Figure 4A-C). These results further underscore that Mfap2 deletion aggravates intrahepatic inflammation while exacerbating metabolic dysfunction at the molecular level.
Mfap2-/- mice exhibit increased intrahepatic inflammation. Mfap2-/- and Mfap2+/+ mice were injected with CCl4 for one (1W), four (4W), or eight (8W) weeks, followed by a cessation period of four weeks (R4W). (A) Volcano plot illustrating differentially expressed genes (n = 4/group; p < 0.05 & FC>1.5). (B) Significantly enriched KEGG pathways based on upregulated or downregulated genes (Benjamini-corrected p < 0.05). (C) Heatmaps displaying gene expression in representative immune-related KEGG pathways. (D) Comparisons of liver immune and stromal cell populations (n = 4/group). (E) H&E staining of liver slices and IHC analysis of F4/80 or CD68 expression (n = 5-6/group). (F) Immunofluorescent staining of COL1 (green), F4/80 (red), and DAPI (nucleus, blue). Data are expressed as mean ± SEM. *p < 0.05, **p < 0.01. ns: not significant; PT: portal tract.
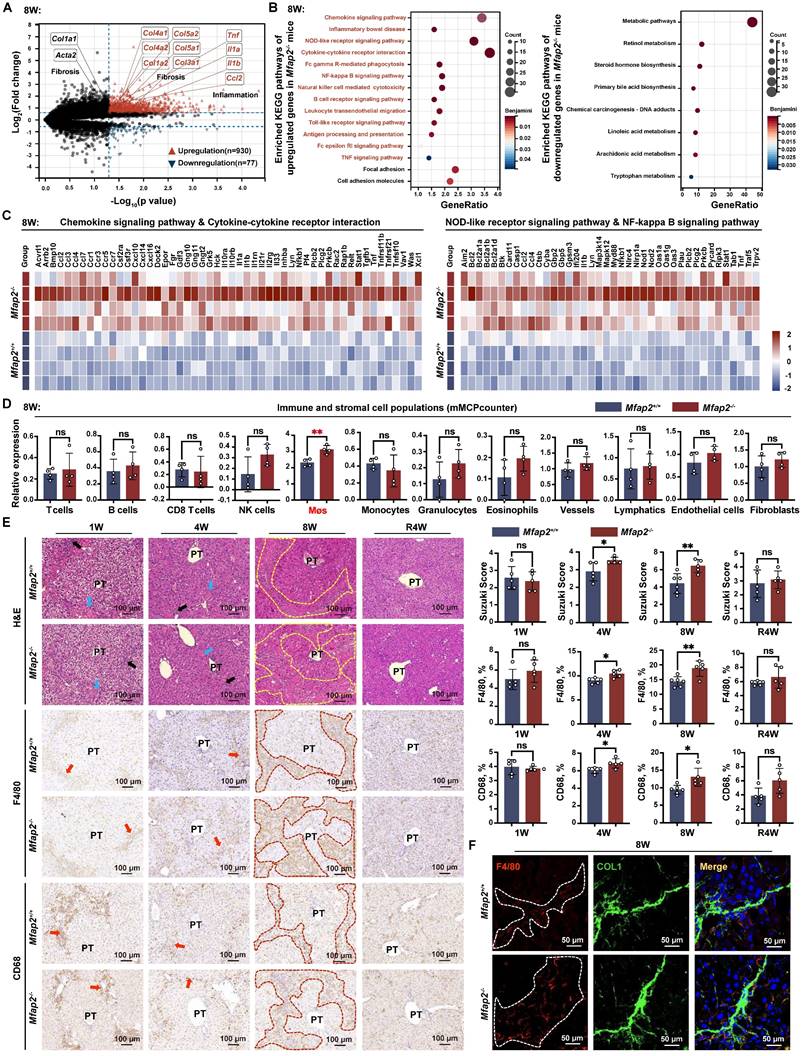
Subsequently, we employed the mMCPcounter algorithm [22] to deconvolute and compare the populations of liver stromal and immune cells between Mfap2+/+ and Mfap2-/- mice injected with CCl4 for eight weeks, based on the bulk RNA-seq data. Notably, only Møs showed a significant increase in Mfap2-/- mice (Figure 4D). Analysis of the Suzuki score of the H&E-stained sections, along with IHC or immunoblotting of F4/80 or CD68, demonstrated that Mfap2 deficiency in activated HSCs led to increased infiltration of Møs into the livers of mice subjected to chronic CCl4 injury (Figure 4E and S5A). Co-localization studies further confirmed that Mfap2 ablation exacerbated intrahepatic inflammation, as evidenced by the increased presence of F4/80+ Møs surrounding the collagenous fibers (Figure 4F). In summary, the loss of Mfap2 worsens intrahepatic inflammation, thereby hindering the regression of liver fibrosis.
Mfap2 deletion induces ECM stabilization and activates focal adhesion (FA) signaling in HSCs, impeding the spontaneous fibrosis regression
In addition to the infiltration of Møs, the bulk RNA-seq analysis also revealed that FA signaling and cell adhesion molecules were more activated in the livers of Mfap2-/- mice than in Mfap2+/+ mice after eight weeks of CCl4 injection (Figure 5A). To further investigate this, we performed immunoblotting and confirmed that the lack of Mfap2 induced the activation of FA signaling, as evidenced by increased expression of Tensin-2, FAK, Vinculin, and α-Actinin in the livers from Mfap2-/- mice at eight weeks of CCl4 injection (Figure 5B). Notably, after four weeks of fibrosis regression, the difference in the activation of liver FA signaling became more pronounced (Figure 5B). Moreover, co-localization studies demonstrated that Talin-1, a crucial component of FAs [36], co-localized with α-SMA+ Desmin+ HSCs, suggesting that the activation of FA signaling following Mfap2 deletion mainly occurs in activated HSCs (Figure 5C).
Mfap2 deletion activates FA signaling in HSCs and stabilizes the ECM following CCl4 injection. Mfap2-/- and Mfap2+/+ mice were injected with CCl4 for four (4W) or eight (8W) weeks, followed by a cessation period of four weeks (R4W). (A) Heatmaps displaying gene expression of molecules involved in FA and cell adhesion signaling. (B) Immunoblotting analysis of FA signaling markers (n = 5-6/group). (C) Multiplex IF staining of Talin-1 (green), α-SMA (red), Desmin (grey), and DAPI (nucleus, blue). Co-localization of Talin-1 and α-SMA is indicated in yellow. (D) Workflow for liver decellularization, proteolytic digestion, and quantification by MS. (E) Comparisons of insoluble collagens and elastic fiber assembly-related ECM components in the decellularized ECM scaffolds (n = 3/group). (F) Immunofluorescent staining of MFAP-2, COL1 (A1), COL1 (A2), Elastin, FBN1, and LOXL1 in decellularized ECM scaffolds. Data are expressed as mean ± SEM. *p < 0.05, **p < 0.01, ***p < 0.001, ****p < 0.0001. ns: not significant.
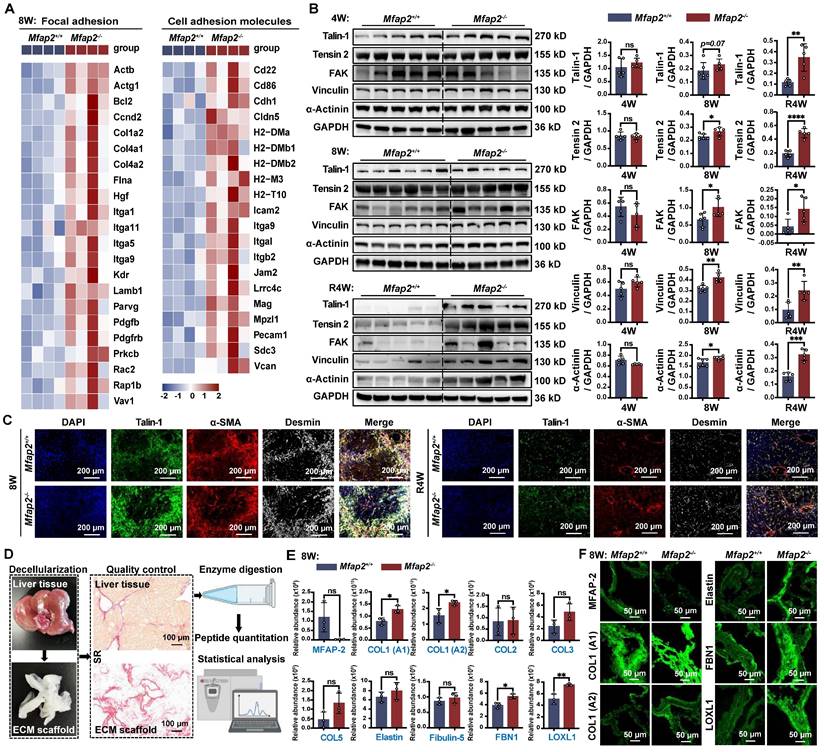
Since increased FA signaling is often a consequence of ECM remodeling [37], its activation suggests the assembly of a more stable ECM scaffold resulting from Mfap2 ablation. To investigate this, we decellularized the liver, performed proteolytic digestion, and quantified the components using MS. This analysis allowed us to identify the insoluble matrisome members present in the liver ECM scaffolds of Mfap2-/- and Mfap2+/+ mice after eight weeks of CCl4 injection (Figure 5D). As shown in Figure 5E-F, MFAP-2 levels were nearly undetectable, while the levels of insoluble COL1, FBN1, and LOXL1 significantly increased in the liver ECM scaffolds of Mfap2-/- mice following CCl4 treatment. Given that LOXL1 is responsible for forming covalent cross-links that stabilize collagen fibrils [38, 39], we speculate that Mfap2 deletion increases the expression and secretion of ECM components, including LOXL1 from HSCs, which likely contributes to ECM stabilization and the subsequent activation of FA signaling.
Loss of Mfap2 enhances ECM stabilization by accelerating the production of matrisome proteins, while simultaneously exacerbating intrahepatic inflammation by reducing macrophage migration inhibitory factor (MIF)
To elucidate the cellular and molecular mechanisms underlying the enhanced ECM stabilization and intrahepatic inflammation due to Mfap2 ablation, we analyzed the scRNA-seq data from NPCs isolated from the livers of Mfap2-/- and Mfap2+/+ mice after eight weeks of CCl4 injection. Differential expression analysis revealed that 75 genes were significantly increased in HSCs of Mfap2-/- mice, with these genes linked to ECM remodeling pathways, including ECM-receptor interaction, cell adhesion molecules, FA, and PI3K-Akt signaling (Figure 6A-B). In liver-resident Møs, the loss of Mfap2 upregulated 58 genes, which were enriched in immune or infection-related signaling (Figure 6C-D). Conversely, 119 and 71 genes related to ribosome or PPAR signaling were downregulated in HSCs and liver resident Møs following Mfap2 deletion (Figure 6A-D). These findings further confirm that Mfap2 deficiency contributes to ECM stabilization and exacerbates inflammation at both the cellular and molecular levels.
Mfap2 deletion aggravates CCl4-induced liver fibrosis by stabilizing the ECM and facilitating intrahepatic inflammation. Mfap2-/- and Mfap2+/+ mice were injected with CCl4 for eight weeks. (A, C) Heatmaps showing the expression of differentially expressed genes in HSCs or liver-resident Møs. (B, D) Significantly enriched KEGG pathways based on the upregulated or downregulated genes in HSCs or liver-resident Møs (adjusted p < 0.05). (E) Number of inferred cellular interactions and their strength. (F) Circle plots showing the cellular interactions, with edge width proportional to the number of interactions. (G) Heatmap depicting differential interaction strength (decrease, blue; increase, red). The top vertical bar represents incoming signaling, while the left horizontal bar refers to outgoing signaling. (H) Immunoblotting analysis of FBN1, COL1, LOXL1, α-SMA, and FLAG in HSC cell lines treated with ovMfap2 (2.0 μg/mL, 48 hours) + NC (50 nM, 36 hours), ovMfap2 (2.0 μg/mL, 48 hours) + siMfap2 (50 nM, 36 hours), Null (2.0 μg/mL, 48 hours), or ovMfap2 (2.0 μg/mL, 48 hours) (n = 3/group). (I) Circle plots showing the interaction strength of the MIF signal from HSCs to other cells. (J) Violin plot depicting the expression level of Mif in HSCs based on scRNA-seq data. (K) Immunoblotting analysis of MIF protein levels (n = 5-6/group). (L) Multiplex IF staining of MIF (green), Desmin (red), F4/80 (blue), and DAPI (nucleus, grey). Co-localization of Desmin and MIF is indicated in yellow. (M) qPCR analysis of MFAP2 and MIF gene expression in HSCs treated with siMFAP2 (50 nM, 36 hours) + TGFβ1 (10 ng/mL, 48 hours) or ovMFAP2 (2.0 μg/mL, 48 hours) (n = 3/group). (N) Immunoblotting analysis of MIF levels in the CM from cell groups in (M) (n = 3/group). (O) qPCR analysis of ADGRE1 and CD163 gene expression in THP-1 cells treated with the CM from (M) for 36 hours (n = 3/group). Data are expressed as mean ± SEM. *p < 0.05, **p < 0.01, ***p < 0.001, ****p < 0.0001. ns: not significant; CM: conditioned media; NC: negative control.
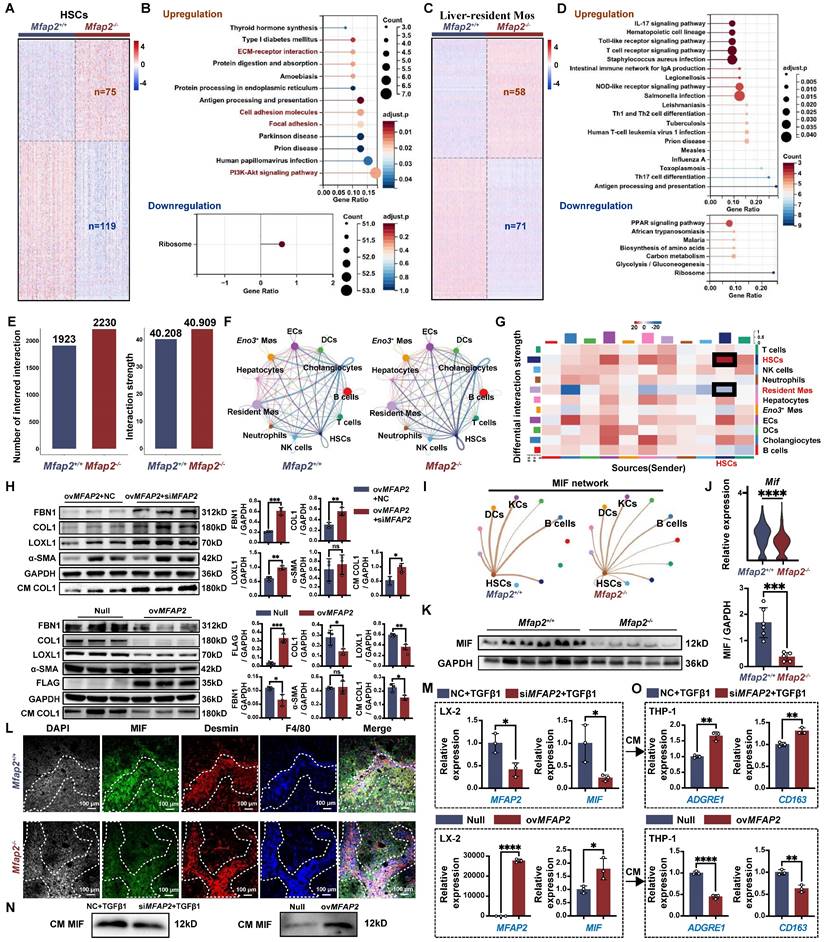
Subsequently, we inferred the intercellular communication networks from the scRNA-seq data using CellChat [24], based on known receptor-ligand pairs. Mfap2 ablation moderately increased both the number and the strength of intercellular signals among HSCs (Figure 6E-G). Specifically, the known pro-fibrotic signals SPP1 [40] and TGFβ2 [41] were more active among HSCs from Mfap2-/- mice than those from Mfap2+/+ mice (Figure S6). Further in vitro studies demonstrated that inhibiting MFAP2 in HSCs enhanced the expression of intracellular FBN1, COL1, and LOXL1, as well as COL1 secretion; in contrast, ovMFAP2 in HSCs had the opposite effect (Figure 6H). Notably, neither inhibiting nor overexpressing MFAP2 expression affected HSC activation (Figure 6H), which agrees with our in vivo findings. In conclusion, the loss of Mfap2 stabilizes the ECM by increasing the production and secretion of matrisome proteins.
Despite increased interactions observed between HSCs and their neighboring liver-resident Møs, the strength of their crosstalk was moderately weakened following Mfap2 ablation (Figure 6G). Among all the downregulated ligand-receptor signals, MIF signaling from HSCs to liver-resident Møs showed the most significant decrease (Figure 6I and S6). MIF was initially recognized as a pleiotropic cytokine arresting random Møs movement [42]. Recent studies using Mif-/- and MifTg mice have demonstrated MIF's anti-fibrotic and anti-inflammatory effects in experimental liver fibrosis [43-45]. Given this context, we speculate that the loss of Mfap2 exacerbates hepatic inflammation by reducing MIF. Indeed, Mfap2 deletion resulted in decreased MIF expression in the liver, particularly in HSCs (Figure 6J-K). Multiplex IF staining showed that liver peri-septal areas were enriched with MIF+Desmin+ HSCs in Mfap2+/+ mice, whereas MIF- Desmin+ HSCs in Mfap2-/- mice (Figure 6L). Meanwhile, F4/80+ Møs were more abundant near MIF- Desmin+ spots in Mfap2-/- mice (Figure 6L). To further gain insight into the effect of MFAP-2 on MIF production in HSCs and the recruitment of Møs, we performed in vitro validation experiments. As shown in Figure 6M-N, silencing Mfap2 in HSCs inhibited MIF expression and secretion, while overexpression of Mfap2 induced MIF production. We then transferred the CM from HSCs with either MFAP2 inhibition or overexpression onto the human monocyte THP-1 cell line. As expected, the CM from HSCs with MFAP2 inhibition increased the expression of ADGRE1 and CD163, known markers of Møs, in THP-1 cells compared to the control; conversely, the CM from HSCs with MFAP2 overexpression reduced ADGRE1 and CD163 gene expression in THP-1 cells (Figure 6O). Our results indicate that the loss of MFAP2 in HSCs exacerbates Møs infiltration by reducing MIF levels in HSCs. Moreover, MFAP2 inhibition in THP-1 cells, in contrast to its effect in HSCs, reduced the expression of Mø markers (Figure S7), highlighting that the inflammation exacerbation observed in Mfap2-/- mice is primarily attributable to the loss of Mfap2 in HSCs.
OvMfap2 in HSCs protects against intrahepatic inflammation, inhibits ECM stabilization, prevents activation of FA signaling, and facilitates liver fibrosis regression
To further elucidate the protective role of HSC-enriched MFAP-2 in chronic CCl4 injury, we administrated mice with AAV6-Mfap2 vector via the tail vein injection in mice, followed by CCl4 treatment for six weeks (Figure 7A). We confirmed the overexpression of Mfap2 through immunofluorescence, qPCR, and immunoblotting (Figure 7B-C and S8A). Consistent with the findings from Mfap2 knockout studies, ovMfap2 did not significantly alter the liver-to-body weight ratio, serum ALT and AST levels (Table S3), ECM accumulation, or the expression levels of COL1 and α-SMA in the liver (Figure 7D). These results indicate that ovMfap2 in HSCs does not affect the histological progression of liver fibrosis.
OvMfap2 prevents intrahepatic inflammation and ECM remodeling. OvMfap2 and control (Null) mice were injected with CCl4 for six weeks. (A) Schematic diagram illustrating the model of CCl4-induced liver fibrosis in ovMfap2 and Null mice. (B) Immunofluorescent staining of MFAP-2. (C) qPCR of Mfap2 gene expression (n = 3/group). (D) H&E staining, Sirius Red staining, IHC analysis of COL1, F4/80, and CD68 (n = 3/group). (E) Immunoblotting analysis of MIF levels after ovMFAP2 in LX-2 cells (n = 3/group). (F) Multiplex IF staining of MIF (Green), Desmin (red), F4/80 (blue), and DAPI (nucleus, grey). Co-localization of MIF and Desmin is shown in yellow. (G) Immunoblotting analysis of COL1, α-SMA, FA signaling markers after ovMFAP2 in LX-2 cells (n = 3/group). (H) Multiplex IF staining of Talin-1 (Green), α-SMA (red), Desmin (grey), and DAPI (nucleus, blue). Co-localization of Talin-1 and α-SMA is shown in yellow. (I) Immunofluorescent staining of COL1 (green) or LOXL1 (green) in decellularized ECM scaffolds. Data are expressed as mean ± SEM. *p < 0.05, **p < 0.01. ns: not significant.
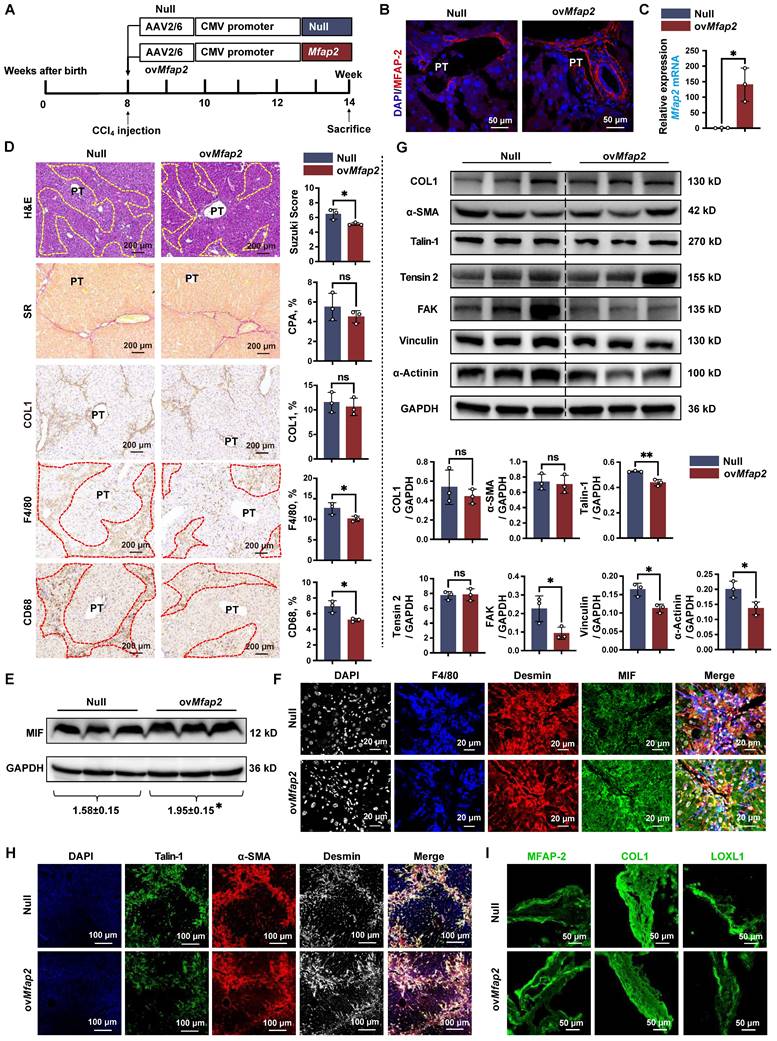
However, ovMfap2 decreased the Suzuki score, Tnf expression, and the number of F4/80+ or CD68+ Møs adjacent to lobular areas, contrasting with our observations following Mfap2 deletion (Figure 7D, S4B and S5B). Moreover, immunoblotting and multiplex IF confirmed that ovMfap2 increased MIF expression in Desmin+ HSCs while reducing peri-septal infiltration of F4/80+ Møs near HSCs (Figure 7E-F). Additionally, ovMfap2 downregulated key FA signaling components (Talin-1, FAK, Vinculin, α-Actinin) (Figure 7G), indicating a suppression of FA signaling. Subsequent multiplex IF analysis confirmed that ovMfap2-induced FA signaling suppression mainly occurred in HSCs, as evidenced by decreased Talin-1 expression in α-SMA+Desmin+ HSCs (Figure 7H). Furthermore, ovMfap2 increased MFAP-2 expression while reducing the levels of COL1 and LOXL1 in the decellularized ECM scaffolds (Figure 7I). This finding contrasts with the observations following Mfap2 depletion, suggesting a reduced ECM stabilization after ovMfap2 in HSCs.
Next, we examined the effects of Mfap2 overexpression in HSCs on liver fibrosis regression. Both Null and ovMfap2 mice, which underwent six weeks of CCl4 injection, were allowed to recover (Figure S9A-B). Following a three-week recovery after CCl4 cessation, the liver-to-body weight ratio, serum ALT level, and intrahepatic inflammation were comparable between Null and ovMfap2 mice (Table S3 and Figure S9C). However, immunostaining and morphometric analysis of COL1 indicated that ovMfap2 mice displayed less pronounced, thinner, and discontinuous collagen fibers in the liver septal regions compared to Null mice (Figure S9D). Additionally, ovMfap2 mice showed suppressed activity of liver FA signaling compared to Null mice after three weeks of fibrosis regression (Figure S9E). These results indicate a more rapid regression of fibrosis in the ovMfap2 group. In agreement with the findings from mouse studies, we also observed that patients with significant liver fibrosis and higher baseline MFAP2 expression were more likely to experience fibrosis regression after etiology control (Figure S10).
MFAP-2 exerts a more pronounced effect on liver fibrosis in BDL mouse models
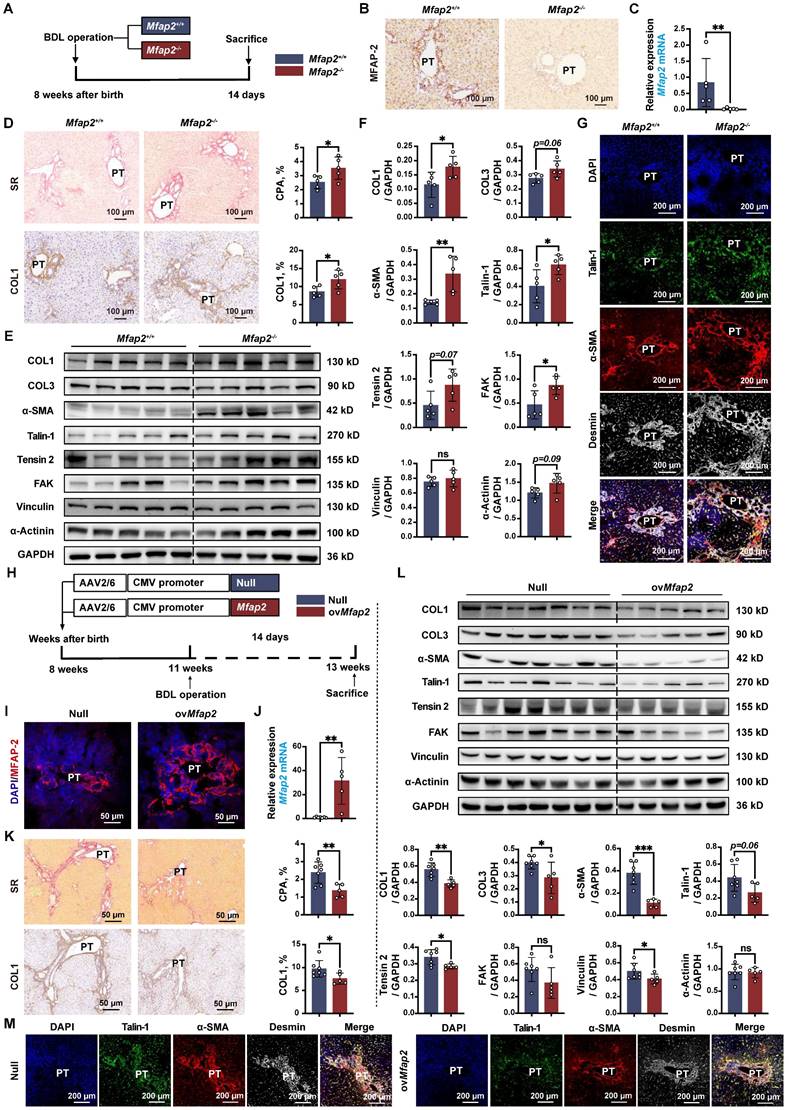
Lastly, we validated the role of MFAP-2 using the well-established BDL model of portal fibrosis. Mfap2 ablation resulted in enhanced ECM deposition and increased expression of COL1, α-SMA, and FA signaling proteins (Talin-1, FAK) compared to Mfap2+/+ mice, fourteen days post-BDL (Figure 8A-F). The activation of FA signaling following Mfap2 ablation was observed specifically in α-SMA+Desmin+ HSCs, as illustrated in Figure 8G. In contrast, ovMfap2 via an AAV6-Mfap2 vector (Figure 8H-J and S8B) delayed ECM accumulation and reduced markers of fibrosis (COL1, α-SMA) as well as FA signaling (Tensin-2, Vinculin) (Figure 8K-L). Additionally, ovMfap2 decreased the number of Talin-1+α-SMA+ HSCs after BDL (Figure 8M). These findings suggest that MFAP-2 exerts a more pronounced effect on liver fibrosis in the BDL model compared to the CCl4 model of liver fibrosis.
Mfap2-/- aggravates, while ovMfap2 attenuates liver fibrosis in the BDL mouse model. Mfap2-/-, Mfap2+/+, Null, or ovMfap2 mice underwent BDL for fourteen days. (A) Schematic diagram illustrating BDL-induced liver fibrosis in Mfap2+/+ and Mfap2-/- mice. (B, C) IHC and qPCR analyses of MFAP-2 (Mfap2) (n = 5/group). (D) Sirius Red staining and IHC analysis of COL1 (n = 5/group). (E, F) Immunoblotting analysis of COL1, COL3, α-SMA, and FA signaling markers (n = 5/group). (G) Multiplex IF staining of Talin-1 (green), α-SMA (red), Desmin (grey), and DAPI (nucleus, blue). Co-localization of Talin-1 and α-SMA is indicated in yellow. (H) Schematic diagram illustrating BDL-induced liver fibrosis in Null and ovMfap2 mice. (I, J) Immunofluorescent staining of MFAP-2 (red) and qPCR analysis of Mfap2 (n = 5-7/group). (K) Sirius Red staining and IHC analysis of COL1 (n = 5-7/group). (L) Immunoblotting analysis of COL1, COL3, α-SMA, and FA signaling markers (n = 5-7/group). (M) Multiple IF staining of Talin-1 (green), α-SMA (red), Desmin (grey), and DAPI (nucleus, blue). Co-localization of Talin-1 and α-SMA is shown in yellow. Data are expressed as mean ± SEM. *p < 0.05, **p < 0.01, ***p < 0.001. ns: not significant.
However, neither Mfap2-/- nor ovMfap2 in the BDL model affected liver inflammation, as evidenced by similar levels of pro-inflammatory genes, Suzuki scores, the number of infiltrating F4/80+ or CD68+ Møs, as well as serum ALT and AST levels (Figure S4C-D, S5C-D, S11 and Table S3). These findings contrast with previous observations in the CCl4 model. We observed that MIF was primarily expressed in hepatocytes and remained unchanged in the livers of both Mfap2-/- and ovMfap2 mice compared to their respective controls, fourteen days post-BDL (Figure S12). In summary, Mfap2 ablation exacerbates liver fibrosis, while ovMfap2 in HSCs mitigates fibrosis in the BDL model without impacting intrahepatic inflammation.
Discussion
Our current study found that the structure of elastin-rich tissues in Mfap2-/- mice remained unchanged (Figure S13), mirroring an earlier study [9], thereby challenging the notion of MFAP-2's indispensableness in ECM assembly. Mfap2-/- or ovMfap2 mice did not develop spontaneous pathological abnormalities in the liver in the absence of intoxication stimulation (Figure S14), likely due to the limited presence of MFAP-2 in normal livers. Similar to findings in adipose tissue and dermis [34, 35], our study revealed that MFAP-2 is predominantly expressed in activated HSCs. Unexpectedly, under prolonged chemical injury, the absence of Mfap2 did not result in significant changes in overall collagen deposition, which contrasts with a recent report by Sun et al. that used the lentivirus delivery system targeting Mfap2 [11]. However, we observed that Mfap2 ablation contributed to ECM stabilization and exacerbated intrahepatic inflammation. In contrast, ovMfap2 in HSCs using an AAV6 vector, known for its myofibroblast tropism [13, 46], reduced ECM stabilization and intrahepatic inflammation resulting from chronic CCl4 intoxication. Moreover, we found that Mfap2 ablation slowed spontaneous regression of fibrosis, while Mfap2 overexpression promoted it upon CCl4 cessation. Additionally, treatment-naïve patients with significant liver fibrosis and higher levels of liver MFAP2 gene expression tend to experience fibrosis regression following etiology control. These findings underscore the role of HSC-enriched MFAP-2 in liver fibrosis regression.
Our proteomic analysis of ECM scaffolds revealed that Mfap2 ablation significantly increased while ovMfap2 decreased insoluble collagens and LOXL1 latent in decellularized ECM scaffolds following chronic CCl4 injury. LOXL1 is known to catalyze the cross-linking of the fibrotic matrix [38, 39], resulting in ECM stabilization and increased resistance to proteolytic degradation [47]. Therefore, MFAP2 deletion or overexpression likely influences the reversibility of liver fibrosis by regulating the stabilization of the fibrotic matrix. A prior study indicated that intracellular MFAP-2 transcriptionally inhibits the expression of genes encoding ECM components [48]. Supporting this, our scRNA-seq analysis demonstrated an upregulation of ECM-related genes in HSCs from Mfap2-/- mice after eight weeks of CCl4 injection. In our in vitro studies, we showed that HSC-enriched MFAP-2 antagonizes the production and secretion of matrisome proteins, including COL1, FBN1, and LOXL1. This effect is independent of HSC activation, as changes in MFAP2 levels did not affect α-SMA expression. Additionally, we observed that MFAP-2 can influence FA signaling, which usually precedes HSC activation [49]. The activation of FA signaling following Mfap2 ablation suggests ECM stabilization and inhibition of collagen degradation through a decrease in matrix metalloproteinases [50]. This represents a positive feedback loop that stiffens the ECM in the setting of Mfap2 deletion.
Moreover, we observed that Mfap2 deficiency increased the recruitment of Møs to the peri-septal areas in the CCl4 model. The exacerbated intrahepatic inflammation resulting from Mfap2 deletion likely contributed to the delayed regression of fibrosis. Previous studies have indicated that MFAP-2 has anti-inflammatory properties by suppressing TGFβ1 in both cellular and matrix milieus [7-10]; however, this does not appear to hold true in the liver. In this study, we found both cellular active and latent TGFβ1 levels in the ECM were unaffected by Mfap2 deletion or overexpression (Figure S15). In fact, during chronic CCl4 injury, Mfap2 deletion reduced MIF in HSCs, while F4/80+ Møs were more abundant near MIF-Desmin+ spots in the liver, suggesting that MFAP-2 orchestrates intrahepatic inflammation by regulating MIF in HSCs. Our in vitro studies further confirmed the positive effect of MFAP-2 on MIF production and Mø activation. Notably, MIF was originally recognized as a pleiotropic cytokine responsible for inhibiting Mø migration [42] and has recently been shown to possess anti-fibrotic and anti-inflammatory properties in experimental liver fibrosis using gene-edited mice [43-45]. Additionally, a recent study found that MFAP2+ cancer-associated fibroblasts communicate with Møs by secreting MIF, which exerts immunosuppressive effects [51]. The mechanisms by which intracellular MFAP-2 regulates MIF production in HSCs require further investigation.
In addition to CCl4 models, we also validated the role of MFAP-2 in the BDL model. We observed that Mfap2-/- mice developed severe liver fibrosis, as evidenced by a significant increase in collagen deposition following BDL. In contrast, ovMfap2 mice exhibited impeded fibrosis progression under the same conditions. However, neither Mfap2-/- nor ovMfap2 affected intrahepatic inflammation in BDL mice, which differs from the findings in the CCl4 model. In the CCl4 model, Mfap2 deletion moderately affected collagen deposition, likely due to the recruitment of peri-lobular Møs, which are known to secrete matrix metalloproteinases that degrade the ECM [52]. A recent study revealed that elevated bile acid levels stemming from cholestasis impair the functionality of Møs [53], potentially explaining the divergent effects of MFAP-2 on Møs in CCl4 and BDL-induced liver fibrosis. Additionally, we noted that MIF was expressed in hepatocytes rather than HSCs, and its expression remained unchanged by Mfap2-/- or ovMfap2 post-BDL. Notably, liver MIF levels significantly increased in the BDL model but decreased in the CCl4 model (Figure S16). These findings also elucidate the different effects of Mfap2-/- and ovMfap2 on inflammation between the CCl4 and BDL models. Furthermore, Muynck et al. recently reported that CD11b+F4/80+TIM4+ Møs were reduced in mice with BDL compared to sham controls [54], likely due to a significant upregulation of MIF, which merits further investigation.
Certainly, our study has limitations. In fibrotic mice, the combination of immunofluorescent co-localization experiments and scRNA-seq analysis indicated that Mfap2 is predominantly enriched and upregulated in activated HSCs, with minimal expression observed in other liver cell types. However, in normal mice, analysis of primary liver cells showed that Mfap2 is not exclusively expressed in quiescent HSCs, but with similar and minimal levels in hepatocytes and Møs (Figure S17). Therefore, the Mfap2-/- mouse serves as an ideal gene-edited model to investigate the role of HSC-enriched MFAP-2 in liver fibrosis, rather than in normal physiological conditions. In contrast, we employed the AAV6-Mfap2 vector to generate a mouse model with HSC-overexpressed MFAP-2. While the AAV6 vector has demonstrated myofibroblast tropism [13, 46], and our quality control experiments confirmed successful MFAP-2 overexpression in HSCs, AAV6 also showed organ tropism for skeletal muscle, heart, and spleen [46]. Therefore, the development of more robust in vivo tools, such as HSC-specific Mfap2 knockout or knock-in mice generated via the Cre/loxP system, is essential. Moreover, although our findings underscore the pivotal role of HSC-derived MFAP-2 in regulating ECM stabilization and inflammation by enhancing matrisome composition and reducing MIF production, the precise molecular mechanisms by which intracellular MFAP-2 influences the matrisome and MIF in HSCs warrant further investigation. Additionally, although MFAP-2 exhibits a protective effect against fibrosis, its impact may largely depend on the localization and dysregulation patterns of MIF, which can vary across different etiologies. This variability may influence the broader applicability of MFAP-2-based therapeutic efficacy and warrants further investigation.
In conclusion, MFAP-2 levels increase compensatorily in fibrotic livers, primarily within activated HSCs. In the CCl4 model, deletion of Mfap2 stabilizes the ECM by promoting the production and secretion of matrisome proteins, while simultaneously exacerbating intrahepatic inflammation through producing and secreting MIF. In the BDL model, Mfap2 deletion leads to a more pronounced pro-fibrotic effect in the absence of inflammation. Moreover, ovMFAP2 may protect against liver fibrosis and promote its regression, potentially offering significant clinical benefits for patients whose fibrosis does not regress after etiology removal. For future clinical applications, the AAV6 vector, noted for its enhanced safety profile, reduced immunogenicity, and superior long-term efficacy in regulating gene expression [13, 55-57], emerges as a promising candidate for MFAP2-based therapy for liver fibrosis. In addition to AAV6, the use of liposomes and other innovative nanomaterial-based targeted delivery systems may serve as alternative vectors for delivering MFAP2 to activated HSCs in the treatment of liver fibrosis.
Abbreviations
AAV: adeno-associated virus; BDL: bile duct ligation; CCl4: carbon tetrachloride; CM: conditioned media; ECM: extracellular matrix; FA: focal adhesion; HSC: hepatic stellate cell; IF: immunofluorescence; KEGG: Kyoto Encyclopedia of Genes and Genomes; LC-MS/MS: label-free liquid chromatography-tandem mass spectrometry; Mø: macrophage; MIF: macrophage migration inhibitory factor; MFAP-2: microfibrillar-associated protein 2; NPC: non-parenchymal cell; scRNA-seq: single-cell RNA sequencing; SDS: sodium dodecyl sulfate; TGF: transforming growth factor.
Supplementary Material
Supplementary figures and tables.
Acknowledgements
We would like to thank Dr. Jianming Zeng (University of Macau) and his bioinformatics team for their invaluable assistance in analyzing the scRNA-seq data.
Funding
This work was supported by National Key Research and Development Program (2023YFC2306900 [to HY]), National Natural Science Foundation of China (82170613 [to WC], 82130018 [to HY], 82300696 [to SC], 82470646 [to WC], 82430023 [to HY]), US Public Health Service Grant DK134461 from the National Institute of Diabetes and Digestive and Kidney Diseases [to NN], and Young Talent Funds of Chinese Institutes for Medical Research (CX23YQB08 [to WC], CX23YQB12 [to YS]).
Author contributions
HY, NN, and WC contributed to the conception and design; HY, WC, and NN supervised this study; WZ and WW performed all the experiments with the support from WC, NZ, HL, YS, XG, HH, SC, AX, SSBK, CW, NS, QH, AY, and XY; WZ and WC analyzed and interpreted the data; WC and WZ drafted the manuscript; NN and HY critically revised this manuscript; all authors reviewed and edited this manuscript.
Competing Interests
The authors have declared that no competing interest exists.
References
1. John BV, Dang Y, Kaplan DE, Jou JH, Taddei TH, Spector SA. et al. Liver Stiffness Measurement and Risk Prediction of Hepatocellular Carcinoma After HCV Eradication in Veterans With Cirrhosis. Clin Gastroenterol Hepatol. 2024;22:778-88 e7
2. Fan W, Adebowale K, Vancza L, Li Y, Rabbi MF, Kunimoto K. et al. Matrix viscoelasticity promotes liver cancer progression in the pre-cirrhotic liver. Nature. 2024;626:635-42
3. Sun Y, Chen W, Chen S, Wu X, Zhang X, Zhang L. et al. Regression of Liver Fibrosis in Patients on Hepatitis B Therapy Is Associated With Decreased Liver-Related Events. Clin Gastroenterol Hepatol. 2024;22:591-601 e3
4. Chang X, Lv C, Wang B, Wang J, Song Z, An L. et al. The utility of P-I-R classification in predicting the on-treatment histological and clinical outcomes of patients with hepatitis B and advanced liver fibrosis. Hepatology. 2024;79:425-37
5. Sun Y, Zhou J, Wang L, Wu X, Chen Y, Piao H. et al. New classification of liver biopsy assessment for fibrosis in chronic hepatitis B patients before and after treatment. Hepatology. 2017;65:1438-50
6. Gibson MA, Hughes JL, Fanning JC, Cleary EG. The major antigen of elastin-associated microfibrils is a 31-kDa glycoprotein. J Biol Chem. 1986;261:11429-36
7. Mecham RP, Gibson MA. The microfibril-associated glycoproteins (MAGPs) and the microfibrillar niche. Matrix Biol. 2015;47:13-33
8. Craft CS, Broekelmann TJ, Mecham RP. Microfibril-associated glycoproteins MAGP-1 and MAGP-2 in disease. Matrix Biol. 2018;71-72:100-11
9. Weinbaum JS, Broekelmann TJ, Pierce RA, Werneck CC, Segade F, Craft CS. et al. Deficiency in microfibril-associated glycoprotein-1 leads to complex phenotypes in multiple organ systems. J Biol Chem. 2008;283:25533-43
10. Broekelmann TJ, Bodmer NK, Mecham RP. Identification of the growth factor-binding sequence in the extracellular matrix protein MAGP-1. J Biol Chem. 2020;295:2687-97
11. Sun Y, Chen X, Chen L, Bao B, Li C, Zhou Y. MFAP2 promotes HSCs activation through FBN1/TGF-beta/Smad3 pathway. J Cell Mol Med. 2023;27:3235-46
12. Zhang W, Li YJ, Zhang N, Chen SY, Tong XF, Wang BQ. et al. Fibroblast-specific adipocyte enhancer binding protein 1 is a potential pathological trigger and prognostic marker for liver fibrosis independent of etiology. J Dig Dis. 2023;24:550-61
13. Zhang N, Wu X, Zhang W, Sun Y, Yan X, Xu A. et al. Targeting thrombospondin-2 retards liver fibrosis by inhibiting TLR4-FAK/TGF-beta signaling. JHEP Rep. 2024;6:101014
14. Elvevold K, Kyrrestad I, Smedsrod B. Protocol for Isolation and Culture of Mouse Hepatocytes (HCs), Kupffer Cells (KCs), and Liver Sinusoidal Endothelial Cells (LSECs) in Analyses of Hepatic Drug Distribution. Methods Mol Biol. 2022;2434:385-402
15. Mederacke I, Dapito DH, Affo S, Uchinami H, Schwabe RF. High-yield and high-purity isolation of hepatic stellate cells from normal and fibrotic mouse livers. Nat Protoc. 2015;10:305-15
16. Suzuki S, Toledo-Pereyra LH, Rodriguez FJ, Cejalvo D. Neutrophil infiltration as an important factor in liver ischemia and reperfusion injury. Modulating effects of FK506 and cyclosporine. Transplantation. 1993;55:1265-72
17. Baiocchini A, Montaldo C, Conigliaro A, Grimaldi A, Correani V, Mura F. et al. Extracellular Matrix Molecular Remodeling in Human Liver Fibrosis Evolution. PLoS One. 2016;11:e0151736
18. Chen W, Zhang W, Zhang N, Chen S, Huang T, You H. Pipeline for precise insoluble matrisome coverage in tissue extracellular matrices. Front Bioeng Biotechnol. 2023;11:1135936
19. Chen W, Sun Y, Chen S, Ge X, Zhang W, Zhang N. et al. Matrisome gene-based subclassification of patients with liver fibrosis identifies clinical and molecular heterogeneities. Hepatology. 2023;78:1118-32
20. Kim D, Langmead B, Salzberg SL. HISAT: a fast spliced aligner with low memory requirements. Nat Methods. 2015;12:357-60
21. Trapnell C, Williams BA, Pertea G, Mortazavi A, Kwan G, van Baren MJ. et al. Transcript assembly and quantification by RNA-Seq reveals unannotated transcripts and isoform switching during cell differentiation. Nat Biotechnol. 2010;28:511-5
22. Petitprez F, Levy S, Sun CM, Meylan M, Linhard C, Becht E. et al. The murine Microenvironment Cell Population counter method to estimate abundance of tissue-infiltrating immune and stromal cell populations in murine samples using gene expression. Genome Med. 2020;12:86
23. Yu G, Wang LG, Han Y, He QY. clusterProfiler: an R package for comparing biological themes among gene clusters. OMICS. 2012;16:284-7
24. Jin S, Guerrero-Juarez CF, Zhang L, Chang I, Ramos R, Kuan CH. et al. Inference and analysis of cell-cell communication using CellChat. Nat Commun. 2021;12:1088
25. Wang M, Gong Q, Zhang J, Chen L, Zhang Z, Lu L. et al. Characterization of gene expression profiles in HBV-related liver fibrosis patients and identification of ITGBL1 as a key regulator of fibrogenesis. Sci Rep. 2017;7:43446
26. Marchi E, Ramamurthy N, Ansari MA, Harrer CE, Stop HCV, Barnes E. et al. Defining the key intrahepatic gene networks in HCV infection driven by sex. Gut. 2023;72:984-94
27. Fujiwara N, Kubota N, Crouchet E, Koneru B, Marquez CA, Jajoriya AK. et al. Molecular signatures of long-term hepatocellular carcinoma risk in nonalcoholic fatty liver disease. Sci Transl Med. 2022;14:eabo4474
28. Han ES, Wu Y, McCarter R, Nelson JF, Richardson A, Hilsenbeck SG. Reproducibility, sources of variability, pooling, and sample size: important considerations for the design of high-density oligonucleotide array experiments. J Gerontol A Biol Sci Med Sci. 2004;59:306-15
29. Terkelsen MK, Bendixen SM, Hansen D, Scott EAH, Moeller AF, Nielsen R. et al. Transcriptional Dynamics of Hepatic Sinusoid-Associated Cells After Liver Injury. Hepatology. 2020;72:2119-33
30. Ge X, Desert R, Magdaleno F, Han H, Song Z, Das S. et al. Redox-sensitive high-mobility group box-1 isoforms contribute to liver fibrosis progression and resolution in mice. J Hepatol. 2024;80:482-94
31. Butler A, Hoffman P, Smibert P, Papalexi E, Satija R. Integrating single-cell transcriptomic data across different conditions, technologies, and species. Nat Biotechnol. 2018;36:411-20
32. Johnson WE, Li C, Rabinovic A. Adjusting batch effects in microarray expression data using empirical Bayes methods. Biostatistics. 2007;8:118-27
33. Percie du Sert N, Hurst V, Ahluwalia A, Alam S, Avey MT, Baker M. et al. The ARRIVE guidelines 2.0: Updated guidelines for reporting animal research. PLoS Biol. 2020;18:e3000410
34. Zheng Q, Chen S, Chen Y, Lyga J, Wyborski R, Santhanam U. Investigation of age-related decline of microfibril-associated glycoprotein-1 in human skin through immunohistochemistry study. Clin Cosmet Investig Dermatol. 2013;6:317-23
35. Craft CS. MAGP1, the extracellular matrix, and metabolism. Adipocyte. 2015;4:60-4
36. Goult BT, Yan J, Schwartz MA. Talin as a mechanosensitive signaling hub. J Cell Biol. 2018;217:3776-84
37. Grandy C, Port F, Radzinski M, Singh K, Erz D, Pfeil J. et al. Remodeling of the focal adhesion complex by hydrogen-peroxide-induced senescence. Sci Rep. 2023;13:9735
38. Chen W, Yang A, Jia J, Popov YV, Schuppan D, You H. Lysyl Oxidase (LOX) Family Members: Rationale and Their Potential as Therapeutic Targets for Liver Fibrosis. Hepatology. 2020;72:729-41
39. Zhang N, Yang A, Zhang W, Li H, Xu A, Yan X. et al. Crosstalk of lysyl oxidase-like 1 and lysyl oxidase prolongs their half-lives and regulates liver fibrosis through Notch signal. Hepatol Commun. 2024;8:e0391
40. Song Z, Chen W, Athavale D, Ge X, Desert R, Das S. et al. Osteopontin Takes Center Stage in Chronic Liver Disease. Hepatology. 2021;73:1594-608
41. Sun T, Huang Z, Liang WC, Yin J, Lin WY, Wu J. et al. TGFbeta2 and TGFbeta3 isoforms drive fibrotic disease pathogenesis. Sci Transl Med. 2021;13:eabe0407
42. Conroy H, Mawhinney L, Donnelly SC. Inflammation and cancer: macrophage migration inhibitory factor (MIF)-the potential missing link. QJM. 2010;103:831-6
43. Heinrichs D, Knauel M, Offermanns C, Berres ML, Nellen A, Leng L. et al. Macrophage migration inhibitory factor (MIF) exerts antifibrotic effects in experimental liver fibrosis via CD74. Proc Natl Acad Sci U S A. 2011;108:17444-9
44. Chen Y, Wang J, Zhou N, Fang Q, Cai H, Du Z. et al. Protozoan-Derived Cytokine-Transgenic Macrophages Reverse Hepatic Fibrosis. Adv Sci (Weinh). 2024;11:e2308750
45. Heinrichs D, Berres ML, Coeuru M, Knauel M, Nellen A, Fischer P. et al. Protective role of macrophage migration inhibitory factor in nonalcoholic steatohepatitis. FASEB J. 2014;28:5136-47
46. Rezvani M, Espanol-Suner R, Malato Y, Dumont L, Grimm AA, Kienle E. et al. In Vivo Hepatic Reprogramming of Myofibroblasts with AAV Vectors as a Therapeutic Strategy for Liver Fibrosis. Cell Stem Cell. 2016;18:809-16
47. Liu SB, Ikenaga N, Peng ZW, Sverdlov DY, Greenstein A, Smith V. et al. Lysyl oxidase activity contributes to collagen stabilization during liver fibrosis progression and limits spontaneous fibrosis reversal in mice. FASEB J. 2016;30:1599-609
48. Segade F, Suganuma N, Mychaleckyj JC, Mecham RP. The intracellular form of human MAGP1 elicits a complex and specific transcriptional response. Int J Biochem Cell Biol. 2007;39:2303-13
49. Zhao XK, Yu L, Cheng ML, Che P, Lu YY, Zhang Q. et al. Focal Adhesion Kinase Regulates Hepatic Stellate Cell Activation and Liver Fibrosis. Sci Rep. 2017;7:4032
50. Rajshankar D, Wang B, Worndl E, Menezes S, Wang Y, McCulloch CA. Focal adhesion kinase regulates tractional collagen remodeling, matrix metalloproteinase expression, and collagen structure, which in turn affects matrix-induced signaling. J Cell Physiol. 2020;235:3096-111
51. Wei R, Song J, Liu X, Huo S, Liu C, Liu X. Immunosuppressive MFAP2(+) cancer associated fibroblasts conferred unfavorable prognosis and therapeutic resistance in gastric cancer. Cell Oncol (Dordr). 2024;47:55-68
52. Ramachandran P, Pellicoro A, Vernon MA, Boulter L, Aucott RL, Ali A. et al. Differential Ly-6C expression identifies the recruited macrophage phenotype, which orchestrates the regression of murine liver fibrosis. Proc Natl Acad Sci U S A. 2012;109:E3186-95
53. Andrews TS, Nakib D, Perciani CT, Ma XZ, Liu L, Winter E. et al. Single-cell, single-nucleus, and spatial transcriptomics characterization of the immunological landscape in the healthy and PSC human liver. J Hepatol. 2024;80:730-43
54. De Muynck K, Heyerick L, De Ponti FF, Vanderborght B, Meese T, Van Campenhout S. et al. Osteopontin characterizes bile duct-associated macrophages and correlates with liver fibrosis severity in primary sclerosing cholangitis. Hepatology. 2024;79:269-88
55. Crystal RG. Adenovirus: the first effective in vivo gene delivery vector. Hum Gene Ther. 2014;25:3-11
56. Li H, Malani N, Hamilton SR, Schlachterman A, Bussadori G, Edmonson SE. et al. Assessing the potential for AAV vector genotoxicity in a murine model. Blood. 2011;117:3311-9
57. Yang TY, Braun M, Lembke W, McBlane F, Kamerud J, DeWall S. et al. Immunogenicity assessment of AAV-based gene therapies: An IQ consortium industry white paper. Mol Ther Methods Clin Dev. 2022;26:471-94
Author contact
![]() Corresponding authors: Wei Chen, Experimental and Translational Research Center, Beijing Friendship Hospital, Capital Medical University, No. 95 Yong'an Road, Xicheng District, Beijing 100050, China. E-mail: cw_2011com. Tel.: +86 (010) 6313-9311; Hong You, Liver Research Center, Beijing Friendship Hospital, Capital Medical University, No. 95 Yong'an Road, Xicheng District, Beijing 100050, China. E-mail: youhong30com. Tel.: +86 (010) 6313-9019; Natalia Nieto, Division of Gastroenterology and Hepatology, Department of Medicine, University of Illinois Chicago, 840 S. Wood St., Suite 130 CSN, MC 847, Chicago, IL 60612, USA. E-mail: nnietoedu. Tel.: +1 (312) 996-7316.
Corresponding authors: Wei Chen, Experimental and Translational Research Center, Beijing Friendship Hospital, Capital Medical University, No. 95 Yong'an Road, Xicheng District, Beijing 100050, China. E-mail: cw_2011com. Tel.: +86 (010) 6313-9311; Hong You, Liver Research Center, Beijing Friendship Hospital, Capital Medical University, No. 95 Yong'an Road, Xicheng District, Beijing 100050, China. E-mail: youhong30com. Tel.: +86 (010) 6313-9019; Natalia Nieto, Division of Gastroenterology and Hepatology, Department of Medicine, University of Illinois Chicago, 840 S. Wood St., Suite 130 CSN, MC 847, Chicago, IL 60612, USA. E-mail: nnietoedu. Tel.: +1 (312) 996-7316.