Impact Factor
 Global reach, higher impact
Theranostics 2025; 15(7):2834-2851. doi:10.7150/thno.101821 This issue Cite
Research Paper
Ironomycin induces mantle cell lymphoma cell death by targeting iron metabolism addiction
Sara Ovejero1,2#, Laura Alibert1,2#, Julie Devin1,2, Tatiana Cañeque3, Valentin Jacquier1,2, Andrea Romero1,2, Salome Amar1,2, Matthieu Abouladze2, Elvira Garcia de Paco2, Ouissem Karmous Gadacha2, Guilhem Requirand2, Nicolas Robert2, Miss Leriem Zellagui1, Hugues de Boussac4, Guillaume Cartron5,6, Johanna Chiche8,9, Jean-Ehrland Ricci8,9, Charles Herbaux1,6,7, Raphael Rodriguez3, Jerome Moreaux1,2,6,7* ![]() , Caroline Bret1,2,6*
, Caroline Bret1,2,6* ![]()
1. Institute of Human Genetics UMR 9002 CNRS-UM, Montpellier, France.
2. Department of Biological Hematology, CHU Montpellier, Montpellier, France.
3. Chemical Biology of Cancer Laboratory, Institut Curie, 26 rue d'Ulm, 75248 Paris Cedex 05, France; PSL Université, Paris, France; CNRS UMR 3666, Paris, France; INSERM U1143, Paris, France.
4. Diag2Tec, Montpellier, France.
5. Department of Clinical Hematology, CHU Montpellier, Montpellier, France.
6. CNRS UMR 5535, University of Montpellier, Montpellier, France.
7. Institut Universitaire de France, Paris, France.
8. Université Côte d'Azur, INSERM, C3M, Nice, France.
9. Équipe labellisée LIGUE Contre le Cancer, Nice, France.
# Co-first authors: The authors contributed equally.
* The authors contributed equally.
Received 2024-8-2; Accepted 2025-1-4; Published 2025-2-3
Abstract

Rationale: Mantle-cell lymphoma (MCL) remains an aggressive and incurable cancer. Accumulating evidence reveals that abnormal iron metabolism plays an important role in tumorigenesis and in cancer progression of many tumors. Based on these data, we searched to identify alterations of iron homeostasis in MCL that could be exploited to develop novel therapeutic strategies.
Methods: Analysis of the iron metabolism gene expression profile of a cohort of patients with MCL enables the identification of patients with a poor outcome who might benefit from an iron homeostasis-targeted therapy. We analyzed the therapeutic interest of ironomycin, known to sequester iron in the lysosome and to induce ferroptosis.
Results: In a panel of MCL cell lines, ironomycin inhibited MCL cell growth at nanomolar concentrations compared with conventional iron chelators. Ironomycin treatment resulted in ferroptosis induction and decreased cell proliferation rate, with a reduced percentage of cells in S-phase together with Ki67 and Cyclin D1 downregulation. Ironomycin treatment induced DNA damage response, accumulation of DNA double-strand breaks, and activated the Unfolded Protein Response (UPR). We validated the therapeutic interest of ironomycin in primary MCL cells of patients. Ironomycin demonstrated a significant higher toxicity in MCL cells compared to normal cells from the microenvironment. We tested the therapeutic interest of combining ironomycin with conventional treatments used in MCL. We identified a synergistic effect when ironomycin is combined with Ibrutinib, Bruton's tyrosine kinase (BTK) inhibitor, associated with a strong inhibition of B-Cell receptor (BCR) signaling.
Conclusion: Altogether, these data underline that MCL patients my benefit from targeting iron homeostasis using ironomycin alone or in combination with conventional MCL treatments.
Keywords: iron metabolism, mantle cell lymphoma, ironomycin, drug combination, B-cell receptor signaling
Introduction
Mantle cell lymphoma (MCL) is a rare subtype of non-Hodgkin's lymphoma (NHL), that accounts for 5-7% of all NHL cases. MCL is derived from mostly antigen-naïve cells that proliferate in the mantle zone around germinal centers. One of the main genetic characteristics of MCL is chromosome translocation t(11;14) that causes Cyclin D1 overexpression, conferring a proliferative phenotype to tumor cells [1]. In addition, aberrations of TP53 in aggressive MCL have a negative impact on survival [2].
The median age of MCL patients is 60-70 years [1]. Despite recent advances, it remains incurable and patients with high-risk disease have particularly poor outcomes. Depending on the age and fitness of the patient, treatments include conventional chemotherapy and stem cell transplantation (SCT), BTK inhibitors, or bispecific antibodies against CD19 and CD20, among others. However, drug resistance and disease progression are major challenges in the treatment of MCL [2].
Ibrutinib inhibits BTK, thereby blocking BCR signaling, which is abnormally active in some B-cell cancers, including lymphomas. Ibrutinib is approved to treat MCL patients that have received at least one previous line of treatment [3]. In addition, oral BTK inhibitors administered alone [4], or combinations of ibrutinib with rituximab [5], or ibrutinib with the Bcl2-antagonist venetoclax [6,7], have proven as interesting chemotherapy-free targeted therapeutic approaches for MCL patients at relapse [8]. However, primary and acquired resistance to ibrutinib has already been described in MCL patients [9]. Thus, the study of the mechanisms of cancer cell resistance to ibrutinib and response to its combination with other drugs is of great therapeutic interest in treating patients with MCL.
Iron is an essential element for cells. It is a critical component of many biological processes such as mitochondrial function [10], DNA replication and repair [11], and epigenetic modifications [12]. Iron is also a redox-active metal that can participate in free radical formation and propagation of lipid peroxidation through the Fenton reaction, which can cause a type of iron-dependent non-apoptotic cell death known as ferroptosis [13]. Thus, iron dysregulation is linked to pathological states [14]. Indeed, cancer cells often present dysregulation of many genes involved in iron metabolism, and abnormal iron homeostasis is involved in autoimmunity, tumorigenesis, and the progression of cancers [15,16]. In the past years, inducing ferroptosis with iron-targeting molecules, such as iron chelators or iron oxide nanoparticles, has gained attention as a promising anti-cancer strategy in hematologic malignancies [17-21].
Considering the importance of iron homeostasis in cell biology and its implication in cancer, we investigated the therapeutic potential of targeting the iron pool of MCL cells with ironomycin, a promising agent known for sequestering iron in lysosomes and inducing cancer cell death [22,23]. Our findings demonstrate that ironomycin triggers both apoptosis and ferroptosis in MCL cells. Ironomycin also activates the UPR pathway, a cellular stress response triggered by the accumulation of misfolded or unfolded proteins in the endoplasmic reticulum (ER). Moreover, we observed a synergistic effect when ironomycin is combined with ibrutinib, leading to increased MCL cell death, suggesting that there is a therapeutic benefit in the combined approach of BCR inhibition and iron homeostasis targeting for the treatment of MCL patients.
Methods
Mantle cell lymphoma cell line culture
6 MCL cell lines (JEKO1, JVM2, MAVER1, MINO, REC1, GRANTA519) were purchased from the DSMZ (Leibniz-Institut DSMZ - GmbH, Germany). They were cultured in RPMI with 10% FBS (JVM2, REC1) or 20% FBS (JEKO1, MAVER1, MINO); or DMEM with 10% FBS (GRANTA519) at 37 °C and 5% CO2. Cells were passed every 3-4 days.
Reagents
Ironomycin (AM5) was a kind gift from Raphaël Rodriguez (patent application WO2016/038223).
Deferasirox (ITM101102264, TargetMol), Erastin (S7242, Selleckchem), Ferrostatin-1 (S7243, Selleckchem), Q-VD Oph (S7311, SelleckChem), Iron (III) Chloride Hexahydrate (31232-M, Sigma Aldrich), N-Acetyl Cysteine (A9165, Sigma Aldrich), Ibrutinib (S2680, Sellekchem), Venetoclax (S8048, Sellekchem), AZD-5991 (S8643, Selleckchem), A1155463 (T6748, TargetMol), bendamustine (S5939, Sellekchem), bortezomib (S1013, Selleckchem).
Synergy matrices
For evaluation of ironomycin synergy with ibrutinib, venetoclax, AZ1159XX and A-1155463 , cells were seeded at 30000 (JVM2) or 50000 (JEKO1, MAVER1) cells/well and cultured for 4 days in 96-well flat-bottom plates in the presence of ironomycin (0.01 - 4 μM), ibrutinib (BTK inhibitor; 0.125 - 32 μM), venetoclax (Bcl2 inhibitor; JEKO1/JVM2: 125 - 32000 nM; MAVER1: 0.12 - 8000 nM), AZ1159 (Mcl1 inhibitor; 0.01 - 5 μM), A1155463 (Bcl-xL inhibitor: 0.15 - 40 μM). Increasing concentrations of ironomycin were combined with increasing concentrations of the other drugs to evaluate all possible combinations. Cell growth was evaluated using CellTiter-Glo (CTG) Luminiscent Assay (G7573, Promega) according to manufacturer's protocol and luminescence was measured using a Centro LB 960 luminometer (Berthold Technologies). For each combination, the percentage of expected growing cells in the case of effect independence was calculated with Bliss equation using R package “SynergyFinder”.
Supplementary information is included in Supplemental Methods.
Results
Iron homeostasis-related gene expression profile identifies high risk MCL patients
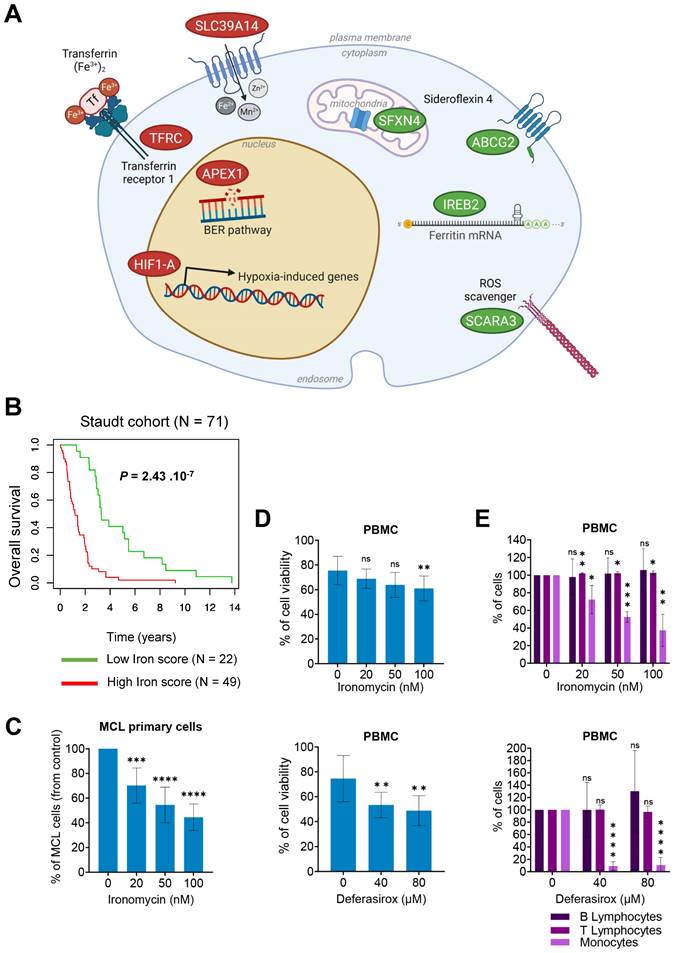
According to the major role of iron homeostasis in cancer, we aimed to identify iron metabolism-related genes associated with a prognostic value in MCL. Sixty-two genes related to iron biology and cancer had been reported [20,24] (Table S1). Using Maxstat R algorithm [25] and multiple testing correction, we identified 8 genes with significant prognostic value in a cohort of newly diagnosed MCL patients (n = 71) [26] (Figure 1A) and combined their prognostic information in a Gene Expression Profile (GEP)-based iron-score (IS) as previously described [27,28]. IS is defined by the sum of the beta coefficients of the Cox model for each prognostic gene, weighted by +1 or -1 according to the patient expression signal above or below the Maxstat value. IS segregated the cohort in two groups (iron-score cut point: -3.7798) with a maximum difference in overall survival (OS; Figure 1B), underlining that an elevated IS allows the identification of MCL patients with poor prognosis and dysregulation of iron metabolism who could benefit from targeted therapy.
The iron score predicts the clinical outcome in MCL. (A) A list of 62 genes involved in the regulation of iron biology was established using previously published data [20,24]. Gene expression microarray data from one cohort (Staudt cohort) of 71 newly-diagnosed MCL patients was used (accession number GSE10793). Data were analyzed with Microarray Suite version 5.0 (MAS 5.0), using Affymetrix default analysis settings and global scaling as normalization method. The trimmed mean target intensity of each array was arbitrarily set to 500. 4 iron-related genes were found to have a good prognostic value (in green) and 4 a bad prognostic value (in red). ABCG2 (ATP-binding cassette transporter G2), SCARA3 (Scavenger Receptor Class A Member 3), IREB2 (Iron Responsive Element Binding Protein 2) and SFXN4 (sideroflexin 4); (APEX1 (DNA-(apurinic or apyrimidinic site) lyase), TFRC (Transferrin Receptor Protein 1), SLC39A14 (Solute Carrier Family 39 Member 14), and HIF1A (Hypoxia inducible factor A 1). Scheme was created with BioRender. (B) Patients of the Staudt cohort GSE10793 (n = 71) were ranked according to increased iron score and a maximum difference in OS (overall survival) was obtained with iron score of -3.7798 (also named 'cut point') splitting patients into high-risk and low-risk groups. The iron score was significantly associated with high-risk in MCL patients. (C) Primary MCL cells from 9 patients were treated with ironomycin at the indicated concentrations for 4 days. Tumor cells were analyzed by flow cytometry and expressed in % of control. Results represent the median ± IQR. Statistical significance was tested using paired t-test: *** p value < 0.001, **** p value < 0.0001. (D,E) Peripheral blood mononucleated cells (PBMC) from healthy donors (n = 5) were treated with ironomycin or deferasirox for 4 days, counted in presence of trypan blue to visually distinguish dead cells (trypan blue positive) from living cells (trypan blue negative). (D) Viability was calculated as the percentage of living cells to total cells (living + dead) in each condition compared to control. (E) Populations of B-lymphocytes, T-lymphocytes and monocytes were quantified by flow cytometry and compared to control condition. The 3 populations are expressed as % of control. Asterisks indicate significant differences compared to control conditions after applying a Student's t-test for pairs. *: p-value < 0.05; **: p-value < 0.01; ***: p: value < 0.001; ns: not significant.
Targeting iron homeostasis kills MCL cells
We and others reported the therapeutic interest of targeting iron homeostasis with ironomycin to kill Diffuse Large B-Cell Lymphoma (DLBCL) [20] and Acute Myeloid Leukemia (AML) [29] cells. Using 6 MCL cell lines, we determined the IC50 of ironomycin. Deferasirox, an iron chelator [30-32] approved by the FDA to treat chronic iron overload by selectively binding the ferric form of iron [33], was used as a control. Of note, deferasirox was evaluated in MCL cells [19] and reported to have anti-tumoral effects in vitro [34]. Interestingly, IC50 values of ironomycin were in the nanomolar range, whereas those of deferasirox were in the micromolar range (Figure S1A), indicating that ironomycin is ~100-fold more potent in inhibiting MCL cells growth. Ironomycin is also significantly toxic to MCL primary cells at nanomolar concentrations (Figure 1C and Figure S1B). Furthermore, only deferasirox significantly impacted viability of purified peripheral blood mononucleated cells (PBMC) from healthy donors (Figure 1D). Both ironomycin and deferasirox were not toxic to normal B- and T-lymphocytes, but killed monocytes in a dose-dependent manner (Figure 1E). Monocytes are known to participate in iron recycling and accumulate intracellular iron [35] which makes them more susceptible to drugs targeting iron homeostasis. Moreover, a small but significant increase in the percentage of T-lymphocytes was also observed exclusively upon ironomycin treatment.
Then, to further characterize the biological effect of ironomycin on MCL cells, we chose 3 cell lines (JEKO1, JVM2 and MAVER1) with different ironomycin IC50 and that partially represent the molecular heterogeneity of MCL patients (Table S2). High concentration of deferasirox was used to compare the effect of iron chelation versus ironomycin-induced iron sequestration. Ironomycin treatment induced a decrease in proliferation (Figure 2A and Figure S1C) associated with an altered cell cycle distribution (Figure 2B). In MCL, t(11;14) translocation, which causes the over-expression of the gene CCND1, is associated with high tumor cell proliferation [36]. JVM2 expresses lower protein levels of Cyclin D1 than other MCL cell lines, while co-expressing Cyclin D2 [37] (Table S2). Importantly, treatment of MCL cells with ironomycin caused a marked diminution of Cyclin D1 and Cyclin D2 protein levels (Figure 2C,D). We confirmed that the decrease in Cyclin D1 expression correlated with a decrease in CCND1 transcription in JEKO1. However, no difference in mRNA levels of CCND1/CCND2 were observed in JVM2/MAVER1 (Figure 2E), suggesting that lower protein levels may be due to increased protein degradation. Cyclin D1 is degraded by the proteasome and it was reported that deferasirox induces proteasome-mediated Cyclin D1 degradation [19,34]. Indeed, proteasome inhibitor bortezomib rescued Cyclin D1/Cyclin D2 degradation induced by ironomycin and deferasirox (Figure S1D).
Ironomycin impairs the proliferation of MCL cells. (A) JEKO1, JVM2 and MAVER1 cell lines were treated as indicated for 48 h. Cells were counted at day 0 and at the end of the treatments, and the number of cells was normalized to day 0 to calculate the proliferation rate. Graphs show the average and standard deviation of 3-4 independent experiments. (B) Cells were treated or not with ironomycin (JEKO1: 10 and 50 nM; JVM2/MAVER1: 50 and 250 nM) and Deferasirox (80 µM) for 48 h and BrdU (10 μg/ml) was added during the last 1.5 h of treatment. Cells were fixed and processed to detect BrdU incorporation and total DNA. BrdU+ cells were assigned to S-phase. BrdU- cells were assigned to G0/G1 or G2/M phases based on their DNA content. Results are the mean of 3-4 independent experiments. (C,D) Cells were treated as indicated for 48 h, and the levels of Cyclin D1 and Cyclin D2 were analyze in cell lysates by western blot. Tubulin was used as a loading control. Figures show 1 representative experiment out of 3. (E) Total mRNA was extracted from cells treated as indicated for 48 h, subjected to retrotranscription and the levels of expression of CCND1, CCND2, RB1 and CDK4 genes were quantified by qPCR. Graphs show the average ± SD of 3 independent experiments. (F) Cells were treated or not with ironomycin (JEKO1: 50 nM; JVM2/MAVER1: 250 nM) for 48 h, collected and the indicated proteins were analyzed by western blot in whole cell lysates. In all the graphs in this figure, asterisks indicate significant differences compared to control conditions after applying a Student's t-test for pairs. *: p-value < 0.05; **: p-value < 0.01; ***: p-value < 0.001; ns: not significant.
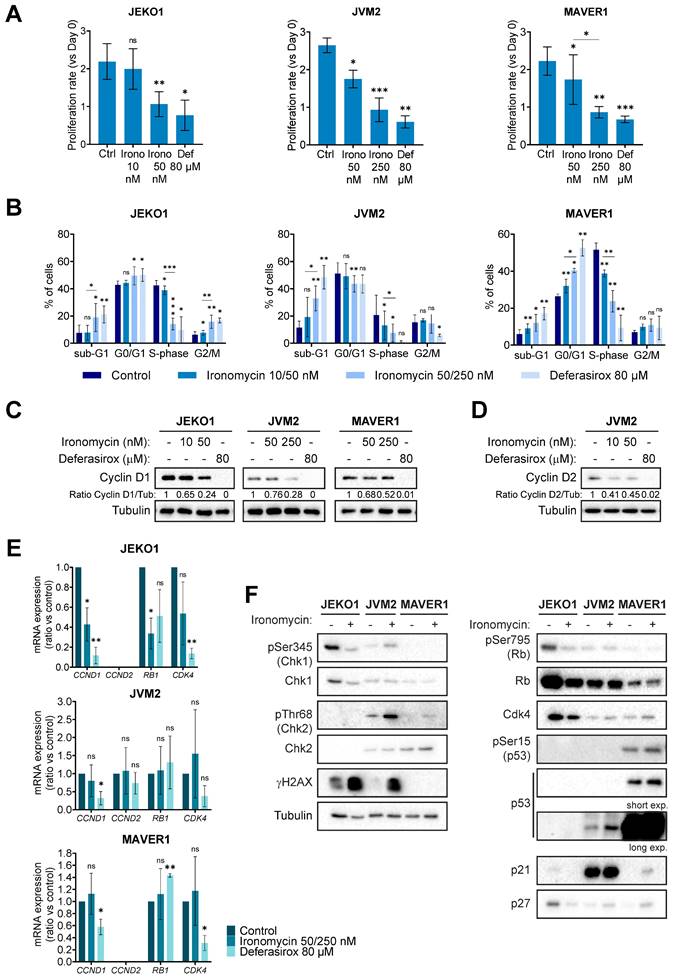
Furthermore, we analyzed whether ironomycin also impacted the levels of several well-known factors controlling cell cycle progression and linked to Cyclin D1 (Cdk4, Rb, p53, p21 and p27) [36]. It has been reported that these MCL cell lines present different abnormalities regarding some of these genes (Table S2) and we confirmed different protein levels by western blot (Figure 2F). Interestingly, in JEKO1 and JVM2, ironomycin induced γH2AX, a marker of DNA double strand breaks and DNA damage response (DDR) activation [38]. We did not observe γH2AX in MAVER1, probably due to the inactivation of ATM in this cell line (Table S2), but Chk2 was slightly phosphorylated in response to ironomycin.
Ironomycin causes cell death mediated by apoptosis in MCL cells
Ironomycin significantly reduced cell viability in all cell lines (Figure S1E). Since ironomycin has been reported to induce ferroptosis, apoptosis and ferritinophagy [20,22,23,29], we sought to identify the type(s) of cell death that it induces in MCL cells. Ironomycin and deferasirox increased the Annexin V+ population (Figure 3A), indicative of apoptotic cell death. Supplementation of cells with FeCl3 prevented cell death caused by deferasirox, but not by ironomycin (Figure S2A).
(A) Cells were treated as indicated for 48 h and Annexin V was detected by flow cytometry. Results are the mean ± SD of 3 independent experiments. (B) Cells were treated as in (A). The levels of the indicated proteins were analyzed by western blot. Figure shows 1 representative out of 3 independent experiments. (C) Cells were treated with ironomycin (JEKO1: 50 nM, JVM2/MAVER1: 250 nM) for 48 h, and the levels of the indicated proteins were analyzed by western blot. Tubulin was used as a loading control. Figure shows 1 representative out of 3 independent experiments. (D) BH3 profiling of JEKO1, JVM2 and MAVER1. Cells were treated with ironomycin (JEKO1: 50 nM, JVM2/MAVER1: 250 nM) or DMSO for 20 h. Then, BH3 mimetics (venetoclax: Bcl2i, AZD-5991: Mcl1i, A-1155463: Bcl-xLi) or vehicle DMSO (control) were added to the culture medium for 4 h. Annexin V+ cells were detected by flow cytometry. Graphs represent the difference (Δ) between the percentage of Annexin V+ cells in each condition and in the control (vehicle DMSO). Results are the mean ± SD of 3 independent experiments. (E) Cells were pre-treated with the ferroptosis inhibitor Ferrostatin-1 (10 μM, 30 min) before treatment with ironomycin (JEKO1: 50 nM; JVM2/MAVER1: 250 nM) or the ferroptosis inducer erastin (4 μM) for 48 h. Annexin V was detected by flow cytometry. Graphs show the mean ± SD of 3-4 independent experiments. In all the graphs in this figure, asterisks indicate significant differences compared to control conditions after applying a Student's t-test for pairs. *: p-value < 0.05; **: p-value < 0.01; ***: p-value < 0.001; ****: p-value < 0.0001; ns: not significant.
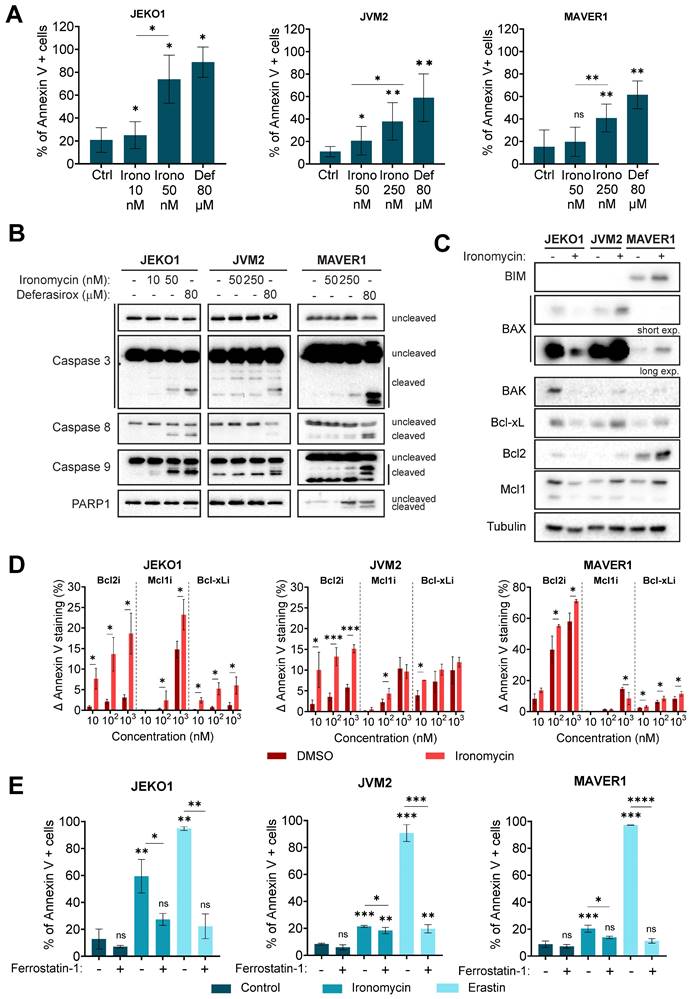
Increase in Annexin V+ cells upon ironomycin treatment correlated with caspases 3, 8 and 9 cleavage in JEKO1 and MAVER1 cell lines, but not in JVM2 (Figure 3B). Given the limited sensitivity of western blot analysis and the fact that it has been described that caspases 8 and 9 activity is stimulated by dimerization instead of cleavage [39], we confirmed activation of caspases by the more sensitive CaspaseGlo® Assay. We observed that ironomycin increased caspase 3 and 8 activity in all three cell lines, although it was only statistically significant in JEKO1 and JVM2, whereas caspase 9 was only significantly activated in JEKO1 (Figure S2B). Interestingly, pre-treatment of cells with pancaspase inhibitor Quinoline-Val-Asp-Difluorophenoxymethylketone (Q-VD-Oph) partially rescued cell death in JEKO1 and JVM2 cell lines, suggesting that apoptosis is not the only cell death type induced by ironomycin in MCL cells (Figure S2C).
Cancer cells are frequently addicted to the presence of anti-apoptotic factors, such as the Bcl2 family of proteins, that are attractive therapeutic targets [40]. We observed significant changes in the levels of Bcl family anti- and pro-apoptotic factors upon ironomycin treatment that were cell line dependent. In JEKO1 cells, ironomycin induced the degradation of all factors, whereas it caused an increase in JVM2 and MAVER1 (Figure 3C). Given these differences, we used the complementary in vitro assay BH3 profiling [41] to measure the apoptotic priming of cells and their dependences on the anti-apoptotic proteins Bcl2, Bcl-xL and Mcl1 upon drug treatment (Figure S3A). We observed an increased dependence on these proteins in JEKO1, and specially to Bcl2 in JVM2/MAVER1 (Figure 3D). Moreover, combining ironomycin with Bcl2i, Bcl-xLi and Mcl1i, resulted in synergistic effects across all cell lines, confirming that ironomycin sensitizes MCL cells to Bcl2-family inhibitors (Figure S3B-D) that have been evaluated in relapsed MCL patients with promising results [42,43].
In response to ironomycin, Cytochrome C level was decreased in JEKO1, and increased in JVM2/MAVER1 (Figure S4A). It was reported that up-regulation of Cytochrome C is linked to caspase activation and triggering of cell death [44]. In addition, severe mitochondria damage is associated with higher Cytochrome C release into the extracellular space and higher cell death levels [45]. Therefore, the different levels of Cytochrome C in the cell lines may be explained by their different sensitivity to ironomycin. Thus, it is possible that Cytochrome C increase in JVM2 and MAVER1 is linked to moderate apoptosis level and its decrease in JEKO1 may be due to higher levels of cell death (Figure 3A) and loss of cell membrane integrity, which will release cytosolic proteins like Cytochrome C to the medium, that will then be less abundant by western blot. To test this hypothesis, we removed JEKO1 dead cells by Ficoll® centrifugation and performed western blot only on living cells with unbroken cell membrane. The levels of Cytochrome C did not decrease in these cells in ironomycin vs untreated conditions (Figure S4B). In contrast to our previous result (Figure 3C), after dead cell removal, the only anti-apoptotic factor that was actually decreased by ironomycin in JEKO1 cells was Mcl1, whereas the pro-apoptotic proteins Bax and Bak remained unchanged (Figure S4B). In basal conditions, Cytochrome C is necessary for ATP production in the mitochondria and needs iron. We treated cells with increasing doses of ironomycin for 48 h and used CellTiter Glo assay to quantify intracellular ATP. Our results showed a significant dose-dependent decrease in the levels of ATP (Figure S4C), most likely due to iron depletion caused by ironomycin. Using Seahorse functional assay, we confirmed that ironomycin strongly decreased both basal and maximal mitochondrial respiration capacities (Figure S4D). These data indicate that ironomycin impairs mitochondrial function, eventually triggering caspase-dependent apoptosis.
Ironomycin induces ferroptosis in MCL cells
Ferrostatin-1 [46], a ferroptosis inhibitor, rescued ironomycin- and erastin-induced cell death (Figure 3E), confirming that ironomycin also induces ferroptosis in MCL cells. Erastin was used as a positive control [47]. Finally, we studied if ironomycin activated autophagy in MCL cells. BIX1294 was used as a positive control [48]. No formation of LC3B foci [49] was observed upon ironomycin treatment (Figure S4E). However, western blot analysis showed a modest increase in LC3B-II in JVM2, and a degradation (JEKO1 and MAVER1) or accumulation (JVM2) of ferritin, an iron-storage protein which is degraded when ferritinophagy is activated [50] (Figure S4F,G). Since ferritinophagy triggers ferroptosis and our western blot analysis showed differences in Ferritin and LC3B levels between the three cell lines (Figure S4G), we cannot exclude that ferritinophagy also contributes to ferroptosis initiation in MCL cells. Interestingly, increased expression of TFRC, which codes for the transferrin receptor CD71 and has a prognostic value according to our analysis (Figure 1A,B), is associated with more aggressive forms and poor prognosis in MCL [51]. We confirmed higher levels of CD71 in MCL cell lines and primary MCL cells from patients than in PBMC from healthy donors (Figure S4H). Furthermore, upon treatment with ironomycin, we observed an increase in CD71 protein levels, a marker of ferroptosis (Figure S4I). Finally, we pretreated cells with Q-VD-Oph, ferrostatin-1 or combination of both (Figure S4J), and confirmed that ironomycin triggers both apoptosis and ferroptosis in MCL cells.
Ironomycin has been involved in the generation of ROS, that cause lipid peroxidation and DNA damage [20] (Figure S4F). In agreement, we observed a small but significant increase in ROS production induced by ironomycin that could not be rescued by iron supplementation (Figure S5A). Intriguingly, combination of exogenous iron and ironomycin led to increased ROS production in JEKO1 and JVM2 compared to ironomycin alone, while it reverted ROS production in combination with deferasirox in JVM2 and MAVER1. Of note, JEKO1 showed an elevated level of ROS already in basal conditions (Figure S5B), that correlated with γH2AX indicative of DNA damage (Figure 2F). This elevated basal ROS level may contribute to the stronger sensitivity of JEKO1 to ironomycin treatment compared to JVM2, in which a 5 times higher concentration of ironomycin was required to reach similar levels of γH2AX (Figure 2F). Given the central role of iron in mitochondria, we also analyzed the production of mitochondrial ROS using the specific probe MitoSox. No significant increase of mitochondrial ROS was detected upon ironomycin or deferasirox treatment (Figure S5C). Given that ROS cause lipid peroxidation that in turn triggers ferroptosis, we used BODIPY dye to monitor lipid oxidation state. BODIPY underlined a significant increase in peroxidized lipids upon ironomycin and erastin treatments, that was diminished by ferrostatin-1 (Figure S5D). The phospholipid hydroperoxidase GPX4 protects cells against membrane lipid peroxidation and is involved in ferroptosis regulation [50]. Intriguingly, GPX4 levels varied differently in each MCL cell line in response to ironomycin (Figure S4A,B).
Vitamin E is an antioxidant that has been reported to prevent ferroptosis [52]. High-density lipoproteins (HDL) and low-density lipoproteins (LDL) can carry Vitamin E to cells to mitigate lipid peroxidation and ferroptosis [53]. In order to evaluate the contribution of lipids to the cellular effects of ironomycin, we cultured cells in medium supplemented with lipid-free serum. Lack of exogenous lipids induced cell death in untreated JVM2 and MAVER1 cell lines, with no effect on JEKO1, suggesting that the three cell lines are metabolically different in basal conditions (Figure S6A). Treatment with ironomycin in absence of lipids only increased cell death in JVM2 cells. ROS production was diminished in JEKO1 and MAVER1 in lipid-depleted medium, but not in JVM2 (Figure S6B). Lipid peroxidation was increased in absence of lipids in all cell lines, and treatment with ironomycin led to a small but significant increase in JEKO1 and JVM2 (Figure S6C). Scavenger Receptor Class B Type I (SR-B1) is an HDL receptor that facilitates cholesterol esters uptake and the bi-directional flux of free cholesterol. SR-B1 has been reported as a mediator of oxidative events in cancer [54]. Western blot analysis showed that the three MCL cell lines presented different levels of expression of SR-B1 that were not changed by ironomycin (Figure S6D). We monitored the presence of lipid droplets, the organelles that store triacylglycerols and sterol esters, using the Nile Red dye, which marks polar and neutral lipids including cholesterol esters [55]. Surprisingly, no lipid droplets were observed in JVM2, whereas ironomycin decreased lipid droplets in both JEKO1 and MAVER1 (Figure S6E).
We have shown that iron supplementation was not able to rescue ironomycin-induced cell death (Figure S2A), but we investigated if any of the cellular responses induced by ironomycin treatment could be reversed by iron supplementation. As before, deferasirox was used as a control. Addition of iron rescued the degradation of Cyclin D1, ATF6, Bcl-xL and Mcl1 caused by deferasirox, as well as the increase in γH2AX in the three cell lines. However, no consistent changes in protein abundance were detected upon iron supplementation in ironomycin-treated cells, with JVM2 being the only cell line in which the accumulation of Bcl-xL, Bcl2, GPX4 and Cytochrome C was reverted by FeCl3 addition (Figure S7). The numerous cellular effects of ironomycin in the three MCL cell lines studied are summarized in Table S3.
Ironomycin induces dysregulation of BCR pathway
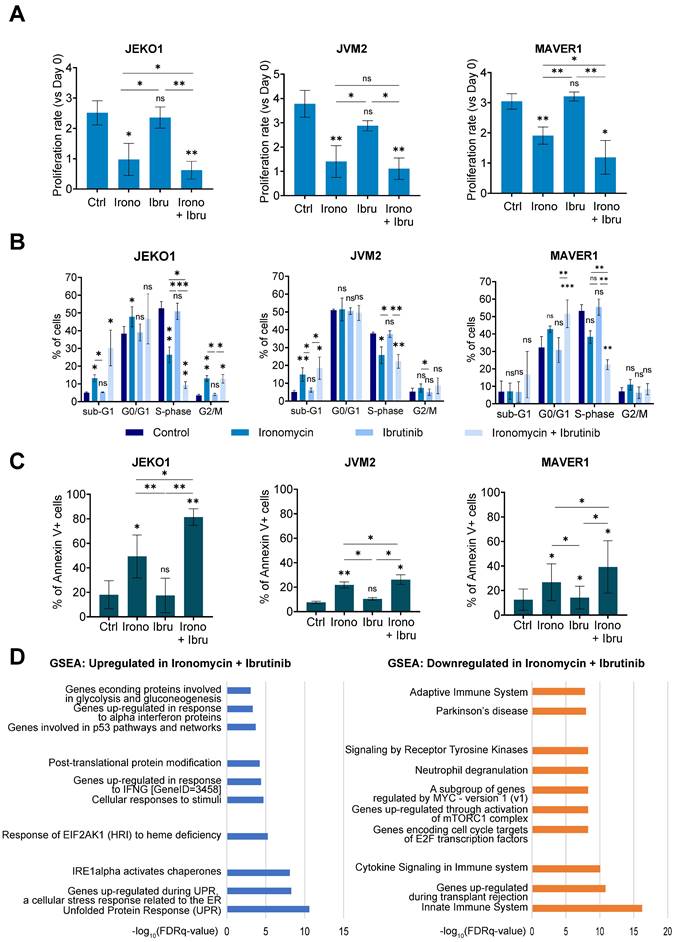
In order to better understand the global effect of targeting iron homeostasis in MCL, we performed RNA-sequencing (RNA-seq) analysis of MCL cell lines treated with ironomycin. Among the 174 genes significantly differentially expressed, Gene Set Enrichment Analysis (GSEA) showed that UPR was the most upregulated pathway by ironomycin treatment, whereas innate immune system pathways were the most downregulated (Figure 4A). We confirmed that ironomycin induced the accumulation or phosphorylation of several UPR proteins, including IRE1α as well as the generation of XBP1s, indicative of UPR signaling activation (Figure 4B).
Ironomycin downregulates the expression of BCR-related genes and synergizes with BTK inhibitor ibrutinib. (A) JEKO1, JVM2 and MAVER1 cells were treated with ironomycin (JEKO1: 50 nM; JVM2/MAVER1: 250 nM) for 48 h. Total RNA was extracted and RNA-sequencing was performed. GSEA of down- and up-regulated pathways is shown. FDR: false discovery rate. (B) Cells were treated with ironomycin (JEKO1: 50 nM, JVM2/MAVER1: 250 nM) for 48 h, and the levels of the indicated proteins were analyzed by western blot. Tubulin was used as a loading control. Figure shows 1 representative out of 3 independent experiments. (C-E) Cells were seeded in flat-bottom 96-well plates, treated with increasing concentrations of ironomycin (1 - 4000 nM) and ibrutinib (0.125 - 32 μM), and incubated for 4 days. Cell growth was assessed by CellTiter Glo® assay. Drug synergy was calculated using R package “SynergyFinder”. Effect of drug combination on cell growth is shown in a pseudo-color scale from red (synergism) to green (antagonism). Matrixes show the mean of 3 independent experiments.
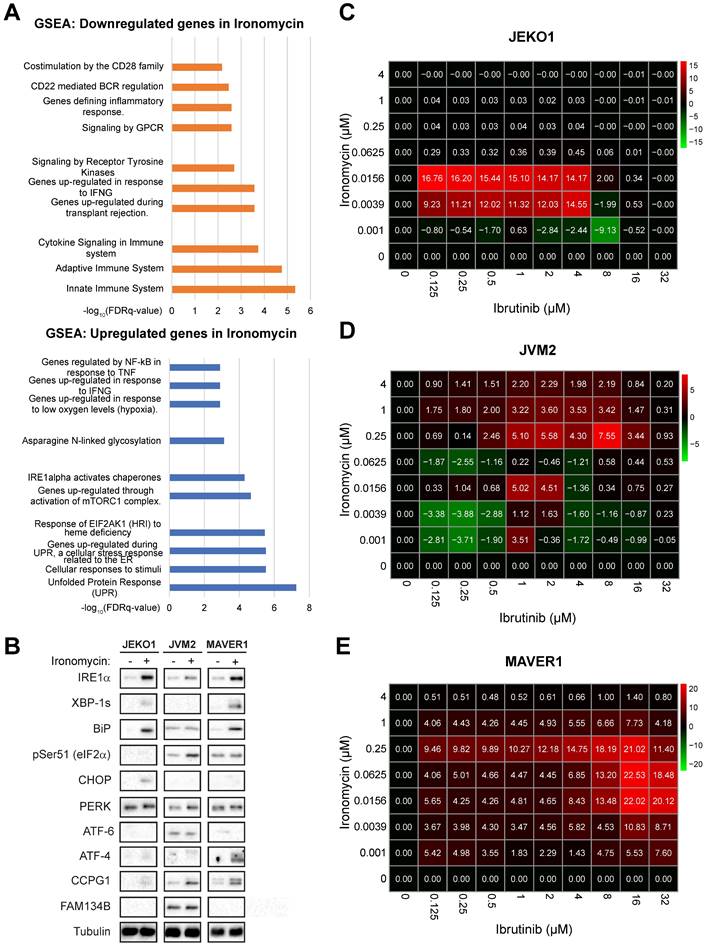
Regarding downregulated pathways identified by RNA-seq (Figure 4A), we hypothesized that downregulation of BCR-related genes induced by ironomycin could potentiate the cytotoxic effect of BCR-inhibiting therapy in MCL. Aberrant BCR activation is a key pro-survival pathway that includes BTK, NF-κB and AKT. Ibrutinib is an inhibitor of BTK used in the treatment of MCL. However, drug resistance frequently leads to patient relapse [56]. JEKO1 and JVM2 are ibrutinib-sensitive or mild-sensitive cell lines, whereas MAVER1 is resistant (Figure S8A). Using synergy matrixes, we found that ironomycin and ibrutinib synergize to inhibit MCL cells growth (Figure 4C-E). Interestingly, ironomycin combined with ibrutinib induced a downregulation of genes involved in the BCR signaling pathway including CARD11, CD22, PTPN6, IGLV1-47 and IGLV1-44 (Figure S8B) [56]. We confirmed CARD11 downregulation by western blot (Figure S8C). These results highlight the therapeutic potential of combining ironomycin and ibrutinib to enhance the cytotoxic effects of BTK inhibition, even in ibrutinib-resistant MCL cells.
In order to understand the molecular mechanism of this synergy, we studied if ironomycin could regulate the activation of the BCR pathway. In basal conditions, MCL cell lines presented different activation level of BCR downstream pathways. Drug combination inhibited NF-κB in JEKO1, and BTK and Akt in JVM2. In MAVER1 cell line, the only significant ironomycin effect was the decrease of CARD11 (Figure S8C-E).
Furthermore, we observed that the combination of both drugs significantly reduced cell proliferation and induced cell cycle arrest to a greater extent than either drug alone (Figure 5A,B). It also induced strong Cyclin D1 degradation in JEKO1 and moderate in JVM2, together with DNA damage induction (Figure S9A,B). The decrease in proliferation caused by the drug combination correlated with an increase in Annexin V+ cells (Figure 5C). Caspases and PARP cleavage were observed in JEKO1 and MAVER1 (Figure S9C). Moreover, Mcl1 was specifically degraded upon drug combination in JEKO1 cell line, whereas Bcl2 seemed to slightly accumulate in JVM2 (Figure S9D). In order to better understand the molecular mechanism of the synergy, we compared RNA-seq data of cells treated with ironomycin, ibrutinib and the combination of both drugs. At the studied doses, ibrutinib impacted the expression of a low number of genes (22 downregulated and 4 upregulated), but no particular pathway was identified (Table S4). Ironomycin-induced up-regulation of UPR and mTORC signatures was stronger in combination with ibrutinib, especially in JEKO1 and MAVER1 (Figure 5D). Taken together, these results indicate that combination of ironomycin with ibrutinib induces a sustained activation of UPR and a strong inhibition of BCR signaling that trigger toxicity in MCL cells.
(A) JEKO1, JVM2 and MAVER1 cell lines were treated as indicated with ironomycin (JEKO1: 50 nM; JVM2/MAVER1: 250 nM) and ibrutinib (JEKO1: 0.5 μM; JVM2: 1.5 μM; MAVER1: 6.25 μM) for 48 h. Cells were counted at day 0 and at the end of the treatments, and the number of cells was normalized to day 0 to calculate the proliferation rate. Graphs show the mean ± SD of 3 independent experiments. (B) Cells were treated as in (A) and BrdU (10 μg/ml) was added during the last 1.5 h of treatment. Cells were fixed and processed to detect BrdU incorporation and total DNA. BrdU+ cells were assigned to S-phase. BrdU- cells were assigned to G0/G1 or G2/M phases based on their DNA content. Results are the mean ± SD of 3-4 independent experiments. (C) Cells were treated as in (A) and Annexin V was detected by flow cytometry. Graphs show the mean ± SD of 3-4 independent experiments. (A-C) Asterisks indicate a significant difference compared to control conditions after applying a Student's t-test for pairs. *: p-value < 0.05; **: p-value < 0.01; ***: p- value < 0.001; ****: p-value < 0.0001; ns: not significant. (D) Cells were treated as in (A). Total RNA was extracted, RNA-sequencing was performed and GSEA was applied to find upregulated and downregulated pathways in cells treated with ironomycin plus ibrutinib. FDR: false discovery rate.
Discussion
Here, we show that targeting iron homeostasis could be of therapeutic interest to target MCL cells, in particular in combination with BTK inhibition. First, using MCL patient data, we identified that deregulation of the expression of iron homeostasis genes can delineate MCL patients with poor outcome (Figure 1A). High expression of genes coding for transferrin receptor (TFRC), transcription factor HIF1-A (hypoxia induced factor 1A), APEX1 (APEX endonuclease) and SLC39A14 was associated to a poor outcome, whereas upregulation of IREB2 (iron-responsive element binding protein 2), SCARA3, SFXN4 (sideroflexin-4) and ABCG2 correlated with a good prognosis. These genes were previously reported to be involved in other malignancies, but this is the first study that links six of them to MCL. TFRC and HIFs are upregulated in many types of cancer, which correlates with poor prognosis and response to therapy [57,58]. In particular, elevated HIF1A was related to poor prognosis in MCL [59]. APEX is activated in response to DNA damage and its dysregulation is associated to several types of cancer [60]. SLC39A14 codes for a metal transporter and was reported downregulated in prostate cancer [61] and upregulated in glioma [62]. IREB2 stabilizes the mRNA of TFRC and DMT1 that code for iron transporters, leading to increased intracellular iron concentration [63] and is dysregulated in lung [64] and renal cancers [65]. Downregulation of ROS scavenger SCARA3 was reported in prostate cancer [66], hepatocellular carcinoma [67], lung cancer [68] and myeloma [69]. Sideroflexin-4 has been suggested as a therapeutic target in ovarian cancer [70]. Thus, iron dysregulation is an important feature in cancer biology with various effects depending on the cancer cell type.
The iron chelators deferasirox and deferoxamine are approved by the FDA for treatment of chronic iron overload in patients who are receiving long-term blood transfusions and for conditions such as beta-thalassemia and other chronic anemias [33,71]. Regarding their use in cancer treatment, previous pre-clinical studies reported that iron chelation may be of therapeutic interest to treat AML in combination with vitamin D3 [72] and triggers the DNA damage response in T-cell acute lymphoblastic leukemia [73]. It was reported that deferasirox and vitamin D synergize to promote monocyte differentiation in primary AML cells and prolonged the survival of AML patients [74]. Moreover, deferasirox is cytotoxic to lymphoma cells [75], lung cancer cells [76], and multiple myeloma cells [77] among others, and synergizes with gemcitabine to inhibit pancreatic cancer cell growth [78]. In addition, other pre-clinical studies using cell lines suggested that deferoxamine or deferasirox may be interesting for MCL treatment [19,34], but none of these agents has been approved for cancer treatment. From a safety point of view, it was reported that treatment with deferasirox presents a risk of kidney failure [79], liver failure [80,81] and gastrointestinal bleeding [82] in some patients. Ironomycin, a synthetic derivate of salinomycin that sequesters iron in the lysosomes and triggers ferroptosis [22], has demonstrated greater efficacy in killing various types of cancer cells compared to iron chelators [20,29], owing to its iron-sequestration specific mechanism of action. In fact, it was described that ironomycin can alter the redox state within lysosomes, increasing ROS production, and induces lysosomal membrane permeabilization, leading to the release of potentially toxic lysosomal enzymes and ROS into the cytosol that can further damage lysosomes and other cellular structures [22].
Our results show that ironomycin is toxic to MCL cells at ~100-fold lower concentrations than deferasirox, suggesting that its side effects if used in cancer therapy would be less than those of deferasirox. In this regard, our previous study using mouse models showed that mice weight was not affected by ironomycin treatment at doses that presented toxicity against DLBCL xenografts [20]. Moreover, we found that ironomycin and deferasirox affect primary MCL cells from patients and normal monocytes without inducing toxicity in normal B- and T-lymphocytes (Figure 1). Intriguingly, we observed a small but significant increase in T-lymphocyte percentage upon ironomycin treatment. Given that these cells do not proliferate in our in vitro conditions and that iron homeostasis is important for T-lymphocytes [83] , we surmise that dead monocytes may release iron to the medium that may be up taken by the T-lymphocytes in the culture, improving their survival compared to control conditions. Since we only evaluated the global CD3+ T-cell population, further analyses are required to determine which T-lymphocyte sub-population is more abundant and its intracellular iron level upon ironomycin treatment and its impact in in vivo models. Using MCL cell lines, we studied the molecular mechanisms of ironomycin cytotoxicity. Chromosome translocation t(11;14) is a genetic hallmark of MCL patients that results in overexpression of Cyclin D1, which is essential to the pathogenesis of this disease by conferring a proliferative advantage to tumor cells [1]. In fact, high-risk MCL is associated to the proliferation marker Ki-67 ≥ 30% [84,85]. Importantly, we found that ironomycin induces degradation of Cyclin D1 protein, which correlates with a strong decrease in cell proliferation and cell cycle arrest (Figure 2). Our data indicate that Cyclin D1 and D2 down-regulation is due to changes in transcription and increased protein degradation. On the one hand, epigenetic enzymes such as the Jumonji family of histone demethylases or the DNA Ten-Eleven Translocation (TET) methylcytosine dioxygenases have been reported to depend on iron as a co-factor [12]. Thus, iron depletion caused by ironomycin would have an impact on epigenetic and transcriptional regulation through these enzymes. Moreover, our results show that ironomycin activates an UPR characterized by the accumulation of IRE1α (Figure 4B). IRE1α is responsible for the regulated IRE1α-dependent decay (RIDD) that cleaves selected mRNAs, decreasing the proteins that they code for [86]. Thus, it is possible that constitutive UPR activation and IRE1α accumulation lead to degradation of mRNA coding for Cyclin D1. On the other hand, UPR activation characterized by p-eIF2α like in JVM2 and MAVER1 (Figure 4B) induced by ironomycin can also lead to translation attenuation, which will eventually reduce Cyclin D1 and Cyclin D2 levels due to protein turnover coupled to lack of new protein synthesis. Mutation or deletion of TP53, which is a major cell cycle regulator, is related to high-risk disease [87,88]. Interestingly, our data show that ironomycin triggers apoptosis in the three MCL cell lines independently of their TP53 status (Table S2). These findings strengthen the potential of targeting iron homeostasis as a way to impair MCL cells growth and slow down tumor progression, even in TP53 dysregulated patients.
We observed that ironomycin induced changes in the abundance of pro-apoptotic and anti-apoptotic proteins of the Bcl-family. In JEKO1, the anti-apoptotic protein Mcl1 was the main factor degraded, which explains the triggering of apoptosis. In JVM2/MAVER1, upon ironomycin treatment, all studied factors accumulated regardless of whether they were pro- or anti-apoptotic. It was published that Bak interacts with Mcl1 and that disrupting this interaction induces Mcl1 degradation [89]. Bax expression is regulated by the tumor suppressor p53 and has been shown to be involved in p53-mediated apoptosis. The association and the ratio of Bax to Bcl2 also determines survival or death of a cell following an apoptotic stimulus. In JVM2, which expresses wild type p53, we observed a significant increase in Bax, Bcl-xL, Bcl2 and Mcl1 levels. Our BH3-profiling data show that JVM2 is mostly dependent on Bcl2, with lower dependence on Mcl1 or Bcl-xL. In MAVER1, Bax and Bcl2 expression inversely correlated, maybe due to a lack of functional p53 in this cell line. Our BH3-profiling assay confirmed a greater dependence of MAVER1 on Bcl2, suggesting that the slight increase in Bax observed by western blot is not sufficient to efficiently trigger caspase-dependent apoptosis as observed in our other data (Figure S2). In addition, upon DNA damage caused by ROS, anti-apoptotic proteins like Bcl2 and Bcl-xL can be upregulated or activated in an attempt to delay or prevent apoptosis, allowing the cell to repair the damage. If the damage is irreparable, the pro-apoptotic signals may override the anti-apoptotic mechanisms, leading to cell death.
In addition, ironomycin induced ROS production, lipid peroxidation, DNA damage and sustained UPR activation, leading to apoptosis and ferroptosis. Of note, these effects were achieved using nanomolar concentrations of ironomycin, in contrast to deferasirox which exhibited cytotoxicity at concentrations 10-100 times higher, suggesting that ironomycin could be used at low dose to minimize toxicity and side effects. The toxicity of ironomycin was already investigated in mice and did not underline significant toxicities in the range of doses deleterious for cancer cells [20,22,29]. Moreover, iron supplementation was able to rescue cell death caused by deferasirox, but not by ironomycin, indicating that the cytotoxicity of ironomycin is not due to limited iron availability for metabolic and enzymatic reactions and therefore its therapeutic potential diverges from that of iron chelators. We previously reported the efficacy of ironomycin in targeting B-lymphoma cells using a syngeneic A20 murine model [20]. Further investigation using specific PDX models is needed to determine optimal ironomycin doses to kill MCL cells and to assess toxicity in vivo.
Ironomycin was described to induce ferroptosis by causing lipid peroxidation. We analyzed the contribution of lipids to ironomycin cytotoxicity and found that lipid deprivation in culture medium had different effects depending on the cell line (Figure S6). Lack of exogenous lipids only increased the toxicity of ironomycin in JVM2 cells (Figure S6A) which does not present TAG and sterol esters accumulated in lipid droplets. This result suggests that the capacity of JVM2 to cope with lipid peroxidation is mostly dependent on its ability to uptake lipids from the medium to substitute the oxidized ones, since its intracellular lipid stock is low. The cytotoxicity of ironomycin on JEKO1 and MAVER1 was not affected by the lack of exogenous lipid source. Both cell lines present lipids stored in lipid droplets, which number and size was decreased upon ironomycin treatment (Figure S6E), probably due to the use of those stored lipids to try and repair the ROS-damaged membranes. These results point at the importance of lipids as targets of ironomycin toxicity and raise the question of how lipid metabolism could impact the response to drugs targeting iron homeostasis. It has already been reported that lipid metabolism modulates the DNA damage response [90], which can impact cell response to chemotherapy. Since pharmacological and dietary manipulations of lipids are possible, it would be interesting to assess a potential synergy between decreasing the pool of lipids and targeting iron homeostasis as a therapeutic strategy to kill cancer cells.
It has been described that sustained ER-stress causes the UPR to trigger apoptosis [91]. Interestingly, we found that ironomycin upregulates the UPR, notably related to IRE1α accumulation and activation. The proteasome inhibitor bortezomib, currently under clinical investigation in MCL, similarly activates an apoptotic UPR in multiple myeloma [92], suggesting that targeting iron in combination with proteasome inhibitors may hold therapeutic promise. IRE1α has kinase and RNAse activities [93] and produces the spliced form XBP1s that targets genes coding for proteins that enhance protein folding capacity and quality control [94]. High activation of IRE1α can also cleave other mRNAs with similar structure to that of XBP1, causing apoptosis [86]. IRE1α activates the apoptotic signaling kinase 1 (ASK1), which in turn triggers downstream factors such as JNK and p38 MAPK, enhancing apoptosis. In addition, it has been shown that persistent ER stress produces ROS [95]. These notions raise the idea that ironomycin induced-ROS production leads to ER stress and UPR activation that will in turn produce more ROS, creating an amplification loop culminating in apoptosis. Moreover, there is increasing evidence of a link between UPR, in particular IRE1α, and lipid metabolism regulation [96]. Ironomycin caused lipid peroxidation, which must be replaced by new lipids to maintain membrane integrity. ER regulates lipid synthesis and is itself tightly regulated by UPR [97], which may explain UPR activation and IRE1α accumulation upon ironomycin-dependent lipid peroxidation. Interestingly, it has also been reported that IRE1α can trigger mitochondrial (intrinsic) apoptosis in a Bax/Bak-dependent manner [91] and ironomycin triggers a non-canonical Bax/Bak-dependent apoptosis in AML [29]. Our BH3 profiling experiments show that ironomycin changes the dependencies of MCL cells to Blc2-family anti-apoptotic factors and induces changes in BAX expression (Figure 3C,D and Figure S3). We found a synergy between iron dysregulation and inhibitors of Bcl2-family anti-apoptotic factors which could be of therapeutic interest. Moreover, we proved that ironomycin caused significant changes in basal and maximal mitochondrial respiratory capacities and reduced ATP production (Figure S4C,D). Altogether, these results indicate that ironomycin exerts profound toxicity on mitochondria, triggering apoptosis in MCL cells, as well as ferroptosis linked to ROS production and lipid peroxidation. Unlike in DLBCL cells [20], ironomycin seemed to not cause ferritinophagy in all MCL cell lines, suggesting that malignant B-cells from diverse origins exhibit distinct vulnerabilities related to iron metabolism.
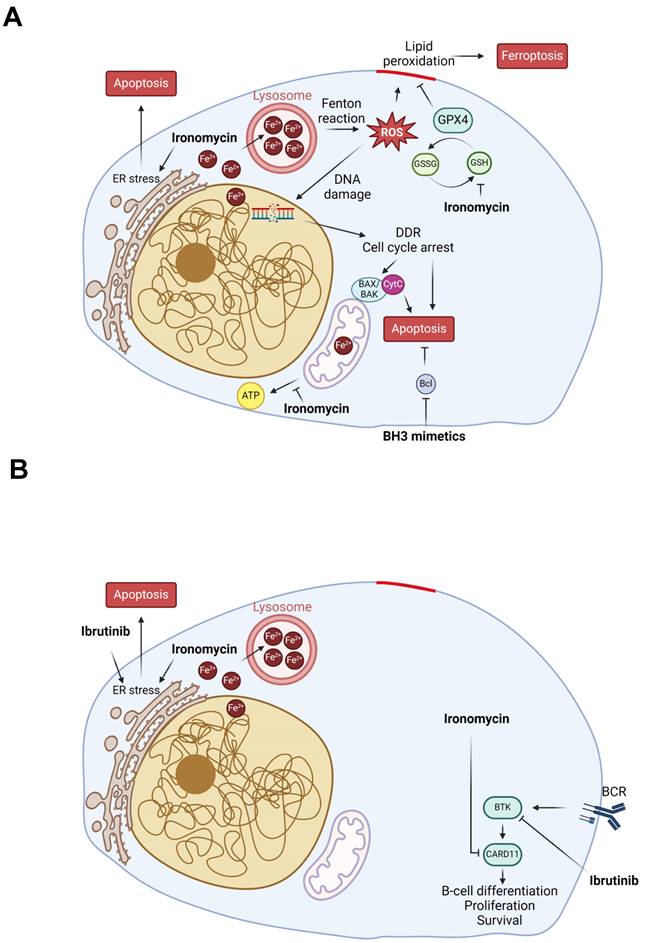
Finally, MCL is characterized by aberrant activation of the BCR pathway, which is initiated by BCR stimulation and BTK activation to regulate the downstream NF-κB and PI3K/AKT/mTOR pathways. Thus, BTK inhibitors such as ibrutinib are used in relapse/refractory MCL patients with good initial response [98] and the benefit of BTK inhibitors use earlier in the treatment course is under investigation with encouraging results [8,99-102]. However, resistance to ibrutinib is very frequent and new strategies to overcome it using drug combination are being explored [8,99-102] (ENRICH clinical trial: ISRCTN11038174). It has been suggested that B-cells resistance to ibrutinib can have different origins including gene mutation, transcriptional dysregulation or tumor microenvironment mediation [103]. Through RNA-seq, we found that ironomycin downregulates a BCR signature and confirmed the reduction of CARD11 protein, a BCR pathway downstream factor. CARD11 gain-of-function was also shown to induce BCL2A1 expression and promote drug resistance in MCL [104]. This prompted us to investigate the combination of ironomycin with ibrutinib, which synergized to kill MCL cells even in ibrutinib-resistant MAVER1 cell line. Our data indicate that ironomycin and ibrutinib synergize to impair MCL cells proliferation and cause sustained elevated UPR activation incompatible with cell survival. Moreover, combination of venetoclax and ibrutinib to treat relapse/refractory MCL patients showed a remission rate of 71% [6]; however, resistance to this drug combination has been reported [105]. Currently, an ongoing phase 3 clinical trial (SYMPATICO: #NCT03112174) is evaluating the combination ibrutinib plus venetoclax vs ibrutinib alone in relapsed MCL patients. We observed a synergy of ironomycin with both venetoclax and ibrutinib (Figure S3 and Figure 4), suggesting that targeting iron homeostasis could be a promising strategy for patients who develop drug resistance. The mechanisms of ironomycin effect alone and in combination with other drugs analyzed in this study, namely ibrutinib and Bcl2-family inhibitors, are summarized in the model in Figure 6. Altogether, our findings underscore the therapeutic potential of targeting iron homeostasis to overcome drug resistance in MCL.
Model of ironomycin cytotoxic effects alone and in combination with other drugs. (A) Ironomycin sequesters iron in lysosomes triggering different cellular responses: (1) the production of ROS through the Fenton reaction that cause peroxidation of lipids, which require GPX4 activity to be detoxified, and DNA damage that will cause cell cycle arrest; (2) impairment of mitochondrial metabolism and ATP production; (3) ER stress characterized by the activation of UPR, notably the IRE1α signaling pathway. High levels of lipid peroxidation, DNA damage, mitochondrial activity impairment and sustained ER stress lead to ferroptosis and apoptosis. Combination of ironomycin with BH3 mimetics have a synergistic toxic effect in MCL cells. (B) Ironomycin downregulates BCR-signaling and synergizes with ibrutinib. Combination of both drugs further increases a sustained UPR that leads to apoptosis. Figures were created with Biorender.com.
Supplementary Material
Supplementary figures and methods.
Supplementary table 1.
Supplementary tables 2-3.
Supplementary table 4.
Acknowledgements
We acknowledge the imaging facility MRI, member of the France-BioImaging national infrastructure supported by the French National Research Agency (ANR-10-INBS-04, “Investments for the future”). The J. Moreaux research group was supported by grants from INCA PLBIO22 PIC-ASO (INCA_16734), ANR-23-CE15-0016-01 EPI-B-PLASMADIFF, SIRIC Montpellier Cancer (INCa-DGOS-INSERM- ITMO Cancer_ 18004), ARC foundation PGA EpiMM3D, Institut Carnot CALYM and a grant CALYM-Janssen, FFRMG (AAP-FFRMG-2021), AAP ECOPHYTO - PELYCANO (This action is led by the Ministries for Agriculture and Food Sovereignty, for an Ecological Transition and Technical Cohesion, for Health and Prevention, and for Higher Education and Research, with the financial support of the French Office for Biodiversity, as part of the call for projects on the Ecophyto II+ plan "Pgytosanitary products : from exposure to impacts on human health and ecosystems towards an integrated "one health" approach", with the fees for diffuse pollution coming from the Ecophyto II+ plan), AAP READYNOV, MSDAVENIR EpiMuM-3D, Institut Universitaire de France and by the European Union (Project 101097094 — ELMUMY. Views and opinions expressed are however those of the author(s) only and do not necessarily reflect those of the European Union or HADEA. Neither the European Union nor the granting authority can be held responsible for them). SO is supported by a grant from Fondation de France. JER is supported by la Ligue Nationale Contre le Cancer “Équipe Labellisée” and l'Agence Nationale de la Recherche (LABEX SIGNALIFE ANR-11- LABX-0028-01).
Author contributions
SO: designed and performed the research, analyzed the data and wrote the paper. LA and JD: performed the research, analyzed the data and participated in the writing of the paper. HdB, MA, EGP, OK, GR, NR: participated in the research. MLZ performed bioinformatic analyses. VJ, AR and SA: performed the BH3 profiling experiments. TC, GC, CH, JC, JER, RR: participated in the research and in the writing of the paper. CB and JM: acquired the funding, supervised the research and the writing of the paper.
Data sharing statement
For original data, please contact c-bret@chu-montpellier.fr and jerome.moreaux@igh.cnrs.fr.
The genomic data are available at Gene Expression Omnibus repository under the accession number GSE273121.
Competing Interests
The authors have declared that no competing interest exists.
References
1. Armitage JO, Longo DL. Mantle-Cell Lymphoma. N Engl J Med. 2022;386(26):2495-2506
2. Jain P, Wang ML. Mantle cell lymphoma in 2022—A comprehensive update on molecular pathogenesis, risk stratification, clinical approach, and current and novel treatments. American J Hematol. 2022;97(5):638-656
3. de Claro RA, McGinn KM, Verdun N. et al. FDA Approval: Ibrutinib for Patients with Previously Treated Mantle Cell Lymphoma and Previously Treated Chronic Lymphocytic Leukemia. Clinical Cancer Research. 2015;21(16):3586-3590
4. Wang M, Shah NN, Alencar AJ. et al. LOXO-305, A Next Generation, Highly Selective, Non-Covalent BTK Inhibitor in Previously Treated Mantle Cell Lymphoma, Waldenström's Macroglobulinemia, and Other Non-Hodgkin Lymphomas: Results from the Phase 1/2 BRUIN Study. Blood. 2020;136(Supplement 1):8-10
5. Jain P, Romaguera J, Srour SA. et al. Four-year follow-up of a single arm, phase II clinical trial of ibrutinib with rituximab (IR) in patients with relapsed/refractory mantle cell lymphoma (MCL). Br J Haematol. 2018;182(3):404-411
6. Tam CS, Anderson MA, Pott C. et al. Ibrutinib plus Venetoclax for the Treatment of Mantle-Cell Lymphoma. N Engl J Med. 2018;378(13):1211-1223
7. Zhao S, Kanagal-Shamanna R, Navsaria L. et al. Efficacy of venetoclax in high risk relapsed mantle cell lymphoma ( MCL ) - outcomes and mutation profile from venetoclax resistant MCL patients. Am J Hematol. 2020;95(6):623-629
8. Jain P, Zhao S, Lee HJ. et al. Ibrutinib With Rituximab in First-Line Treatment of Older Patients With Mantle Cell Lymphoma. JCO. 2022;40(2):202-212
9. Hershkovitz-Rokah O, Pulver D, Lenz G. et al. Ibrutinib resistance in mantle cell lymphoma: clinical, molecular and treatment aspects. Br J Haematol. 2018;181(3):306-319
10. Paul BT, Manz DH, Torti FM. et al. Mitochondria and Iron: current questions. Expert Rev Hematol. 2017;10(1):65-79
11. Zhang C. Essential functions of iron-requiring proteins in DNA replication, repair and cell cycle control. Protein Cell. 2014;5(10):750-760
12. Farida B, Ibrahim KG, Abubakar B. et al. Iron deficiency and its epigenetic effects on iron homeostasis. J Trace Elem Med Biol. 2023;78:127203
13. Dixon SJ, Lemberg KM, Lamprecht MR. et al. Ferroptosis: An Iron-Dependent Form of Nonapoptotic Cell Death. Cell. 2012;149(5):1060-1072
14. Battaglia AM, Chirillo R, Aversa I. et al. Ferroptosis and Cancer: Mitochondria Meet the “Iron Maiden” Cell Death. Cells. 2020;9(6):1505
15. Hassannia B, Vandenabeele P, Vanden Berghe T. Targeting Ferroptosis to Iron Out Cancer. Cancer Cell. 2019;35(6):830-849
16. Morales M, Xue X. Targeting iron metabolism in cancer therapy. Theranostics. 2021;11(17):8412-8429
17. Li J, Zhang W. From iron chelation to overload as a therapeutic strategy to induce ferroptosis in hematologic malignancies. Hematology. 2022;27(1):1163-1170
18. Wang Y, Yu L, Ding J. et al. Iron Metabolism in Cancer. IJMS. 2018;20(1):95
19. Vazana-Barad L, Granot G, Mor-Tzuntz R. et al. Mechanism of the antitumoral activity of deferasirox, an iron chelation agent, on mantle cell lymphoma. Leukemia & Lymphoma. 2013;54(4):851-859
20. Devin J, Cañeque T, Lin Y-L. et al. Targeting Cellular Iron Homeostasis with Ironomycin in Diffuse Large B-cell Lymphoma. Cancer Research. 2022;82(6):998-1012
21. Pullarkat V, Meng Z, Donohue C. et al. Iron chelators induce autophagic cell death in multiple myeloma cells. Leukemia Research. 2014;38(8):988-996
22. Mai TT, Hamaï A, Hienzsch A. et al. Salinomycin kills cancer stem cells by sequestering iron in lysosomes. Nature Chem. 2017;9(10):1025-1033
23. Versini A, Colombeau L, Hienzsch A. et al. Salinomycin Derivatives Kill Breast Cancer Stem Cells by Lysosomal Iron Targeting. Chem Eur J. 2020;26(33):7416-7424
24. Miller LD, Coffman LG, Chou JW. et al. An Iron Regulatory Gene Signature Predicts Outcome in Breast Cancer. Cancer Research. 2011;71(21):6728-6737
25. Lausen B, Schumacher M. Maximally Selected Rank Statistics. Biometrics. 1992;48(1):73
26. Rosenwald A, Wright G, Wiestner A. et al. The proliferation gene expression signature is a quantitative integrator of oncogenic events that predicts survival in mantle cell lymphoma. Cancer Cell. 2003;3(2):185-197
27. Herviou L, Kassambara A, Boireau S. et al. PRC2 targeting is a therapeutic strategy for EZ score defined high-risk multiple myeloma patients and overcome resistance to IMiDs. Clin Epigenet. 2018;10(1):121
28. Moreaux J, Reme T, Leonard W. et al. Development of Gene Expression-Based Score to Predict Sensitivity of Multiple Myeloma Cells to DNA Methylation Inhibitors. Molecular Cancer Therapeutics. 2012;11(12):2685-2692
29. Garciaz S, Guirguis AA, Müller S. et al. Pharmacologic Reduction of Mitochondrial Iron Triggers a Noncanonical BAX/BAK-Dependent Cell Death. Cancer Discovery. 2022;12(3):774-791
30. Nisbet-Brown E, Olivieri NF, Giardina PJ. et al. Effectiveness and safety of ICL670 in iron-loaded patients with thalassaemia: a randomised, double-blind, placebo-controlled, dose-escalation trial. The Lancet. 2003;361(9369):1597-1602
31. Neufeld EJ. Oral chelators deferasirox and deferiprone for transfusional iron overload in thalassemia major: new data, new questions. Blood. 2006;107(9):3436-3441
32. Elalfy MS, Adly AM, Wali Y. et al. Efficacy and safety of a novel combination of two oral chelators deferasirox/deferiprone over deferoxamine/deferiprone in severely iron overloaded young beta thalassemia major patients. Eur J Haematol. 2015;95(5):411-420
33. Tanaka C. Clinical pharmacology of deferasirox. Clin Pharmacokinet. 2014;53(8):679-694
34. Samara A, Shapira S, Lubin I. et al. Deferasirox induces cyclin D1 degradation and apoptosis in mantle cell lymphoma in a reactive oxygen species- and GSK3β-dependent mechanism. Br J Haematol. 2021;192(4):747-760
35. Kim J, Gómez-Pastora J, Weigand M. et al. A Subpopulation of Monocytes in Normal Human Blood Has Significant Magnetic Susceptibility: Quantification and Potential Implications. Cytometry A. 2019;95(5):478-487
36. Wang K, Huang X, Di Liberto M. et al. Cell Cycle Dysregulation in Mantle Cell Lymphoma. Hematology/Oncology Clinics of North America. 2020;34(5):809-823
37. Palmero I, Holder A, Sinclair AJ. et al. Cyclins D1 and D2 are differentially expressed in human B-lymphoid cell lines. Oncogene. 1993;8(4):1049-1054
38. Paull TT, Rogakou EP, Yamazaki V. et al. A critical role for histone H2AX in recruitment of repair factors to nuclear foci after DNA damage. Current Biology. 2000;10(15):886-895
39. Li P, Zhou L, Zhao T. et al. Caspase-9: structure, mechanisms and clinical application. Oncotarget. 2017;8(14):23996-24008
40. Shahar N, Larisch S. Inhibiting the inhibitors: Targeting anti-apoptotic proteins in cancer and therapy resistance. Drug Resistance Updates. 2020;52:100712
41. Fraser C, Ryan J, Sarosiek K. BH3 Profiling: A Functional Assay to Measure Apoptotic Priming and Dependencies. Methods Mol Biol. 2019;1877:61-76
42. Lin VS, Anderson MA, Huang DCS. et al. Venetoclax for the treatment of mantle cell lymphoma. Ann Lymphoma. 2019;3:4-4
43. Sawalha Y, Goyal S, Switchenko JM. et al. A multicenter analysis of the outcomes with venetoclax in patients with relapsed mantle cell lymphoma. Blood Advances. 2023;7(13):2983-2993
44. Chandra D, Liu J-W, Tang DG. Early mitochondrial activation and cytochrome c up-regulation during apoptosis. J Biol Chem. 2002;277(52):50842-50854
45. Eleftheriadis T, Pissas G, Liakopoulos V. et al. Cytochrome c as a Potentially Clinical Useful Marker of Mitochondrial and Cellular Damage. Front Immunol [Internet]. 2016 [cited. 2023 Jul 20];7:279
46. Miotto G, Rossetto M, Di Paolo ML. et al. Insight into the mechanism of ferroptosis inhibition by ferrostatin-1. Redox Biology. 2020;28:101328
47. Zhao Y, Li Y, Zhang R. et al. The Role of Erastin in Ferroptosis and Its Prospects in Cancer Therapy. Onco Targets Ther. 2020;13:5429-5441
48. Ciechomska IA, Przanowski P, Jackl J. et al. BIX01294, an inhibitor of histone methyltransferase, induces autophagy-dependent differentiation of glioma stem-like cells. Sci Rep. 2016;6(1):38723
49. Kimura S, Fujita N, Noda T. et al. Chapter 1 Monitoring Autophagy in Mammalian Cultured Cells through the Dynamics of LC3. Methods in Enzymology [Internet]. Elsevier; 2009 [cited. 2023 Sep 1]. p. 1-12. Available from: https://linkinghub.elsevier.com/retrieve/pii/S007668790803601X
50. Sun K, Li C, Liao S. et al. Ferritinophagy, a form of autophagic ferroptosis: New insights into cancer treatment. Front Pharmacol. 2022;13:1043344
51. Lepelletier Y, Camara-Clayette V, Jin H. et al. Prevention of Mantle Lymphoma Tumor Establishment by Routing Transferrin Receptor toward Lysosomal Compartments. Cancer Research. 2007;67(3):1145-1154
52. Hinman A, Holst CR, Latham JC. et al. Vitamin E hydroquinone is an endogenous regulator of ferroptosis via redox control of 15-lipoxygenase. PLoS One. 2018;13(8):e0201369
53. Mardones P, Rigotti A. Cellular mechanisms of vitamin E uptake: relevance in alpha-tocopherol metabolism and potential implications for disease. J Nutr Biochem. 2004;15(5):252-260
54. Mooberry LK, Sabnis NA, Panchoo M. et al. Targeting the SR-B1 Receptor as a Gateway for Cancer Therapy and Imaging. Front Pharmacol. 2016;7:466
55. Brown WJ, Warfel J, Greenspan P. Use of Nile red stain in the detection of cholesteryl ester accumulation in acid lipase-deficient fibroblasts. Arch Pathol Lab Med. 1988;112(3):295-297
56. Merolle MI, Ahmed M, Nomie K. et al. The B cell receptor signaling pathway in mantle cell lymphoma. Oncotarget. 2018;9(38):25332-25341
57. Shen Y, Li X, Dong D. et al. Transferrin receptor 1 in cancer: a new sight for cancer therapy. Am J Cancer Res. 2018;8(6):916-931
58. Jun JC, Rathore A, Younas H. et al. Hypoxia-Inducible Factors and Cancer. Curr Sleep Med Rep. 2017;3(1):1-10
59. Argyriou P, Papageorgiou SG, Panteleon V. et al. Hypoxia-inducible factors in mantle cell lymphoma: implication for an activated mTORC1→HIF-1α pathway. Ann Hematol. 2011;90(3):315-322
60. Peng L, Liu Y, Chen J. et al. APEX1 regulates alternative splicing of key tumorigenesis genes in non-small-cell lung cancer. BMC Med Genomics. 2022;15(1):147
61. Xu X-M, Wang C-G, Zhu Y-D. et al. Decreased expression of SLC 39A14 is associated with tumor aggressiveness and biochemical recurrence of human prostate cancer. Onco Targets Ther. 2016;9:4197-4205
62. Zhang Y, Wu X, Zhu J. et al. Knockdown of SLC39A14 inhibits glioma progression by promoting erastin-induced ferroptosis SLC39A14 knockdown inhibits glioma progression. BMC Cancer. 2023;23(1):1120
63. Samaniego F, Chin J, Iwai K. et al. Molecular characterization of a second iron-responsive element binding protein, iron regulatory protein 2. Structure, function, and post-translational regulation. J Biol Chem. 1994;269(49):30904-30910
64. Khiroya H, Moore JS, Ahmad N. et al. IRP2 as a potential modulator of cell proliferation, apoptosis and prognosis in nonsmall cell lung cancer. Eur Respir J. 2017;49(4):1600711
65. Zhu T, Xiao Z, Yuan H. et al. ACO1 and IREB2 downregulation confer poor prognosis and correlate with autophagy-related ferroptosis and immune infiltration in KIRC. Front Oncol. 2022;12:929838
66. Yu G, Tseng GC, Yu YP. et al. CSR1 suppresses tumor growth and metastasis of prostate cancer. Am J Pathol. 2006;168(2):597-607
67. Jiang L, Hu G, Chen F-F. et al. CSR1 suppresses tumor growth and metastasis of human hepatocellular carcinoma via inhibition of HPIP. Eur Rev Med Pharmacol Sci. 2017;21(17):3813-3820
68. Kim J, You HJ, Youn C. SCARA3 inhibits cell proliferation and EMT through AKT signaling pathway in lung cancer. BMC Cancer. 2022;22(1):552
69. Brown CO, Schibler J, Fitzgerald MP. et al. Scavenger receptor class A member 3 (SCARA3) in disease progression and therapy resistance in multiple myeloma. Leuk Res. 2013;37(8):963-969
70. Tesfay L, Paul BT, Hegde P. et al. Complementary anti-cancer pathways triggered by inhibition of sideroflexin 4 in ovarian cancer. Sci Rep. 2022;12(1):19936
71. Parker JB, Griffin MF, Downer MA. et al. Chelating the valley of death: Deferoxamine's path from bench to wound clinic. Front Med (Lausanne). 2023;10:1015711
72. Callens C, Coulon S, Naudin J. et al. Targeting iron homeostasis induces cellular differentiation and synergizes with differentiating agents in acute myeloid leukemia. J Exp Med. 2010;207(4):731-750
73. Benadiba J, Rosilio C, Nebout M. et al. Iron chelation: an adjuvant therapy to target metabolism, growth and survival of murine PTEN-deficient T lymphoma and human T lymphoblastic leukemia/lymphoma. Leuk Lymphoma. 2017;58(6):1433-1445
74. Paubelle E, Zylbersztejn F, Alkhaeir S. et al. Deferasirox and vitamin D improves overall survival in elderly patients with acute myeloid leukemia after demethylating agents failure. PLoS One. 2013;8(6):e65998
75. Choi JG, Kim J-L, Park J. et al. Effects of oral iron chelator deferasirox on human malignant lymphoma cells. Korean J Hematol. 2012;47(3):194-201
76. Lui GYL, Obeidy P, Ford SJ. et al. The iron chelator, deferasirox, as a novel strategy for cancer treatment: oral activity against human lung tumor xenografts and molecular mechanism of action. Mol Pharmacol. 2013;83(1):179-190
77. Kamihara Y, Takada K, Sato T. et al. The iron chelator deferasirox induces apoptosis by targeting oncogenic Pyk2/β-catenin signaling in human multiple myeloma. Oncotarget. 2016;7(39):64330-64341
78. Shinoda S, Kaino S, Amano S. et al. Deferasirox, an oral iron chelator, with gemcitabine synergistically inhibits pancreatic cancer cell growth in vitro and in vivo. Oncotarget. 2018;9(47):28434-28444
79. Scoglio M, Cappellini MD, D'Angelo E. et al. Kidney Tubular Damage Secondary to Deferasirox: Systematic Literature Review. Children (Basel). 2021;8(12):1104
80. Towerman AS, Guilliams KP, Guerriero R. et al. Hyperammonemia and acute liver failure associated with deferasirox in two adolescents with sickle cell disease. Br J Haematol. 2023;201(4):e30-e33
81. Fraser J, Brook R, He T. et al. Deferasirox-induced liver injury and Fanconi syndrome in a beta-thalassemia major male. BMJ Case Rep. 2020;13(7):e234542
82. Huang W-F, Chou H-C, Tsai Y-W. et al. Safety of deferasirox: a retrospective cohort study on the risks of gastrointestinal, liver and renal events. Pharmacoepidemiol Drug Saf. 2014;23(11):1176-1182
83. Teh MR, Frost JN, Armitage AE. et al. Analysis of Iron and Iron-Interacting Protein Dynamics During T-Cell Activation. Front Immunol. 2021;12:714613
84. Tiemann M, Schrader C, Klapper W. et al. Histopathology, cell proliferation indices and clinical outcome in 304 patients with mantle cell lymphoma (MCL): a clinicopathological study from the European MCL Network. Br J Haematol. 2005;131(1):29-38
85. Hoster E, Rosenwald A, Berger F. et al. Prognostic Value of Ki-67 Index, Cytology, and Growth Pattern in Mantle-Cell Lymphoma: Results From Randomized Trials of the European Mantle Cell Lymphoma Network. J Clin Oncol. 2016;34(12):1386-1394
86. Grootjans J, Kaser A, Kaufman RJ. et al. The unfolded protein response in immunity and inflammation. Nat Rev Immunol. 2016;16(8):469-484
87. Nordström L, Sernbo S, Eden P. et al. SOX11 and TP53 add prognostic information to MIPI in a homogenously treated cohort of mantle cell lymphoma-a Nordic Lymphoma Group study. Br J Haematol. 2014;166(1):98-108
88. Rodrigues JM, Hassan M, Freiburghaus C. et al. p53 is associated with high-risk and pinpoints TP53 missense mutations in mantle cell lymphoma. Br J Haematol. 2020;191(5):796-805
89. Willis SN, Chen L, Dewson G. et al. Proapoptotic Bak is sequestered by Mcl-1 and Bcl-xL, but not Bcl-2, until displaced by BH3-only proteins. Genes Dev. 2005;19(11):1294-1305
90. Ovejero S, Kumanski S, Soulet C. et al. A sterol-PI(4)P exchanger modulates the Tel1/ATM axis of the DNA damage response. EMBO J. 2023;42(15):e112684
91. Han D, Lerner AG, Vande Walle L. et al. IRE1alpha kinase activation modes control alternate endoribonuclease outputs to determine divergent cell fates. Cell. 2009;138(3):562-575
92. Xu X, Liu J, Huang B. et al. Reduced response of IRE1α/Xbp-1 signaling pathway to bortezomib contributes to drug resistance in multiple myeloma cells. Tumori. 2017;103(3):261-267
93. Wang XZ, Harding HP, Zhang Y. et al. Cloning of mammalian Ire1 reveals diversity in the ER stress responses. EMBO J. 1998;17(19):5708-5717
94. Lee A-H, Iwakoshi NN, Glimcher LH. XBP-1 regulates a subset of endoplasmic reticulum resident chaperone genes in the unfolded protein response. Mol Cell Biol. 2003;23(21):7448-7459
95. Zeeshan H, Lee G, Kim H-R. et al. Endoplasmic Reticulum Stress and Associated ROS. IJMS. 2016;17(3):327
96. Moncan M, Mnich K, Blomme A. et al. Regulation of lipid metabolism by the unfolded protein response. J Cell Mol Med. 2021;25(3):1359-1370
97. Han J, Kaufman RJ. The role of ER stress in lipid metabolism and lipotoxicity. J Lipid Res. 2016;57(8):1329-1338
98. Rule S, Dreyling M, Goy A. et al. Ibrutinib for the treatment of relapsed/refractory mantle cell lymphoma: extended 3.5-year follow up from a pooled analysis. Haematologica. 2019;104(5):e211-e214
99. Wang ML, Jurczak W, Jerkeman M. et al. Ibrutinib plus Bendamustine and Rituximab in Untreated Mantle-Cell Lymphoma. N Engl J Med. 2022;386(26):2482-2494
100. Giné E, de la Cruz F, Jiménez Ubieto A. et al. Ibrutinib in Combination With Rituximab for Indolent Clinical Forms of Mantle Cell Lymphoma (IMCL-2015): A Multicenter, Open-Label, Single-Arm, Phase II Trial. J Clin Oncol. 2022;40(11):1196-1205
101. Tivey A, Shotton R, Eyre TA. et al. Ibrutinib as first-line therapy for mantle cell lymphoma: a multicenter, real-world UK study. Blood Adv. 2024;8(5):1209-1219
102. Dreyling M, Doorduijn J, Giné E. et al. Ibrutinib combined with immunochemotherapy with or without autologous stem-cell transplantation versus immunochemotherapy and autologous stem-cell transplantation in previously untreated patients with mantle cell lymphoma (TRIANGLE): a three-arm, randomised, open-label, phase 3 superiority trial of the European Mantle Cell Lymphoma Network. Lancet. 2024;403(10441):2293-2306
103. George B, Chowdhury SM, Hart A. et al. Ibrutinib Resistance Mechanisms and Treatment Strategies for B-Cell lymphomas. Cancers (Basel). 2020;12(5):1328
104. Decombis S, Bellanger C, Le Bris Y. et al. CARD11 gain of function upregulates BCL2A1 expression and promotes resistance to targeted therapies combination in B-cell lymphoma. Blood. 2023;142(18):1543-1555
105. Agarwal R, Chan Y-C, Tam CS. et al. Dynamic molecular monitoring reveals that SWI-SNF mutations mediate resistance to ibrutinib plus venetoclax in mantle cell lymphoma. Nat Med. 2019;25(1):119-129
Author contact
![]() Corresponding authors: Dr Caroline Bret, Department of Biological Hematology, Hôpital Saint-Eloi - CHRU de Montpellier, 80, av. Augustin Fliche, 34295 Montpellier Cedex 5, IGH - Institute of Human Genetics, CNRS UMR-UM 9002; http://www.igh.cnrs.fr; phone: +33 (0)4 67 33 70 31; fax: +33 (0)4 67 33 70 36; mail: c-bretfr. Pr Jérôme Moreaux, Laboratory for Monitoring Innovative Therapies, Department of Biological Hematology, Hôpital Saint-Eloi - CHRU de Montpellier, 80, av. Augustin Fliche, 34295 Montpellier Cedex 5, IGH - Institute of Human Genetics, CNRS UMR-UM 9002; http://www.igh.cnrs.fr; fax: +33 (0)4 67 33 70 36; mail: jerome.moreauxcnrs.fr.
Corresponding authors: Dr Caroline Bret, Department of Biological Hematology, Hôpital Saint-Eloi - CHRU de Montpellier, 80, av. Augustin Fliche, 34295 Montpellier Cedex 5, IGH - Institute of Human Genetics, CNRS UMR-UM 9002; http://www.igh.cnrs.fr; phone: +33 (0)4 67 33 70 31; fax: +33 (0)4 67 33 70 36; mail: c-bretfr. Pr Jérôme Moreaux, Laboratory for Monitoring Innovative Therapies, Department of Biological Hematology, Hôpital Saint-Eloi - CHRU de Montpellier, 80, av. Augustin Fliche, 34295 Montpellier Cedex 5, IGH - Institute of Human Genetics, CNRS UMR-UM 9002; http://www.igh.cnrs.fr; fax: +33 (0)4 67 33 70 36; mail: jerome.moreauxcnrs.fr.