Impact Factor
- Issue 14; 2026
- Issue 13; 2026
- Issue 12; 2026
- Issue 11; 2026
- Issue 10; 2026
- Volume 16; 2026
- Advance Articles
- Past Issues
- Cover Images
- Cover Suggestion
- Index & Coverage
- Special Issues
Introduction
Materials and Methods
Results
Discussion
Conclusion
Supplementary Material
Acknowledgements
References
International Journal of Biological Sciences
International Journal of Medical Sciences
 Global reach, higher impact

Theranostics 2024; 14(9):3708-3718. doi:10.7150/thno.98053 This issue Cite
Research Paper
Enhancing precision: A predictive model for 177Lu-DOTATATE treatment response in neuroendocrine tumors using quantitative 68Ga-DOTATATE PET and clinicopathological biomarkers
Azadeh Akhavanallaf1 ![]() , Sonal Joshi1, Arathi Mohan2,3, Francis P Worden2,3, John C Krauss2,3, Habib Zaidi5,6,7,8, Kirk Frey1, Krithika Suresh4, Yuni K Dewaraja1, Ka Kit Wong1
, Sonal Joshi1, Arathi Mohan2,3, Francis P Worden2,3, John C Krauss2,3, Habib Zaidi5,6,7,8, Kirk Frey1, Krithika Suresh4, Yuni K Dewaraja1, Ka Kit Wong1
1. Department of Radiology, University of Michigan, Ann Arbor, MI, USA.
2. Division of Hematology and Oncology, Department of Internal Medicine, University of Michigan, Ann Arbor, MI, USA.
3. Rogel Cancer Center, University of Michigan, Ann Arbor, MI, USA.
4. Department of Biostatistics, University of Michigan, Ann Arbor, MI, USA.
5. Division of Nuclear Medicine and Molecular Imaging, Geneva University Hospital, CH-1211 Geneva, Switzerland.
6. Department of Nuclear Medicine and Molecular Imaging, University of Groningen, University Medical Center Groningen, 9700 RB Groningen, Netherlands.
7. Department of Nuclear Medicine, University of Southern Denmark, DK-500, Odense, Denmark.
8. University Research and Innovation Center, Óbuda University, Budapest, Hungary.
Received 2024-5-4; Accepted 2024-5-31; Published 2024-6-11
Abstract

Purpose: This study aims to elucidate the role of quantitative SSTR-PET metrics and clinicopathological biomarkers in the progression-free survival (PFS) and overall survival (OS) of neuroendocrine tumors (NETs) treated with peptide receptor radionuclide therapy (PRRT).
Methods: A retrospective analysis including 91 NET patients (M47/F44; age 66 years, range 34-90 years) who completed four cycles of standard 177Lu-DOTATATE was conducted. SSTR-avid tumors were segmented from pretherapy SSTR-PET images using a semiautomatic workflow with the tumors labeled based on the anatomical regions. Multiple image-based features including total and organ-specific tumor volume and SSTR density along with clinicopathological biomarkers including Ki-67, chromogranin A (CgA) and alkaline phosphatase (ALP) were analyzed with respect to the PRRT response.
Results: The median OS was 39.4 months (95% CI: 33.1-NA months), while the median PFS was 23.9 months (95% CI: 19.3-32.4 months). Total SSTR-avid tumor volume (HR = 3.6; P = 0.07) and bone tumor volume (HR = 1.5; P = 0.003) were associated with shorter OS. Also, total tumor volume (HR = 4.3; P = 0.01), liver tumor volume (HR = 1.8; P = 0.05) and bone tumor volume (HR = 1.4; P = 0.01) were associated with shorter PFS. Furthermore, the presence of large lesion volume with low SSTR uptake was correlated with worse OS (HR = 1.4; P = 0.03) and PFS (HR = 1.5; P = 0.003). Among the biomarkers, elevated baseline CgA and ALP showed a negative association with both OS (CgA: HR = 4.9; P = 0.003, ALP: HR = 52.6; P = 0.004) and PFS (CgA: HR = 4.2; P = 0.002, ALP: HR = 9.4; P = 0.06). Similarly, number of prior systemic treatments was associated with shorter OS (HR = 1.4; P = 0.003) and PFS (HR = 1.2; P = 0.05). Additionally, tumors originating from the midgut primary site demonstrated longer PFS, compared to the pancreas (HR = 1.6; P = 0.16), and those categorized as unknown primary (HR = 3.0; P = 0.002).
Conclusion: Image-based features such as SSTR-avid tumor volume, bone tumor involvement, and the presence of large tumors with low SSTR expression demonstrated significant predictive value for PFS, suggesting potential clinical utility in NETs management. Moreover, elevated CgA and ALP, along with an increased number of prior systemic treatments, emerged as significant factors associated with worse PRRT outcomes.
Keywords: SSTR-PET, images-based features, NET, PRRT, outcome prediction
Introduction
Neuroendocrine neoplasms are heterogeneous tumors originating from neuroendocrine cells in various organs and include both well-differentiated neuroendocrine tumors (NETs) and poorly differentiated carcinomas. Approximately 20-50% of patients with NETs have metastatic disease at the time of diagnosis without an available curative surgical option, necessitating systemic treatment [1, 2].
The majority of well-differentiated NETs overexpress somatostatin receptors (SSTRs), which present a target for theragnostic radiopharmaceuticals. Treatment with radiolabeled-conjugated somatostatin analogs, called peptide receptor radionuclide therapy (PRRT) was introduced using 111In-pentetreotide and was extended by developing 90Y-octreotide and 177Lu-DOTATATE treatments [3]. Upon the approval of 177Lu-DOTATATE on the basis of the phase III NETTER-1 trial [4], 177Lu-PRRT has been widely used in the management of advanced well-differentiated NETs. Despite the improved progression-free survival (PFS) rate from 177Lu-DOTATATE, PRRT continuous to be a palliative approach, as the objective response rate has been reported about 30% [5, 6]. Therefore, appropriate sequencing of PRRT and selection of optimal candidates for this therapy remains an area of ongoing research. Moreover, potential toxicities and the high cost of PRRT warrant further investigation to optimize PRRT.
Currently, patient eligibility for PRRT is based on qualitative assessment of SSTR expression (Krenning score 3-4), visualized with one of the approved radiopharmaceuticals (68Ga-DOTATATE, 68Ga-DOTATOC, and 64Cu-DOTATATE) using positron emission tomography (PET) [7]. Several studies investigated the predictive value of baseline SSTR-PET on PRRT outcome. Multiple quantitative metrics derived from SSTR-PET images, such as SSTR density, tumor burden and localization, as well as tumor size and heterogeneity have been reported to be predictive for NET patients who underwent PRRT [8-10]. Several clinicopathological biomarkers have also been proposed as predictive for PRRT outcome including type of primary tumor, proliferation index, previous systemic therapy, chromogranin A (CgA) and blood-based genomic biomarkers [1, 11, 12]. To date, however, the predictors of PRRT outcome have not been thoroughly elucidated.
The aim of this study is to identify clinical parameters based on SSTR-PET and clinicopathological biomarkers that predict PRRT response in terms of overall survival (OS) and progression-free survival (PFS) for NETs. This work makes a multifaceted contribution to the field: 1. SSTR-avid total body tumor volume labeled with anatomical location was segmented using a semi-automatic workflow and verified by a clinician. 2. A comprehensive set of predictors including image-based features and biomarkers were incorporated in the analysis.
Materials and Methods
Patient Population
In a retrospective, single-center study conducted at the University of Michigan, we assessed a group of 180 patients who underwent at least one cycle of 177Lu-DOTATATE treatment between 2018 and 2021 in routine clinical practice. This study was approved by the local Institutional Review Board and informed consent was obtained from participants. From this initial cohort, we excluded 89 patients based on specific criteria: (1) use of PET tracer other than 68Ga-DOTATATE; (2) those who did not complete four treatment cycles; (3) other tumors (paraganglioma, neuroblastoma); (4) patients with other type of cancers at the time of therapy; (5) missing SSTR-PET; (6) insufficient follow-up period, defined as not having at least one clinical visit after completing their treatment. Consequently, a total of 91 patients with histologically proven NETs who completed four cycles of the approved protocol for 177Lu-PRRT (7.4 GBq infusions; ~2-month intervals) met the inclusion criteria. As of the data lock in September 2023, 35 patients (38%) had succumbed to their condition, and 60 patients (66%) had exhibited disease progression (Supplemental-Figure 1).
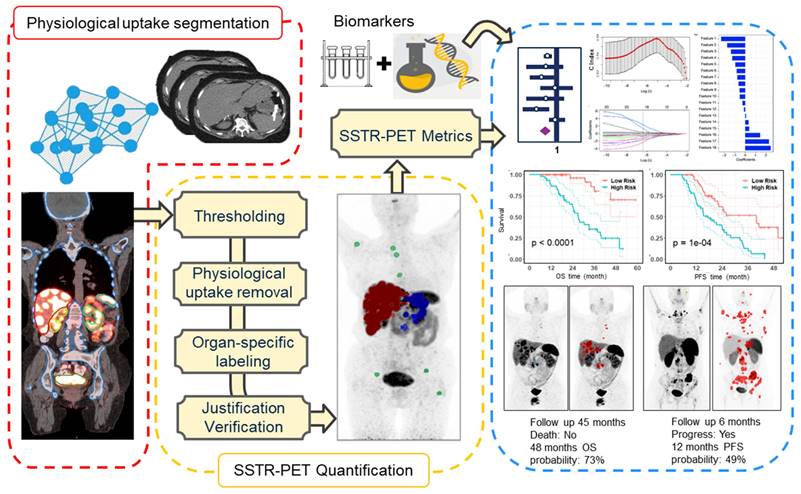
left panel: deep learning based physiological uptake segmentation, middle panel: quantification of SSTR-PET images and right panel: survival analysis.
SSTR-PET/CT Imaging and PET-derived Metrics
Patient eligibility required PET scans to be acquired less than six months prior to the planned PRRT. 68Ga-PET/CTs were performed on a Biograph mCT (Siemens Healthineers) (84/91), Biograph TruePoint (Siemens Healthineers) (2/91), Discovery STE (GE Healthcare) (4/91) and Vereos PET/CT (Philips) (1/91) at approximately 66 min (95% CI: 63-68 min) post-intravenous injection of ~164 MBq (95% CI: 157-166 MBq) of 68Ga-DOTATATE. The majority of images (82/91) were reconstructed using ordered subset expectation maximization (OSEM) algorithm combined with time-of-flight (TOF) information and point spread function (PSF) either with 2 or 3 iterations (21 subsets). While the rest of data (9/91) were reconstructed using vendor-specific software with the recommended reconstruction parameters. Partial volume correction was not implemented.
Whole-body PET images were segmented using a semiautomatic workflow (Figure 1) based on thresholding implemented within MIM software (MIM Software Inc., Cleveland, Ohio, USA). The segmentation workflow consisted of the following steps: Organ segmentation including liver, kidneys, spleen, bone and bladder was done using an automatic workflow implemented within MIM (Contour ProtégéAI) on the attenuation correction CT of PET/CT. This workflow is consisted of a neural network framework (based on U-NET architecture) for automated contouring of normal structures on CT and MR images [13]. Subsequently, the standardized uptake value (SUV) images were segmented using a thresholding technique based on a patient-specific visual inspection followed by physiological uptake removal. A visual examination was conducted on segmented mask obtained from the automated workflow to eliminate false positive and include false negative voxels.
Each distinct lesion within the total tumor mask was annotated based on the anatomical regions (liver, bones and others). This annotation process involved aligning the anatomical masks obtained from the previous step onto the total tumor mask. Ultimately, an experienced nuclear medicine physician (KW) verified the segmentation and adjusted if needed. Examples of three cases are illustrated in Supplemental-Figure 2.
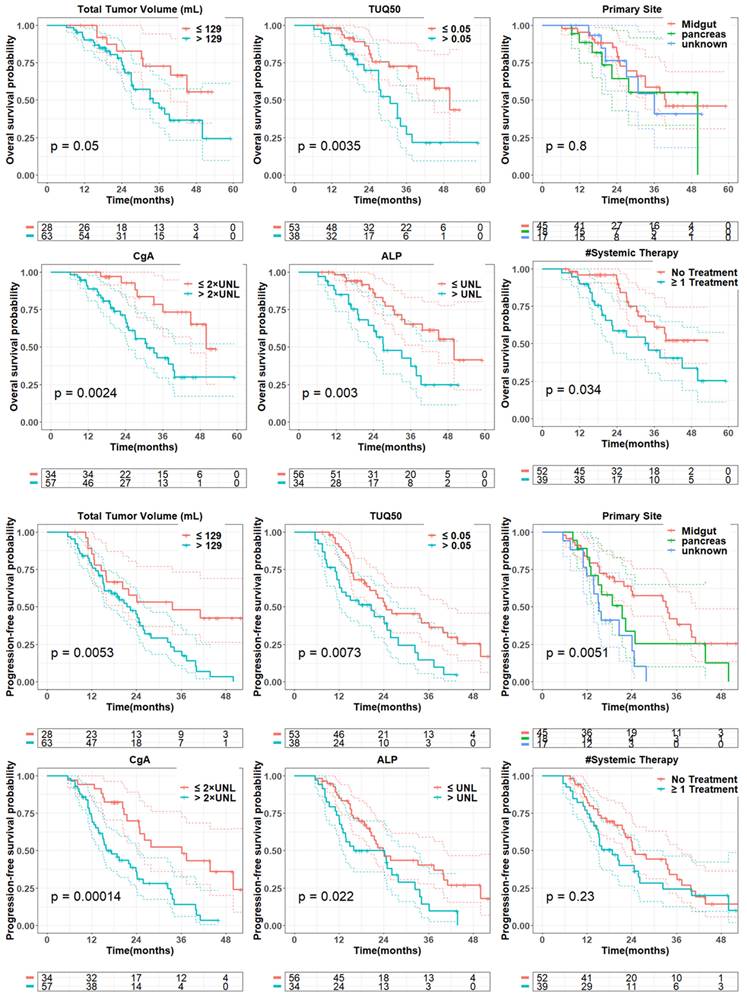
Kaplan-Meier curves for overall survival and progression-free survival based on total tumor volume, TUQ50, primary tumor site, ALP, CgA and number of prior systemic therapy. Tumor volumes were dichotomized into two groups based on their 30th percentiles, while blood laboratory values were dichotomized based on their upper normal limit (UNL); ALP and CgA cut-off was defined UNL and 2*UNL respectively [36]. Reported p-value is from log-rank test.
In the next step, image-based features including total and organ-specific tumor volume and SUV metrics were extracted from both the total tumor mask and each individually annotated lesion (Supplemental-Table 1). In addition, the volume of the largest tumor and the SUV of the most avid tumor were extracted. Also, the necrotic volume of liver tumor was manually outlined on pretherapy PET images, targeting the hypometabolic area within the hypermetabolic tumor tissue (classically a rim activity surrounding a central cold area), and correlated with hypodense regions in CT images. Inspired by Seifert et al. [14] that proposed total lesion quotient as the ratio of lesion volume to lesion SUV, we defined a metric that represents the inverse SUV of large tumors (criteria: diameter>5 cm; volume>50 mL) as tumor uptake quotient (TUQ50), based on which patients without large tumors receive a score of zero, whereas those with both large tumors and lower SUV are assigned the highest score.
Patient demographic information.
| Characteristic | (n = 91) |
|---|---|
| Sex | |
| Female / Male | 44 (48%) / 47 (52%) |
| Age at first treatment - median (range) | 66 (34-90) |
| Primary tumor site | |
| Midgut (small bowel, ileum, jejunum, colon) | 45 (48%) |
| Pancreatic | 18 (20%) |
| Unknown | 17 (19%) |
| Other (bronchial, foregut) | 11 (12%) |
| Tumor grade | |
| G1 | 30 (33%) |
| G2A/ G2B | 22 (24%) / 15 (17%) |
| G3 | 4 (4%) |
| Missing | 20 (22%) |
| Prior treatments | |
| Surgery | 54 (59%) |
| Systemic treatment (≥1) | 39 (43%) |
| Liver directed treatment or 90Y-SIRT | 34 (37%) |
| Blood biomarkers | |
| CgA (IU/L) | 309 (20-1.9e4) |
| ALP (ng/mL) | 106 (27-530) |
| Tumor volume | |
| Total tumor volume (mL) | 305.9 (5.4-4760) |
| Liver tumor volume (mL) | 95.4 (0.0-4760) |
| Bone tumor volume (mL) | 1.6 (0.0-2049) |
TUQ50 =

Clinicopathological Biomarkers
A total of 23 clinical, pathologic, and laboratory biomarkers that all were hypothesized to influence tumor behavior, and treatment response were included (Supplemental-Table 1). Grade was defined based on Ki-67 or mitotic count from biopsy/surgery of primary tumor (Ki-67≤3% G1; 3% < Ki-67≤10% G2A; 10% < Ki-67≤20% G2B; Ki-67>20% G3). We further examined a metric by dividing the number of systemic treatments received prior to PRRT (excluding targeted modalities like Yttrium-90-radioembolization or external beam radiation therapy) by the time from initial diagnosis. This calculation was used to create a factor representing the growth rate of the disease in multivariate analysis.
Statistical Analysis
OS was defined as time from the first cycle of PRRT to death from any cause. PFS was defined as time from the first cycle of PRRT to the earliest onset of progression or death from any cause. Patients lost to follow-up were censored at the date of last contact. Progression was defined as appearance of new metastatic lesions or significant increase of tumor size (not attributed to pseudo-progression) based on post-PRRT follow-up imaging that resulted in a new line of cancer treatment being commenced.
Descriptive statistics using R (version 4.3.0) software were used to examine the distribution of the exploratory features. Continuous variables with skewed distributions were log-transformed. The association between the features and the survival outcomes was assessed using univariate Cox regression models. Kaplan-Meier (K-M) curves and log-rank tests were used to compare OS and PFS between stratified groups. Features with >20% missingness were not included in multivariable analysis.
Multivariable Cox models were fit for the three sets of features: (1) PET-alone (including body weight), (2) biomarker-alone, and (3) a combined set of PET and biomarker features. Variable selection was performed using a penalized Cox regression based on least absolute shrinkage and selection operator (LASSO), where the penalty hyperparameter was tuned using nested 10-fold cross-validation. Model performance was evaluated using bootstrapped concordance index (C Index) and the Brier score based on 1000 bootstrap samples.
Results
The analysis included 91 well-differentiated NETs (M47/F44; median age 66 years, range 34-90 years). Proliferation index (Ki-67) for 71 patients was available; G1 (n = 30), G2A/G2B (n = 22/n = 15) and G3 (n = 4). The primary tumor site was categorized as midgut (n = 45), pancreas (n = 18), unknown (n = 17) and others including bronchial, head and neck and foregut (n = 11). Four cases received reduced (50%) dose of 177Lu-DOTATATE in one cycle, and one patient in three cycles, because of potential risk of toxicity. Demographic information is summarized in Table 1.
The median of SSTR-avid total tumor volume was 305 mL (range 5.4-4760 mL), while the total tumor SUVmean was about 12.4 (range 2.7-43.4). 86 patients (95%) had liver metastasis with the median volume of 117.7 mL (range 0.7-4706 mL), while 64 patients (70%) showed bone metastasis with the median volume of 3.7 mL (range 0.11-325 mL).
The OS and PFS analysis accounted for 35 (38%) and 60 (66%) events throughout the study period, respectively. The median follow-up time for OS and PFS was 24.8 and 18.5 months, respectively. While the median OS time was 39.4 months (95% CI: 33.1-NA months) and the median PFS time was 23.9 months (95% CI: 19.3-32.4 months).
Overall Survival
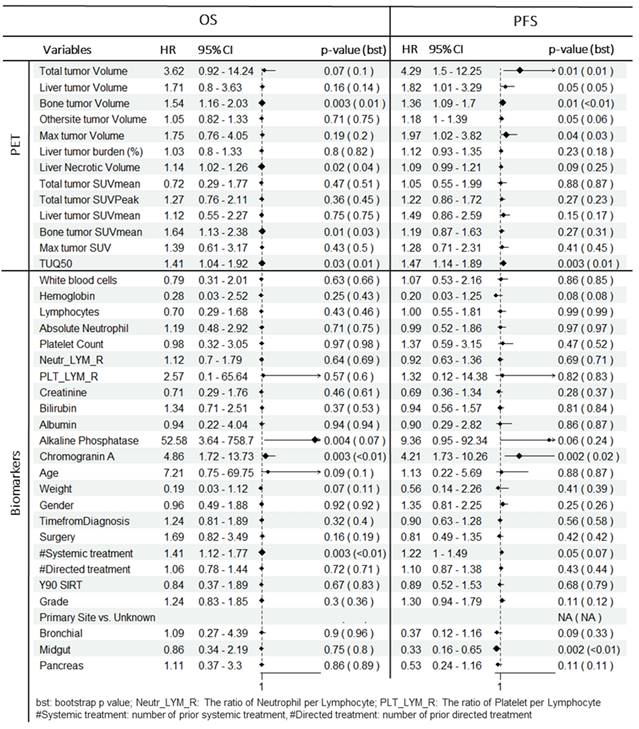
In univariate analysis (Table 2, Figure 2), total tumor volume was associated with worse overall survival (HR = 3.6; 95% CI: 0.92-14.2; P = 0.07). Similar findings were observed for liver tumor volume (HR = 1.7; 95% CI: 0.8-3.6; P = 0.16) and bone tumor volume (HR = 1.5; 95% CI: 1.2-2.0; P = 0.003). TUQ50 representing the inverse SUV of large tumors (>50 mL), was significantly associated with poor OS (HR = 1.4; 95% CI: 1.0-1.9; P = 0.03). Among the exploratory biomarkers, elevated baseline CgA (HR = 4.9; 95% CI: 1.7-13.7; P = 0.003) and ALP (HR = 52.6; 95% CI: 3.6-758.7; P = 0.004) showed a negative association with OS. Similarly, number of prior systemic treatment was associated with shorter OS (HR = 1.4; 95% CI: 1.1-1.8; P = 0.003). Also, age was a negative prognosticator (HR = 7.2; 95% CI: 0.75-69.7; P = 0.09).
Univariate Cox regression analysis for OS and PFS. Tumor volumes, CgA and ALP are log transformed. Each variable is normalized by its mean. Bootstrap p value is presented along with original p value to robustly evaluate the statistical significance of covariate effects.
In multivariate analysis (Table 3), among PET-alone features, bone tumor volume (HR = 1.6; P = 0.002), the TUQ50 (HR = 1.5; P = 0.008) and body weight (HR = 0.11; P = 0.02) were selected. Among biomarkers, ALP (HR = 690.5; P < 0.0001), CgA (HR = 12.4; P < 0.0001) and number of prior systemic treatment divided by time from diagnosis (HR = 1.3; P = 0.001) along with prior surgery (HR = 3.8; P = 0.002) were significant prognosticators. From combined features, only bone tumor volume (HR = 1.6; P = 0.008) was selected from image-based variables along with selected biomarkers.
Selected features from multivariable penalized Cox regression algorithm (LASSO). Tumor volumes, CgA and ALP are log transformed. Each variable is normalized by its mean.
| Survival | Features | Predictors | PET-alone / Biomarkers-alone | Combined (PET+Bio) | ||||
|---|---|---|---|---|---|---|---|---|
| HR | 95% CI | p value | HR | 95% CI | p value | |||
| OS | PET | Bone tumor volume | 1.6 | 1.2-2.2 | 0.002 | 1.6 | 1.1-2.1 | 0.008 |
| TUQ50 | 1.5 | 1.1-2.0 | 0.008 | |||||
| Weight | 0.11 | 0.0-0.7 | 0.02 | |||||
| Bio | CgA | 12.4 | 3.7-41.3 | < 0.0001 | 9.7 | 2.9-32.9 | < 0.0001 | |
| ALP | 690.5 | 26.3-1e4 | < 0.0001 | 879.7 | 39.6-1e4 | < 0.0001 | ||
| Surgery | 3.8 | 1.6-9.0 | 0.002 | 2.7 | 1.2-6.5 | 0.02 | ||
| #Systemic treatment/Time from diagnostic | 1.34 | 1.1-1.6 | 0.001 | 1.2 | 1.0-1.5 | 0.02 | ||
| PFS | PET | Liver tumor SUVmean | 1.9 | 1.0-3.5 | 0.04 | 2.30 | 1.2-4.4 | 0.01 |
| Bone tumor volume | 1.4 | 1.1-1.8 | 0.002 | 1.3 | 1.1-1.7 | 0.02 | ||
| TUQ50 | 1.5 | 1.2-2.0 | 0.002 | 1.3 | 1.0-1.8 | 0.06 | ||
| Weight | 0.38 | 0.09-1.6 | 0.19 | 0.3 | 0.1-1.1 | 0.07 | ||
| Bio | CgA | 7.1 | 2.7-18.4 | 0.0001 | 4.3 | 1.6-11.3 | 0.003 | |
| ALP | 4.9 | 0.43-56.1 | 0.2 | |||||
| Primary Site | 1.3 | 1.07-1.5 | 0.007 | 1.2 | 1.0-1.5 | 0.02 | ||
| #Systemic treatment/Time from diagnostic | 1.2 | 0.97-1.4 | 0.10 | 1.3 | 1.1-1.6 | 0.004 | ||
Progression Free Survival
In univariate analysis (Table 2, Figure 2), total tumor volume was associated with shorter PFS (HR, 4.3; 95% CI: 1.5-12.3; P = 0.01), Similar findings were observed for liver tumor volume (HR, 1.8; 95% CI: 1.0-3.3; P = 0.05) and bone tumor volume (HR = 1.4; 95% CI: 1.1-1.7; P = 0.01). In addition, the volume of the largest tumor (HR, 2.0; 95% CI: 1.0-3.8; P = 0.04) and TUQ50 (HR, 1.5; 95% CI: 1.1-1.9; P = 0.003) were significantly associated with poor PFS. Among biomarkers, elevated baseline CgA (HR = 4.2; 95% CI: 1.7-10.3; P = 0.002) and ALP (HR, 9.4; 95% CI: 1.0-92.3; P = 0.06) showed a negative association with PFS. The same was the case for number of prior systemic treatment (HR = 1.2; 95% CI: 1.0-1.5; P = 0.05). Midgut primary site of tumors versus unknown (HR = 0.3; 95% CI: 0.16-0.65; P = 0.002) and pancreas primary site versus unknown (HR = 0.5; 95% CI: 0.2-1.2; P = 0.11) showed a longer PFS.
From penalized multivariate analysis (Table 3), among PET features, liver tumor SUVmean (HR = 1.9; P = 0.04), bone tumor volume (HR = 1.4; P = 0.002) along with TUQ50 (HR = 1.5; P = 0.002) were selected. Among biomarkers, CgA (HR = 7.1; P = 0.0001), ALP (HR = 4.9; P = 0.2), number of prior systemic treatment divided by time from diagnosis (HR = 1.2; P = 0.1) and primary tumor site (HR = 1.3; P = 0.007) were significant predictive features. Patients with risk score greater than the median predicted from the multivariable Cox models (Table 3), were plotted using Kaplan-Meier estimator in Figure 3.
Quality of the prognostic and predictive risk scores from multivariate models (Table 3) on PET-alone, biomarkers-alone, and combined model in the whole data set. Patients with the predicted risk score greater than the median of the total cohort was dichotomized as high risk. Reported p-value is from log-rank test.
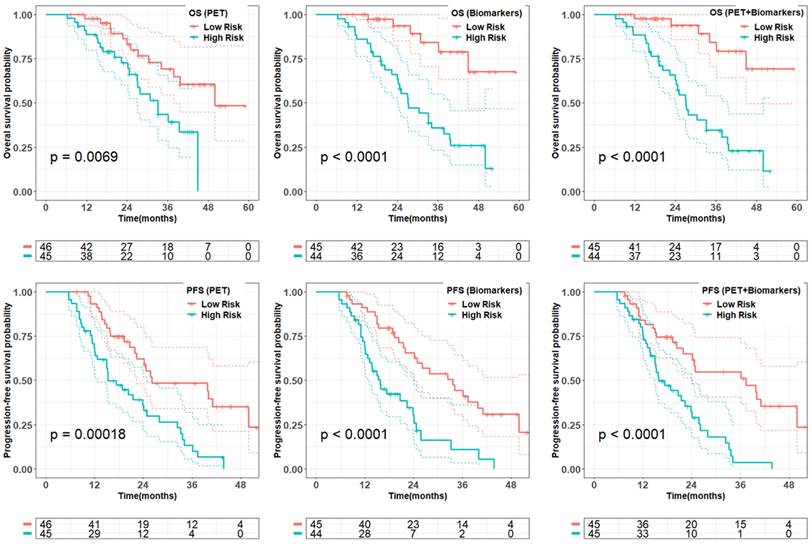
We evaluated the accuracy of the proposed multivariate models through 1000 bootstrap analysis summarized in Table 4. We further evaluated the performance of the whole process including penalized algorithm for feature selection followed by Cox regression in a bootstrap analysis. The biomarker model demonstrated prognostic accuracy, as measured by a C index and Brier score, of 0.77 ± 0.09 and 0.10 ± 0.03 while combined model slightly improved the model performance. The PET and biomarker model showed similar accuracy in prediction of PFS with C Index of 0.63 ± 0.09 and 0.66 ± 0.09, respectively. However, the incorporation of combined features into penalized model did not enhance the overall model performance.
Model performance validation using selected features through bootstrap analysis. Whole process validation representing the model performance of feature selection plus Cox regression through bootstrap samples.
| OS | PFS | ||||||||
|---|---|---|---|---|---|---|---|---|---|
| Variable set | C Index | Brier | C Index | Brier | |||||
| mean | S.E. | mean | S.E. | mean | S.E. | mean | S.E. | ||
| Model performance with selected features | |||||||||
| PET | 0.68 | 0.11 | 0.12 | 0.04 | 0.63 | 0.09 | 0.17 | 0.03 | |
| Bio | 0.77 | 0.09 | 0.10 | 0.03 | 0.66 | 0.09 | 0.16 | 0.03 | |
| PET + Bio | 0.78 | 0.09 | 0.10 | 0.03 | 0.66 | 0.09 | 0.15 | 0.03 | |
| Model performance including variable selection | |||||||||
| PET | 0.59 | 0.20 | 0.12 | 0.07 | 0.62 | 0.15 | 0.17 | 0.05 | |
| Bio | 0.72 | 0.19 | 0.09 | 0.06 | 0.60 | 0.15 | 0.17 | 0.05 | |
| PET + Bio | 0.71 | 0.19 | 0.1 | 0.06 | 0.57 | 0.14 | 0.18 | 0.05 | |
Discussion
177Lu-PRRT has shown promising potential as an effective targeted therapy in well-differentiated metastatic NETs by improving quality of life and prolongation of PFS, however the specific response to PRRT can vary, and not all patients experience the same level of benefit. Hence, the development of a robust patient selection criteria rather than simplified qualitative metrics is imperative [15]. To address this unmet need, we evaluated the prognostic and predictive value of SSTR-PET features along with a comprehensive set of clinicopathological biomarkers on PRRT outcome.
In NETTER-1 trial, among 110 well-differentiated midgut NETs the median OS was reported to be 48 months and the PFS at 20 months was found to be 65.2% for the cohort receiving PRRT. Our study showed a shorter OS of 39.4 months and a comparable PFS at 20 months of 59%. We observed a median PFS of 23.9 months which is shorter than the PFS reported from NETTER-1. However, our subgroup analysis of midgut NETs (n = 45) showed a median PFS of 33.2 months [4, 16].
We investigated the association of pretherapy SSTR-PET quantitative metrics with PRRT outcome. Several studies have correlated higher SSTR density quantified by baseline 68Ga-PET with improved PRRT outcome [17, 18]. In our study, SSTR density in terms of total tumor SUVmean was not correlated with outcome (P>0.48). However, the TUQ50 representing the inverse SUV of the largest tumor (> 50 mL) was significantly associated with worse PFS (HR = 1.5; P = 0.003) and OS (HR = 1.4; P = 0.03), implying that higher SSTR density is associated with a more favorable PRRT outcome (Figure 2: TUQ50 cutoff of 0.05 is equal to SUV of 20). Notably, unlike FDG PET, where total tumor glycolysis (TLG = tumor volume × tumor SUV) is associated with tumor proliferation and worse outcomes, total tumor SSTR expression consists of total tumor volume, a negative predictor of survival, and tumor SUV, a positive predictor, opposing effects may negate a predictive value of SSTR density [14]. Therefore, tumor uptake quotient was found to be significantly associated with poor survival.
SSTR-positive tumor volume has been reported as a factor of worse prognosis and predictive of PFS [9, 19]. We identified the total tumor volume was associated with poor PFS (HR = 4.3; p = 0.01) and OS (HR = 3.6; p = 0.07). Also, liver tumor volume as the dominant site of distant metastasis amongst NETs was shown to be a poor prognostic factor [20, 21]. However, two previous studies demonstrated no difference in PFS based upon the extent of hepatic tumor burden [22, 23]. We observed a negative association of liver tumor volume with both PFS (HR = 1.8; P = 0.05), and OS (HR = 1.7; P = 0.16), however, it was not statistically significant. We considered that the typically larger size of liver tumors compared to tumors in other organs contributes to the strong correlation between liver tumor volume and total tumor volume. In our study, we found a strong correlation between total tumor volume and liver tumor volume (ρ = 0.9; P < 0.001). This implies that the overall extent of the disease (total tumor volume) is negatively associated with the outcome, not specifically hepatic involvement. Of note, liver tumor burden as the percentage of tumor volume within the liver was associated with poor PFS, but not significantly (HR = 1.1; P = 0.23). This implies, unlike surgical procedures, that disease burden is a critical factor representing preserved healthy tissue, and that in PRRT, the percentage of liver involvement is not a significant predictor, given that PRRT is well-tolerated and does not cause serious hepatic toxicity. Also, necrotic volumes of liver tumors identified in 68Ga-PET, present in 18 (20%) cases, demonstrated a poor prognostic value, suggesting that tumor necrosis may indicate a more aggressive tumor biology [24].
Previous studies have shown that the presence of bone metastases in NETs is linked to a shorter OS [20, 25]. In our analysis, an elevated bone tumor volume was correlated with poor outcome (HR = 1.5; p = 0.003). Sabet et al. [26] demonstrated that bone metastasis can be effectively controlled by PRRT (mainly because of their small size), however the presence of extended bone tumors is associated with more advanced stage of disease and therefore associated with shorter PFS. We observed that total bone tumor volume larger than 3 mL that is roughly associated with an average of five focal bone metastasis is associated with worse outcome, concordant with findings reported by Swiha et al. [20].
The size of the tumor is known to be correlated with the therapeutic effectiveness of radiolabeled targeted therapy, particularly in short-range radionuclides such as 177Lu (beta/gamma emitter, average beta range in soft tissue ~ 0.23 mm) [27, 28]. A post hoc analysis of NETTER-1 demonstrated that the absence of a large tumor (diameter > 30 mm) was associated with improved PFS [23]. We evaluated the impact of tumor size in terms of SSTR-positive largest tumor volume on PFS that showed a significant association with shorter PFS (HR = 2.0, P = 0.04).
Several studies have investigated non-imaging biomarkers of NETs that affect PRRT outcome. Ezziddin et al. demonstrated Ki-67 > 10% is a poor prognostic and predictive factor [21, 26]. Their finding was confirmed by Albersberg et al. [3] showing the predictive value of Ki-67 of more than 5% for PFS and more than 10% for OS. Thuillier et al. [19] showed Ki-67 > 20% (G3) is a negative prognostic factor. However, in the current study we did not observe a significant impact of tumor histologic parameter (Ki-67) with OS (HR = 1.2; P = 0.3) and PFS (HR = 1.3; P = 0.11). This observation might be influenced by the high number of missing values (22%) which were generally due to remote pathology specimens where Ki-67 reporting was not routinely performed. Also, we observed four cases with Ki-67>20% that demonstrated shorter median OS (21 months) and PFS (11 months).
Previous studies have documented longer survival for midgut-NETs compared to pancreas, lung and unknown origin tumors, possibly owing to a more indolent nature of midgut-NETs [20, 21, 29]. In our study, median PFS for midgut tumors was 34 months versus 21 months for pancreatic and 16 months for unknown (P = 0.005). This might be due to the more aggressive type of pancreas-originated tumors compared to midgut tumors and the more advanced stage of unknown primary neuroendocrine tumors at the time of diagnosis. However, we did not observe any significant prognostic value based on the primary tumor site (Figure 2).
There is not a firm conclusion regarding the impact of prior systemic treatment on the effectiveness of PRRT [22, 30]. In our study, the number of prior systemic treatment was associated with shorter survival (HR = 1.4; P = 0.003). Prior systemic treatment highlights the progression of disease and its resistance against previous lines of therapy. We divided the number of prior systemic treatment by the time from diagnosis in order to create a factor representing the growth rate of the disease; this factor was significantly associated with poor OS (HR = 1.6; CI = 1.1-2.2, P = 0.02) and PFS (HR = 1.5; CI = 1.0-2.2, P = 0.05).
Among available baseline blood biomarkers, elevated Chromogranin A was found a strong negative predictor of survival (OS: HR = 4.9; P = 0.003; PFS: HR = 4.2; P = 0.002) which is consistent with other studies including the RADIANT trial [12, 20, 23, 31]. While changes in CgA can indicate treatment response if declining, or conversely progression of disease if rising, there are debates regarding the role of CgA as a prognostic biomarker because of its high false-positivity (related to proton pump inhibitor, kidney failure, and heart disease) and false-negativity (non-secretory tumors) [32].
Elevated Alkaline Phosphatase which may be linked with extensive liver and bone metastases has been reported a poor predictive factor associated with PRRT survival [31, 33, 34]. In our study, ALP showed a strong prognostic value (HR = 52.6; P = 0.004) and moderate predictive value (HR = 9.4; P = 0.06). Nevertheless, in the post hoc analysis of the NETTER-1 trial, ALP was not identified as being associated with PFS [23].
In addition, we investigated the association of some inflammatory factors as platelet-lymphocyte ratio and neutrophil-lymphocyte ratio with survival [35]. We did not observe a significant correlation between neutrophil- lymphocyte ratio (HR = 1.1; P = 0.64) and platelet-lymphocyte ratio (HR = 2.6; P = 0.57) with OS. As it is known, age is associated with shorter OS, however, PFS was not influenced by patient age in our population. Also, patient weight was selected in multivariate models including PET features that might be due to its influence on the distribution of radiopharmaceuticals and the SUV quantitative metrics.
One strength of our study lies in the diversity and heterogeneity within our NET cohort that may reflect a realistic clinical practice of PRRT. Another advantage of this study is the precise quantification of SSTR-PET metrics, achieved through a meticulous manual verification of tumor segmentation. Moreover, this study is the first investigation exploring a comprehensive set of image-based features and biomarkers in relation to PRRT outcomes. However, it bears some limitations. The analysis is based on single-center database and was performed retrospectively and therefore is susceptible to selection biases. The limited size of the patient cohort could potentially impact generalizability. Furthermore, the patients in our analysis had a restricted follow-up time post-PRRT, leading to a significant number of censoring events. Lastly, blood-based genomic biomarkers and FDG-PET, which have been reported as prognostic/predictive factors, were not included in the analysis because they are not part of routine clinical protocol at our center.
Conclusion
In summary, we demonstrated that image-based features including SSTR-avid tumor volume, bone lesion involvement and the presence of large tumors as well as elevated baseline chromogranin A and alkaline phosphatase along with the prior systemic treatments have negative correlation with PRRT PFS and OS. These findings could inform pre-therapy assessments, guiding PRRT treatment decisions and patient stratification in future trials.
Supplementary Material
Supplementary figures and table.
Acknowledgements
Funding
This work was supported by Swiss National Science Foundation (No: P500PT_211066) and grants R01CA240706 from the National Cancer Institute; and the Euratom research and training programme Sinfonia project (No 945196).
Informed Consent
Informed consent was obtained from all individual participants included in the study.
Competing Interests
Yuni Dewaraja is a consultant for MIM Software. The other authors have declared that no competing interest exists.
References
1. Dasari A, Shen C, Halperin D, Zhao B, Zhou S, Xu Y. et al. Trends in the incidence, prevalence, and survival outcomes in patients with neuroendocrine tumors in the united states. JAMA Oncol. 2017;3:1335-42
2. Kong G, Hicks RJ. Peptide receptor radiotherapy: Current approaches and future directions. Curr Treat Options Oncol. 2019;20:77
3. Aalbersberg EA, Huizing DMV, Walraven I, de Wit-van der Veen BJ, Kulkarni HR, Singh A. et al. Parameters to predict progression-free and overall survival after peptide receptor radionuclide therapy: A multivariate analysis in 782 patients. J Nucl Med. 2019;60:1259-65
4. Strosberg J, El-Haddad G, Wolin E, Hendifar A, Yao J, Chasen B. et al. Phase 3 trial of (177)Lu-Dotatate for midgut neuroendocrine tumors. N Engl J Med. 2017;376:125-35
5. Hamiditabar M, Ali M, Roys J, Wolin EM, OʼDorisio TM, Ranganathan D. et al. Peptide receptor radionuclide therapy with 177Lu-Octreotate in patients with somatostatin receptor expressing neuroendocrine tumors: Six years' assessment. Clin Nucl Med. 2017;42:436-43
6. Dannoon SF, Alenezi SA, Elgazzar AH. The efficacy of the available peptide receptor radionuclide therapy for neuroendocrine tumors: A meta-analysis. Nucl Med Commun. 2017;38:1085-93
7. Hofman MS, Lau WF, Hicks RJ. Somatostatin receptor imaging with 68Ga Dotatate PET/CT: Clinical utility, normal patterns, pearls, and pitfalls in interpretation. Radiographics. 2015;35:500-16
8. Ortega C, Wong RKS, Schaefferkoetter J, Veit-Haibach P, Myrehaug S, Juergens R. et al. Quantitative (68)Ga-Dotatate PET/CT parameters for the prediction of therapy response in patients with progressive metastatic neuroendocrine tumors treated with (177)Lu-Dotatate. J Nucl Med. 2021;62:1406-14
9. Toriihara A, Baratto L, Nobashi T, Park S, Hatami N, Davidzon G. et al. Prognostic value of somatostatin receptor expressing tumor volume calculated from (68)Ga-Dotatate PET/CT in patients with well-differentiated neuroendocrine tumors. Eur J Nucl Med Mol Imaging. 2019;46:2244-51
10. Pauwels E, Dekervel J, Verslype C, Clement PM, Dooms C, Baete K. et al. [(68)Ga]Ga-Dotatate-avid tumor volume, uptake and inflammation-based index correlate with survival in neuroendocrine tumor patients treated with [(177)Lu]Lu-Dotatate PRRT. Am J Nucl Med Mol Imaging. 2022;12:152-62
11. Bodei L, Kidd MS, Singh A, van der Zwan WA, Severi S, Drozdov IA. et al. PRRT genomic signature in blood for prediction of (177)Lu-Octreotate efficacy. Eur J Nucl Med Mol Imaging. 2018;45:1155-69
12. Yao JC, Fazio N, Singh S, Buzzoni R, Carnaghi C, Wolin E. et al. Everolimus for the treatment of advanced, non-functional neuroendocrine tumours of the lung or gastrointestinal tract (radiant-4): A randomised, placebo-controlled, phase 3 study. Lancet. 2016;387:968-77
13. Hanlin W. Automated contouring using neural networks. White paper. 2023
14. Seifert R, Kessel K, Schlack K, Weber M, Herrmann K, Spanke M. et al. PSMA PET total tumor volume predicts outcome of patients with advanced prostate cancer receiving [(177)Lu]Lu-PSMA-617 radioligand therapy in a bicentric analysis. Eur J Nucl Med Mol Imaging. 2021;48:1200-10
15. Hope TA, Pavel M, Bergsland EK. Neuroendocrine tumors and peptide receptor radionuclide therapy: When is the right time? J Clin Oncol. 2022;40:2818-29
16. Strosberg JR, Caplin ME, Kunz PL, Ruszniewski PB, Bodei L, Hendifar A. et al. (177)Lu-Dotatate plus long-acting octreotide versus high-dose long-acting octreotide in patients with midgut neuroendocrine tumours (NETTER-1): Final overall survival and long-term safety results from an open-label, randomised, controlled, phase 3 trial. Lancet Oncol. 2021;22:1752-63
17. Sharma R, Wang WM, Yusuf S, Evans J, Ramaswami R, Wernig F. et al. (68)Ga-Dotatate PET/CT parameters predict response to peptide receptor radionuclide therapy in neuroendocrine tumours. Radiother Oncol. 2019;141:108-15
18. Ezziddin S, Lohmar J, Yong-Hing CJ, Sabet A, Ahmadzadehfar H, Kukuk G. et al. Does the pretherapeutic tumor suv in 68Ga Dotatoc PET predict the absorbed dose of 177Lu Octreotate? Clin Nucl Med. 2012;37:e141-7
19. Thuillier P, Liberini V, Grimaldi S, Rampado O, Gallio E, Santi B. et al. Prognostic value of whole-body PET volumetric parameters extracted from (68)Ga-Dotatoc PET/CT in well-differentiated neuroendocrine tumors. J Nucl Med. 2022;63:1014-20
20. Swiha MM, Sutherland DEK, Sistani G, Khatami A, Abazid RM, Mujoomdar A. et al. Survival predictors of (177)Lu-Dotatate peptide receptor radionuclide therapy (PRRT) in patients with progressive well-differentiated neuroendocrine tumors (NETs). J Cancer Res Clin Oncol. 2022;148:225-36
21. Ezziddin S, Attassi M, Yong-Hing CJ, Ahmadzadehfar H, Willinek W, Grünwald F. et al. Predictors of long-term outcome in patients with well-differentiated gastroenteropancreatic neuroendocrine tumors after peptide receptor radionuclide therapy with 177Lu-Octreotate. J Nucl Med. 2014;55:183-90
22. Das S, Du L, Schad A, Jain S, Jessop A, Shah C. et al. A clinical score for neuroendocrine tumor patients under consideration for Lu-177-Dotatate therapy. Endocr Relat Cancer. 2021;28:203-12
23. Strosberg J, Kunz PL, Hendifar A, Yao J, Bushnell D, Kulke MH. et al. Impact of liver tumour burden, alkaline phosphatase elevation, and target lesion size on treatment outcomes with (177)Lu-Dotatate: An analysis of the NETTER-1 study. Eur J Nucl Med Mol Imaging. 2020;47:2372-82
24. De Jong MC, Pinto D, Parameswaran R. Reduced uptake pattern on (68) Ga-Dotatate-scan may indicate necrosis predicting aggressive behavior in pheochromocytoma and paragangliomas (PPGLs). J Surg Oncol. 2023;128:764-8
25. Kavecansky J, Wei L, Caronia L, Ramirez MT, Bloomston M, Shah MH. Bone metastases in well-to-moderately differentiated neuroendocrine tumors: A single institutional review from the Ohio state university medical center. Pancreas. 2015;44:198-203
26. Sabet A, Khalaf F, Haslerud T, Al-Zreiqat A, Sabet A, Simon B. et al. Bone metastases in GEP-NET: Response and long-term outcome after PRRT from a follow-up analysis. Am J Nucl Med Mol Imaging. 2013;3:437-45
27. Bodei L, Mueller-Brand J, Baum RP, Pavel ME, Hörsch D, O'Dorisio MS. et al. The joint IAEA, EANM, and SNMMI practical guidance on peptide receptor radionuclide therapy (PRRNT) in neuroendocrine tumours. Eur J Nucl Med Mol Imaging. 2013;40:800-16
28. Galler M, Rogasch JMM, Huang K, Jann H, Plehm K, Wetz C. et al. Prognostic value of the largest lesion size for progression-free survival in patients with NET undergoing salvage PRRT with [(177)Lu]Lu-Dotatoc. Cancers (Basel). 2022;14:1768
29. Sharma N, Naraev BG, Engelman EG, Zimmerman MB, Bushnell DL Jr, OʼDorisio TM. et al. Peptide receptor radionuclide therapy outcomes in a north american cohort with metastatic well-differentiated neuroendocrine tumors. Pancreas. 2017;46:151-6
30. Kipnis ST, Hung M, Kumar S, Heckert JM, Lee H, Bennett B. et al. Laboratory, clinical, and survival outcomes associated with peptide receptor radionuclide therapy in patients with gastroenteropancreatic neuroendocrine tumors. JAMA Netw Open. 2021;4:e 212274
31. Andriantsoa M, Hoibian S, Autret A, Gilabert M, Sarran A, Niccoli P. et al. An elevated serum alkaline phosphatase level in hepatic metastases of grade 1 and 2 gastrointestinal neuroendocrine tumors is unusual and of prognostic value. PLoS One. 2017;12:e0177971
32. Malczewska A, Kos-Kudła B, Kidd M, Drozdov I, Bodei L, Matar S. et al. The clinical applications of a multigene liquid biopsy (netest) in neuroendocrine tumors. Adv Med Sci. 2020;65:18-29
33. Clancy TE, Sengupta TP, Paulus J, Ahmed F, Duh MS, Kulke MH. Alkaline phosphatase predicts survival in patients with metastatic neuroendocrine tumors. Dig Dis Sci. 2006;51:877-84
34. Brabander T, van der Zwan WA, Teunissen JJM, Kam BLR, Feelders RA, de Herder WW. et al. Long-term efficacy, survival, and safety of [(177)Lu-dota(0),tyr(3)]octreotate in patients with gastroenteropancreatic and bronchial neuroendocrine tumors. Clin Cancer Res. 2017;23:4617-24
35. de Lima BAM, da Silva RG, Carroll C, Vilhena B, Perez C, Felix R. et al. Neutrophil to lymphocyte ratio as a prognosis biomarker of PRRT in NET patients. Endocrine. 2022;78:177-85
36. Chougnet CN, Leboulleux S, Caramella C, Lumbroso J, Borget I, Déandreis D. et al. Frequency and characterization of gastro-entero-pancreatic neuroendocrine tumor patients with high-grade of uptake at somatostatin receptor scintigraphy. Endocr Relat Cancer. 2013;20:229-39
Author contact
![]() Corresponding author: Azadeh Akhavanallaf, 1301 Catherine, 2276 Medical Science I/5610, Ann Arbor, MI 48109. Email: a.akhavan88com; ORCID: 0000-0002-1486-4702; Phone: 7345960267.
Corresponding author: Azadeh Akhavanallaf, 1301 Catherine, 2276 Medical Science I/5610, Ann Arbor, MI 48109. Email: a.akhavan88com; ORCID: 0000-0002-1486-4702; Phone: 7345960267.