Impact Factor
 Global reach, higher impact
Theranostics 2023; 13(11):3872-3896. doi:10.7150/thno.80801 This issue Cite
Research Paper
Ascorbic acid induces MLC2v protein expression and promotes ventricular-like cardiomyocyte subtype in human induced pluripotent stem cells derived cardiomyocytes
Yu Gao1,2,*, Liping Su1,*, Yuhua Wei3, Shihua Tan1, Zhenyu Hu4,5, Zhonghao Tao1,6, Jean-Paul Kovalik7, Tuck Wah Soong4,5, Jianyi Zhang3, Jun Pu2, Lei Ye1 ![]()
1. National Heart Research Institute Singapore, National Heart Centre Singapore, Singapore.
2. Department of Cardiology, Ren Ji Hospital, School of Medicine, Shanghai Jiao Tong University, Shanghai 200127, China.
3. Department of Biomedical Engineering, The University of Alabama at Birmingham, Birmingham, AL, USA.
4. Department of Physiology, National University of Singapore, Singapore.
5. Cardiovascular Diseases Translational Research Programme, Yong Loo Lin School of Medicine, National University of Singapore.
6. Department of Thoracic and Cardiovascular Surgery, Nanjing First Hospital, Nanjing Medical University, Nanjing, Jiangsu, China.
7. Programme in Cardiovascular and Metabolic Disorders, Duke-NUS, Singapore.
*Equal contribution first author.
Received 2022-11-13; Accepted 2023-6-9; Published 2023-7-3
Abstract

Introduction: The potentially unlimited number of cardiomyocyte (CMs) derived from human induced pluripotent stem cells (hiPSCs) in vitro facilitates high throughput applications like cell transplantation for myocardial repair, disease modelling, and cardiotoxicity testing during drug development. Despite promising progress in these areas, a major disadvantage that limits the use of hiPSC derived CMs (hiPSC-CMs) is their immaturity.
Methods: Three hiPSC lines (PCBC-hiPSC, DP3-hiPSCs, and MLC2v-mEGFP hiPSC) were differentiated into CMs (PCBC-CMs, DP3-CMs, and MLC2v-CMs, respectively) with or without retinoic acid (RA). hiPSC-CMs were either maintained up to day 30 of contraction (D30C), or D60C, or purified using lactate acid and used for experiments. Purified hiPSC-CMs were cultured in basal maturation medium (BMM) or BMM supplemented with ascorbic acid (AA) for 14 days. The AA treated and non-treated hiPSC-CMs were characterized for sarcomeric proteins (MLC2v, TNNI3, and MYH7), ion channel proteins (Kir2.1, Nav1.5, Cav1.2, SERCA2a, and RyR), mitochondrial membrane potential, metabolomics, and action potential. Bobcat339, a selective and potent inhibitor of DNA demethylation, was used to determine whether AA promoted hiPSC-CM maturation through modulating DNA demethylation.
Results: AA significantly increased MLC2v expression in PCBC-CMs, DP3-CMs, MLC2v-CMs, and RA induced atrial-like PCBC-CMs. AA treatment significantly increased mitochondrial mass, membrane potential, and amino acid and fatty acid metabolism in PCBC-CMs. Patch clamp studies showed that AA treatment induced PCBC-CMs and DP3-CMs adaptation to a ventricular-like phenotype. Bobcat339 inhibited MLC2v protein expression in AA treated PCBC-CMs and DP3-CMs. DNA demethylation inhibition was also associated with reduced TET1 and TET2 protein expressions and reduced accumulation of the oxidative product, 5 hmC, in both PCBC-CMs and DP3-CMs, in the presence of AA.
Conclusions: Ascorbic acid induced MLC2v protein expression and promoted ventricular-like CM subtype in hiPSC-CMs. The effect of AA on hiPSC-CM was attenuated with inhibition of TET1/TET2 mediated DNA demethylation.
Keywords: human induced pluripotent stem cells, cardiomyocyte, electrophysiology
Introduction
The discovery of induced pluripotent stem cells (iPSCs) ushered in a new era in obtaining pluripotent stem cells from adult somatic cells. Human hiPSCs, like embryonic stem cells (ESCs), have self-renewal ability to proliferate indefinitely and yet retain the potential to differentiate into cells of the three primary germ layers (endoderm, mesoderm, and ectoderm) including cardiomyocytes (CMs). Cells derived from hiPSCs have a nearly identical genetic profile compared to the cell donor, which makes them useful for not only regenerative medicine, but also disease modeling research and drug screening.
Large quantities of human CMs have been successfully generated from hiPSCs using various differentiation protocols (1-3) and are being tested as cell transfer therapy for regenerating cardiac tissue in animal models (4-9). hiPSCs derived CMs (hiPSC-CMs) hold promise to serve as in vitro disease models for inherited and acquired heart diseases as the differentiated cells from patient specific hiPSCs retain disease-related phenotypes. Thus, the hiPSCs can serve as an in vitro model of pathogenesis, which will provide an innovative way to explore the molecular mechanisms of diseases and identify durgs for treatment.
Despite progress in the advancement in culturing techniques, the yield of atrial/ventricular hiPSC derived CMs may be protocol and cell line dependent. Most freshly differentiated hPSC-CMs display an immature CM phenotype which is different from ventricular CMs (CM) in terms of morphology, metabolism and functionality (10, 11). Since hiPSC-CMs display fetal-like atrial electrophysiology, immature hiPSC-CMs may increase risks for arrhythmias when used for myocardial repair (10) and may be not suitable for drug development. Most heart disease drugs target ventricular cardiomyocytes. Thus, it is crucial to have disease-specific ventricular CMs for in vitro for drug screening.
Studies have shown a variety of methods, such as long-term culture (12, 13), tissue engineering (14, 15), mechanical or electrical stimulus5, 36, metabolism (16, 17) and growth hormones (18) to promote the transition from immature CM to mature CMs at different levels. The maturation of cardiomyocytes is a complex process with extensive changes in morphology, electrophysiology, and metabolism defined by a collective set of changes observed at a physiological and molecular level (10, 11).
Ascorbic acid (AA) has been shown to improve CM differentiation from pluripotent stem cells (19-22). Although AA has been included in several formula of hiPSC-CM media due to its anti-oxidant effect (23-26), none studies reported its maturation effect and mechanism on hiPSC-CMs. In the current study, we explored the feasibility of AA for inducing ventricular-like hiPSC-CMs. We found that AA induced the gene and protein expression of MLC2v and promoted ventricular-like CM subtype in hiPSC-CMs.
Methods
Culture and differentiation of hiPSCs
Three hiPSC lines were used in this study: two were PCBC-hiPSCs and DP3-hiPSCs (9, 27-29) which have high CM differentiation efficiency, and one was MLC2v-mEGFP hiPSC which was purchased from Coriell Institute, USA. The MLC2v-mEGFP hiPSC is a transgenic reporter hiPSC line with GFP-tagged MLC2v gene. All cell lines were cultured in a feeder-free system with a mTeSR (STEMCELL Technologies, Canada) and passaged every 4-5 days with ReleSR (Stem Cell Tech., Canada) or Versene (Thermo Fisher) (9).
The differentiation protocol of hiPSCs into cardiomyocytes was described by Lian et al. (30). Briefly, hiPSCs were dissociated into single cells and cultured in mTeSR media for 4-5 days until confluence. On day 0, hiPSCs were cultured in RPMI medium supplemented with 1 x B27 without insulin (B27-) and 10 μM CHIR99021 for 24 h. On day 1, differentiation medium was changed to RPMI/B27- for 48 h. On day 3, cells were cultured in RPMI/B27- supplemented with 4 μM IWP2 for 48 h. On day 5, differentiation medium was changed to RPMI/B27- for 48 h. On day 7 of differentiation and every 3 days thereafter, cell culture medium was changed to RPMI/B27 medium. The differentiated hiPSCs would start contracting between day 8-10 of differentiation.
For induction of atrial-like hiPSC-CMs, 1 μM retinoic acid (RA) was added into differentiation medium on days 3-7 (31, 32). Then, the contractile atrial-like hiPSC-CMs would either be maintained up to day 60 of contraction (D60C) or would be purified and used for experiments.
Purification of hiPSC-CMs
To exclude non-CMs, we dissociated hiPSC-CMs into single cells on D7C to undergo purification (9, 33). Briefly, hiPSC-CMs were cultured in purification medium (Table 1) for 6 days (33). On D14C, purified cells would be used for experiment.
Purification medium
| Component | Dilution Factor | E.g. 500mL |
|---|---|---|
| RPMI no glucose | - | 482.5mL |
| β-mercap (Cell culture grade) | 1000x | 500 μL |
| NEAA | 100x | 5 mL |
| GlutaMAX | 100x | 5 mL |
| Anti-Anti | 100x | 5 mL |
| 1M Lactic Acid | 250 x (4mM) | 2 mL |
Maturation of hiPSC-CMs
Purified hiPSC-CM were cultured in basal maturation medium (BMM) (Table 2). 150 μM AA was added into BMM to promote hiPSC-CM maturation. Cell culture medium was changed evey 2 days for 14 days. In parallel, hiPSC-CMs, which were maintained in RMPI supplemented with 50 x dilution of B27 up to D30C or D60C, would be used as non-treated control cells. The outline of experimental workflow was shown in Figure S1.
Basal maturation medium
| Component | Dilution Factor | E.g. 500mL |
|---|---|---|
| RPMI no glucose | - | 474.5 mL |
| β-mercap (Cell culture grade) | 1000 x | 500 μL |
| NEAA | 100 x | 5 mL |
| GlutaMAX | 100 x | 5 mL |
| Anti-Anti | 100 x | 5 mL |
| B27 | 50 x | 10 mL |
Fluorescence immunostaining
To visualize contractile protein expression in hiPSC-CM after treatment, hiPSC-CMs were fixed with 4% paraformaldehyde for 20 min at room temperature and were permeabilized using 0.1% Triton X-100 at 4 oC for 10 min. The cells were incubated with Ultra V Block (Thermo Fisher, USA) for 7 min and were incubated with primary antibodies (Table 3) at 4 oC overnight: mouse anti-cardiac troponin T (cTnT), rabbit anti-troponin I isoform 3 (TNNI3), mouse anti-atrial isoform myosin light chain 2 (MLC2a), rabbit anti-ventricular isoform myosin light chain 2 (MLC2v), rabbit anti-myosin heavy chain 6 (MYH6), and mouse anti-myosin heavy chain 7 (MYH7). On the second day, secondary antibodies, donkey anti-mouse IgG conjugated with Alexa Fluor® 555 or donkey-anti-rabbit IgG conjugated with Alexa Fluor® 488, were incubated with cells for 1 h at room temperature. Then, cell nuclei were counter-stained with 4′,6-diamidino-2-phenylindole (DAPI). Stained cells were mounted and visualized using Olympus IX73 microscope and Cell Sens Standard software (Olympus, Japan).
Antibodies used for immunostaining
| Primary antibody | Dilution | Category NO. | Company | 2nd antibody | Dilution | Category NO. | Company |
|---|---|---|---|---|---|---|---|
| Mouse anti-myosin light chain atrial isoform | 1:200 | 311011AT1 | Synaptic systems | Goat anti-mouse IgG-PE | 1:400 | A31570 | Thermo Fisher |
| Rabbit anti-myosin light chain ventricular isoform | 1:200 | 10906-1-AP | Proteintech | Goat anti-rabbit IgG-FITC | 1:400 | A32790 | Thermo Fisher |
| Mouse anti-cardiac troponin T-PE | 1:20 | 564767 | BD Biosciences | Goat anti-mouse IgG-PE | 1:400 | A31570 | Thermo Fisher |
| Rabbit anti-troponin I3 (cardiac type) | 1:200 | ab-47003 | Abcam | Goat anti-rabbit IgG-FITC | 1:400 | A32790 | Thermo Fisher |
| Rabbit anti-myosin Heavy Chain 6 | 1:200 | 22281-1-AP | Proteintech | Goat anti-rabbit IgG-FITC | 1:400 | A32790 | Thermo Fisher |
| Mouse anti-myosin Heavy Chain 7 | 1:10 | MAB1548 | Millipore | Goat anti-mouse IgG-PE | 1:400 | A31570 | Thermo Fisher |
| Rabbit anti-IRX4 | 1:200 | 104135-T34 | Sino Biological | Donkey anti-rabbit IgG-FITC | 1:400 | 711-095-152 | Jackson ImmunoResearch |
Flow cytometry
To quantify protein expression level in hiPSC-CM after AA treatment, hiPSC-CMs were fixed, permeabilized, immunostained, and analyzed by flow cytometry using BD Fortessa (BD Biosciences, USA). The hiPSC-CMs with adequate size and granularity were included in the statistical analysis for assessing control protein expressions of cTnT, TNNI3, MLC2a, MLC2v, MYH6, and MYH7 (Table 4) (9, 34, 35). Acquired data was analyzed with FlowJo Version 7.6.2 (Treestar Software, Ashland, OR, USA).
Antibodies used for fluorescence activated cell sorting
| Primary antibody | Dilution | Category NO. | Company | 2nd antibody | Dilution | Category NO. | Company |
|---|---|---|---|---|---|---|---|
| Mouse anti-myosin light chain atrial isoform-APC | 1:600 | 311011AT1 | Synaptic systems | ||||
| Rabbit anti-myosin light chain ventricular isoform | 1:600 | 10906-1-AP | Proteintech | Goat anti-rabbit IgG-FITC | 1:800 | A32790 | Thermo Fisher |
| Mouse anti-cardiac troponin T-PE | 1:20 | 564767 | BD Biosciences | ||||
| Rabbit anti-troponin I3 (cardiac type) | 1:600 | ab-47003 | Abcam | Goat anti-rabbit IgG-FITC | 1:1000 | A32790 | Thermo Fisher |
| Rabbit anti-myosin Heavy Chain 6 | 1:600 | 22281-1-AP | Proteintech | Goat anti-rabbit IgG-FITC | 1:1000 | A32790 | Thermo Fisher |
| Rabbit anti-myosin Heavy Chain 7 | 1:600 | MAB90961 | Millipore | Goat anti-mouse IgG-FITC | 1:1000 | A32790 | Thermo Fisher |
Quantatitive RT-PCR
To determine gene expression level of hiPSC-CM after AA treatment, hiPSC-CMs were collected to quantify gene expression levels of of contractile proteins. The isolation of total RNA and cDNA synthesis were carried out as previously described (36, 37). The quantitative PCR thermal cycling program for 40 cycles was: 1 cycle of enzyme activation at 95 oC for 2 min, denaturation at 95 oC for 5 s, annealing at 60 oC for 20 seconds (27). The primers are listed in Table 5.
qRT-PCR primers
| Gene Name | Forward | Reverse | Amplication size (bp) |
|---|---|---|---|
| GAPDH | TCGACAGTCAGCCGCATCTTCTTT | ACCAAATCCGTTGACTCCGACCTT | 94 |
| cTnT | GGAGAGAGAGTGGACTTTGATG | CCTCCTCTTTCTTCCTGTTCTC | 109 |
| TNNI3 | GACAAGGTGGATGAAGAGAGATAC | CTTGCCTCGAAGGTCAAAGA | 102 |
| TNNI1 | CTTTAGGGCGTGGGTCTTATC | TCTGTTCCCATTCATGTGTCTC | 101 |
| MYH6 | CACCAACAATCCCTACGACTAC | AGCACGTCAAAGGCACTATC | 108 |
| MYH7 | CTCGCCAGAATGGAGTACAAA | CTTCATCCAGGGCCAATTCT | 108 |
| MLC2a | CGTGGTTCTTCCAACGTCTT | CCATCACGATTCTGGTCGATAC | 92 |
| MYL2v | CCCATTTATCCACCTCCATCTT | TACACGACCTCCTGTTTATTGG | 118 |
| SLN | CTTGGTGTGCCCTCAGAAAT | CCTCACAAGGAGCCACATAAG | 133 |
Western Blot analysis
To determine protein expression level of hiPSC-CM after AA treatment, total protein of hiPSC-CMs was isolated using PhosphoSafe™ Extraction Reagent (Merck, Germany) and protein concentration was determined using Bradford reagent (Bio-Rad Laboratories, USA) as per instruction (7, 8, 37). Western Blot analysis of protein samples were performed as described previously (7, 8, 37). Proteins were separated on SDS-polyacrylamide gel and were transferred onto nitrocellulose membranes. After blocking with 5% non-fat milk in Tris-buffered saline Tween-20 buffer (25 mM Tris, pH 7.5, 150 mM NaCl, and 0.1% Tween-20), the blots were incubated with primary and corresponding secondary antibodies as listed in Table 6. The binding of the specific antibody was detected using the SuperSignal Chemiluminescent Substrate kit (Pierce, USA) and visualized by ChemiDoc™ XRS+ System (Bio-Rad, USA). The protein expression level was normalized by GAPDH and expressed as percentage of GAPDH (7, 8, 37).
Antibodies used in Western Blot analysis
| Primary antibody | Dilution | Category NO. | Company | 2nd antibody | Dilution | Company |
|---|---|---|---|---|---|---|
| Rabbit anti-myosin light chain ventricular isoform | 1:500 | 10906-1-AP | Proteintech | Goat anti-rabbit-IgG-HRP | 1:4000 | Cell signaling |
| Rabbit anti-troponin I3 (cardiac type) | 1:1000 | ab-47003 | Abcam | Goat anti-rabbit-IgG-HRP | 1:4000 | Cell signaling |
| Mouse-anti-myosin Heavy Chain 7 | 1:200 | MAB1548 | Millipore | Goat anti-mouse-IgG-HRP | 1:4000 | Cell signaling |
| Mouse anti-SERCA2a | 1:1000 | SC-376235 | Santa Cruz | Goat anti-mouse-IgG-HRP | 1:4000 | Cell signaling |
| Mouse anti-RyR | 1:200 | SC-376507 | Santa Cruz | Goat anti-mouse-IgG-HRP | 1:1000 | Cell signaling |
| Rabbit anti-Kir2.1 | 1:500 | AB5374 | Millipore | Goat anti-rabbit-IgG-HRP | 1:2000 | Cell signaling |
| Mouse Nav1.5 | 1:100 | sc-81631 | Santa Cruz | Goat anti-mouse-IgG-HRP | 1:1000 | Cell signaling |
| Mouse-Cav1.2 | 1:400 | sc-398433 | Santa Cruz | Goat anti-mouse-IgG-HRP | 1:2000 | Cell signaling |
| Mouse anti-MFN1 | 1:500 | sc-166644 | Santa Cruz | Goat anti-mouse-IgG-HRP | 1:4000 | Cell signaling |
| Mouse anti-MFN2 | 1:500 | sc-100560 | Santa Cruz | Goat anti-mouse-IgG-HRP | 1:4000 | Cell signaling |
| Mouse anti-Fis1 | 1:500 | sc-376469 | Santa Cruz | Goat anti-mouse-IgG-HRP | 1:4000 | Cell signaling |
| Rabbit anti-GAPDH | 1:5000 | 2118S | Cell signaling | Goat anti-rabbit-IgG-HRP | 1:5000 | Cell signaling |
| Mouse anti-TET1 | 1:200 | sc-293186 | Santa Cruz | Goat anti-mouse-IgG-HRP | 1:1000 | Cell signaling |
| Rabbit anti-TET2 | 1:200 | GTX124205 | Gene Tex | Goat anti-rabbit-IgG-HRP | 1:2000 | Cell signaling |
| Rabbit anti-IRX4 | 1:500 | 104135-T34 | Sino Biological | Goat anti-rabbit-IgG-HRP | 1:4000 | Cell signaling |
Mitochondrial staining
To determine mitochondrial membrane potential, mitochondrial staining was performed as described previously (28, 29). Briefly, hiPSC-CMs were cultured in 12-well plates and stained with mitochondria staining buffer using a Mitochondria Staining Kit (CS0390-1KT, Sigma, USA) for 30 min. The cells were washed with DPBS and visualized using an Olympus IX73 microscope and Cell Sens Standard software (Olympus, Japan). Images were taken at the same exposure time (50 milliseconds). For quantification of fluorescence intensity, ImageJ software was used to convert each fluorescent image into an 8-bit grayscale image, and quantitatively detected the average fluorescence intensity of each cell (29).
DNA dot blot analysis of 5-hydroxymethylcytosine (5-hmC)
To determine whether AA promoted MLC2v protein expression through DNA demethylation, Bobcat339, a selective and potent inhibitor of ten-eleven translocation (TET) methylcytosine dioxygenases, was used to inhibit DNA demethylation through inhibiting TET1 and TET2 activities. Bobcat339 was added 30 min before AA was added into cell culture medium. DNA dot blot analysis of 5-hmC, an oxidized product of TET1/TET2, was performed. DNA was isolated using QIAamp DNA Mini Kit (Cat.No. 51304) and was denatured in 0.2 M NaOH at 95 for 10 min. The solution was neutralized with 0.1 volume of 6.6 M ammonium acetate on ice for 1 min. DNA samples were spotted on Nitrocellulose membrane (Bio-Rad, USA), air-dried, washed in 2 x SSC buffer for 5 min, and air-dried at 80
 for 5min. After UV cross-linking for 5 min at 125 uJ / cm2, the membrane was blocked using 5% milk in TBST at room temperature for 1.5 h. Then, membrane was incubated with 1:2000 dilution of mouse anti-5-hmC antibody (MA5-23525, Invitrogen) in 5% milk in TBST at 4
  overnight. On the second day, the membrane was washed in 0.1% TBST buffer for 3 times and incubated in 5% milk TBST buffer containing 1:4000 dilution of goat anti-mouse IgG secondary antibody (NEF 822001 EA, Perkin Elmer) conjugated HRP for 1 h at room temperature. Then, membrane was washed in 0.1% TBST buffer for 4 times. The binding of the specific antibody was detected using the SuperSignal Chemiluminescent Substrate kit (Pierce, USA) and visualized by ChemiDoc™ XRS+ System (Bio-Rad, USA).
Acylcarnitine profile measurement
To determine whether AA treatment will improve fatty acid oxidation-based metabolism, metabolomic study was performed as described previously (29). Briefly, hiPSC-CMs were washed with ice-cold PBS and were scraped off plates in ice-cold deionized water containing 0.6% formic acid. The solution was vortexed at 4oC to ensure cells were lysed. A sample of the lysate was set aside for protein determination. An equal volume of 100% acetonitrile was then added to the lysate. The lysates were then processed for determination of acyl-carnitine profile as previously described (38).
Electrophysiology study
To determine electrophysiological properties, D30C or AA treated PCBC-CMs and DP3-CMs had electrophysiology studies to determine atrial-like or ventricular-like hiPSC-CMs phenotype as described (39). Briefly, whole-cell recording of action potentials was performed in spontaneously beating hiPSC-CMs using the current-clamp mode with an Axopatch 700B amplifier (Molecular Devices). The extracellular solution contained (in mM): NaCl 137, KCl 5.4, MgCl2 1, NaH2PO4 0.33, HEPES 10, glucose 10, CaCl2 1.8, and pH adjusted to 7.4 with NaOH. The pipette (3-5 MΩ) solution contained (in mM): potassium gluconate 123, NaCl 9, MgCl2 1.8, EGTA 0.9, HEPES 9, phosphocreatine 14, MgATP 4, and pH adjusted to 7.2 with KOH. The action potential durations after 80% repolarization (APD80) were analysed using pClamp 10 software (Molecular Devices, USA).
Statistical analysis
Statistical analysis was performed using SPSS (version 18.0). All data were presented as mean ± standard deviation (SD). Comparisons among groups were analyzed for significance via one-way analysis of variance (ANOVA) with the Tukey correction. The numbers of ventricular-like hiPSC-CM and atrial-like hiPSC-CM in the D30C and AA treated cells were calculated based on action potential and weighted. As the total number was greater than 40 and no group had expected number less than 5, Pearson's chi-squared test was used. P < 0.05 was considered as statistical significance.
Results
Using PCBC-CMs as cell models, sarcomeric proteins (MLC2v, TNNI3, and MYH7) and ion channel proteins (Kir2.1, Nav1.5, Cav1.2, SERCA2a, and RyR), mitochondrial membrane potential and biogenesis, metabolomics, and action potential were assessed. To understand potential signaling pathways, Bobcat339, a selective and potent inhibitor of DNA demethylation, was used to determine whether AA promoted hiPSC-CM maturation through modulating DNA demethylation. To exclude the effect from non-CM, we used purified hiPSC-CMs in all experiments. The lactate acid treatment purified hiPSC-CM from 83.8% to 95.2% based on cTnT protein expression assessed by FACS (Figure S2).
AA promoted MLC2v gene and protein expression in PCBC-CMs
We first determined the dose dependent effect of AA on MLC2v gene expression. AA at 150 μM concentration induced the highest MLC2v gene expression level (Figure S3). Thus, 150 μM AA concentration was used in all the experiments.
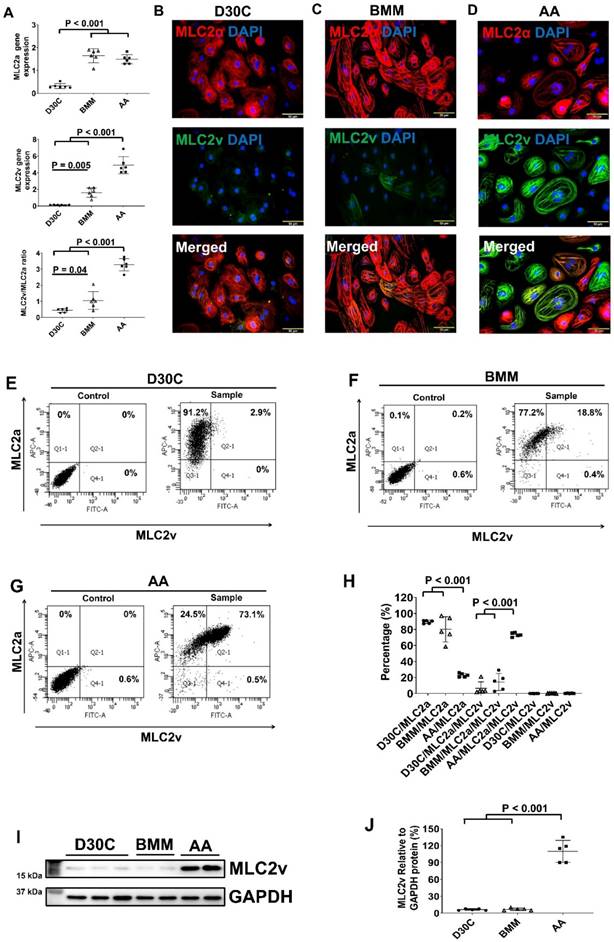
Both BMM and AA treatments significantly increased MLC2a and MLC2v gene expression levels in PCBC-CMs as compared with D30C cells (Figure 1A). However, only AA induced the highest MLC2v gene expression level which was significantly higher than BMM treated cells. This resulted in the largest MLC2v : MLC2a ratio (3.28 ± 0.39), which is significantly higher than either D30C (0.43 ± 0.12, p < 0.001) or BMM treated (1.05 ± 0.55, p < 0.001) PCBC-CMs. Fluorescence immunostaining, FACS analysis, and Western Blot confirmed that AA promoted abundant MLC2v protein expression in PCBC-CMs (Figure 1B-J). The percentage of PCBC-CMs expressing only MLC2a significantly reduced, while cells expressing both MLC2a and MLC2V significantly increased and were higher than those of D30C and BMM treated cells (Figure 1H, p < 0.001 for all).
Characterization of MLC2a and MLC2v gene and protein expression in PCBC-CMs. (A) Gene expression levels of MLC2a and MLC2v in D30C, BMM, or AA treated PCBC-CMs. Fluorescence immunostaining of D30C (B), BMM (C), or AA treated (D) PCBC-CMs for MLC2a and MLC2v protein expressions. Representative flow cytometry results of D30C (E), BMM (F), or AA treated (G) PCBC-CMs for MLC2a, MLC2a/MLC2v, and MLC2v protein expressions and quantification (H). Western Blot analysis of D30C, BMM, or AA treated PCBC-CMs for MLC2v protein expression (I) and quantification (J). (n = 6 each for panel A and n = 5 each for panels H & J. Values are presented as the means ± SD. One-way ANOVA). (Bar = 50 μm).
AA promoted TNNI3 protein expression in PCBC-CMs
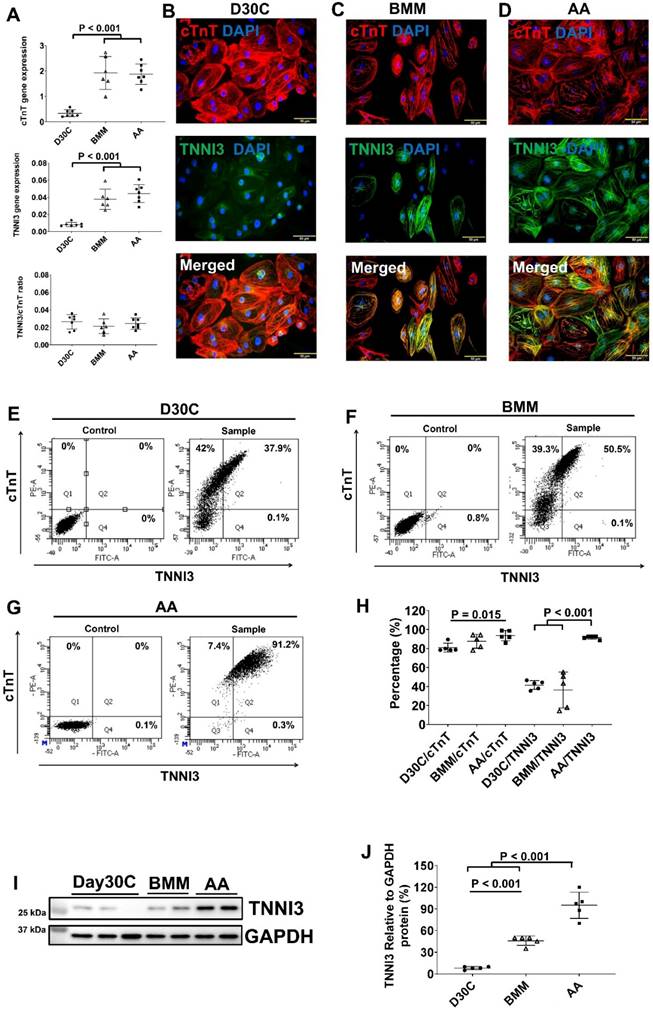
Both BMM and AA significantly increased TNNI1 and TNNI3 gene expressions and no difference was observed between BMM and AA treatments (Figure 2A and Figure S4). The ratio of TNNI3:TNNI1 was the highest in the AA treated cells. Fluorescence immunostaining showed abundant TNNI3 protein expression in AA treated PCBC-CMs (Figure 2B-D). FACS analysis and Western Blot confirmed that AA promoted TNNI3 protein expression in CMs. About 91.4 ± 1.7% of PCBC-CMs expressed TNNI3 after AA treatment, which was significantly higher than D30C or BMM treated PCBC-CMs (p < 0.001 for both).
Characterization of cTnT and TNNI3 gene and protein expression in PCBC-CMs. (A) Gene expression levels of cTnT and TNNI3 in D30C, BMM, or AA treated PCBC-CMs. Fluorescence immunostaining of D30C (B), BMM (C), or AA treated (D) PCBC-CMs for cTnT and TNNI3 protein expressions. Representative flow cytometry images of D30C (E), BMM (F), or AA treated (G) PCBC-CMs for cTnT and TNNI3 protein expressions and quantification (H). Western Blot analysis of D30C, BMM, or AA treated PCBC-CMs for TNNI3 protein expression (I) and quantification (J). (n = 6 or 7 each for panel A and n = 5 each for panels H & J. Values are presented as the means ± SD. One-way ANOVA). (Bar = 50 μm).
AA promoted MHY7 gene and protein expression in PCBC-CMs
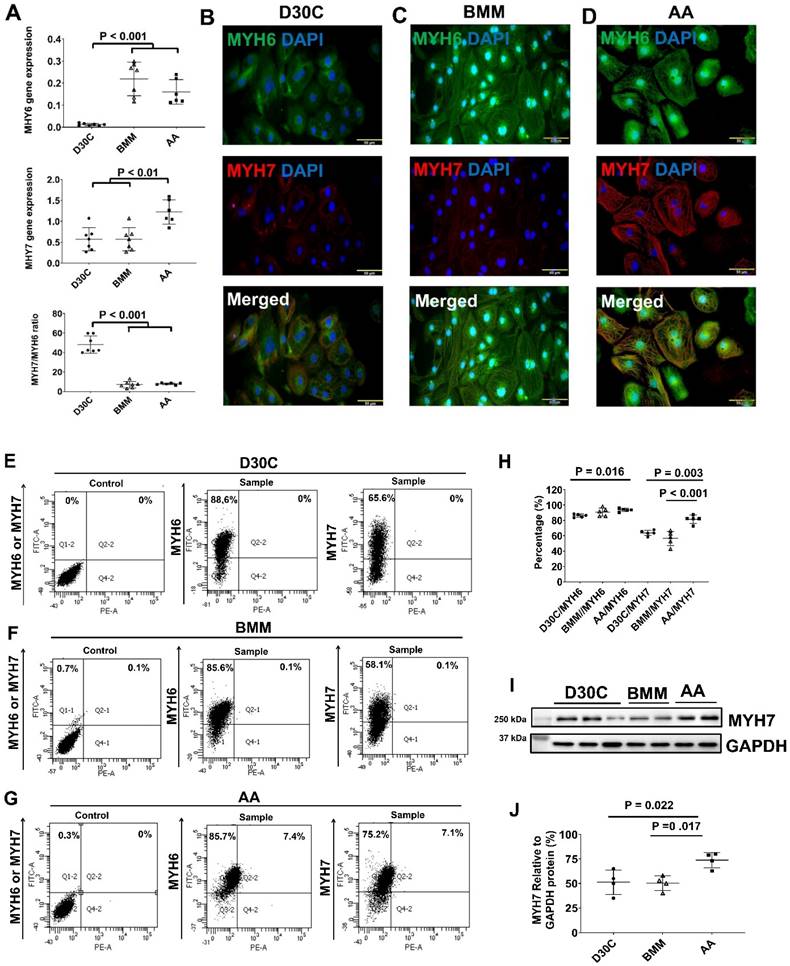
Both BMM and AA significantly increased MYH6 gene expression (Figure 3A). However, only AA significantly increased MYH7 gene expression as compared with D30C and BMM treated PCBC-CMs (Figure 3A). The ratio of MYH7:NYH6 was the highest in D30C cells (48.2 ± 8.8) which was significantly higher than BMM (7.0 ± 3.3) or AA (7.9 ± 1.0) treated PCBC-CMs (p < 0.001, for both). Fluorescence immunostaining, FACS analysis, and Western Blot confirmed that AA promoted abundant MYH7 protein expression in PCBC-CMs (Figure 3B-J). About 81.5 ± 5.4% of PCBC-CMs expressed MYH7 after AA treatment, which was significantly higher than those in D30C (p = 0.003) and BMM treated cells (p < 0.001).
Characterization of MYH6 and MYH7 gene and protein expressions in PCBC-CMs. (A) Gene expression levels of MYH6 and MYH7 in D30C, BMM, or AA treated PCBC-CMs. Fluorescence immunostaining of D30C (B), BMM (C), or AA treated (D) PCBC-CMs for MYH6 and MYH7 protein expressions. Representative flow cytometry images of D30C (E), BMM (F), or AA treated (G) PCBC-CMs for MYH6 and MYH7 protein expressions and quantification (H). Western Blot analysis of D30C, BMM, or AA treated PCBC-CMs for MYH7 protein expression (I) and quantification (J). (K) Fluorescence immunostaining of D30C, BMM, or AA treated PCBC-CMs for IRX4 and cTnT protein expressions. (L) Western Blot of D30C, BMM, or AA treated PCBC-CMs for IRX4 protein expression. (n = 6 or 7 each for panel A, n = 5 each for panel H and n = 4 each for panels J and L). Values are presented as the means ± SD. One-way ANOVA). (Bar = 50 μm).
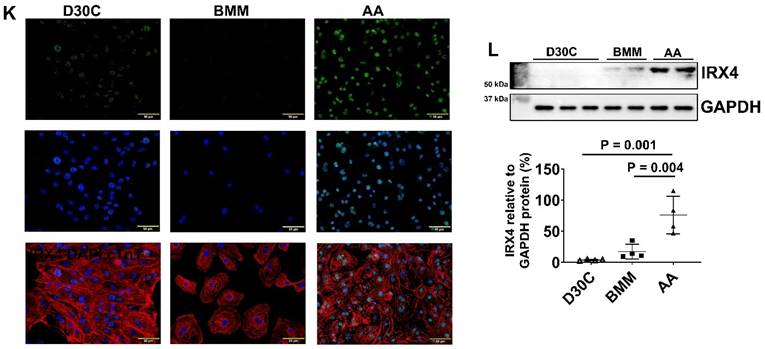
AA promoted IRX4 protein expression in PCBC-CMs
Fluorescence immunostaining and Western Blot showed that the protein expression of IRX4, a ventricular marker for CMs, was up-regulated in PCBC-CMs after AA treatment (Figure 3K) and Western Blot (Figure 3L). This indicates that AA promotes IRX4 expression.
AA promoted RyR and Cav1.2 protein expression
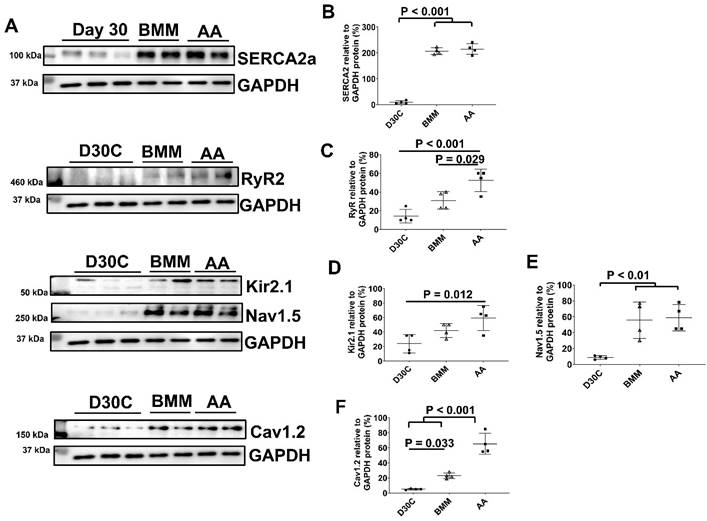
The ion channel protein expression levels of D30C, BMM, and AA treated PCBC-CMs were determined using Western Blot (Figure 4). Both BMM and AA treatments significantly increased SERCA2a, Nav1.5, and Cav1.2 protein expression levels as compared with D30C PCBC-CMs. AA treatment significantly increased RyR2 (p = 0.029) and Cav1.2 (p < 0.001) protein expression levels as compared with BMM treatment (Figure 4C & F).
Western Blot analysis for ion channel protein expression. (A) Protein expression levels of SERCA2a, RyR2, Kir2.1, Nav1.5, and Cav1.2 in D30C, BMM, or AA treated PCBC-CMs. Quantification of SERCA2a (B), RyR2 (C), Kir2.1 (D), Nav1.5 (E), and Cav1.2 (F) protein expressions in D30C, BMM, or AA treated PCBC-CMs. (n = 4 each). Values are presented as the means ± SD. One-way ANOVA).
Both BMM and AA treatment increased mitochondrial membrane potential and mass in PCBC-CMs
JC-1 staining of hiPSC-CMs showed that the majority of mitochondria located in the perinuclear region in D30C PCBC-CMs, while they were evenly distributed in the cytoplasm of BMM and AA treated PCBC-CMs (Figure 5A). Fluorescence intensity, an indicator of mitochondrial membrane potential and mass, of each CM was significantly high in both BMM and AA treated cells as compared with D30C cells (Figure 5B). Although there is a trend of higher fluorescence intensity in AA treated cells, no significant difference was observed between BMM and AA treated cells.
Mitochondrial membrane potential and metabolism of PCBC-CMs. (A) JC-1 staining to show mitochondrial membrane potential. (B) Quantification of fluorescence intensity based on JC-1 staining. (C) Western Blot analysis for protein expressions of MFN1, MFN2, and FIS1. Quantification of MFN1 (D), MFN2 (E), and FIS1 (F) protein expressions in D30C, BMM, or AA treated PCBC-CMs. Metabolism of C3 + C5 (G) and C16 + C18:1 (H) in D30C, BMM or AA treated PCBC-CMs. (n = 9 - 14 for panel B, n = 4 each for panels D - F, n = 5 - 6 each for panels G & H. Values are presented as the means ± SD. One-way ANOVA). (Bar = 50 μm).
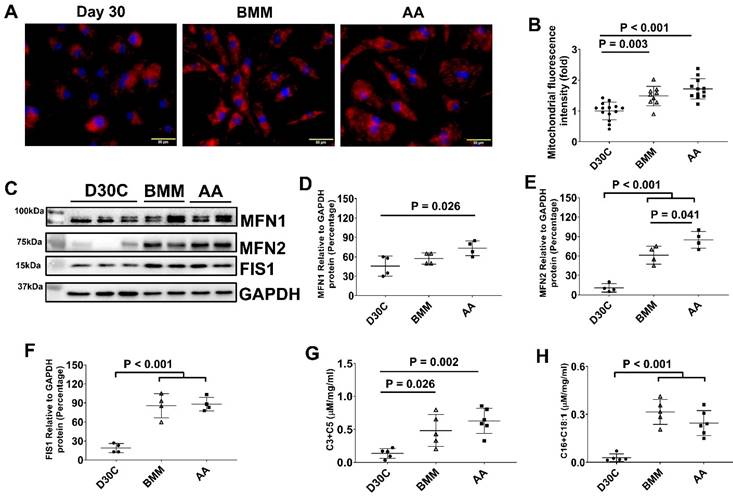
As mitochondrial biogenesis is determined by a dynamic equilibrium between organelle fusion and fission, the protein expression level of MFN1, MFN2, and FIS1 were determined using Western Blot. As shown in Figure 5C-F, both BMM and AA significantly increased MNF2 and FIS1 protein expression as compared with D30C cells. In addition, AA treatment resulted in further increased MFN2 protein expression as compared with BMM treated cells, suggesting that AA may promote mitochondrial biogenesis.
Regardless of AA, BMM treatment increased amino acid and fatty acid metabolisms in PCBC-CMs
We measured acylcarnitines, which are representatives of mitochondrial fuel metabolism, in hiPSC-CMs. The C3 and C5 acylcarnitines, which are derived from catabolism of branched-chain amino acids, increased significantly in both BMM and AA treated cells. C16 and C18:1 acylcarnitines, which are derived from catabolism of long-chain fatty acid fuels, were increased in BMM and AA treated cells as compared with D30C cells (Figure 5G & H). The acylcarnitine results indicate that increased catabolism of amino acid and fatty acid fuels in both BMM and AA treated PCBC-CMs.
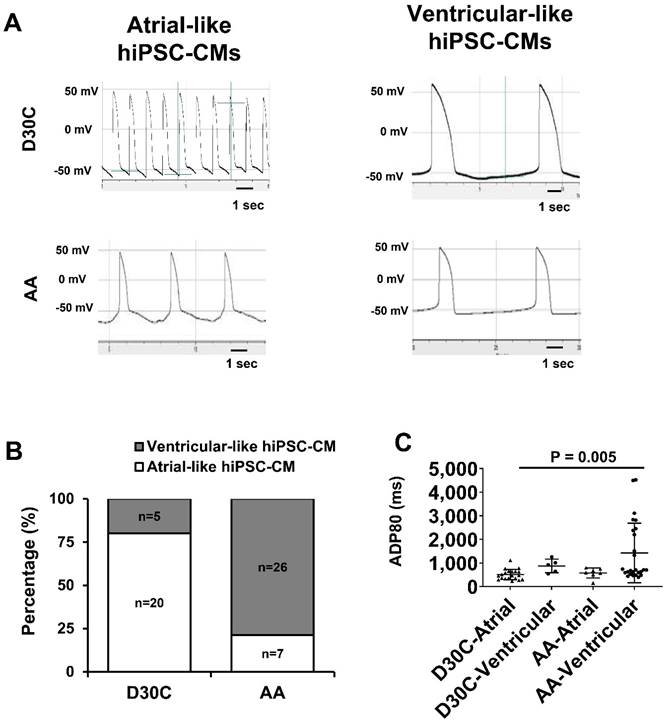
AA promoted PCBC-CMs to adapt to ventricular-like CM electrophysiology profile
Considering that AA prominently promoted MLC2v protein expression, patch clamp was used to determine whether AA treated PCBC-CMs would acquire ventricular CM action potential profile. Patch clamp studies demonstrated that 80% of D30C PCBC-CMs showed atrial-like action potential and only 20% of them showed ventricular-like action potential (Figure 6A & B). One the contrary, AA treatment significantly increased ventricular-like CM to 78.8% (p < 0.001), suggesting that AA promoted conversion of atrial-like CMs into ventricular-like CMs. Although the longest ADP80 was in AA treated ventricular-like-PCBC-CMs, it was only significantly longer than D30C atrial-like CMs.
Patch clamp analysis of D30C and AA treated PCBC-CMs. (A) Action potential of atrial- or ventricular-like cells in D30C or AA treated PCBC-CMs. (B) Percentage of atrial or ventricular-like cells in D30C or AA treated PCBC-CMs based on action potential. (C) ADP80 of atrial or ventricular-like cells in D30C or AA treated PCBC-CMs. (n = 20 for D30C-Atrial, n = 5 for D30C-Ventricular, n = 7 for AA-Atrial, and n = 26 for AA-Ventricular). Values are presented as the means ± SD. Pearson's chi-squared test or One -way ANOVA).
AA promoted MLC2v, TNNI3, MYH7, and IRX4 protein expressions in D60C PCBC-CMs
Considering that D30C may not have subtype-specification completed, D60C PCBC-CMs were assessed. Both fluorescence immunostaining and FACS analysis showed that AA promoted abundant MLC2v protein expression in D60C-AA cells (Figure 7A-C). The cells expressing only MLC2a significantly reduced, while the cells expressing both MLC2a and MLC2V significantly increased and were higher than those of D60C and BMM treated cells (Figure 7C, p < 0.001 for all).
Characterization of MLC2a, MLC2v, cTnT, TNNI3, MYH6, MYH7, and IRX4 protein expressions in D60C, BMM, or AA treated PCBC-CMs. PCBC-CMs were maintained up to D60C, purified, and cultured in BMM (D60C-BMM) or BMM supplemented with AA (D60C-AA) for 14 days. Fluorescence immunostaining (A), flow cytometry analysis (B), and quantification (C) of D60C, BMM, or AA treated PCBC-CMs for MLC2a and MLC2v protein expressions. Fluorescence immunostaining (D), flow cytometry analysis (E), and quantification (F) of D60C, BMM, or AA treated PCBC-CMs for cTnT and TNNI3 protein expressions. Fluorescence immunostaining (G), flow cytometry analysis (H), and quantification (I) of D60C, BMM, or AA treated PCBC-CMs for MYH6 and MYH7 protein expressions. (J) Fluorescence immunostaining of D60C, BMM, or AA treated PCBC-CMs for IRX4 and cTnT protein expressions. (n = 5 each). Values are presented as the means ± SD. One-way ANOVA). (Bar = 50 μm).
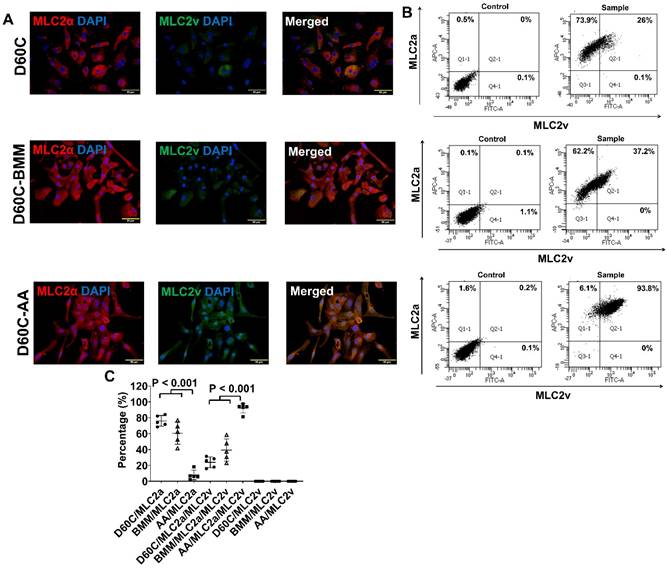
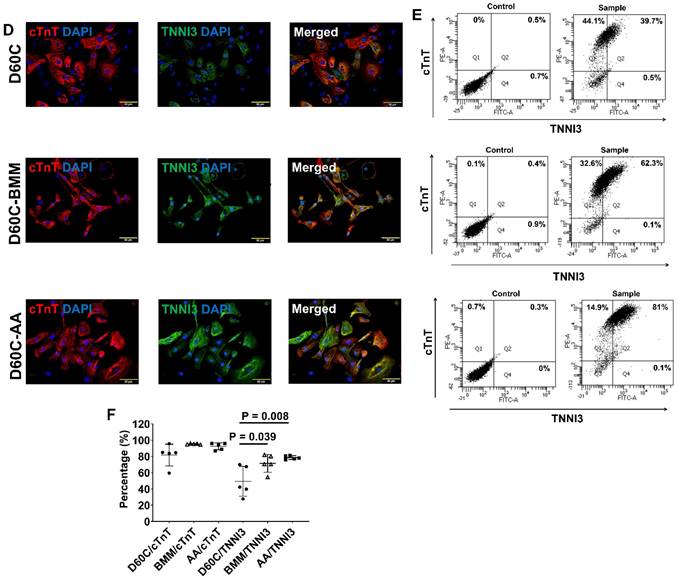
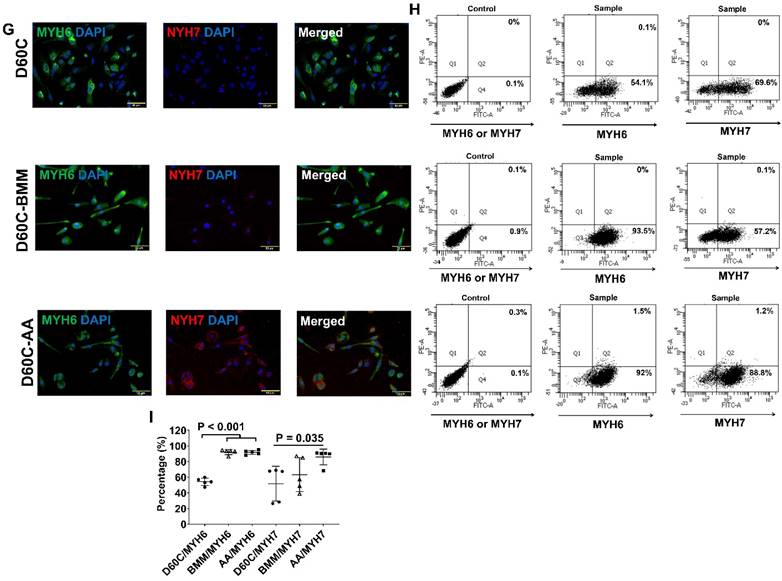
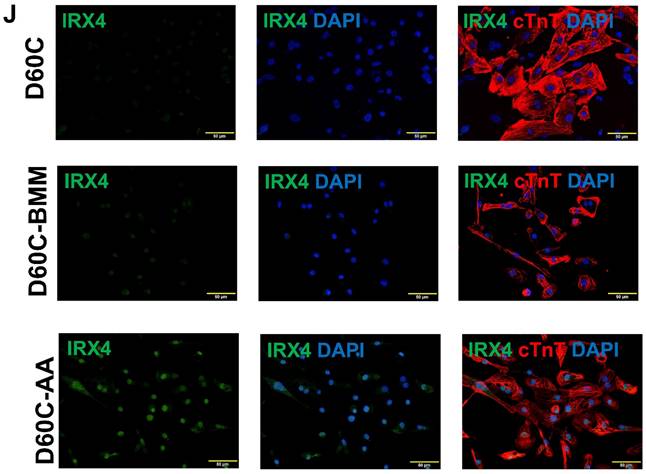
Furthermore, both fluorescence immunostaining and FACS analysis showed although AA promoted TNNI3 and MYH7 protein expressions, they were only significantly higher than that of D60C PCBC-CMs (Figure 7D-I). Fluorescence immunostaining showed that IRX4 protein expression was the strongest in AA treated PCBC-CMs (Figure 7J).
AA promoted MLC2v, TNNI3, MYH7, and IRX4 protein expressions in RA induced atrial-like PCBC-CMs
To determine the effect of AA on atrial-like hiPSC-CM, RA was supplemented in differentiation days 3-7 to induce atrial-like PCBC-CMs. Fluorescence immunostaining and FACS analysis showed that AA was able to promote MLC2v protein expression in RA induced atrial-like PCBC-CMs (Figure 8A-C). Similarly, the cells expressing only MLC2a significantly reduced, while the cells expressing both MLC2a and MLC2V significantly increased and were higher than those of RA-D30C or RA-BMM treated cells (Figure 8C, p < 0.001 for all).
Characterization of MLC2a, MLC2v, cTnT, TNNI3, MYH6, MYH7, and IRX4 protein expressions in retinoic acid induced atrial-like PCBC-CMs. Retinoic acid (RA) was supplemented into hiPSC differentiation medium on days 3-7 to derive atrial-like PCBC-CMs. Cells were maintained up to D30C (RA-D30C), purified, and cultured in BMM (RA-BMM), or BMM supplemented with AA (RA-AA) for 14 days. Fluorescence immunostaining (A), flow cytometry analysis (B), and quantification (C) of D30C, BMM, or AA treated celsl for MLC2a and MLC2v protein expressions. Fluorescence immunostaining (D), flow cytometry analysis (E), and quantification (F) of D30C, BMM, or AA treated cells for cTnT and TNNI3 protein expressions. Fluorescence immunostaining (G), flow cytometry analysis (H), and quantification (I) of D30C, BMM, or AA treated cells for MYH6 and MYH7 protein expressions. (J) Fluorescence immunostaining of D30C, BMM, or AA treated cells for IRX4 and cTnT protein expressions. (n = 5 each). Values are presented as the means ± SD. One-way ANOVA). (Bar = 50 μm).
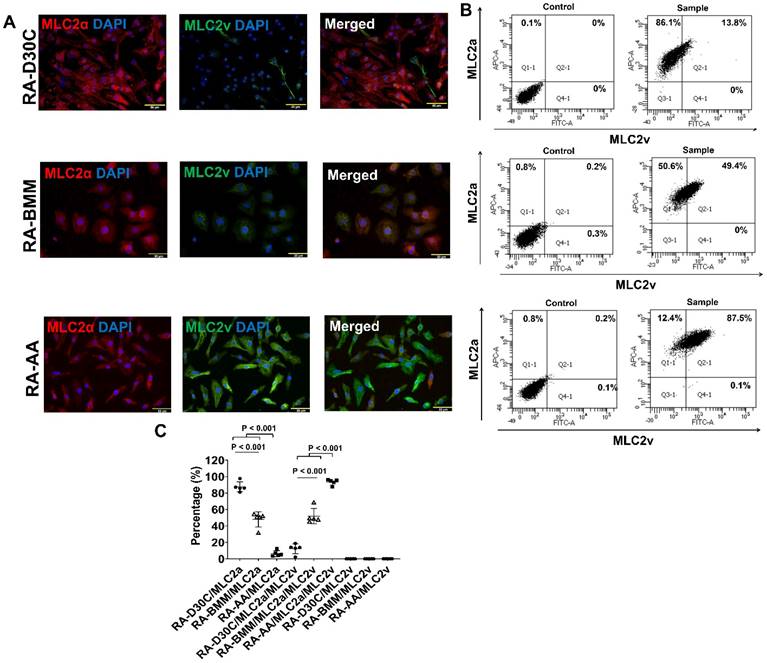
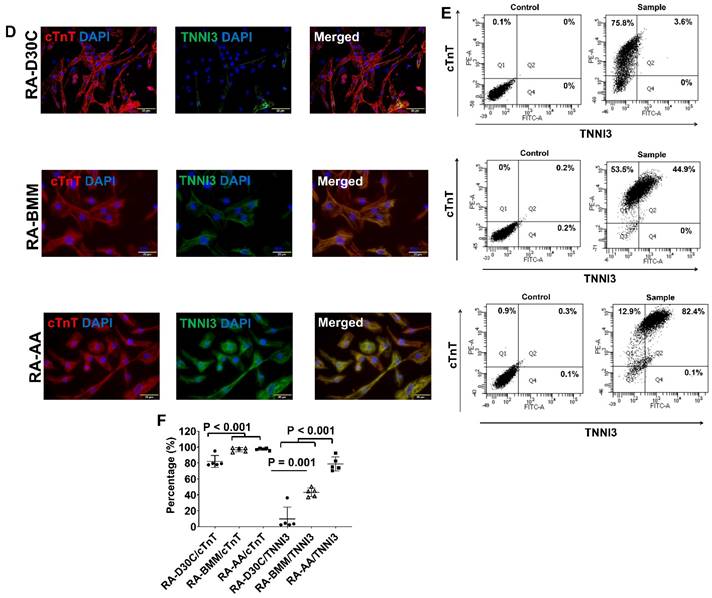
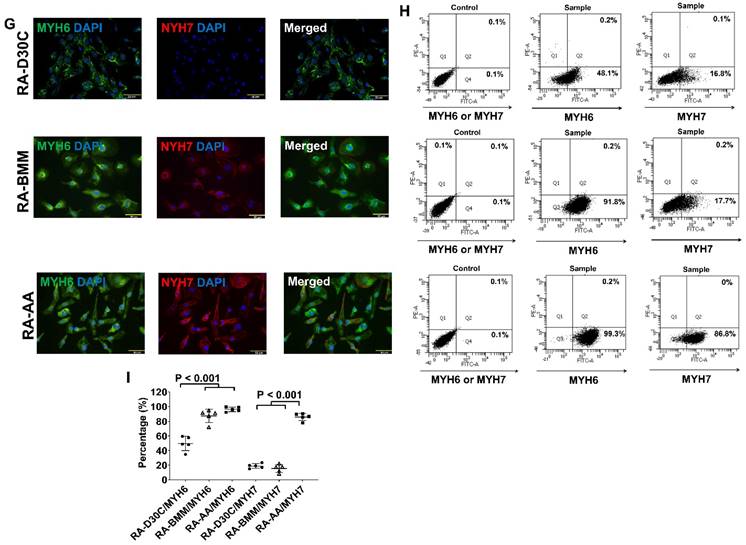
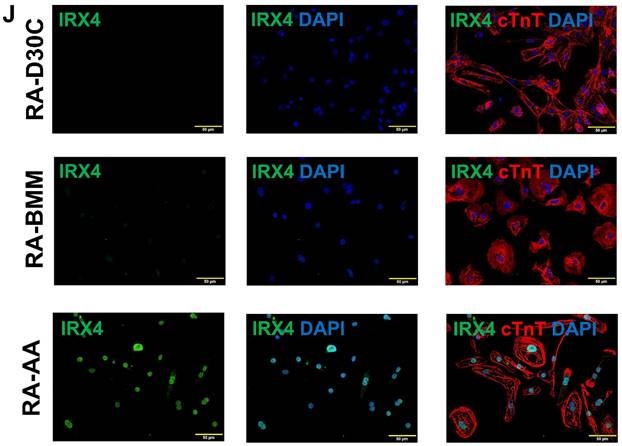
Furthermore, both fluorescence immunostaining and FACS analysis showed that AA also promoted TNNI3 and MYH7 protein expressions which were significantly higher than those of RA-D30C and RA-BMM treated PCBC-CMs (Figure 8D-I). Fluorescence immunostaining showed that IRX4 protein expression was the strongest in AA treated RA-AA cells (Figure 8J).
AA promoted MLC2v protein expressions in MLC2v-CMs
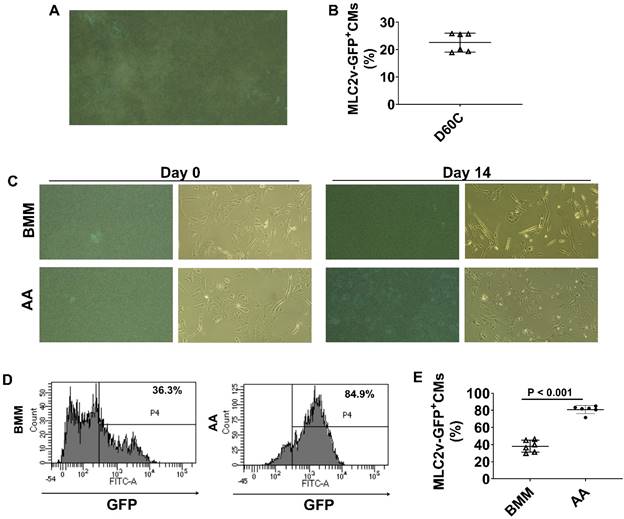
To further confirm the findings, we employed a transgenic reporter hiPSC line, MLC2v-mEGFP hiPSC which has GFP-tagged MLC2v gene, to monitor GFP expression. MLC2v-CMs were cultured up to D60C (Figure 9A and videos 1 & 2) and FACS analysis showed that about 22.6% MLC2v-CMs expressed GFP (Figure 9B). When MLC2v-CMs were cultured in BMM only or BMM supplemented with AA, the GFP expressing MLC2v-CMs only slightly increased to 38% in BMM treated cells, while it significantly increased to 80.8% in AA treated cells (Figure 9C-E).
Monitoring MLC2v protein expression using MLC2v-mEGFP hiPSC line. (A) A representative image of GFP expressing MLC2v-hiPSC-CMs. (B) The mean percentage of MLC2v-CMs expressing GFP on D60C. (C) Representative fluorescence and corresponding phase contrast images of MLC2v-CMs on days 0 and 14 after BMM or AA treatment. (D) Representative flow cytometry images for determining GFP expressing in MLC2v-CMs. (E) The mean percentage of MLC2v-CMs expressing GFP. (n = 6 each). Values are presented as the means ± SD. Independent T-test).
Bobcat339 reduced MLC2v, TNNI3, MYH7, and IRX4 protein expressions in AA treated PCBC-CMs
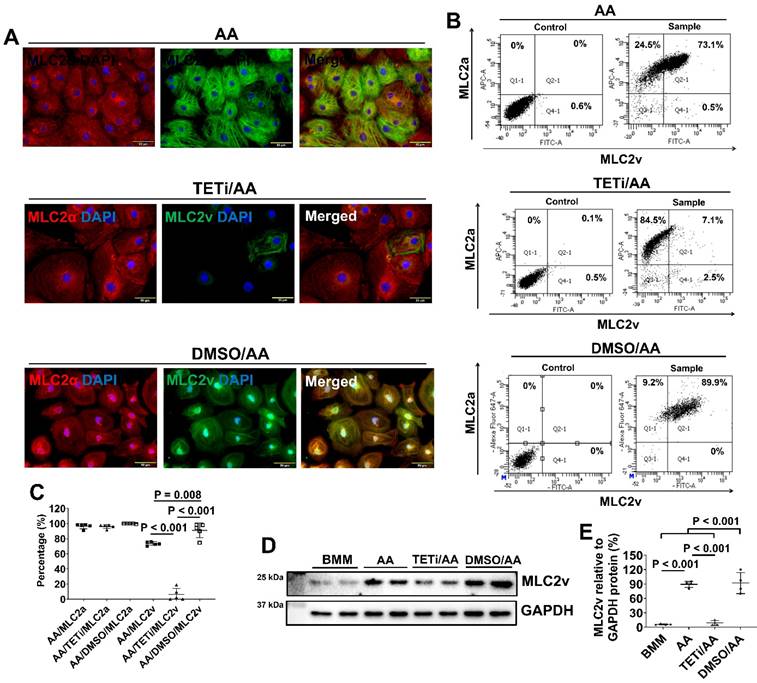
To investigate whether AA promoted MLC2v protein expression through DNA demethylation (40), PCBC-CMs were pretreated with Bobcat339, an inhibitor for TET enzyme in DNA demethylation, before AA treatment. Pretreatment with DMSO was used as a vehicle control. Fluorescence immunostaining showed that Bobcat339 substantially and significantly reduced MLC2v protein expression, while DMSO did not inhibit (Figure 10A). This was confirmed by FACS analysis showing that the MLC2v+ PCBC-CMs were reduced from 73.5 ± 2.5% (AA treatment) to 6.3 ± 8.1% (TETi/AA treatment), while it was 91.0 ± 9.8% after DMSO treatment (Figure 10B & C). Western Blot showed that Bobcat339 significantly reduced MLC2v protein expression after AA treatment, while DMSO had no inhibitory effect (Figure 10D & E).
The effect of Bobcat339 on the MLC2a and MLC2v protein expressions in PCBC-CMs. (A) Fluorescence immunostaining of AA, TETi/AA, or DMSO/AA treated PCBC-CMs for MLC2a and MLC2v protein expressions. Flow cytometry analysis of AA, TETi/AA, or DMSO/AA treated PCBC-CMs for MLC2a and MLC2v protein expressions (B) and quantification (C). Western Blot analysis of BMM, AA, TETi/AA, or DMSO/AA treated PCBC-CMs for MLC2v protein expression (D) and quantification (E). (n = 5 each for panel C and n = 4 each for panel E. Values are presented as the means ± SD. One-way ANOVA). (Bar = 50 μm).
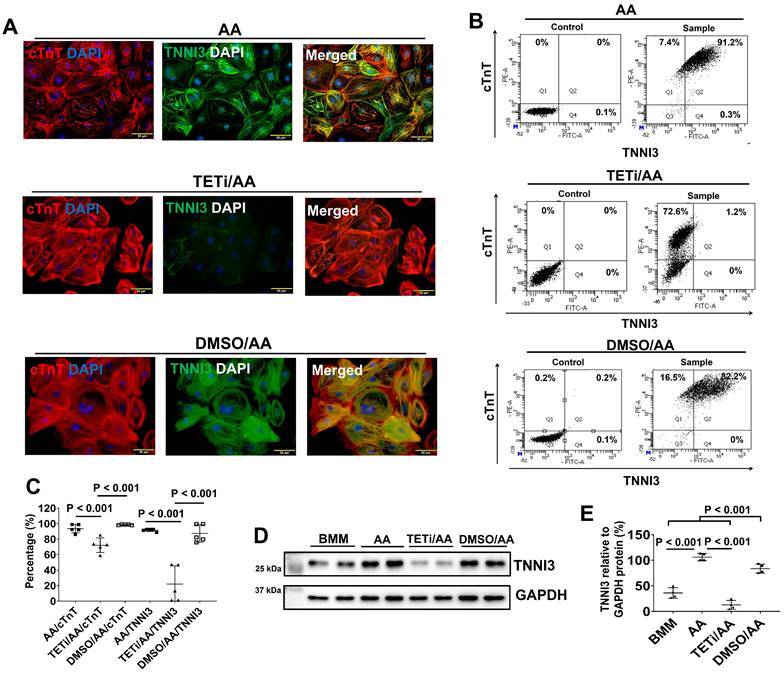
Fluorescence immunostaining also showed that Bobcat339 significantly reduced TNNI3 protein expression in PCBC-CMs (Figure 11). FACS analysis confirmed that Bobcat339 significantly reduced both cTnT and TNNI3 protein expression in PCBC-CMs. More substantially, TNNI3+ hiPSC-CMs were reduced from 91.4 ± 1.7% (AA treatment) to 21.9 ± 23.4% (TETi/AA treatment), while it was 87.2 ± 11.3% after DMSO treatment (Figure 11B & C). Western Blot further confirmed that Bobcat339 significantly reduced TNNI3 protein expression (Figure 11D & E).
The effect of Bobcat339 on the cTnT and TNNI3 protein expressions in PCBC-CMs. (A) Fluorescence immunostaining of AA, TETi/AA, or DMSO/AA treated PCBC-CMs for cTnT and TNNI3 protein expressions. Flow cytometry analysis of AA, TETi/AA, or DMSO/AA treated PCBC-CMs for cTnT and TNNI3 protein expressions (B) and quantification (C). Western Blot analysis of BMM, AA, TETi/AA, or DMSO/AA treated PCBC-CMs for TNNI3 protein expression (D) and quantification (E). (n = 5 each for panel C and n = 4 each for panel E. Values are presented as the means ± SD. One-way ANOVA). (Bar = 50 μm).
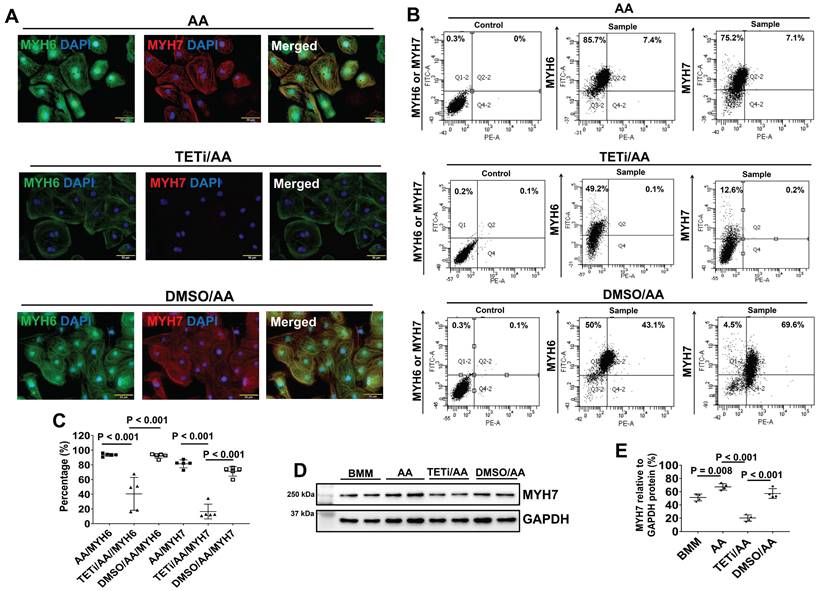
Furthermore, fluorescence immunostaining showed that Bobcat339 also significantly reduced MYH6 and MYH7 protein expression levels in PCBC-CMs (Figure 12A). FACS analysis also showed that Bobcat339 significantly reduced both MYH6 and MYH7 protein expressions in hiPSC-CMs. MYH7+PCBC-CMs reduced from 81.5 ± 5.4% (AA treatment) to 16.5 ± 10.1% (TETi/AA treatment), while it was 71.1 ± 6.5% after DMSO treatment (Figure 12B & C). Western Blot further confirmed that Bobcat339 significantly reduced MYH7 protein expression (Figure 12D & E).
The effect of Bobcat339 on the MYH6 and MYH7 protein expressions in PCBC-CMs. (A) Fluorescence immunostaining of AA, TETi/AA, or DMSO/AA treated PCBC-CMs for MYH6 and MYH7 protein expressions. Flow cytometry analysis of AA, TETi/AA, or DMSO/AA treated PCBC-CMs for MYH6 and MYH7 protein expressions (B) and quantification (C). Western Blot analysis of BMM, AA, TETi/AA, or DMSO/AA treated PCBC-CMs for MYH7 protein expression (D) and quantification (E). (n = 5 each for panel C and n = 4 each for panel E. Values are presented as the means ± SD. One-way ANOVA). (Bar = 50 μm).
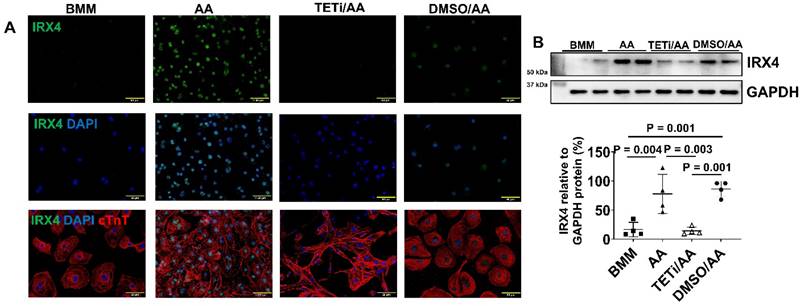
Fluorescence immunostaining and Western Blot showed that Bobcat339 also substantially reduced IRX4 protein expression in AA treated PCBC-CMs (Figure 13A & B), suggesting that AA mediated MLC2v protein expression may also involve IRX4 induction.
The effect of Bobcat339 on IRX4 protein expression in PCBC-CMs. Fluorescence immunostaining (A) and Western Blot analysis (B) of D30C, AA, TETi/AA, and DMSO/AA treated PCBC-CMs for IRX4 and cTnT protein expressions. (n = 4 each). Values are presented as the means ± SD. One-way ANOVA). (Bar = 50 μm).
Bobcat339 inhibited SERCA2a protein expression in hiPSC-CMs after AA treatment
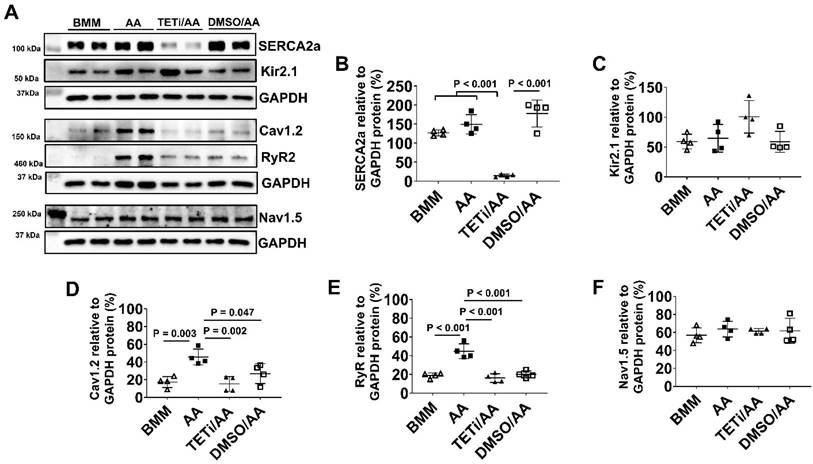
Western Blot showed that Bobcat339 significantly reduced SECA2a, Cav1.2, and RyR protein expression in PCBC-CMs, while it had no inhibitory effect on Kir2.1 and Nav1.5 protein expression (Figure 14). However, DMSO treatment also significantly reduced Cav1.2 and RyR protein expression, indicating that DMSO may have inhibitory effect on them which is independent of Bobcat339. Thus, the reduced Cav1.2 and RyR protein expressions after Bobcat339 treatment is at least partially due to DMSO.
The effect of Bobcat339 on the ion channel protein expressions in PCBC-CMs. (A) Protein expression levels of SERCA2a, RyR2, Kir2.1, Nav1.5, and Cav1.2 in BMM, AA, TETi/AA, or DMSO/AA treated PCBC-CMs. Quantification of SERCA2a (B), Kir2.1 (C), Cav1.2 (D), Ryr2 (E), and Nav1.5 (F) protein expressions in BMM, AA, TETi/AA, or DMSO/AA treated PCBC-CMs. (n = 4 each). Values are presented as the means ± SD. One-way ANOVA). (Bar = 50 μm).
Bobcat339 decreased MFN-1 and increased FIS-1 protein expression in PCBC-CMs after AA treatment
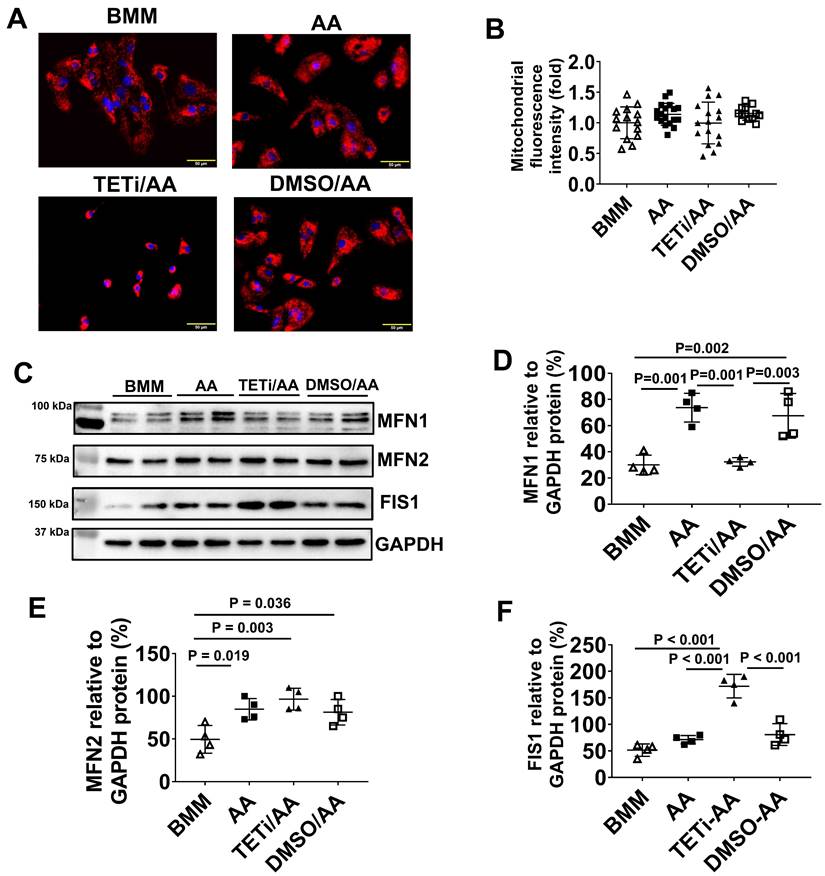
JC-1 staining showed that although Bobcat339 did not significantly reduce mitochondrial mass and membrane potential based on fluorescence intensity, it caused mitochondria to cluster perinuclearly in PCBC-CMs (Figure 15A & B). Western Blot showed that Bobcat339 significantly reduced MFN1 and increased FIS1 protein expression in PCBC-CM, while it had no effect on MFN2 protein expression (Figure 15C - F). These results indicate that mitochondrial fission is enhanced after DNA demethylation is inhibited.
The effect of Bobcat339 on the mitochondrial membrane potential in PCBC-CMs. (A) JC-1 staining to show mitochondrial membrane potential. (B) Quantification of fluorescence intensity based on JC-1 staining. (C) Western Blot analysis for protein expressions of MFN1, MFN2, and FIS1. Quantification of MFN1 (D), MFN2 (E), and FIS1 (F) protein expressions in BMM, AA, TETi/AA, or DMSO/AA treated PCBC-CMs. (n = 14 - 18 for panel B and n = 4 each for panels D - F. Values are presented as the means ± SD. One-way ANOVA). (Bar = 50 μm).
Bobcat339 inhibited DNA demethylation induced by AA through inhibiting TET1 and TET2 protein expression
As Bobcat339 is an inhibitor of TET1 and TET2, Western Blot was performed to assess whether Bobcat339 could inhibit TET1 and TET2 protein expressions. Pretreatment with Bobcat339 inhibited TET1 and TET2 protein expressions induced by AA (Figure 16A-C). DMSO did not inhibit TET1 and TET2 protein expression. In fact, DMSO significantly increased TET2 protein expression as compared with AA treatment.
The effect of Bobcat339 on TET1 and TET2 protein expression in PCBC-CMs. (A) Protein expressions of TET1 and TET2 in BMM, AA, TETi/AA, or DMSO/AA treated PCBC-CMs. Quantification of TET1 (B) and TET2 (C) protein expressions. DNA dot plot analysis (D) and quantification (E) for 5-hmC expression in BMM, AA, TETi/AA, or DMSO/AA treated PCBC-CMs. (n = 3 - 4 for panels B & C and n = 4 each for panel E). Values are presented as the means ± SD. One-way ANOVA). (Bar = 50 μm).
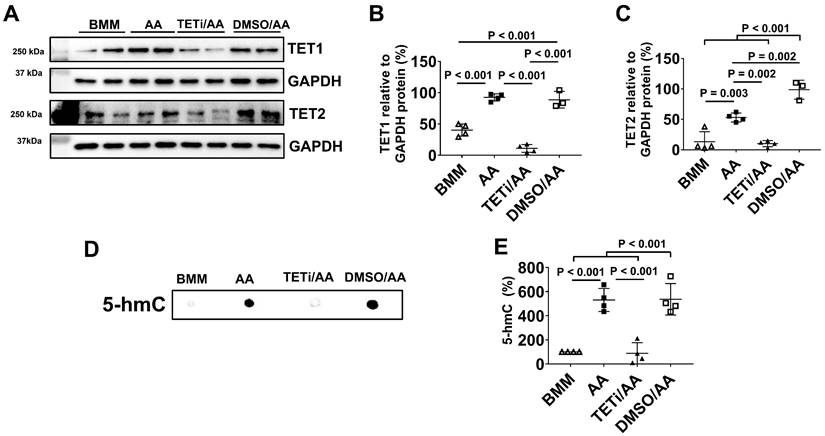
As 5-hmC is the first oxidative product of the 5-methylcytosine (5-mC) demethylation by TET oxidization, DNA dot plot was employed to determine 5-hmC content in DNA of PCBC-CMs (Figure 16D). DNA dot plot showed that AA significantly up-regulated 5-hmC product which was inhibited by Bobcat339 and DMSO had no inhibitory effect on 5-hmC product (Figure 16D & E). These results suggest that AA may act through TET1/TET2 to promote DNA demethylation of PCBC-CMs which then helps convert atrial-like hiPSC-CMs to ventricular-like hiPSC-CMs in vitro.
AA increased MLC2v protein expression, mitochondrial membrane potential and mass, and promoted ventricular-like CMs in DP3-CMs
To determine whether the effect of AA on inducing MLC2v expression and promoting ventricular-like hiPSC-CMs is limited on PCBC-CMs, AA was applied to a disease hiPSC line. DP3-hiPSC is a disease hiPSC line which was reprogrammed from dermal fibroblasts of patients with type 2 diabetes (28, 29). Similar to the results with PCBC-CM, AA significantly increased MLC2v protein expression in DP3-CMs (Figure S5). Both fluorescence immunostaining and FACS analysis showed that AA promoted abundant MLC2v protein expression in DP3-CMs. About 86.7 ± 4.3% of DP3-CMs expressed MLC2v after AA treatment, which was significantly higher than those in D30C or BMM treated cells (p < 0.001 for both).
Both fluorescence immunostaining and FACS analysis showed that BMM or AA treatment significantly increased TNNI3 protein expression as compared with D30C DP3-CMs (Figure S6). Although there is a trend of increased TNNI3 protein expression, AA did not further significantly increase TNNI3 protein expression as compared with BMM treatment.
Both BMM and AA treatment significantly increased MYH7 protein expression as compared with D30C DP3-CMs as shown by fluorescence immunostaining and FACS analysis (Figure S7). AA further significantly increase MYH7 protein expression as compared with BMM treated cells as determined by FACS analysis.
JC-1 staining showed that although both BMM and AA treated DP3-CMs had significantly increased fluorescence intensity as compared with D30C cells, AA treatment resulted in the highest fluorescence intensity which was significantly higher than BMM treated DP3-CMs. Mitochondria were evenly distributed in the cytoplasm of BMM or AA treated DP3-CMs (Figure S8).
Metabolomic profiling showed that BMM treatment increased C16 and C18:1 acylcarnitine content in DP3-CMs. However, AA significantly increased both C3 and C5 as well as C16 and C18:1 acylcarnitine content in DP3-CMs as compared with D30C cells (Figure S8E & F).
Patch clamp studies showed that 72.4% of D30C DP3-CMs had atrial-like action potential and only 27.6% of them showed ventricular-like action potential. AA treatment significantly increased ventricular-like DP3-CMs to 87.5% (p < 0.001, Figure S9A & B). The longest ADP80 was found in AA treated ventricular-like DP3-CMs which was significantly longer than D30C atrial-like cells (p = 0.007) or AA treated atrial-like cells (p = 0.001) (Figure S9C).
When Bobcat339 was applied to DP3-CMs before AA treatment, both fluorescence immunostaining and FACS analysis showed that Bobcat339 only significantly reduced MLC2v protein expression in DP3-CMs treated with AA (Figure S10A, B, and M). The MLC2v+ DP3-CMs significantly reduced from 86.7 ± 4.3% (AA treatment) to 14.1 ± 18% (TETi/AA treatment). Although, there are trends of reduced TNNI3 and MYH7 protein expression in DP3-CMs after Bobcat339 treatment, no significant difference was found between AA and TETi/AA treatments (Figure S10B-F, N, and O). DMSO had no inhibitory effect on MLC2v, TNNI3, and MYH7 protein expression in DP3-CMs (Figure S10G-L, N, and O). In fact, it enhanced TNNI3 protein expression in DP3-CMs.
DNA dot plot of DP3-CMs showed that AA significantly up-regulated 5-hmC product which was inhibited by Bobcat339, while DMSO did not inhibit 5-hmC product (Figure S11). This confirms the same finding for PCBC-CMs.
Discussion
In the present study, we showed that AA induced MLC2v protein expression promoted ventricular-like CMs in hiPSC-CMs through DNA demethylation. When DNA demethylation was inhibited by Bobcat339, MLC2v protein expression was dramatically reduced, indicating that AA induced DNA demethylation is at least partially involved in promoting MLC2v protein expression.
hiPSCs, like embryonic stem cells (ESCs), have the ability to proliferate indefinitely yet retain the ability to differentiate into any cell of the body including CMs. Validated protocols for the reliable and high efficiency differentiation of hiPSCs and hESCs into CMs has not only opened the doors for hiPSC-CMs transfer therapy (7, 8), but also can serve as disease models for novel drug development.
The newly differentiated hiPSC-CMs are dominantly expressing MLC2a and immature. Although both the matrix sandwich protocol (2) and GiWi small molecule protocol (30) can efficiently differentiate hiPSCs into CMs, the derived hiPSC-CMs had only about 20% on day-30 or < 30% on day-40 expressed MLC2v, respectively. We and others have documented similar findings and the percentage of hPSC-CM expressing MLC2v protein was between 13-36% (7, 8, 41). Immature hPSC-CMs seem to be more proarrhythmic than mature cells (42). Thus, transfer of immature hPSC-CMs for myocardial repair may result in mismatched electrophysiology with the adult host's cardiac system, resulting in arrhythmias (43). The maturity of CMs is critical during drug development. Genotypically and phenotypically matured hPSC-CMs are needed for cost-effective screening and discovering drugs (44, 45).
Long-term culture (12, 13), drug selection, metabolism (16, 17), mechanical stimulus (46, 47), tissue engineering (14, 15), electrical stimulus (48), microRNA (49), cell-cell interaction (15), growth hormones (50, 51), and modulation of signaling pathways, such as mTOR (52) and WNT (53), have been shown to more or less efficiently promote maturation of hPSC-CMs. In the current study, we showed that AA, which is also called vitamin C and is an essential nutrient, promoted MLC2v protein expression in hiPSC-CMs. We systematically examined cell phenotype, including contractile protein expression, electrophysiology, and metabolism, between AA treated and non-treated hiPSC-CMs.
Firstly, we examined protein expression levels of MLC2v, TNNI3, and MYH7, which are predominantly expressed in mature or adult ventricular CMs (10, 54). AA promoted MLC2v protein expression in PCBC-CMs, DP3-CMs, MLC2v-CMs, and even in RA induced atrial PCBC-CMs. The higher abundance of sarcomeric protein expressions are expected to enhance contractility in AA treated hiPSC-CMs. However, we did not measure the single hiPSC-CM or engineered cardiac tissues, which is a limitation of this study.
Secondly, we determined ion channel protein expression levels. AA promoted RyR and Cav1.2 ion channel protein expression, but did not change the protein expression levels of SERCA2a (mediates Ca2+ reuptake into the sarcoplasmic reticulum), Kir2.1 (potassium channel), Nav1.5 (a sodium channel subunit). Ryanodine receptors (RyRs) are intracellular calcium channels that are responsible for the release of Ca2+ from the sarco/endoplasmic reticulum while Cav1.2 is a subunit of L-type voltage-dependent calcium channel that mediates the influx of calcium ions into the CMs. Both proteins are involved in excitation-contraction of CMs.
Thirdly, we looked at mitochondrial membrane potential and mass. JC-1 staining showed that AA increased mitochondrial membrane potential and mass as indicated by higher fluorescence intensity and Western Blot analysis showed increased MFN2 protein expression, suggesting increased biogenesis. Then, we examined acylcarnitine profile and found that both BMM and AA significantly increase branched-chain amino acid (C3+C5) and fatty acid (C16+C18:1) metabolism. However, no difference was found between BMM and AA treated CMs. The significantly increased catabolism of branched-chain amino acids and long-chain fatty acids could be due to the lack of glucose in BMM, which forced hiPSC-CMs to use amino acids and fatty acids as fuels for metabolism. These data suggest that although AA promoted mitochondrial activity and biogenesis, it probably has no effect on branched-chain amino acid and fatty acid metabolism.
Next, we examined the electrophysiological characteristics of AA treated and non-treated PCBC-CMs and DP3-CMs. Initially only 20% and 27.6% of the D30C PCBC-CMs and DP3-CM, showed ventricular-like action potential. A 2-week AA treatment significantly increased the frequency of cells displaying ventricular-like action potential to 78.8% and 86.4%, respectively. Although the ventricular-like hiPSC-CMs in both cell lines appeared to have longer ADP80s, they were only longer than that of atrial-like hiPSC-CMs and had no difference compared with D30C ventricular-like hiPSC-CMs. These data suggest that although AA promoted the conversion of atrial-like hiPSC-CMs to ventricular-like hiPSC-CM, it does not improve electrophysiological maturation after 2-week's AA treatment.
Lastly, we explored the underlying mechanism through which AA promoted MLC2v protein expression. We found that AA promoted TET1 and TET2 protein expression, while Bobcat339, a potent and selective cytosine-based inhibitor of TET1 and TET2 enzymes, inhibited MLC2v protein expression in both PCBC-CMs and DP3-CMs after AA treatment. Bobcat339 inhibited not only 5-hmC, an oxidized product of TET1/TET2 activity, but also inhibited TNNI3, MYH7, SERCA2a, Cav1.2, RyR2, and MFN1, and increased FIS1 protein expressions in PCBC-CMs. These data suggest that AA promoted MLC2v protein expression at least partially through TET1/TET2 mediated DNA demethylation. Future studies are needed to explore how AA induces TET expression and the DNA methylation status upon AA or Bobcat339/AA treatment.
Interestingly, although DMSO, a solvent of Bobcat339, has no inhibitory effect on contractile protein expression, it can inhibit Cav1.2 and RyR protein expression. Thus, the reduced Cav1.2 and RyR protein expression in hiPSC-CMs could be due to either TETi, or DMSO, or both after treated with TETi and AA.
In the current study, 3 hiPSC lines were used. All cell line derived CMs had increased MLC2v protein expression in hiPSC-CMs. However, the disease cell line, DP3-CMs had different phenotypes as compared with PCBC-CMs in response to AA treatment. AA increased TNNI3 and MYH7 protein expression in PCBC-CMs, but it did not increase them in DP3-CMs. AA further increased mitochondrial membrane potential and mass in DP3-CM, but it did not increase them in PCBC-CMs. This may be due to the disease associated with DP3-CMs. Type 2 diabetes has dysregulated metabolism and altered mitochondrial function. AA treatment of DP3-CMs may help overcome diabetes-related defects in mitochondrial function and promote mitochondrial biogenesis.
In conclusion, we found that AA induced MLC2v protein expression and promoted ventricular-like CM subtype in hiPSC-CMs. AA promoted MLC2v protein expression is at least partially through DNA demethylation mediated by TET1/TET2. Using AA may be a cost-effective method to promote ventricular-like hiPSC-CMs.
Supplementary Material
Supplementary figures.
Supplementary video 1: contracting MLC2v-CMs on D60C.
Supplementary video 2: the same contracting MLC2v-CM area as Video-1 visualized under bright field.
Acknowledgements
This study was supported by CIRG15may018 and OFIRG16may039, National Medical Research Council of Singapore.
Competing Interests
The authors have declared that no competing interest exists.
References
1. Ye L, Zhang S, Greder L, Dutton J, Keirstead SA, Lepley M. et al. Effective cardiac myocyte differentiation of human induced pluripotent stem cells requires VEGF. PLoS One. 2013;8(1):e53764
2. Zhang J, Klos M, Wilson GF, Herman AM, Lian X, Raval KK. et al. Extracellular matrix promotes highly efficient cardiac differentiation of human pluripotent stem cells: the matrix sandwich method. Circ Res. 2012;111(9):1125-36
3. Lian X, Zhang J, Azarin SM, Zhu K, Hazeltine LB, Bao X. et al. Directed cardiomyocyte differentiation from human pluripotent stem cells by modulating Wnt/beta-catenin signaling under fully defined conditions. Nat Protoc. 2013;8(1):162-75
4. Ye L, Chang YH, Xiong Q, Zhang P, Zhang L, Somasundaram P. et al. Cardiac repair in a porcine model of acute myocardial infarction with human induced pluripotent stem cell-derived cardiovascular cells. Cell Stem Cell. 2014;15(6):750-61
5. Gao L, Gregorich ZR, Zhu W, Mattapally S, Oduk Y, Lou X. et al. Large Cardiac Muscle Patches Engineered From Human Induced-Pluripotent Stem Cell-Derived Cardiac Cells Improve Recovery From Myocardial Infarction in Swine. Circulation. 2018;137(16):1712-30
6. Zhu W, Zhao M, Mattapally S, Chen S, Zhang J. CCND2 Overexpression Enhances the Regenerative Potency of Human Induced Pluripotent Stem Cell-Derived Cardiomyocytes: Remuscularization of Injured Ventricle. Circ Res. 2018;122(1):88-96
7. Tan SH, Loo SJ, Gao Y, Tao ZH, Su LP, Wang CX. et al. Thymosin beta4 increases cardiac cell proliferation, cell engraftment, and the reparative potency of human induced-pluripotent stem cell-derived cardiomyocytes in a porcine model of acute myocardial infarction. Theranostics. 2021;11(16):7879-95
8. Tao Z, Loo S, Su L, Tan S, Tee G, Gan SU. et al. Angiopoietin-1 enhanced myocyte mitosis, engraftment, and the reparability of hiPSC-CMs for treatment of myocardial infarction. Cardiovasc Res. 2021;117(6):1578-91
9. Tan S, Tao Z, Loo S, Su L, Chen X, Ye L. Non-viral vector based gene transfection with human induced pluripotent stem cells derived cardiomyocytes. Sci Rep. 2019;9(1):14404
10. Tan SH, Ye L. Maturation of Pluripotent Stem Cell-Derived Cardiomyocytes: a Critical Step for Drug Development and Cell Therapy. J Cardiovasc Transl Res. 2018;11(5):375-92
11. Robertson C, Tran DD, George SC. Concise review: maturation phases of human pluripotent stem cell-derived cardiomyocytes. Stem Cells. 2013;31(5):829-37
12. Lundy SD, Zhu WZ, Regnier M, Laflamme MA. Structural and functional maturation of cardiomyocytes derived from human pluripotent stem cells. Stem Cells Dev. 2013;22(14):1991-2002
13. Kamakura T, Makiyama T, Sasaki K, Yoshida Y, Wuriyanghai Y, Chen J. et al. Ultrastructural maturation of human-induced pluripotent stem cell-derived cardiomyocytes in a long-term culture. Circ J. 2013;77(5):1307-14
14. Yu D, Wang X, Ye L. Cardiac Tissue Engineering for the Treatment of Myocardial Infarction. J Cardiovasc Dev Dis. 2021 8(11)
15. Kahn-Krell A, Pretorius D, Guragain B, Lou X, Wei Y, Zhang J. et al. A three-dimensional culture system for generating cardiac spheroids composed of cardiomyocytes, endothelial cells, smooth-muscle cells, and cardiac fibroblasts derived from human induced-pluripotent stem cells. Front Bioeng Biotechnol. 2022;10:908848
16. Correia C, Koshkin A, Duarte P, Hu D, Teixeira A, Domian I. et al. Distinct carbon sources affect structural and functional maturation of cardiomyocytes derived from human pluripotent stem cells. Sci Rep. 2017;7(1):8590
17. Yang X, Rodriguez ML, Leonard A, Sun L, Fischer KA, Wang Y. et al. Fatty Acids Enhance the Maturation of Cardiomyocytes Derived from Human Pluripotent Stem Cells. Stem Cell Reports. 2019;13(4):657-68
18. Parikh SS, Blackwell DJ, Gomez-Hurtado N, Frisk M, Wang L, Kim K. et al. Thyroid and Glucocorticoid Hormones Promote Functional T-Tubule Development in Human-Induced Pluripotent Stem Cell-Derived Cardiomyocytes. Circ Res. 2017;121(12):1323-30
19. Abbey D, Seshagiri PB. Ascorbic acid-mediated enhanced cardiomyocyte differentiation of mouse ES-cells involves interplay of DNA methylation and multiple-signals. Differentiation. 2017;96:1-14
20. Cao N, Liu Z, Chen Z, Wang J, Chen T, Zhao X. et al. Ascorbic acid enhances the cardiac differentiation of induced pluripotent stem cells through promoting the proliferation of cardiac progenitor cells. Cell Res. 2012;22(1):219-36
21. Ivanyuk D, Budash G, Zheng Y, Gaspar JA, Chaudhari U, Fatima A. et al. Ascorbic Acid-Induced Cardiac Differentiation of Murine Pluripotent Stem Cells: Transcriptional Profiling and Effect of a Small Molecule Synergist of Wnt/beta-Catenin Signaling Pathway. Cell Physiol Biochem. 2015;36(2):810-30
22. Takahashi T, Lord B, Schulze PC, Fryer RM, Sarang SS, Gullans SR. et al. Ascorbic acid enhances differentiation of embryonic stem cells into cardiac myocytes. Circulation. 2003;107(14):1912-6
23. Feyen DAM, McKeithan WL, Bruyneel AAN, Spiering S, Hormann L, Ulmer B. et al. Metabolic Maturation Media Improve Physiological Function of Human iPSC-Derived Cardiomyocytes. Cell Rep. 2020;32(3):107925
24. Burridge PW, Matsa E, Shukla P, Lin ZC, Churko JM, Ebert AD. et al. Chemically defined generation of human cardiomyocytes. Nat Methods. 2014;11(8):855-60
25. Cyganek L, Tiburcy M, Sekeres K, Gerstenberg K, Bohnenberger H, Lenz C. et al. Deep phenotyping of human induced pluripotent stem cell-derived atrial and ventricular cardiomyocytes. JCI Insight. 2018 3(12)
26. Ronaldson-Bouchard K, Yeager K, Teles D, Chen T, Ma S, Song L. et al. Engineering of human cardiac muscle electromechanically matured to an adult-like phenotype. Nat Protoc. 2019;14(10):2781-817
27. Su L, Kong X, Lim S, Loo S, Tan S, Poh K. et al. The prostaglandin H2 analog U-46619 improves the differentiation efficiency of human induced pluripotent stem cells into endothelial cells by activating both p38MAPK and ERK1/2 signaling pathways. Stem Cell Res Ther. 2018;9(1):313
28. Su L, Kong X, Loo S, Gao Y, Liu B, Su X. et al. Thymosin beta-4 improves endothelial function and reparative potency of diabetic endothelial cells differentiated from patient induced pluripotent stem cells. Stem Cell Research & Therapy. 2022;13(1):13
29. Su L, Kong X, Loo SJ, Gao Y, Kovalik JP, Su X. et al. Diabetic Endothelial Cells Differentiated From Patient iPSCs Show Dysregulated Glycine Homeostasis and Senescence Associated Phenotypes. Front Cell Dev Biol. 2021;9:667252
30. Lian X, Hsiao C, Wilson G, Zhu K, Hazeltine LB, Azarin SM. et al. Robust cardiomyocyte differentiation from human pluripotent stem cells via temporal modulation of canonical Wnt signaling. Proc Natl Acad Sci U S A. 2012;109(27):E1848-57
31. Devalla HD, Schwach V, Ford JW, Milnes JT, El-Haou S, Jackson C. et al. Atrial-like cardiomyocytes from human pluripotent stem cells are a robust preclinical model for assessing atrial-selective pharmacology. EMBO Mol Med. 2015;7(4):394-410
32. Schwach V, Cofino-Fabres C, Ten Den SA, Passier R. Improved Atrial Differentiation of Human Pluripotent Stem Cells by Activation of Retinoic Acid Receptor Alpha (RARalpha). J Pers Med. 2022 12(4)
33. Tohyama S, Hattori F, Sano M, Hishiki T, Nagahata Y, Matsuura T. et al. Distinct metabolic flow enables large-scale purification of mouse and human pluripotent stem cell-derived cardiomyocytes. Cell Stem Cell. 2013;12(1):127-37
34. Ye L, Haider H, Esa WB, Law PK, Zhang W, Su L. et al. Nonviral vector-based gene transfection of primary human skeletal myoblasts. Exp Biol Med (Maywood). 2007;232(11):1477-87
35. Ye L, Haider H, Tan R, Toh W, Law PK, Tan W. et al. Transplantation of nanoparticle transfected skeletal myoblasts overexpressing vascular endothelial growth factor-165 for cardiac repair. Circulation. 2007;116(11 Suppl):I113-20
36. Ye L, Zhang P, Duval S, Su L, Xiong Q, Zhang J. Thymosin beta4 increases the potency of transplanted mesenchymal stem cells for myocardial repair. Circulation. 2013;128(11 Suppl 1):S32-41
37. Ye L, Lee KO, Su LP, Toh WC, Haider HK, Law PK. et al. Skeletal myoblast transplantation for attenuation of hyperglycaemia, hyperinsulinaemia and glucose intolerance in a mouse model of type 2 diabetes mellitus. Diabetologia. 2009;52(9):1925-34
38. Teo E, Ravi S, Barardo D, Kim HS, Fong S, Cazenave-Gassiot A. et al. Metabolic stress is a primary pathogenic event in transgenic Caenorhabditis elegans expressing pan-neuronal human amyloid beta. Elife. 2019 8
39. Li G, Wang J, Liao P, Bartels P, Zhang H, Yu D. et al. Exclusion of alternative exon 33 of CaV1.2 calcium channels in heart is proarrhythmogenic. Proc Natl Acad Sci U S A. 2017;114(21):E4288-E95
40. Blaschke K, Ebata KT, Karimi MM, Zepeda-Martinez JA, Goyal P, Mahapatra S. et al. Vitamin C induces Tet-dependent DNA demethylation and a blastocyst-like state in ES cells. Nature. 2013;500(7461):222-6
41. Romagnuolo R, Masoudpour H, Porta-Sanchez A, Qiang B, Barry J, Laskary A. et al. Human Embryonic Stem Cell-Derived Cardiomyocytes Regenerate the Infarcted Pig Heart but Induce Ventricular Tachyarrhythmias. Stem Cell Reports. 2019;12(5):967-81
42. da Rocha AM, Campbell K, Mironov S, Jiang J, Mundada L, Guerrero-Serna G. et al. hiPSC-CM Monolayer Maturation State Determines Drug Responsiveness in High Throughput Pro-Arrhythmia Screen. Sci Rep. 2017;7(1):13834
43. Chen HS, Kim C, Mercola M. Electrophysiological challenges of cell-based myocardial repair. Circulation. 2009;120(24):2496-508
44. Colatsky T, Fermini B, Gintant G, Pierson JB, Sager P, Sekino Y. et al. The Comprehensive in Vitro Proarrhythmia Assay (CiPA) initiative - Update on progress. J Pharmacol Toxicol Methods. 2016;81:15-20
45. Sala L, Bellin M, Mummery CL. Integrating cardiomyocytes from human pluripotent stem cells in safety pharmacology: has the time come? Br J Pharmacol. 2017;174(21):3749-65
46. Yang H, Schmidt LP, Wang Z, Yang X, Shao Y, Borg TK. et al. Dynamic Myofibrillar Remodeling in Live Cardiomyocytes under Static Stretch. Sci Rep. 2016;6:20674
47. Ruan JL, Tulloch NL, Saiget M, Paige SL, Razumova MV, Regnier M. et al. Mechanical Stress Promotes Maturation of Human Myocardium From Pluripotent Stem Cell-Derived Progenitors. Stem Cells. 2015;33(7):2148-57
48. Radisic M, Park H, Shing H, Consi T, Schoen FJ, Langer R. et al. Functional assembly of engineered myocardium by electrical stimulation of cardiac myocytes cultured on scaffolds. Proc Natl Acad Sci U S A. 2004;101(52):18129-34
49. Kuppusamy KT, Jones DC, Sperber H, Madan A, Fischer KA, Rodriguez ML. et al. Let-7 family of microRNA is required for maturation and adult-like metabolism in stem cell-derived cardiomyocytes. Proc Natl Acad Sci U S A. 2015;112(21):E2785-94
50. Yang X, Rodriguez M, Pabon L, Fischer KA, Reinecke H, Regnier M. et al. Tri-iodo-l-thyronine promotes the maturation of human cardiomyocytes-derived from induced pluripotent stem cells. J Mol Cell Cardiol. 2014;72:296-304
51. Lee YK, Ng KM, Chan YC, Lai WH, Au KW, Ho CY. et al. Triiodothyronine promotes cardiac differentiation and maturation of embryonic stem cells via the classical genomic pathway. Mol Endocrinol. 2010;24(9):1728-36
52. Garbern JC, Helman A, Sereda R, Sarikhani M, Ahmed A, Escalante GO. et al. Inhibition of mTOR Signaling Enhances Maturation of Cardiomyocytes Derived From Human-Induced Pluripotent Stem Cells via p53-Induced Quiescence. Circulation. 2020;141(4):285-300
53. Tsoi C, Deng R, Kwok M, Yan B, Lee C, Li HS. et al. Temporal Control of the WNT Signaling Pathway During Cardiac Differentiation Impacts Upon the Maturation State of Human Pluripotent Stem Cell Derived Cardiomyocytes. Front Mol Biosci. 2022;9:714008
54. Bedada FB, Wheelwright M, Metzger JM. Maturation status of sarcomere structure and function in human iPSC-derived cardiac myocytes. Biochim Biophys Acta. 2016;1863(7 Pt B):1829-38
Author contact
![]() Corresponding author: Dr. Jun Pu, MD; Department of Cardiology, Ren Ji Hospital, School of Medicine, Shanghai Jiao Tong University, No 160 Pujian Road, Pudong New Area, 200127, Shanghai, China; e-mail: pujun310com. Lei Ye MD, PhD; National Heart Research Institute Singapore, National Heart Centre Singapore, Singapore. 169609, Singapore.
Corresponding author: Dr. Jun Pu, MD; Department of Cardiology, Ren Ji Hospital, School of Medicine, Shanghai Jiao Tong University, No 160 Pujian Road, Pudong New Area, 200127, Shanghai, China; e-mail: pujun310com. Lei Ye MD, PhD; National Heart Research Institute Singapore, National Heart Centre Singapore, Singapore. 169609, Singapore.