Impact Factor
- Issue 14; 2026
- Issue 13; 2026
- Issue 12; 2026
- Issue 11; 2026
- Issue 10; 2026
- Volume 16; 2026
- Advance Articles
- Past Issues
- Cover Images
- Cover Suggestion
- Index & Coverage
- Special Issues
Introduction
Results
Discussion
Conclusion
Materials and Methods
Abbreviations
Supplementary Material
Acknowledgements
References
International Journal of Biological Sciences
International Journal of Medical Sciences
 Global reach, higher impact

Theranostics 2023; 13(11):3550-3567. doi:10.7150/thno.82697 This issue Cite
Research Paper
Label-free optical metabolic imaging of adipose tissues for prediabetes diagnosis
Liping Chen1,2, Guihui Qin1,2, Yuhong Liu3, Moxin Li1,2, Yue Li1,2, Lun-Zhang Guo4, Lidong Du1,2, Weiming Zheng5, Pei-Chun Wu1,6, Yueh-Hsun Chuang7, Xiaoyan Wang1,2 ![]() , Tzung-Dau Wang8
, Tzung-Dau Wang8 ![]() , Ja-An Annie Ho6
, Ja-An Annie Ho6 ![]() , Tzu-Ming Liu1,2
, Tzu-Ming Liu1,2 ![]()
1. Institute of Translational Medicine, Faculty of Health Sciences, University of Macau, Macao SAR, China.
2. MOE Frontiers Science Center for Precision Oncology, University of Macau, Macao SAR, China.
3. School of Pharmaceutical Sciences, Guangzhou University of Chinese Medicine, Guangzhou, 510006, China.
4. Institute of Biomedical Engineering, National Taiwan University, Taipei 10617, Taiwan.
5. Translational Medicine R&D Center, Zhuhai UM Science and Technology Research Institute, Zhuhai, China.
6. Department of Biochemical Science & Technology, National Taiwan University, Taipei 10617, Taiwan.
7. Department of Anesthesiology, National Taiwan University Hospital and College of Medicine, Taipei 10002, Taiwan.
8. Cardiovascular Center and Division of Cardiology, Department of Internal Medicine, National Taiwan University Hospital and College of Medicine, Taipei 10002, Taiwan.
Received 2023-1-16; Accepted 2023-5-11; Published 2023-6-19
Abstract

Rationale: Prediabetes can be reversed through lifestyle intervention, but its main pathologic hallmark, insulin resistance (IR), cannot be detected as conveniently as blood glucose testing. In consequence, the diagnosis of prediabetes is often delayed until patients have hyperglycemia. Therefore, developing a less invasive diagnostic method for rapid IR evaluation will contribute to the prognosis of prediabetes. Adipose tissue is an endocrine organ that plays a crucial role in the development and progression of prediabetes. Label-free visualizing the prediabetic microenvironment of adipose tissues provides a less invasive alternative for the characterization of IR and inflammatory pathology.
Methods: Here, we successfully identified the differentiable features of prediabetic adipose tissues by employing the metabolic imaging of three endogenous fluorophores NAD(P)H, FAD, and lipofuscin-like pigments.
Results: We discovered that 1040-nm excited lipofuscin-like autofluorescence could mark the location of macrophages. This unique feature helps separate the metabolic fluorescence signals of macrophages from those of adipocytes. In prediabetes fat tissues with IR, we found only adipocytes exhibited a low redox ratio of metabolic fluorescence and high free NAD(P)H fraction a1. This differential signature disappears for mice who quit the high-fat diet or high-fat-high-sucrose diet and recover from IR. When mice have diabetic hyperglycemia and inflamed fat tissues, both adipocytes and macrophages possess this kind of metabolic change. As confirmed with RNA-seq analysis and histopathology evidence, the change in adipocyte's metabolic fluorescence could be an indicator or risk factor of prediabetic IR.
Conclusion: Our study provides an innovative approach to diagnosing prediabetes, which sheds light on the strategy for diabetes prevention.
Keywords: prediabetes, adipose tissue, redox ratio, NAD(P)H fluorescence lifetime, lipofuscin-like fluorescence
Introduction
Type 2 diabetes mellitus (T2DM) accounts for up to 90% of all diabetes cases [1]. By 2040, T2DM will affect around 642 million people worldwide, with an estimated health expenditure of 802 billion dollars [2]. Most diagnostic methods for T2DM are based on glycaemic measures (fasting or 2-h postprandial glucose, or HbA1C) [3]. Once the blood glucose test is abnormal, the patients have entered the diabetes stage, which requires lifelong management [4]. Identifying and reversing diabetes at its early stage is therefore crucial. Before glucose changes can be detectable, impaired insulin sensitivity has already been present for 10 years [5], and insulin resistance (IR) is an important hallmark for the diagnosis of prediabetes [6]. So far, the diagnostic methods for insulin sensitivity include the euglycemic insulin clamp (the gold standard) [7], the hyperglycemic clamp [7], the insulin suppression test [8], and tracer detection [9]. But these detection methods are either invasive or time-consuming, which is inconvenient for prediabetes screening and monitoring.
At the prediabetic stage, several metabolic imbalances are already established. Identifying these imbalances with adequate and precise biomarkers can facilitate early intervention. Adipose tissue is the critical organ for the onset of IR and inflammation [10, 11]. Overnutrition or obesity can cause excessive hypertrophy of adipocytes with decreased mitochondrial content and impaired mitochondrial biogenesis [12]. Mitochondrial dysfunction leads to IR through impairing adipogenesis, lipolysis, oxidative phosphorylation (OXPHOS), and increasing free-fatty acid [13]. Another critical player for adipose tissue inflammation is the activated macrophages. In diabetic rodents and individuals, approximately 90% of macrophages selectively infiltrate the site surrounding necrotic adipocytes, where they form crown-like structures (CLSs), phagocytose dead adipocytes, and actively produce pro-inflammatory cytokines [14]. These metabolic and histopathologic changes in adipose tissues provide an opportunity to detect prediabetes. Conventionally, histopathology assessment relies on invasive biopsy and cumbersome dye-staining processes. Some people use positron emission tomography-computed tomography (PET/CT) [15], or magnetic resonance imaging (MRI) [16] to monitor the physiopathologic change of adipose tissues. However, they possess several limitations, including radioactivity, time-consuming, expensive, and, what's more, they require some exogenous contrast agents which may perturb the physiological condition of the tissue. Therefore, developing a label-free and non-destructive imaging of adipose tissue metabolism in prediabetes is extremely important.
The metabolic imaging of autofluorescent coenzymes reduced nicotinamide adenine dinucleotide (phosphate) (NAD(P)H), and oxidized flavin adenine dinucleotide (FAD), allow label-free detection of cellular or tissue metabolism. One can non-destructively map their spatial distribution with two-photon fluorescence microscopy (TPFM) and/or fluorescence lifetime imaging microscopy (FLIM). The calculated redox ratio and lifetime indices from these images enable label-free detection of neoplastic development [17], stem cell differentiation [18], macrophage polarization [19], the morphological and functional difference among various types of adipose tissues [20], and cellular response to environmental stimulations [21-23]. However, the adipose tissues are multi-cellular environments, mainly composed of adipocytes and macrophages. They may exhibit different metabolic features in response to IR and inflammation. So far, no label-free method exists to identify the boundaries between them. Metabolic fluorescence from different types of cells will mix [24], and the prediabetic features may be neglected.
Previous studies have shown that macrophages contain aging-accumulated lipofuscin [25]. Since lipofuscin autofluorescence has been used in diagnosing chronic liver disease [26], brain damage [27], and obesity [28], we speculate that macrophages' lipofuscin may have its characteristic autofluorescence. Here, we found the 1040-nm pulse laser could excite two-photon red autofluorescence specific to macrophages. We used this newly discovered feature to separate macrophages' NAD(P)H/FAD fluorescence from adipocytes in TPFM and FLIM images. Multivariate analyses demonstrated that macrophages and adipocytes exhibit different metabolic dynamics in the early and late stages of diabetes. Logistic regression models based on these optical parameters yield a predictive accuracy of approximately 0.9 (area under the receiver operating characteristic (ROC) curve (AUC)) for distinguishing between healthy and prediabetic mice. The differential metabolic features can be developed as a label-free and low-invasiveness method to screen prediabetes.
Results
Lipofuscin-like fluorescence label-free marks the spatial location of macrophages
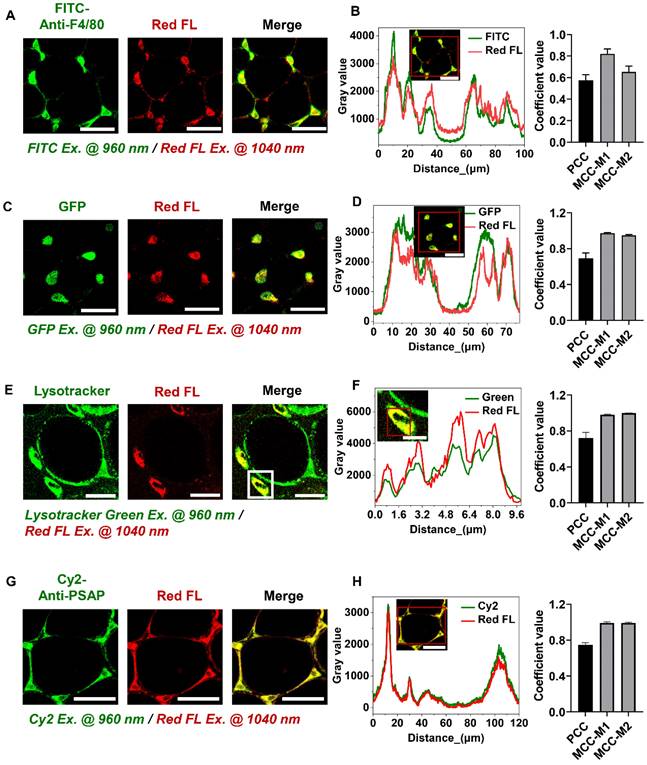
During metabolic imaging of adipose tissues, we found that the regions where macrophages usually reside exhibit strong two-photon red autofluorescence excited at 1040 nm (Red color in Figure 1A, C, E, G). Good co-localization between FITC-conjugated anti-mouse F4/80 and red autofluorescence suggested that red autofluorescence may be specific to macrophages (Figure 1A-B). We further used C57BL/6J-c2J-LysM-eGFP transgenic mice [29] to confirm whether this characteristic red autofluorescence can specifically identify macrophages, in which the GFP expression is driven by the lysozyme promoter (Figure S1A-B). In the freshly isolated epididymal fat, we found GFP-positive cells emit 1040-nm excited red autofluorescence (Figure 1C-D). This feature also holds true for bone marrow-derived macrophages, which exhibited higher red autofluorescence intensity than 3T3-L1 cells (Figure S1C-F). These results indicate that 1040-nm excited two-photon red autofluorescence is a specific hallmark of macrophages. Intriguingly, the corresponding autofluorescence spectrum (Figure S1G) resembles the red emission band of aging-specific lipofuscins [30]. Previous studies have demonstrated that macrophages contain lipofuscins [31, 32] that mainly accumulate in lysosomes [33]. We thus speculated that the two-photon red autofluorescence might originate from lipofuscin pigments. So, we stained macrophages' lysosomes and confirmed their co-localization with red autofluorescence (Figure 1E-F). Immunostaining of lipofuscin in adipose tissue further verified that lipofuscin-positive cells emit 1040-nm excited red autofluorescence (Figure 1G-H). Altogether, the lipofuscin-like red autofluorescence enables non-destructively spatial localization of macrophages in adipose tissue, and this label-free technique can be used to separate the metabolic fluorescence of macrophages from those of adipocytes in the following investigations.
Lipofuscin-like fluorescence can be used as a label-free marker for adipose tissue macrophages. (A) Co-localization of lipofuscin-like red autofluorescence and macrophage marker F4/80 in the epididymal fat of C57 mice. FITC-anti-mouse F4/80 excited by 960 nm was presented by green color, and lipofuscin-like red autofluorescence (Red FL) excited by 1040 nm was presented by red color. Scale bar: 50 μm. (B) (left panel) Intensity profiles of FITC and lipofuscin-like red autofluorescence within the red rectangular region of the merged image (inset). (right panel) PCC = 0.57 ± 0.052, MCC-M1= 0.82 ± 0.045, and MCC-M2 = 0.65 ± 0.053. (C) Co-localization of lipofuscin-like red autofluorescence and GFP in the epididymal fat of C57BL/6J-c2J-LysM-eGFP mice. Scale bar: 50 μm. (D) (left panel) Intensity profiles of GFP and lipofuscin-like fluorescence within the red rectangular region of the merged image (inset). (right panel) PCC = 0.69 ± 0.058, MCC-M1 = 0.97 ± 0.008, MCC-M2 = 0.94 ± 0.01. (E) Co-localization of lipofuscin-like red autofluorescence and lysosome in the epididymal fat of C57 mice. Lysosome was identified with lysotracker green. Scale bar: 20 μm. (F) (left panel) Intensity profiles of lysotracker green fluorescence and lipofuscin-like red fluorescence within the red rectangular region of the merged image (inset). (right panel) PCC = 0.72 ± 0.061, MCC-M1 = 0.98 ± 0.005, MCC-M2 = 0.99 ± 0.0005. (G) Co-localization of lipofuscin-like red autofluorescence and lipofuscin marker PSAP in the epididymal fat of C57 mice. Scale bar: 50 μm. (H) (left panel) Intensity profiles of Cy2 and lipofuscin-like fluorescence within the red rectangular region of the merged image (inset). (right panel) PCC = 0.75 ± 0.024, MCC-M1 = 0.99 ± 0.01, MCC-M2 = 0.99 ± 0.007. Data in (B, D, F, H) are presented as Mean ± SD (n = 3). Red FL represents lipofuscin-like red autofluorescence.
Only adipocytes show a lower redox ratio and a larger proportion of free NAD(P)H fluorescence in prediabetic mice
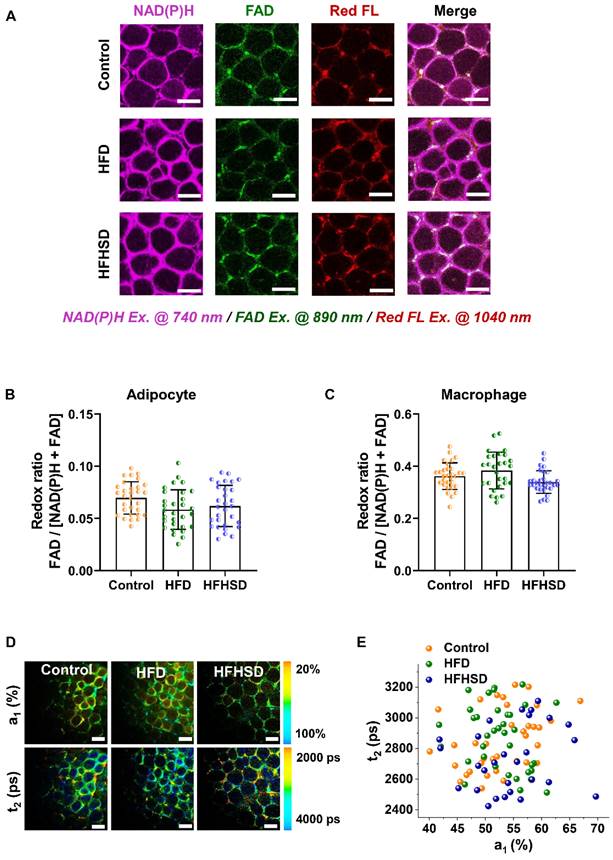
Our animal models used a high-fat diet (HFD) or high-fat-high-sucrose diet (HFHSD) to induce diabetes conditions. Mice developed prediabetic IR after 1 month, whereas diabetic hyperglycemia (above 13 mmol/L) was not observed until the 4th month (Figure 2A-B, Figure S2A-J). Taking advantage of the lipofuscin-laden feature of macrophages, we could label-free analyze the NAD(P)H and FAD metabolic fluorescence of macrophages and adipocytes separately in adipose tissues. In prediabetic mice, we found that only adipocytes showed a significant decrease in redox ratio in freshly isolated epididymal fats (Figure 2C-E). The NAD(P)H FLIM of adipose tissues exhibited a shortened NAD(P)H lifetime t2 and an increased a1 in adipocytes (Figure 2F-G) but not in macrophages (Figure 2H). A possible cause of increased NAD(P)H fraction (a1) and shorter protein-bound NAD(P)H lifetime (t2) is a higher concentration ratio of NADH over NADPH due to a malfunctioning electron transport chain (ETC) and an overactive polyol pathway in the prediabetic or diabetic microenvironment [34-38]. The utilization of a1 and t2 indices yielded an original classification accuracy of 92.3% (control vs. HFD) or 81.8% (control vs. HFHSD) and a cross-validation classification accuracy of 91.3% (control vs. HFD) or 80.9% (control vs. HFHSD). Compared with the redox ratio, lifetime indicators could better differentiate the metabolic state of adipocytes between healthy and prediabetic mice. The integrated indices of redox ratio, a1, and t2 could differentiate between healthy and prediabetic mice with a high sensitivity (control vs. HFD: 97%; control vs. HFHSD: 89%), 100% specificity, and high AUC accuracy (control vs. HFD: 0.96; control vs. HFHSD: 0.93) (Figure 2I-J, Table S1). Moreover, the AUC of disease prediction probability obtained by multi-parameter analysis is higher than that of single-parameter AUC, indicating that the diagnostic ability of multi-dimensional optical indices is more advantageous than that of a single parameter.
Optical readouts of adipocytes and macrophages in response to the prediabetic microenvironment of epididymal adipose tissue. (A) Changes of HOMA-IR index in mice fed HFD or HFHSD for 16 weeks. The red dotted line marks the development of IR in mice fed HFD or HFHSD for 5 weeks. (B) Fasting glucose levels in mice fed HFD or HFHSD for 16 weeks. The red dotted line marks the blood glucose higher than 13mmol/L in mice fed HFD or HFHSD for 16 weeks. (C) Representative images of NAD(P)H, FAD, and lipofuscin-like fluorescence intensity in epididymal fat from mice fed HFD or HFHSD for 1 month. Scale bar: 50 μm. (D) FAD/[NAD(P)H + FAD] intensity of adipocyte cytoplasm was quantified. (E) Quantification of redox ratio of adipose tissue macrophages. (F) Pseudo-color-coded FLIM a1 and t2 images of NAD(P)H in adipose tissues. Scale bar: 50 μm. (G) The a1-t2 scatter plot of adipocytes. Control: orange, HFD: olive, and HFHSD: royal. (H) The a1-t2 scatter plot of macrophages. (I, J) ROC curves and AUC values for optical readouts (redox ratio, a1, t1, t2, and t2-a1-redox ratio-integrated parameter) of adipocytes, showing their ability to distinguish between (I) control and HFD groups or between (J) control and HFHSD groups. (K) Expression profiles of OXPHOS-related and inflammation-related genes in adipose tissues (n = 3). Data in (A, B, D, E) are expressed as Mean ± SD (n = 8). *P < 0.05, **P < 0.01, and ***P < 0.001, the HFD group vs. the control group; #P < 0.05, ##P < 0.01, and ###P < 0.001, the HFHSD group vs. the control group. Each group in (D, E, G, H) contains 25-30 data points from 8 biological replicas. Each data point is the average of 10 cells in one field of view.
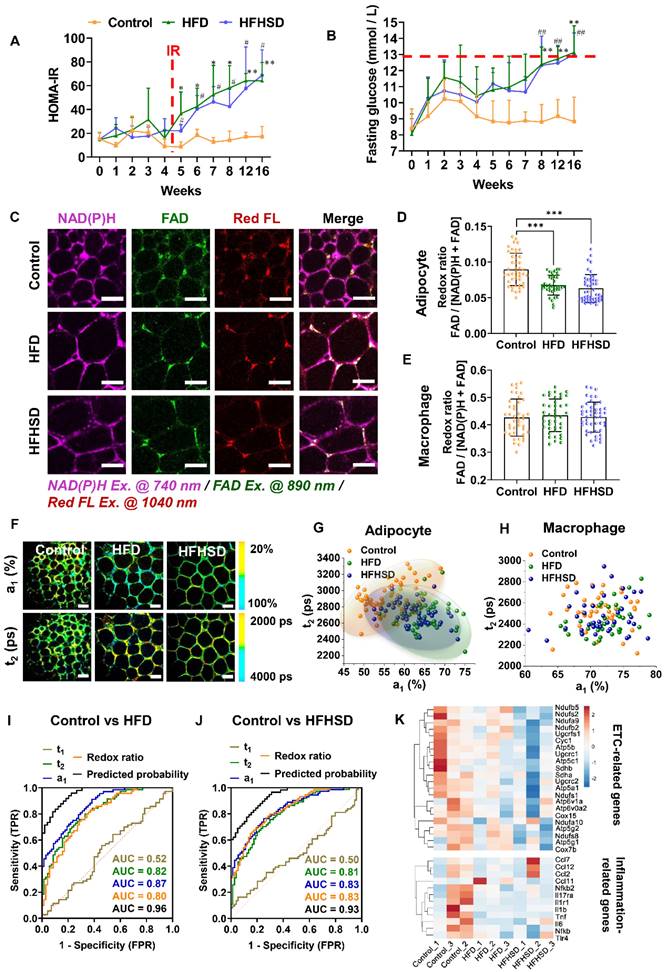
Here in prediabetes conditions, decreased redox ratio and increased a1 may be the result of reduced OXPHOS or elevated glycolysis [39-43]. To clarify the underlying mechanism, we specifically examined genes related to metabolic pathways through RNA-Seq of adipose tissues. Several genes involved in oxidative metabolism, including PGC-1α, and ETC genes, were downregulated in prediabetic mice, but glycolysis-related and pro-inflammatory-related genes were not significantly changed (Figure 2K, Figure S3A). The Seahorse assay revealed a decrease in oxygen consumption rate (OCR) and no significant difference in extracellular acidification rate (ECAR) in prediabetic adipose tissue compared to the controls (see Figure S3B-C). These results are consistent with the RNA-seq data, suggesting impaired oxidative metabolism and mitochondrial dysfunction in prediabetic adipose tissue. Based on these findings, we can reasonably speculate that decreased redox ratio, increased a1, and shortened t2 may be attributed to mitochondrial dysfunction and reduced OXPHOS. Moreover, in line with the optical metrics and RNA-seq outcomes, the results of Hematoxylin and Eosin (H&E) staining and immunohistochemical (IHC) staining further validated the absence of variation in CD80, iNOS (typical markers of M1 macrophage) and CD206 expression (a typical marker of M2 macrophage) between normal and prediabetic adipose tissues (Figure S3D). These results support our findings in optical metrics. Therefore, measuring the autofluorescence intensities of lipofuscin, NAD(P)H, and FAD, as well as the fluorescence lifetime of NAD(P)H, could sensitively and specifically detect the IR of prediabetes.
Both adipocytes and macrophages exhibit abnormal metabolic fluorescence in diabetic mice
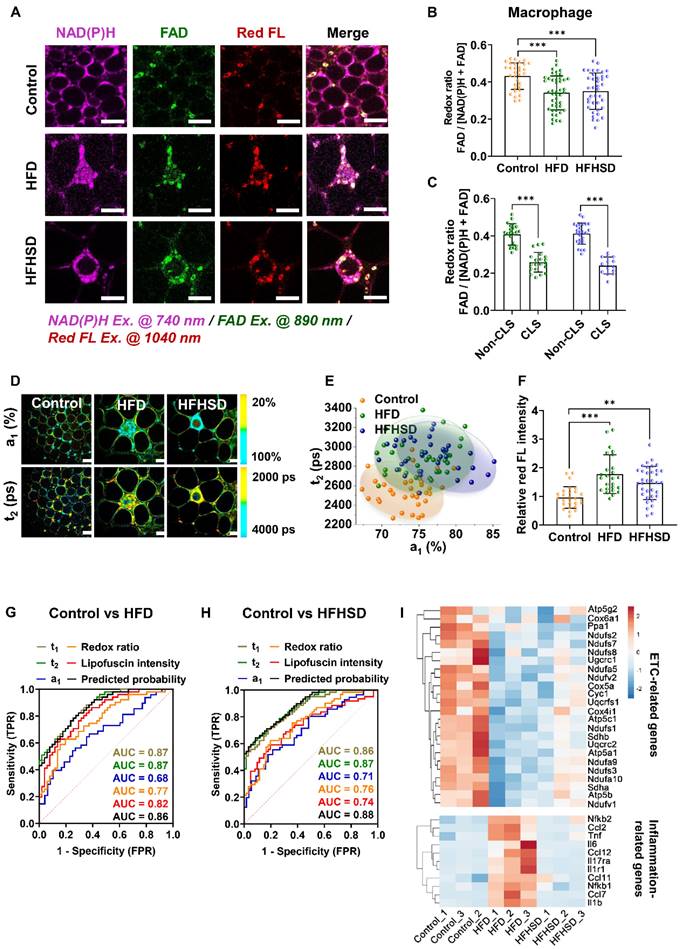
In contrast to prediabetic mice, decreased redox ratios were found in both adipocytes and macrophages of diabetic mice (Figure 3A-B, Figure S4). Interestingly, compared with the control mice, more CLSs (red arrows) appeared in the adipose tissue of diabetic mice, especially the HFD-fed mice (Figure S5A). Macrophages that aggregate into the CLS stained positive for CD80 and iNOS (the M1 macrophage markers) (Figure S5B-F). Their redox ratios were significantly lower than that of non-CLS macrophages (Figure 3C), indicating that CLS macrophages are the main contributor to the redox ratio reduction. In addition, both adipocytes and macrophages of diabetic mice exhibited increased lifetime proportion a1 of free NAD(P)H (Figure 3D, Figure S4). The a1-t2 scatter plot distinctly separated macrophages in the diabetic mice from those in the control group, with a high original (86.1% for HFD vs control; 88.7% for HFHSD vs control) and cross-validation accuracy (86.1% for HFD vs control, 84.5% for HFHSD vs control) (Figure 3E). Moreover, higher lipofuscin intensity was observed in macrophages from diabetic mice, especially macrophages in CLSs (Figure 3F), which may imply a pro-inflammatory status [44-46]. To visually compare the accuracies of optical indices in classifying the metabolic profile of different macrophage phenotypes, we plotted the ROC curves of the redox ratio, a1, t1, t2, and the relative lipofuscin-like fluorescence intensity. The AUC analysis yielded good separation of datasets between healthy and diabetic mice with accuracies of 0.86 and 0.88 for HFD vs control and HFHSD vs control, respectively (Figure 3G-H, Table S2-3). As an in vitro validation, we isolated mice's bone marrow-derived macrophages (BMDMs) and stimulated them into M1 and M2 phenotypes. Consistent with the results in adipose tissues, BMDM M1 macrophages had a lower redox ratio and higher a1 and t2 compared to BMDM M0 and M2 macrophages (Figure S6). The discrepancies in the absolute values of macrophage's redox ratio in vivo and in vitro may be due to the more complex microenvironment in vivo. For example. adipocytes could transfer mitochondria to macrophages in adipose tissues to maintain metabolic homeostasis [47]. Moreover, RNA-Seq analysis on the adipose tissues successfully identified the down-regulation of ETC-related genes and up-regulation of several inflammation-related genes including TNF-α, interleukins (ILs), CC chemokines, and NF-κB in diabetic mice (Figure 3I), while changes in glycolysis-related genes' expression were not obvious (Figure S7A). In addition, the Seahorse assay demonstrated that compared with the normal group, the OCR of adipose tissue was lower in diabetic mice, while the ECAR remained unchanged. This is consistent with the RNA-Seq result (Figure S7B and C). So, based on these results, we thought reduced OXPHOS could be a major cause of abnormal metabolic fluorescence in the diabetic microenvironment. This further proved the reliability of our newly-developed approach for label-free characterization of macrophage phenotypes and diagnosis of diabetic adipose tissues in situ.
TPFM and FLIM metabolic imaging of epididymal adipose tissues of diabetic mice. (A) Representative images of NAD(P)H, FAD, and lipofuscin-like fluorescence intensity in epididymal adipose tissues from mice fed HFD or HFHSD for 4 months. Scale bar: 50 μm. (B) Quantification of macrophages' redox ratio. (C) The redox ratio of macrophages in CLSs and non-CLSs (Left: HFD group; right: HFHSD group) was quantified. (D) Pseudo-color-coded FLIM a1 and t2 images of NAD(P)H in adipose tissues. Scale bar: 50 μm. (E) The a1-t2 scatter plot of macrophages. (F) Quantification of the relative fluorescence intensity of lipofuscin-like pigments in macrophages. (G, H) ROC curves and AUC values for optical readouts (redox ratio, a1, t1, t2, lipofuscin intensity, and t2- t1-a1-redox ratio-lipofuscin-integrated parameter) of macrophages, showing their ability to distinguish between (G) control and HFD groups or between (H) control and HFHSD groups. (I) Heatmap of OXPHOS-related and inflammation-related genes expression in adipose tissues of normal and diabetic mice. Data in (B, C, F) are presented as Mean ± SD (n = 8). **P < 0.01 and ***P < 0.001 relative to the control group. Each group in (B, C, E, and F) contains 25-30 data points from 8 biological replicas. Each data point is the average of 10 cells in one field of view.
Integrated analysis of metabolic imaging readouts: a promising approach for differential diagnosis of diabetes stages
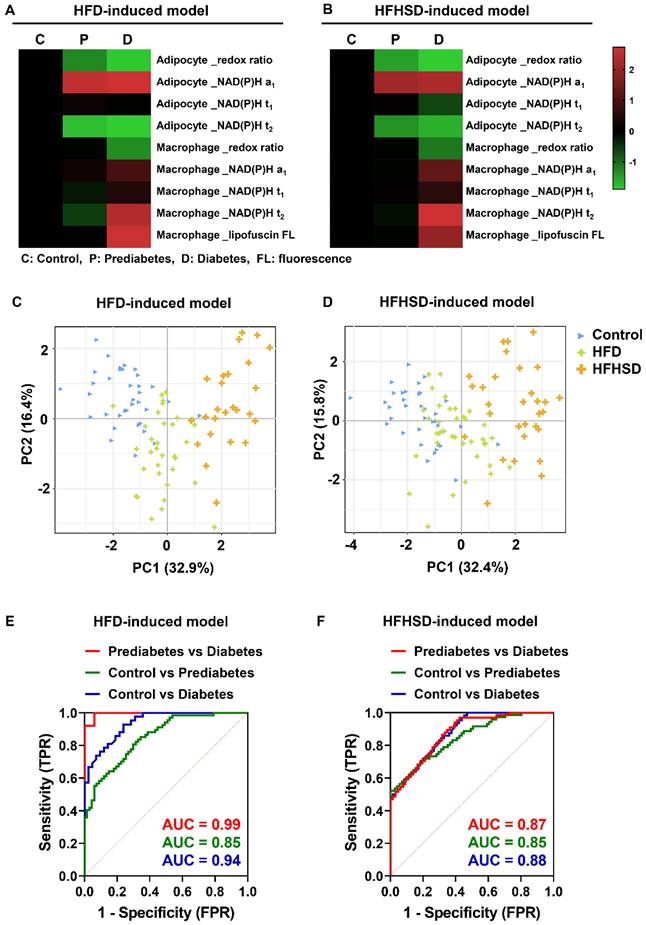
We then compared the metabolic imaging readouts of control, prediabetic, and diabetic adipose tissues to explore their potential for differential diagnosis. The Z-score heatmaps of nine optical variables showed clear differences in metabolic fluorescence between normal, prediabetic, and diabetic adipose tissues (Figure 4A-B, Table S4). Principal component analysis (PCA) score plots indicated that the metabolic autofluorescence of these three groups was well-clustered and separated in both the HFD and HFHSD models (Figure 4C-D), with high accuracy (AUC) greater than 0.85 (Figure 4E-F, Table S5). Thus, a multi-optical readout analysis of adipocytes and macrophages in adipose tissue can enable differential diagnosis among normal, prediabetic, and late diabetes stages.
Integrated analysis of metabolic imaging readouts enables the differential diagnosis of diabetes stages. (A, B) Z-score heatmaps showing changes in optical readouts of adipocytes and macrophages in healthy control, prediabetes, and diabetes conditions. (C, D) PCA scores plots (PC1 versus PC2) for the differentiation of integrated metabolic imaging readouts from control, prediabetic (HFD and HFHSD), and diabetic (HFD and HFHSD) mice. For each group, 25-30 data points were obtained from 8 biological replicas. (E, F) ROC curves based on the optical metrics of adipose tissues for differential diagnosis of prediabetes versus diabetes, control versus prediabetes, and control versus diabetes.
Remission of IR eliminates the differential features of metabolic fluorescence
Overwhelming evidence has shown that lifestyle interventions, especially improvements in physical activity and diet, can prevent or delay the progression of diabetes [48-50]. To prove that the metabolic shift of adipocytes results from IR, we performed rescue experiments by converting HFD or HFHSD into a normal chow diet after IR (Figure S8A). Several notable changes were observed in mice after changing the diet. Blood glucose levels of prediabetic mice had returned to normal (Figure S8B-C). Additionally, histopathological examination manifested that dietary improvement in prediabetic mice normalized adipocyte size and reversed inflammatory conditions, such as the reduction of CLS numbers (Figure S8D-E). More importantly, the metabolic changes of redox ratio and NAD(P)H lifetime that we found in prediabetes disappeared (Figure S9, Figure 5A-E). These results not only suggest that dietary change is an effective way to prevent the deterioration of prediabetes and the development of diabetes, but also demonstrate that these optical parameters can be used as reliable indices to detect IR and inflammation in prediabetic and diabetic microenvironments.
Remission of IR in mice restoring the redox ratio and NAD(P)H lifetime of adipose tissue to normal levels. (A) Representative images of NAD(P)H, FAD, and lipofuscin fluorescence intensity. Scale bar: 50 μm. Relative FAD/[NAD(P)H + FAD] intensities in adipocyte cytoplasm (B) and macrophages (C) in adipose tissues were quantified. (D) False color-coded FLIM a1 and t2 images of NAD(P)H in adipose tissues. Scale bar: 50 μm. (E) The a1-t2 scatter plot showed that no difference in NAD(P)H lifetime of adipocytes was observed among the three groups. Data are shown as Mean ± SD (n = 8). Each group in (B, C, and E) contains 25-30 data points from 8 biological replicas. Each data point is the average of 10 cells in one field of view.
Discussion
Adipose tissue is an endocrine organ that plays a pivotal role in the development of IR. Dysfunction of adipose tissue releases more adipokines, pro-inflammatory factors, and free fatty acids to disrupt the balance of glucose and lipid metabolism [51, 52] and impair insulin signaling transduction [53, 54]. At present, there are limited ways to monitor adipose tissue metabolism during the presymptomatic stage of T2DM, especially the label-free methods. Here, we demonstrated that triple metabolic imaging of NAD(P)H, FAD, and lipofuscin-like autofluorescence could label-free identify the metabolic heterogeneity of adipose tissues in the prediabetic and diabetic microenvironment. The key advance, newly discovered lipofuscin-like fluorescence, could separate macrophages from adipocytes. This identity separation technique allows us to find the redox ratio and NAD(P)H lifetime has differentiable features in the adipocytes of prediabetic IR as well as distinguishable features in the M1-activated macrophages (Figures 2, 3, S5, and S6).
Lipofuscin pigments are a kind of chemically and morphologically polymorphic waste consisting of cross-linked lipids, protein residues, and other undigested cell substances that accumulate primarily in lysosomes [33]. They commonly appear in senescent cells [55] and have a broad excitation range from 320 to 560 nm with corresponding emission peaks from 460 to 630 nm [30]. Most studies used near-ultraviolet (330-380 nm) or blue light (450-490 nm) to excite green to yellow lipofuscin autofluorescence [25, 55, 56]. But these light sources also excite autofluorescence from NAD(P)H and FAD, which will interfere with the lipofuscin quantification. Here, with near-infrared two-photon excitation at 1040 nm, we could selectively excite the red-end autofluorescence of lipofuscin and avoid the co-excitation problems [57, 58]. That's how we successfully identify the specific lipofuscin-like red autofluorescence in macrophages. It is also noteworthy that two-photon excitation of NAD(P)H and FAD also excite lipofuscin's green to yellow fluorescence in macrophages. So the calculated redox ratio is a blended contribution from glucose metabolism and lipofuscin accumulation in macrophages. However, the lipofuscin fluorescence has almost no effect on NAD(P)H lifetime because we used a 460 ± 25 nm bandpass filter to reject the lipofuscin fluorescence while collecting the NAD(P)H signal.
Mechanisms involved in lysosomal lipofuscin accumulation include aging [33], oxidative stress [25], or apoptosis [59]. Phagocytosis of lipofuscin-loaded dead cells may lead to lipofuscin accumulation in macrophages [60]. Since macrophages contain a lot of lysosomes for phagocytosis, they usually display lipofuscin-laden features in several organs, such as the liver [26], lymph node [61], brain [27], and bone marrow [32]. As a result, our specific metabolic fluorescence imaging of lipofuscin could identify the resident macrophages in adipose tissues. Furthermore, we found that adipose tissue macrophages in diabetic mice had higher red fluorescence of lipofuscin pigments, especially in CLSs than that of control and prediabetic ones (Figure 4A). Obesity and diabetic microenvironment could trigger inflammaging and immunosenescence [62, 63], which may cause more lipofuscin deposition in macrophages. In addition, the accumulation of lipofuscin pigments could be a dangerous signal, driving the production of pro-inflammatory chemokines and cytokines, which in turn promotes the activation of macrophages [44-46]. Substantial lipofuscin pigments have been found in CD68-positive macrophages [64]. Therefore, it is reasonable to speculate that the pro-inflammatory macrophages may have more deposition of lipofuscin pigments and higher lipofuscin red autofluorescence intensity. However, the mechanism by which lipofuscin accumulation affects macrophage phenotypic switch remains unclear. The role of lipofuscin-laden macrophages in diabetic microenvironments requires further study.
The causal link between inflammation and IR is still a controversial issue in the etiology of diabetes mellitus [65]. Some studies demonstrated that adipose tissue inflammation is a trigger of IR [66-68], while other studies asserted that inhibition of inflammation not only fails to improve IR but instead causes glucose intolerance [69-72]. In our study, mice developed IR by the 5th-week post-HFD or HFHSD feeding, whereas adipose tissue inflammation was not detectable until 4 months of feeding, indicating that diet-induced IR precedes inflammation. Interestingly, there was no change in the inflammation-related genes' expression in prediabetic adipose tissues, but the expression of ETC-related genes was downregulated (Figure 2K). Previous studies have shown that mitochondrial dysfunction is a key driver of IR [73-75]. Excessive dietary intake of high fat and high sucrose creates a microenvironment with high free fatty acids and glycemia, causing oxidative stress and mitochondrial dysfunction in adipose tissues. Consequently, damaged mitochondrial function lessens mitochondrial biogenesis and mtDNA concentrations and inhibits the oxidation process, which impairs adipogenesis, lipogenesis, and adiponectin production [76, 77]. Collectively, this causes enhanced inflammation and IR response in adipose tissues. As a warehouse for lipid storage, once adipose tissue has IR, it would cause lipid overflow and promote IR in other organs, such as the liver and skeletal muscle [78]. Therefore, monitoring mitochondrial metabolism in adipose tissue could help the diagnosis of prediabetes. Changes in metabolic autofluorescence could reflect metabolic shifts earlier than those in genetic and proteomic levels [79]. That's why autofluorescence measurement could enable the early detection of various diseases [80] and ensure dynamic, label-free, and non-destructive observation of tissue metabolism [81].
Of further importance, optical metabolic imaging delineates the metabolic heterogeneity of tissues at a single-cell level. Conventional biochemical methods can only perform bulk analysis of the whole tissue [82]. For instance, NAD(P)+ / NAD(P)H detection kit detected bulk changes of NAD(P)+ / [NAD(P)H + NAD(P)+] ratio within a pooled population of cells and cannot separate the redox ratio of different cell types (Figure S10). White adipose tissue consists of a variety of cell types, including adipocytes, preadipocytes, endotheliocyte, macrophages, and other immune cells, and they serve different roles in the development and progression of IR and diabetes [83]. There remains a clear need for performing metabolic analysis at the cellular level. Optical redox ratios, NAD(P)H lifetimes, and lipofuscin-like pigments not only distinguish macrophages from adipocytes but also characterize their separate metabolism in the development of diabetes. In this study, we successfully dissected the differentiable features of adipocytes and macrophages in prediabetic and diabetic microenvironments using the optical metrics described above. Only adipocytes' metabolic fluorescence changes during the prediabetic stage (Figure 2). The differentiable features of metabolic fluorescence were absent before the onset of IR and after its remission (Figure S11, Figure 5), indicating that our optical indices can specifically indicate IR in prediabetes pathology.
According to a long-term cohort study, the onset of IR has been reported as early as 10 years before the symptomatic phase of T2DM, and metabolic features and cellular molecules in people with IR vary with time lapsing [5]. Since abnormal physiology arises in the early stages of chronic diseases, it is feasible to apply molecular imaging tools to diagnose inchoate diseases without apparent symptoms [84, 85]. At present, several imaging tools are applied to diagnose different adipose depots. CT has been used to quantify and score visceral adipose tissue content in T2DM patients [86]. MRI can calculate the ratio of visceral fat / subcutaneous fat volume, a promising index related to cardiovascular disease in individuals with impaired fasting glucose [87]. Although CT and MRI are acknowledged imaging modalities for measuring visceral adiposity, there are some limitations, including professional requirements, costly, radiological hazards in CT, and the time-consuming of MRI [88, 89]. Additionally, these conventional diagnostic techniques cannot monitor pathophysiological microenvironments [90]. TPFM and FLIM have been widely applied to monitor disease microenvironments, such as cancer [80], neurodegenerative disease [91], and liver disease [92]. The label-free and non-destructive feature of metabolic imaging by TPFM and FLIM guarantees a simple, safe, and reproducible detection method.
Conclusion
In conclusion, our study validated that metabolic TPFM and FLIM imaging of NAD(P)H, FAD, and lipofuscin is a valuable method to label-free identify prediabetic adipose tissues. The lipofuscin fluorescence can indicate the location and activation status of macrophages. The redox metabolism of adipocytes could be analyzed at the location lacking lipofuscin fluorescence. These metabolic features can help improve the diagnostic accuracy of prediabetes, in particular when hyperglycemia is not significant in the early stages of IR development. However, this research still has certain limitations that warrant further studies. First, as we previously discussed, the redox ratios of macrophages have a mixed contribution from NAD(P)H, FAD, and lipofuscin, which does not accurately reflect the redox state of macrophages. There is a need to develop a calculation method that can correct the macrophage redox ratio based on the lipofuscin signal, and this is the work we will explore in the future. Second, our observations are made in visceral adipose tissue. As subcutaneous adipose tissue may be easier to access in clinical applications, future work needs to measure metabolic fluorescence changes in subcutaneous adipose tissues. Third, in this study, we demonstrated that optical parameters can distinguish between metabolically healthy and metabolically unhealthy adipose tissues in prediabetic or diabetic microenvironments. To determine whether metabolic changes in adipose tissues can specifically diagnose prediabetes, further studies with different disease animal models are required. Finally, this study has not elucidated the relationship between insulin resistance pathways and metabolic fluorescence, which requires further study.
In the future, we will integrate TPF microscopy and FLIM with fiber-based in vivo cell imaging platforms (Cellvizio, Mauna Kea Technologies) or transdermal techniques like optical microneedles [93] for prediabetes diagnosis. By employing optical fibers or microneedles, low-invasive detection of adipose tissue metabolic fluorescence could be achieved, and the data can be quickly transmitted back to the analysis software. By utilizing machine learning algorithms for data training, it is possible to rapidly predict the probability of having diseases and achieve goals of low-invasive, time-saving, as well as in vivo label-free screening for the diagnosis of prediabetes.
Materials and Methods
Development of the T2DM animal model
C57BL/6 mice were obtained from the Animal Laboratory, Faculty of Health Sciences, University of Macau. Lyz2GFP mice have been described [94] and were kindly provided by Prof. Ivan Dzhagalov (National Yang Ming Chiao Tung University, Taipei, Taiwan). C57BL/6J-c2J-LysM-eGFP mice were crossbred from homozygous C2J and Lyz2GFP mice. C57BL/6J and C57BL/6J-c2J-LysM-eGFP male mice were maintained on a 12-hour light/dark cycle with free access to food. All animal experiments were approved by the Animal Research Ethics Committee of the University of Macau (Protocol ID: UMARE-037-2019).
We used a high-fat diet (HFD) with 60% kcal fat (Research diet D12492i, Research Diets Inc., New Brunswick, NJ, USA) and a high-fat-high-sucrose diet (HFHSD) with 58% kcal fat and sucrose (Research diet D12331i, Research Diets Inc.) feeding protocols to induce the T2DM animal model. At the age of 6-7 weeks, mice were divided into three groups, including the control (fed with normal chow), HFD, and HFHSD groups, with 8 mice per group. Mice were fed the normal chow, HFD, or HFHSD for 4 months. We measured the mice's body weight, random blood glucose, and fasting glucose levels every week. Fasting insulin content was detected using Insulin Mouse ELISA Kit (EMINS, Invitrogen, Thermo Fisher Scientific). Homeostasis model assessment-IR (HOMA-IR) is used to evaluate the IR of individuals. The calculation method is as follows: fasting blood glucose level (FPG, mmol/L) × fasting insulin level (FINS, μU/mL)/22.5 [95].
Insulin tolerance test
Mice were fasted for 5 hours and injected intraperitoneally with 0.75 U/kg (bodyweight) of insulin solution (I9278, Sigma-Aldrich). Blood glucose concentration was detected with Roche's Blood glucose meter before insulin injection and at 15, 30, 45, and 60 minutes after injection.
Intraperitoneal glucose tolerance test
After fasting for 12 hours, mice were weighed and injected with glucose solution at a dosage of 1 mg/g body weight. Blood glucose level was measured with a Roche Blood glucose meter before insulin injection and at 15, 30, 45, 60, 90, and 120 minutes after injection.
Isolation and polarization of bone marrow-derived macrophages (BMDMs)
Bone marrow-derived macrophages were extracted from 6-8 weeks old age of C57BL/6J mice [96]. Six mice were sacrificed for BMDMs' isolation and polarization. Mice were euthanized by cervical dislocation, and the femur and tibia bones were isolated. After rinsing off hair, bone joints were cut off, and marrow was flushed out using a 25 G needle into the 1640 medium containing 10% heat-inactivated fetal bovine serum (FBS) and 1% penicillin-streptomycin (PS). Then, cells were filtered, centrifuged, and resuspended in the 1640 medium containing 10% heat-inactivated FBS, 1% PS, and 10 ng/mL M-CSF (315-02, PeproTech), seeded into Petri dishes, and maintained in a humidified incubator with 5% CO2 at 37°C. On day 3, we changed the fresh BMDM growth medium, and on day 5, we seeded cells into different dishes. For M1 activation, we used 10 ng/mL LPS (L4391, Sigma) plus 20 ng/mL IFNγ (315-05, PeproTech). For M2 polarization, 20 ng/mL IL-4 (214-14, PeproTech) was used. Flow cytometry was applied to identify macrophage phenotypes.
Flow cytometry assay
Cells were harvested, resuspended in PBS buffer containing 2% FBS, and filtered with a 0.22 µm strainer, followed by fluorescent-dye conjugated antibodies incubation at 37℃ for 30 minutes. After incubation, cells were analyzed by using BD Accuri™ C6 Plus Flow Cytometer (BD Biosciences). Antibodies used for macrophage phenotypes identification include PE-CD86 (105007, Biolegend, 1:20), PE-CD206 (141705, Biolegend, 1:40), PE-CD163 (12-1631-82, Biolegend, 1:80) and Alexa Fluor 647anti-mouse F4/80 antibody (123122, Biolegend, 1:200). CD86 is an M1 macrophage marker, while CD206 and CD163 are considered to be M2 macrophage markers [97-99].
Whole-mount immunostaining
We followed a previously reported protocol [100]. Fresh adipose tissues were fixed with 4% paraformaldehyde (PFA) overnight at room temperature. Fixed tissues were cut into 2-3 mm3 pieces, blocked with 5% BSA for 1 hour at room temperature, and incubated with FITC anti-mouse F4/80 Antibody (123107, Biolegend, 1:100) or Alexa Fluor 647 anti-mouse F4/80 antibody (123122, Biolegend, 1:100) or Anti-prosaposin (PSAP) antibody (ab180751, Abcam, 1:100) at 4ºC overnight, followed by Cy2 conjugated secondary antibody (ab6940, Abcam, 1:500) at room temperature for 1 hour. Observation of treated fat tissues was performed on TPFM. F4/80 is a major marker of macrophages [101], and prosaposin (PSAP) is a marker of lipofuscin [102, 103]. Both F4/80 and PSAP are used to label macrophages.
Co-localization of lysosome and lipofuscin fluorophore
BMDMs or freshly isolated adipose tissue was stained with 100 nM lysotracker green (L7526, Thermo Fisher Scientific., Waltham, MA, USA) for 30 minutes at 37 ℃. Lysosomes and lipofuscin-like fluorophores were visualized in TPFM under the excitation wavelength of 960 nm and 1040 nm, respectively. Co-localization of green fluorescence emitted by lysotracker green and lipofuscin-like red autofluorescence was analyzed by calculating Pearson's correlation coefficient (PCC) and Manders' Co-localization Coefficients (MCC).
The TPFM and redox ratio analysis of NAD(P)H and FAD in freshly excised visceral fat
Fresh adipose tissue was excised and maintained in a 37°C micro-incubator (CU-501, Live Cell Instrument Co., LTD, Korea) containing 5% CO2 during imaging. For TPF imaging acquisition, we used a multiphoton microscopy system excited by a wavelength-tunable (700-1300 nm) femtosecond laser (InSight X3, Spectra-Physics, Newport). In each batch of measurement, we ensured the average excitation power after 20× NA = 0.75 objective is about 25 mW. The third harmonic generation (THG) intensity at the air-glass interface was used to calibrate laser excitation intensities. To mitigate the effect of imaging depth on excitation efficiency, we acquired Z-stack images of freshly excised adipose tissue within a depth of 20 μm and a step size of 2 μm, using a Nikon Inverted Microscope (A1R MP+/Ti2-E, Nikon instrument Inc.) with a 20× NA = 0.75 objective (Nikon CFI Plan Apo λ 20×/0.75 DIC N2, Nikon instrument Inc.). The sizes of images in pixels and physical dimensions are 4096×4096 pixels and 655.36×655.36 μm, respectively.
Excited at 890 nm, 740 nm, and 1040 nm, the TPF signals of FAD, NAD(P)H, and lipofuscin fluorescence can be generated, respectively. The TPF signal of FAD was detected by a channel with a 510-600 nm detection range. The detection range of the channel for NAD(P)H TPF signal was 400-480 nm [81]. And the TPF signal of lipofuscin-like fluorescence was collected in a range of 604-679 nm [30]. We took three Z-stack images for each adipose tissue to ensure that at least 30 adipocytes or 30 macrophages could be analyzed. We used the Image J software to process a sum of intensity projection of a Z-stack image and obtain the summed NAD(P)H or FAD fluorescence intensity (photon counts) in each pixel. Then, the redox ratio within each cell can be calculated using a formula of IFAD / [INAD(P)H + IFAD] [81], where INAD(P)H and IFAD are fluorescence intensities of NAD(P)H and FAD within a cell. The measurement and calculation of BMDM's redox ratio were the same as above.
The FLIM and fluorescence lifetime of NAD(P)H in freshly excised visceral fat
Measurement of fluorescence lifetime in fresh epididymal fat or BMDMs was conducted on the Nikon Inverted Research Microscope (A1R MP+/Ti2-E, Nikon instrument Inc.) equipped with a femtosecond laser tunable between 700-1300 nm. Fresh adipose tissues or BMDMs were maintained in the micro-incubator system during FLIM image acquisition.
We used 740 nm femtosecond pulses to excite the NAD(P)H two-photon fluorescence and the fluorescence signals were collected by a 460 ± 25 nm bandpass filter (ET460/50m, Chroma Technology). The average excitation power after the 40× NA=1.15 objective (Nikon CFI Apo LWD λS 40×/1.15 WI, Nikon instrument Inc.) is about 10 mW. We tried to image different tissues at almost the same depth beneath the surface. First, we searched the outermost layer of adipose tissues, where there is a strong second harmonic generation (SHG) signal of collagens. Then, we further moved the imaging plane 20 μm deeper into the tissue to take the FLIM images. The FLIM data were detected by a high-speed photomultiplier tube (DCC-100, Becker & Hickl GmbH) and recorded by the time-correlated single-photon counting (TCSPC) module (SPC-160, Becker & Hickl GmbH). As confirmed with the FLIM of urea crystal, the instrument response function (IRF) has a 170 ps full-width half maximum. Each 256×256 pixels FLIM image was acquired within 120 sec to avoid photobleaching. To collect photon counts of more than 200 in most of the pixels, we set a 25.21 μs pixel dwell time. For NAD(P)H FLIM data analysis, we used an IRF convoluted two-component model  (a1e-t/τ1 +a2e-t/τ2) to fit the decay traces, where t1 and t2 represent short and long-lifetime components, and a1 and a2 are relative fraction of the lifetime components (a1 + a2 = 1) [104]. The t1 and a1 are characteristics related to free NAD(P)H, but t2 and a2 are protein-bound NAD(P)H.
Assessment of 2-NBDG glucose uptake in adipose tissues
Adipose tissues' glucose uptake function was measured using a Cell Meter™ 2-NBDG Glucose Uptake Assay Kit (36702, AAT Bioquest). Fresh adipose tissue was incubated with 0.5 mM 2-NBDG for 1 hour in a 37°C, 5% CO2 incubator. The fluorescence signal of 2-NBDG (Ex. @ 488 nm/Em. @ 530 nm) was monitored using the Nikon Inverted Research Microscope with a 20× 0.75 NA objective. We captured at least three Z-stack images of each adipose tissue (~20 μm depth of field, 2 μm step size), and used the Image J software to perform maximum intensity projection of Z-stack images to quantify the fluorescence intensity of each image.
Biochemical measurement of NAD(P)+/NAD(P)H redox ratio
A tissue sample (about 10 mg) was cut into pieces with scissors and placed in a homogenizer with 400 μL of NAD+/NADH or NADP+/NADPH extraction solution. The tissue was homogenized on ice and centrifuged at 12,000 g for 10 minutes at 4°C, and the supernatant was taken for detection. The total amounts of NAD+/NADH and NADP+/NADPH in samples were determined according to the assay kit's protocol (S0175 & S0179, Beyotime). Based on the absorbance value and NAD(P)H standard curve, the redox ratio of NAD(P)+ / [NAD(P)H + NAD(P)+] was calculated.
Hematoxylin and Eosin (H&E) staining
Freshly excised adipose tissues were fixed with 4% PFA overnight at room temperature, followed by dehydration. Dehydration was carried out in a dehydrator with gradient alcohol in sequence. After replacing the alcohol in the tissue with xylene, it could be embedded in paraffin. 5-10 μm slices were cut on a microtome (Leica RM2235, Wetzlar). Dewaxed slices were stained in an aqueous hematoxylin solution for a few minutes, then rinsed in acid water and the ammonia water for serval seconds each, followed by 1 hour in running water. After dehydration in 70% and 90% alcohol, slices were stained in alcohol eosin solution for 2-3 minutes. The stained sections were dehydrated with pure alcohol and then made transparent with xylene. The clear sections were dripped with neutral gum and covered with a coverslip for further image acquisition in a slide image scanner (NanoZoomer S60, Hamamatsu). Regarding the counting of CLS numbers, we took three fields of view for each H&E section and counted the number of CLSs in each field.
Immunohistochemistry (IHC) labeling of macrophage markers
Dewaxed slices were first incubated with 3% H2O2 for 10 minutes at room temperature (protected from light) to block endogenous peroxidase, then subjected to microwave antigen retrieval. Next, slices were blocked with 5% BSA for 15 minutes at 37℃ and incubated with primary antibodies overnight at 4℃, followed by incubation of secondary antibodies for 40 minutes at 37℃. Slices were incubated with Streptavidin-Biotin Complex (SABC-HRP Kit, Beyotime) for 40 minutes at 37℃ and developed color by using DAB (DAB-HRP Color Development Kit, Beyotime). Finally, the slides were counterstained with hematoxylin, dehydrated with graded alcohol, cleared with xylene, mounted with neutral gum and coverslips, and examined by microscopy. Primary antibodies used in this project include an Anti-F4/80 antibody [SP115] (ab111101), an Anti-CD68 antibody (ab125212), a CD80 Monoclonal Antibody (2A2) (MA5-15512), an Anti-iNOS (ab3523) and an Anti-Mannose Receptor (CD206, ab64693). Secondary antibodies include HRP Anti-Rabbit IgG antibody (ab288151). For the quantitative analysis of IHC-labeled images, we also took three fields of view for each IHC-labeled slice and quantified the mean optical density of each image using Image Pro Plus software. The difference in relative mean optical density reflects the difference in relative protein expression between groups.
RNA Sequencing and bioinformatic analysis
Mice epididymal fat tissues were frozen in liquid nitrogen immediately after isolation. Total RNA extraction and mRNA library were done by Novogene. The mRNA sequencing data were produced by Illumina Novaseq 6000. Raw data were cleaned by the Trim_glore software (version 0.6.2) and qualified filtered data was generated by FastQC software (version 0.11.8). Then reads were aligned to the mouse (Mus musculus) reference genome (GRCm38.p6 assembly version) by STAR software (version 2.7.0f) and gene counts were calculated by featueCounts software (version 1.6.4) separately. The raw count data were imported into R language (version 4.2.1) for further exploration.
The transcript per million (TPM) was calculated based on the sequencing depth and gene length, and normalization of TPM was used for principle component analysis (PCA) and heatmap visualization. For differential gene analysis, we use the R package DESeq2 (version 1.36.0) for comparison. The differential expression genes (DEGs) were defined based on the fold change, p.adj, and p-value. The thresholds are: fold change > 2, and false discovery rate (FDR) < 0.05. The gene ontology (GO) enrichment analysis was performed by the ClusterProfiler package (version 4.4.4).
Seahorse assay
To analyze the bioenergetic profile of adipose tissue, we employed the XFe-24 Extracellular Flux Analyzer (Seahorse Bioscience) [105]. For the Mito stress test, freshly excised adipose tissues were rinsed with assay medium (Seahorse XF DMEM Medium, 103575-100, Agilent Technologies) containing 1 mM pyruvate, 2 mM glutamine, and 10 mM glucose at pH 7.4. Approximately 9 mg of fat tissue was weighed and placed into the XF24 Islet Capture Microplate (101122-100, Agilent Technologies). Then, 500 μL of assay medium was added to each well of the XF24 Islet Capture Microplate and the tissue samples were incubated at 37 ℃ without CO2 for 45 minutes. The oxygen consumption rate (OCR) was measured after sequential injection of a set of cell stress test compounds, including 30 μM oligomycin, 2 μM fluoro-carbonyl cyanide phenyl-hydrazone (FCCP), and 5 μM rotenone plus 5 μM antimycin (Rot/AA). Basal respiration was calculated by subtracting the OCR after Rot/AA addition from the initial OCR. ATP production was determined by the difference between initial OCR and OCR after oligomycin injection. The maximum respiration was estimated as the difference between the OCR after FCCP injection and the OCR after Rot/AA addition.
For the glycolysis stress test, the assay medium was supplemented with 2 mM glutamine. The extracellular acidification rate (ECAR) was detected after the sequential addition of glycolysis stress test reagents, including 30 mM glucose, 5 μM oligomycin, and 100 mM 2-DG. Glycolysis was presented by the ECAR rate after glucose injection. Glycolytic capacity was defined as the ECAR rate after oligomycin addition. The glycolytic reserve was calculated as the ECAR after oligomycin injection minus ECAR after glucose addition.
Statistical analysis
For the colocalization analysis on the images extracted from Image J software, we used Pearson's correlation coefficient (PCC) and Manders' Co-localization Coefficients (MCC) [106].
The binary classification accuracies of various optical metrics were calculated using logistic regression and the leave-one-out cross-validation method in SPSS 26.0 software program (SPSS Inc., USA). The metrics include the redox ratio, NAD(P)H fluorescence lifetime fitting parameters a1, t1, t2, and lipofuscin fluorescence intensity. We used a binomial logistic regression model in SPSS software to calculate the probability of disease prediction. First, we performed a univariate logistic regression analysis to screen for variables that have a statistically significant association with prediabetes or diabetes. The forest plot, which was generated using GraphPad Prism 9.0 software, shows the 95% confidence interval (CI) of the odds ratio (OR) and the P value of the null hypothesis (see Supplementary Materials). Next, we built a binomial logistic regression model with the screened variables to predict the probability of disease using SPSS software. For every single index or combined indices, we plotted their ROC curves and calculated the AUC to evaluate their performance in distinguishing the healthy, prediabetic, and diabetic status of mice. The ROC curve is also used to find out optimal diagnosis thresholds, sensitivity, and specificity for each index.
For plotting the Z-score heatmap, we calculated the mean and standard deviation of 9 optical readouts (ORs) for the control group (Table S4), which included adipocyte's redox ratio (OR1), adipocyte's NAD(P)H fluorescence lifetime fitting parameters -a1, t1, t2 (OR2-4), macrophage's redox ratio (OR5), macrophage's NAD(P)H fluorescence lifetime fitting parameters -a1, t1, t2 (OR6-8) and macrophage's lipofuscin fluorescence intensity (OR9). The Z-scores of optical readouts in the control, prediabetes, and diabetes groups were calculated using SPSS software. We then computed the average Z-scores of different optical readouts in each group (Table S4) and converted them into heatmaps using GraphPad Prism 9.0 software.
To integrate these optical readouts for the differential diagnosis of diabetes stages, we performed the principal component analysis (PCA). The PCA analysis treats each optical readout as an independent dimension and finds the two optimal eigenvectors PC1 and PC2, along which the data points between groups could be best separated. We performed PCA analysis using R software (version 3.1.1) and the omic-share online tool (https://www.omicshare.com/tools/Home/Soft/getsoft/type/index). Results show that PC1 and PC2 vectors are:
PC1 = -0.41 × OR1 + 0.36 × OR2 + 0.16 × OR3 - 0.33 × OR4 - 0.32 × OR5 + 0.32 × OR6 + 0.21 × OR7 + 0.40 × OR8 + 0.39 × OR9
PC2 = 0.074 × OR1 - 0.41 × OR2 + 0.53 × OR3 + 0.57 × OR4 + 0.015 × OR5 + 0.15 × OR6 + 0.26 × OR7 + 0.31 × OR8 + 0.15 × OR9
in HFD and:
PC1 = -0.36 × OR1 + 0.33 × OR2 + 0.019 × OR3 - 0.37 × OR4 - 0.25 × OR5 + 0.37 × OR6 + 0.30 × OR7 + 0.47 × OR8 + 0.34 × OR9
PC2 = 0.058 × OR1 - 0.094 × OR2 + 0.73 × OR3 + 0.43 × OR4 + 0.12 × OR5 + 0.30 × OR6 - 0.12 × OR7 + 0.042 × OR8 + 0.39 × OR9
in HFHSD.
They contribute 49.3% and 48.2% proportion of variance, respectively.
Data were shown as mean ± SD. GraphPad Prism 9.0 software was used for statistical analysis. An unpaired Student's t-test and one-way ANOVA with Tukey's post hoc test was performed to determine the significant differences between two groups and among three groups, respectively. The significant level for hypothesis testing is chosen as 0.05.
Abbreviations
T2DM: type 2 diabetes mellitus; IR: insulin resistanc; CLSs: crown-like structures; PET/CT: positron emission tomography-computed tomography; MRI: magnetic resonance imaging; NAD(P)H: reduced nicotinamide adenine dinucleotide (phosphate); FAD: oxidized flavin adenine dinucleotide; TPFM: two-photon fluorescence microscopy; FLIM: fluorescence lifetime imaging microscopy; ROC: receiver operating characteristic; AUC: area under ROC curve; OXPHOS: oxidative phosphorylation; ETC: electron transport chain; BMDMs: bone marrow-derived macrophages; ILs: interleukins; HFD: high-fat diet; HFHSD: high-fat-high-sucrose diet; HOMA-IR: Homeostasis model assessment-IR; FPG: fasting blood glucose level; FINS: fasting insulin level; FBS: fetal bovine serum; PS: penicillin-streptomycin; PCC: Pearson's correlation coefficient; MCC: Manders' Co-localization Coefficients; SHG: second harmonic generation; TCSPC: time-correlated single-photon counting; IRF: instrument response function; TPM: transcript per million; PCA: principle component analysis; DEGs: differential expression genes; FDR: false discovery rate; GO: gene ontology; OCR: oxygen consumption rate; ECAR: extracellular acidification rate; PSAP: prosaposin; FCCP: fluoro-carbonyl cyanide phenyl-hydrazone; Rot/AA: rotenone plus antimycin; THG: third harmonic generation; OR: odds ratio; CI: confidence interval; PCA: principal component analysis.
Supplementary Material
Supplementary figures and tables, plots.
Acknowledgements
We acknowledge Prof. Ivan Dzhagalov (National Yang Ming Chiao Tung University, Taipei, Taiwan) for providing us with the Lyz2GFP mice.
Funding
This work was funded by University of Macau (File No. MYRG2018-00070-FHS/MYRG-CRG2022-00009-FHS) and the Science and Technology Development Fund, Macau SAR (File No. 122/2016/A3; 018/2017/A1; 0011/2019/AKP; 0120/2020/A3; 0026/2021/A; 0002/2021/AKP; 0007/2021/AKP).
Author contributions
Conceptualization and Experiment Design: Tzu-Ming Liu, Ja-An Annie Ho, Tzung-Dau Wang, Liping Chen
Animal Study: Liping Chen
Spectra Measurement: Liping Chen
Biochemical Assay: Liping Chen
Histopathology: Liping Chen, Moxin Li, Lidong Du, Pei-Chun Wu, Tzung-Dau Wang
Data Process: Liping Chen, Moxin Li, Yue Li, Lun-Zhang Guo, Yueh-Hsun Chuang
Bioinformatics: Guihui Qin
Writing (original draft): Liping Chen
Writing (review & editing): Tzu-Ming Liu, Yuhong Liu, Xioyan Wang, Weiming Zheng
Funding: Tzu-Ming Liu
All authors have agreed on the final version of the manuscript.
Data Sharing Statement
All results generated or analyzed during this study are included. Data can be made available upon request to the corresponding authors.
Competing Interests
The authors have declared that no competing interest exists.
References
1. Roglic GJIJoND. WHO Global report on diabetes: a summary. 2016; 1: 3.
2. Ogurtsova K, da Rocha Fernandes J, Huang Y, Linnenkamp U, Guariguata L, Cho NH. et al. IDF diabetes atlas: global estimates for the prevalence of diabetes for 2015 and 2040. 2017; 128: 40-50.
3. Classification and diagnosis of diabetes. standards of medical care in diabetes—2019. 2019; 42: S13-S28.
4. Brod M, Hammer M, Christensen T, Lessard S, Bushnell DM. Understanding and assessing the impact of treatment in diabetes: the treatment-related impact measures for diabetes and devices (TRIM-diabetes and TRIM-diabetes device). Health Qual Life Outcomes. 2009;7:83
5. Tabák AG, Herder C, Rathmann W, Brunner EJ, Kivimäki M. Prediabetes: a high-risk state for diabetes development. Lancet. 2012;379:2279-90
6. Wondmkun YT. Obesity, insulin resistance, and type 2 diabetes: associations and therapeutic implications. Diabetes Metab Syndr Obes. 2020;13:3611-6
7. DeFronzo RA, Tobin JD, Andres R. Glucose clamp technique: a method for quantifying insulin secretion and resistance. Am J Physiol. 1979;237:E214-23
8. Shen SW, Reaven GM, Farquhar JW. Comparison of impedance to insulin-mediated glucose uptake in normal subjects and in subjects with latent diabetes. J Clin Invest. 1970;49:2151-60
9. Dalla Man C, Caumo A, Basu R, Rizza R, Toffolo G, Cobelli C. Minimal model estimation of glucose absorption and insulin sensitivity from oral test: validation with a tracer method. Am J Physiol Endocrinol Metab. 2004;287:E637-43
10. Smith U, Kahn BB. Adipose tissue regulates insulin sensitivity: role of adipogenesis, de novo lipogenesis and novel lipids. J Intern Med. 2016;280:465-75
11. Makki K, Froguel P, Wolowczuk I. Adipose tissue in obesity-related inflammation and insulin resistance: cells, cytokines, and chemokines. ISRN Inflamm. 2013;2013:139239
12. Kusminski CM, Scherer PE. Mitochondrial dysfunction in white adipose tissue. Trends Endocrinol Metab. 2012;23:435-43
13. Gao CL, Zhu C, Zhao YP, Chen XH, Ji CB, Zhang CM. et al. Mitochondrial dysfunction is induced by high levels of glucose and free fatty acids in 3T3-L1 adipocytes. Mol Cell Endocrinol. 2010;320:25-33
14. Cinti S, Mitchell G, Barbatelli G, Murano I, Ceresi E, Faloia E. et al. Adipocyte death defines macrophage localization and function in adipose tissue of obese mice and humans. J Lipid Res. 2005;46:2347-55
15. Kim K, Huang S, Fletcher LA, O'Mara AE, Tal I, Brychta RJ. et al. Whole body and regional quantification of active human brown adipose tissue using 18F-FDG PET/CT. J Vis Exp. 2019
16. Machann J, Thamer C, Schnoedt B, Haap M, Haring HU, Claussen CD. et al. Standardized assessment of whole body adipose tissue topography by MRI. J Magn Reson Imaging. 2005;21:455-62
17. Skala MC, Riching KM, Gendron-Fitzpatrick A, Eickhoff J, Eliceiri KW, White JG. et al. In vivo multiphoton microscopy of NADH and FAD redox states, fluorescence lifetimes, and cellular morphology in precancerous epithelia. Proc Natl Acad Sci U S A. 2007;104:19494-9
18. Quinn KP, Sridharan GV, Hayden RS, Kaplan DL, Lee K, Georgakoudi I. Quantitative metabolic imaging using endogenous fluorescence to detect stem cell differentiation. Sci Rep. 2013;3:3432
19. Alfonso-García A, Smith TD, Datta R, Luu TU, Gratton E, Potma EO. et al. Label-free identification of macrophage phenotype by fluorescence lifetime imaging microscopy. J Biomed Opt. 2016;21:046005
20. Alonzo CA, Karaliota S, Pouli D, Liu Z, Karalis KP, Georgakoudi I. Two-photon excited fluorescence of intrinsic fluorophores enables label-free assessment of adipose tissue function. Sci Rep. 2016;6:31012
21. He S, Wei X, Qin Z, Chen C, Wu Z, Qu JY. In vivo study of metabolic dynamics and heterogeneity in brown and beige fat by label-free multiphoton redox and fluorescence lifetime microscopy. J Biophotonics. 2020;13:e201960057
22. Datta R, Alfonso-García A, Cinco R, Gratton E. Fluorescence lifetime imaging of endogenous biomarker of oxidative stress. Sci Rep. 2015;5:9848
23. Borghi F, Silva C, da Silva PC, Ferrucci DL, Morais CL, Conceição-Vertamatti AG. et al. The influence of hypertensive environment on adipose tissue remodeling measured by fluorescence lifetime imaging in spontaneously hypertensive rats. Mol Cell Endocrinol. 2020;506:110758
24. Ganesan G, Warren RV, Leproux A, Compton M, Cutler K, Wittkopp S. et al. Diffuse optical spectroscopic imaging of subcutaneous adipose tissue metabolic changes during weight loss. Int J Obes (Lond). 2016;40:1292-300
25. Vida C, de Toda IM, Cruces J, Garrido A, Gonzalez-Sanchez M, De la Fuente M. Role of macrophages in age-related oxidative stress and lipofuscin accumulation in mice. Redox Biol. 2017;12:423-37
26. Saif M, Kwanten WJ, Carr JA, Chen IX, Posada JM, Srivastava A. et al. Non-invasive monitoring of chronic liver disease via near-infrared and shortwave-infrared imaging of endogenous lipofuscin. Nat Biomed Eng. 2020;4:801-13
27. Riew TR, Kim HL, Choi JH, Jin X, Shin YJ, Lee MY. Progressive accumulation of autofluorescent granules in macrophages in rat striatum after systemic 3-nitropropionic acid: a correlative light- and electron-microscopic study. Histochem Cell Biol. 2017;148:517-28
28. Cancello R, Henegar C, Viguerie N, Taleb S, Poitou C, Rouault C. et al. Reduction of macrophage infiltration and chemoattractant gene expression changes in white adipose tissue of morbidly obese subjects after surgery-induced weight loss. Diabetes. 2005;54:2277-86
29. Anderson LS, Reynolds MB, Rivara KR, Miller LS, Simon SI. A mouse model to assess innate immune response to staphylococcus aureus infection. J Vis Exp. 2019
30. Sparrow JR, Wu Y, Nagasaki T, Yoon KD, Yamamoto K, Zhou J. Fundus autofluorescence and the bisretinoids of retina. Photochem Photobiol Sci. 2010;9:1480-9
31. Munichor M, Kerner H, Cohen H, Iancu TC. The lipofuscin-iron association in pigmentosis tubae. Ultrastruct Pathol. 1997;21:273-80
32. Clark KG, Davidson WM. Bone marrow lipofuscin. J Clin Pathol. 1972;25:947-50
33. Brunk UT, Terman A. Lipofuscin: mechanisms of age-related accumulation and influence on cell function. Free Radic Biol Med. 2002;33:611-9
34. Yan LJ. Redox imbalance stress in diabetes mellitus: role of the polyol pathway. Animal Model Exp Med. 2018;1:7-13
35. Wu J, Luo X, Thangthaeng N, Sumien N, Chen Z, Rutledge MA. et al. Pancreatic mitochondrial complex I exhibits aberrant hyperactivity in diabetes. Biochem Biophys Rep. 2017;11:119-29
36. Wu J, Jin Z, Yan LJ. Redox imbalance and mitochondrial abnormalities in the diabetic lung. Redox Biol. 2017;11:51-9
37. Sung HJ, Ma W, Wang PY, Hynes J, O'Riordan TC, Combs CA. et al. Mitochondrial respiration protects against oxygen-associated DNA damage. Nat Commun. 2010;1:5
38. Karamanlidis G, Lee CF, Garcia-Menendez L, Kolwicz SC Jr, Suthammarak W, Gong G. et al. Mitochondrial complex I deficiency increases protein acetylation and accelerates heart failure. Cell Metab. 2013;18:239-50
39. Evers M, Salma N, Osseiran S, Casper M, Birngruber R, Evans CL. et al. Enhanced quantification of metabolic activity for individual adipocytes by label-free FLIM. Sci Rep. 2018;8:8757
40. Varone A, Xylas J, Quinn KP, Pouli D, Sridharan G, McLaughlin-Drubin ME. et al. Endogenous two-photon fluorescence imaging elucidates metabolic changes related to enhanced glycolysis and glutamine consumption in precancerous epithelial tissues. Cancer Res. 2014;74:3067-75
41. Quinn KP, Sridharan GV, Hayden RS, Kaplan DL, Lee K, Georgakoudi I. Quantitative metabolic imaging using endogenous fluorescence to detect stem cell differentiation. Sci Rep. 2013;3:3432
42. Stuntz E, Gong Y, Sood D, Liaudanskaya V, Pouli D, Quinn KP. et al. Endogenous two-photon excited fluorescence imaging characterizes neuron and astrocyte metabolic responses to manganese toxicity. Sci Rep. 2017;7:1041
43. Stringari C, Edwards RA, Pate KT, Waterman ML, Donovan PJ, Gratton E. Metabolic trajectory of cellular differentiation in small intestine by phasor fluorescence lifetime microscopy of NADH. Sci Rep. 2012;2:568
44. Schütt F, Bergmann M, Holz FG, Kopitz J. Isolation of intact lysosomes from human RPE cells and effects of A2-E on the integrity of the lysosomal and other cellular membranes. Graefes Arch Clin Exp Ophthalmol. 2002;240:983-8
45. Tseng WA, Thein T, Kinnunen K, Lashkari K, Gregory MS, D'Amore PA. et al. NLRP3 inflammasome activation in retinal pigment epithelial cells by lysosomal destabilization: implications for age-related macular degeneration. Invest Ophthalmol Vis Sci. 2013;54:110-20
46. Anderson OA, Finkelstein A, Shima DT. A2E induces IL-1ß production in retinal pigment epithelial cells via the NLRP3 inflammasome. PLoS One. 2013;8:e67263
47. Borcherding N, Jia W, Giwa R, Field RL, Moley JR, Kopecky BJ. et al. Dietary lipids inhibit mitochondria transfer to macrophages to divert adipocyte-derived mitochondria into the blood. Cell Metab. 2022;34:1499-513.e8
48. Tuomilehto J, Lindström J, Eriksson JG, Valle TT, Hämäläinen H, Ilanne-Parikka P. et al. Prevention of type 2 diabetes mellitus by changes in lifestyle among subjects with impaired glucose tolerance. N Engl J Med. 2001;344:1343-50
49. Knowler WC, Barrett-Connor E, Fowler SE, Hamman RF, Lachin JM, Walker EA. et al. Reduction in the incidence of type 2 diabetes with lifestyle intervention or metformin. N Engl J Med. 2002;346:393-403
50. Phillips LS, Ratner RE, Buse JB, Kahn SE. We can change the natural history of type 2 diabetes. Diabetes Care. 2014;37:2668-76
51. Scherer PE. Adipose tissue: from lipid storage compartment to endocrine organ. Diabetes. 2006;55:1537-45
52. Kershaw EE, Flier JS. Adipose tissue as an endocrine organ. J Clin Endocrinol Metab. 2004;89:2548-56
53. Ravussin Y, Leibel RL, Ferrante AW Jr. A missing link in body weight homeostasis: the catabolic signal of the overfed state. Cell Metab. 2014;20:565-72
54. Scherer PE. The multifaceted roles of adipose tissue-therapeutic targets for diabetes and beyond: the 2015 banting lecture. Diabetes. 2016;65:1452-61
55. Katz ML, Robison WG Jr. What is lipofuscin? Defining characteristics and differentiation from other autofluorescent lysosomal storage bodies. Arch Gerontol Geriatr. 2002;34:169-84
56. Chen YS, Liu HM, Lee TY. Ursodeoxycholic acid regulates hepatic energy homeostasis and white adipose tissue macrophages polarization in leptin-deficiency obese mice. Cells. 2019;8:253
57. Yan Y, Xing F, Cao J, Hu Y, Li L, Gao Z. et al. Fluorescence intensity and lifetime imaging of lipofuscin-like autofluorescence for label-free predicting clinical drug response in cancer. Redox Biol. 2023;59:102578
58. Xing F, Liu YC, Huang S, Lyu X, Su SM, Chan UI. et al. Accelerating precision anti-cancer therapy by time-lapse and label-free 3D tumor slice culture platform. Theranostics. 2021;11:9415-30
59. Nakae Y, Stoward PJ, Shono M, Matsuzaki T. Most apoptotic cells in mdx diaphragm muscle contain accumulated lipofuscin. Histochem Cell Biol. 2001;115:205-14
60. Korać A, Vereć M, Davidović V. Insulin-induced iron loading in the rat brown adipose tissue: histochemical and electron-microscopic study. Eur J Histochem. 2003;47:241-4
61. Hendriks HR, Eestermans IL. Phagocytosis and lipofuscin accumulation in lymph node macrophages. Mech Ageing Dev. 1986;35:161-7
62. Matacchione G, Perugini J, Di Mercurio E, Sabbatinelli J, Prattichizzo F, Senzacqua M. et al. Senescent macrophages in the human adipose tissue as a source of inflammaging. GeroScience. 2022;44:1941-60
63. Shirakawa K, Yan X, Shinmura K, Endo J, Kataoka M, Katsumata Y. et al. Obesity accelerates T cell senescence in murine visceral adipose tissue. J Clin Invest. 2016;126:4626-39
64. Zhao HL, Sui Y, He L, Guan J, Xiao SJ, Zhong DR. et al. Lipid partitioning after uninephrectomy. Acta Diabetol. 2011;48:317-28
65. Shimobayashi M, Albert V, Woelnerhanssen B, Frei IC, Weissenberger D, Meyer-Gerspach AC. et al. Insulin resistance causes inflammation in adipose tissue. J Clin Invest. 2018;128:1538-50
66. Patsouris D, Li PP, Thapar D, Chapman J, Olefsky JM, Neels JG. Ablation of CD11c-positive cells normalizes insulin sensitivity in obese insulin resistant animals. Cell Metab. 2008;8:301-9
67. Kanda H, Tateya S, Tamori Y, Kotani K, Hiasa K, Kitazawa R. et al. MCP-1 contributes to macrophage infiltration into adipose tissue, insulin resistance, and hepatic steatosis in obesity. J Clin Invest. 2006;116:1494-505
68. Weisberg SP, McCann D, Desai M, Rosenbaum M, Leibel RL, Ferrante AW Jr. Obesity is associated with macrophage accumulation in adipose tissue. J Clin Invest. 2003;112:1796-808
69. Wascher TC, Lindeman JH, Sourij H, Kooistra T, Pacini G, Roden M. Chronic TNF-α neutralization does not improve insulin resistance or endothelial function in "healthy" men with metabolic syndrome. Mol Med. 2011;17:189-93
70. Stanley TL, Zanni MV, Johnsen S, Rasheed S, Makimura H, Lee H. et al. TNF-alpha antagonism with etanercept decreases glucose and increases the proportion of high molecular weight adiponectin in obese subjects with features of the metabolic syndrome. J Clin Endocrinol Metab. 2011;96:E146-50
71. Paquot N, Castillo MJ, Lefèbvre PJ, Scheen AJ. No increased insulin sensitivity after a single intravenous administration of a recombinant human tumor necrosis factor receptor: Fc fusion protein in obese insulin-resistant patients. J Clin Endocrinol Metab. 2000;85:1316-9
72. Wernstedt Asterholm I, Tao C, Morley TS, Wang QA, Delgado-Lopez F, Wang ZV. et al. Adipocyte inflammation is essential for healthy adipose tissue expansion and remodeling. Cell Metab. 2014;20:103-18
73. Petersen KF, Dufour S, Befroy D, Garcia R, Shulman GI. Impaired mitochondrial activity in the insulin-resistant offspring of patients with type 2 diabetes. N Engl J Med. 2004;350:664-71
74. Befroy DE, Petersen KF, Dufour S, Mason GF, de Graaf RA, Rothman DL. et al. Impaired mitochondrial substrate oxidation in muscle of insulin-resistant offspring of type 2 diabetic patients. Diabetes. 2007;56:1376-81
75. Petersen KF, Befroy D, Dufour S, Dziura J, Ariyan C, Rothman DL. et al. Mitochondrial dysfunction in the elderly: possible role in insulin resistance. Science. 2003;300:1140-2
76. Heinonen S, Jokinen R, Rissanen A, Pietiläinen KH. White adipose tissue mitochondrial metabolism in health and in obesity. Obes Rev. 2020;21:e12958
77. Sutherland LN, Capozzi LC, Turchinsky NJ, Bell RC, Wright DC. Time course of high-fat diet-induced reductions in adipose tissue mitochondrial proteins: potential mechanisms and the relationship to glucose intolerance. Am J Physiol Endocrinol Metab. 2008;295:E1076-83
78. Sangwung P, Petersen KF, Shulman GI, Knowles JW. Mitochondrial dysfunction, insulin resistance, and potential genetic implications. Endocrinology. 2020 161
79. Shamir M, Bar-On Y, Phillips R, Milo R. SnapShot: timescales in cell biology. Cell. 2016;164:1302.e1
80. Pouli D, Thieu HT, Genega EM, Baecher-Lind L, House M, Bond B. et al. Label-free, high-resolution optical metabolic imaging of human cervical precancers reveals potential for intraepithelial neoplasia diagnosis. Cell Rep Med. 2020;1:100017
81. Kolenc OI, Quinn KP. Evaluating cell metabolism through autofluorescence imaging of NAD(P)H and FAD. Antioxid Redox Signal. 2019;30:875-89
82. Heaster TM, Humayun M, Yu J, Beebe DJ, Skala MC. Autofluorescence imaging of 3D tumor-macrophage microscale cultures resolves spatial and temporal dynamics of macrophage metabolism. Cancer Res. 2020;80:5408-23
83. Esteve Ràfols M. Adipose tissue: cell heterogeneity and functional diversity. Endocrinol Nutr. 2014;61:100-12
84. Wu X, Guo LZ, Liu YH, Liu YC, Yang PL, Leung YS. et al. Plasma riboflavin fluorescence as a diagnostic marker of mesenteric ischemia-reperfusion injury in rats. Thromb Res. 2023;223:146-54
85. Dimastromatteo J, Brentnall T, Kelly KA. Imaging in pancreatic disease. Nat Rev Gastroenterol Hepatol. 2017;14:97-109
86. Jorge-Galarza E, Medina-Urrutia A, Posadas-Sanchez R, Posadas-Romero C, Cardoso-Saldana G, Vargas-Alarcon G. et al. Adipose tissue dysfunction increases fatty liver association with pre diabetes and newly diagnosed type 2 diabetes mellitus. Diabetol Metab Syndr. 2016;8:73
87. Storz C, Heber SD, Rospleszcz S, Machann J, Sellner S, Nikolaou K. et al. The role of visceral and subcutaneous adipose tissue measurements and their ratio by magnetic resonance imaging in subjects with prediabetes, diabetes and healthy controls from a general population without cardiovascular disease. Br J Radiol. 2018;91:20170808
88. Iacobellis G. Imaging of visceral adipose tissue: an emerging diagnostic tool and therapeutic target. Curr Drug Targets Cardiovasc Haematol Disord. 2005;5:345-53
89. Kessels K, Cramer MJ, Velthuis B. Epicardial adipose tissue imaged by magnetic resonance imaging: an important risk marker of cardiovascular disease. Heart. 2006;92:962
90. Wang S, Ren WX, Hou JT, Won M, An J, Chen X. et al. Fluorescence imaging of pathophysiological microenvironments. Chem Soc Rev. 2021;50:8887-902
91. Obstarczyk P, Lipok M, Grelich-Mucha M, Samoć M, Olesiak-Bańska J. Two-photon excited polarization-dependent autofluorescence of amyloids as a label-free method of fibril organization imaging. J Phys Chem Lett. 2021;12:1432-7
92. Goh GB, Leow WQ, Liang S, Wan WK, Lim TKH, Tan CK. et al. Quantification of hepatic steatosis in chronic liver disease using novel automated method of second harmonic generation and two-photon excited fluorescence. Sci Rep. 2019;9:2975
93. Liu GS, Kong Y, Wang Y, Luo Y, Fan X, Xie X. et al. Microneedles for transdermal diagnostics: Recent advances and new horizons. Biomaterials. 2020;232:119740
94. Faust N, Varas F, Kelly LM, Heck S, Graf T. Insertion of enhanced green fluorescent protein into the lysozyme gene creates mice with green fluorescent granulocytes and macrophages. Blood. 2000;96:719-26
95. Xia Z, Sniderman AD, Cianflone K. Acylation-stimulating protein (ASP) deficiency induces obesity resistance and increased energy expenditure in ob/ob mice. J Biol Chem. 2002;277:45874-9
96. Au - Ying W, Au - Cheruku PS, Au - Bazer FW, Au - Safe SH, Au - Zhou B. Investigation of macrophage polarization using bone marrow derived macrophages. J Vis Exp. 2013: e50323.
97. Li W, Katz BP, Spinola SM. Haemophilus ducreyi-induced interleukin-10 promotes a mixed M1 and M2 activation program in human macrophages. Infect Immun. 2012;80:4426-34
98. Vogel DY, Glim JE, Stavenuiter AW, Breur M, Heijnen P, Amor S. et al. Human macrophage polarization in vitro: maturation and activation methods compared. Immunobiology. 2014;219:695-703
99. Mosser DM, Edwards JP. Exploring the full spectrum of macrophage activation. Nat Rev Immunol. 2008;8:958-69
100. Borkar R, Wang X, Zheng D, Miao Z, Zhang Z, Li E. et al. Human ESC-derived MSCs enhance fat engraftment by promoting adipocyte reaggregation, secreting CCL2 and mobilizing macrophages. Biomaterials. 2021;272:120756
101. Lin HH, Faunce DE, Stacey M, Terajewicz A, Nakamura T, Zhang-Hoover J. et al. The macrophage F4/80 receptor is required for the induction of antigen-specific efferent regulatory T cells in peripheral tolerance. J Exp Med. 2005;201:1615-25
102. Lee J, Xu Y, Saidi L, Xu M, Zinsmaier K, Ye Y. Abnormal triaging of misfolded proteins by adult neuronal ceroid lipofuscinosis-associated DNAJC5/CSPα mutants causes lipofuscin accumulation. Autophagy. 2023;19:204-23
103. Tyynelä J, Palmer DN, Baumann M, Haltia M. Storage of saposins A and D in infantile neuronal ceroid-lipofuscinosis. FEBS Lett. 1993;330:8-12
104. Skala MC, Riching KM, Gendron-Fitzpatrick A, Eickhoff J, Eliceiri KW, White JG. et al. In vivo multiphoton microscopy of NADH and FAD redox states, fluorescence lifetimes, and cellular morphology in precancerous epithelia. Proc Natl Acad Sci U S A. 2007;104:19494-9
105. Calderon-Dominguez M, Alcalá M, Sebastián D, Zorzano A, Viana M, Serra D. et al. Brown adipose tissue bioenergetics: a new methodological approach. Adv Sci (Weinh). 2017;4:1600274
106. Dunn KW, Kamocka MM, McDonald JH. A practical guide to evaluating colocalization in biological microscopy. Am J Physiol Cell Physiol. 2011;300:C723-42
Author contact
![]() Corresponding authors: Tzu-Ming Liu, tmliuedu.mo; Ja-An Annie Ho, jahoedu.tw; Tzung-Dau Wang, tdwangedu.tw; Xiaoyan Wang, xiaoyanwang85com. Address: Faculty of Health Sciences, University of Macau, Avenida da Universidade, Taipa, Macao SAR, China. TEL: +853-8822-4693.
Corresponding authors: Tzu-Ming Liu, tmliuedu.mo; Ja-An Annie Ho, jahoedu.tw; Tzung-Dau Wang, tdwangedu.tw; Xiaoyan Wang, xiaoyanwang85com. Address: Faculty of Health Sciences, University of Macau, Avenida da Universidade, Taipa, Macao SAR, China. TEL: +853-8822-4693.