Impact Factor
- Issue 14; 2026
- Issue 13; 2026
- Issue 12; 2026
- Issue 11; 2026
- Issue 10; 2026
- Volume 16; 2026
- Advance Articles
- Past Issues
- Cover Images
- Cover Suggestion
- Index & Coverage
- Special Issues
Introduction
Methods
MR protocols
Results
Discussion
Conclusions
Abbreviations
Acknowledgements
References
International Journal of Biological Sciences
International Journal of Medical Sciences
 Global reach, higher impact

Theranostics 2023; 13(4):1217-1234. doi:10.7150/thno.77041 This issue Cite
Research Paper
First in vivo fluorine-19 magnetic resonance imaging of the multiple sclerosis drug siponimod
Ludger Starke1,2, Jason M. Millward1,3, Christian Prinz1,4, Fatima Sherazi1, Helmar Waiczies5, Christoph Lippert2, Marc Nazaré6, Friedemann Paul3,7, Thoralf Niendorf1,3, Sonia Waiczies1,3 ![]()
1. Max-Delbrück-Center for Molecular Medicine in the Helmholtz Association (MDC), Berlin Ultrahigh Field Facility, Berlin, Germany
2. Hasso Plattner Institute for Digital Engineering, University of Potsdam, Germany
3. Experimental and Clinical Research Center, a joint cooperation between the Charité Universitätsmedizin Berlin and the Max Delbrück Center for Molecular Medicine in the Helmholtz Association, Berlin, Germany
4. SRH Fernhochschule - The Mobile University, Riedlingen, Germany
5. MRI.TOOLS GmbH, Berlin, Germany
6. Medicinal Chemistry, Leibniz-Institut fϋr Molekulare Pharmakologie (FMP), Berlin, Germany
7. Charité - Universitätsmedizin Berlin, corporate member of Freie Universität Berlin, Humboldt-Universität zu Berlin, and Berlin Institute of Health (BIH), Berlin, Germany
Received 2022-7-11; Accepted 2023-1-10; Published 2023-2-5
Abstract

Theranostic imaging methods could greatly enhance our understanding of the distribution of CNS-acting drugs in individual patients. Fluorine-19 magnetic resonance imaging (19F MRI) offers the opportunity to localize and quantify fluorinated drugs non-invasively, without modifications and without the application of ionizing or other harmful radiation. Here we investigated siponimod, a sphingosine 1-phosphate (S1P) receptor antagonist indicated for secondary progressive multiple sclerosis (SPMS), to determine the feasibility of in vivo 19F MR imaging of a disease modifying drug.
Methods: The 19F MR properties of siponimod were characterized using spectroscopic techniques. Four MRI methods were investigated to determine which was the most sensitive for 19F MR imaging of siponimod under biological conditions. We subsequently administered siponimod orally to 6 mice and acquired 19F MR spectra and images in vivo directly after administration, and in ex vivo tissues.
Results: The 19F transverse relaxation time of siponimod was 381 ms when dissolved in dimethyl sulfoxide, and substantially reduced to 5 ms when combined with serum, and to 20 ms in ex vivo liver tissue. Ultrashort echo time (UTE) imaging was determined to be the most sensitive MRI technique for imaging siponimod in a biological context and was used to map the drug in vivo in the stomach and liver. Ex vivo images in the liver and brain showed an inhomogeneous distribution of siponimod in both organs. In the brain, siponimod accumulated predominantly in the cerebrum but not the cerebellum. No secondary 19F signals were detected from metabolites. From a translational perspective, we found that acquisitions done on a 3.0 T clinical MR scanner were 2.75 times more sensitive than acquisitions performed on a preclinical 9.4 T MR setup when taking changes in brain size across species into consideration and using equivalent relative spatial resolution.
Conclusion: Siponimod can be imaged non-invasively using 19F UTE MRI in the form administered to MS patients, without modification. This study lays the groundwork for more extensive preclinical and clinical investigations. With the necessary technical development, 19F MRI has the potential to become a powerful theranostic tool for studying the time-course and distribution of CNS-acting drugs within the brain, especially during pathology.
Keywords: Siponimod, Multiple Sclerosis, MRI, Fluorine, Molecular Imaging
Introduction
Siponimod is one of the few drugs that show efficacy in secondary progressive multiple sclerosis (SPMS) patients [1]. It is a next-generation sphingosine 1-phosphate receptor 1 (S1P1) and receptor 5 (S1P5) modulator. Siponimod is an oral treatment and is administered at a daily maintenance dose of 2 mg in SPMS patients [1]. S1P1 receptor modulation reduces the egress of inflammatory lymphocytes from lymph nodes into the circulation, and infiltration into the central nervous system (CNS), where they cause MS pathology [2, 3]. Several reports suggest that the therapeutic role of siponimod goes beyond inhibiting CNS inflammation via peripheral immunomodulatory mechanisms [4-6]. Siponimod has potential S1P1 and S1P5 targets within the CNS, which might provide a mechanism for additional therapeutic action on brain pathology directly [7, 8].
CNS-acting drugs must cross the blood brain barrier (BBB) to exert their therapeutic effect [9]. The BBB provides an important protective mechanism and controls the crossing of cells and toxins from the circulation into the CNS [10], but also presents a formidable challenge for delivery of therapeutic agents [11]. The introduction of fluorine atoms enhances lipophilicity [12], promoting passive BBB permeation [13] and thus treatment efficacy [14, 15]. Most CNS-acting small molecules such as neuroleptics and antidepressants are fluorinated, commonly with a trifluoromethyl (CF3) group, to facilitate BBB crossing [15, 16]. Bioisosteric replacement with fluorinated moieties continues to be seminal in medicinal chemistry for drug discovery [15, 17] as well as tumor imaging [18].
Quantifying drug levels non-invasively would be instrumental for studying drug distribution especially in inaccessible organs such as the brain. Fluorine-19 (19F) magnetic resonance imaging holds the promise for mapping fluorinated drugs in the CNS. Since the amount of endogenous MR-detectable 19F atoms in the body is negligible, 19F MR imaging (MRI) and spectroscopy (MRS) offer a highly specific detection of administered fluorinated substances. Recently we employed 19F MRS to detect the fluorinated drug teriflunomide [19], an anti-inflammatory drug used for treating relapsing-remitting multiple sclerosis (RRMS).
Therapeutic actions and adverse reactions [20] can be attributed to the dose of drug accumulating in vulnerable organs. Drug levels are typically measured in blood or urine, even in the cerebrospinal fluid when clinically warranted, but this does not accurately reflect the potentially unevenly distributed drug levels within CNS tissue. Pharmacokinetic imaging is commonly conducted using autoradiography and single-photon emission computed tomography (SPECT) [21], which involve radioactive labelling methods that are unsuitable for routine clinical practice. 19F MRI is an additional tool for pharmacokinetic imaging that does not involve harmful ionizing radiation, making this approach particularly appealing [22, 23]. A non-invasive method for localizing and quantifying fluorinated drugs such as siponimod in relevant organs during disease could allow for the integration of imaging and therapy, to establish a theranostic strategy that can tailor treatment to individual patient responses and pharmacokinetics [24, 25].
Many 19F MR applications have been conceptualized since the 1970s [26, 27]. MRI of fluorinated drugs has been revisited multiple times, but low in vivo tissue concentrations have limited the number of successful applications [28]. 19F MR imaging in the CNS has been previously achieved for drugs that are administered in very high dose regimes such as fluorinated anesthetics [29, 30] and for cytotoxic chemotherapies [31, 32]. Disease-modifying drugs (DMDs) such as siponimod are typically present in much lower quantities and have not been imaged by 19F MRI thus far. Especially within the CNS, where only low drug levels are expected, low signal-to-noise ratios (SNR) pose a great challenge. Until now, only localized [33] or non-localized [19] 19F MR spectroscopy data - but not imaging - have been reported for other fluorinated drugs. 19F MRI will be an invaluable tool to clarify CNS acting mechanisms if these sensitivity limitations can be overcome.
In this study we characterized the MR properties of siponimod and investigated MR methods tailored for the acquisition of short T2/T2* siponimod. We identified ultrashort echo time (UTE) MRI as the most sensitive method to acquire siponimod images under biological conditions and show the feasibility of localizing siponimod with in vivo 19F MRI in a mouse model. For the first time, we could image and localize the signal of siponimod in vivo in the stomach and liver, after oral administration. Ex vivo investigations revealed siponimod in the kidney, brain, and thymus, even after a single dose. We acquired 3D images of siponimod in liver and brain ex vivo and observed varying levels of the drug within the tissue. To investigate the potential for preclinical in vivo imaging in the brain and for future clinical translation, we also acquired images with shortened protocols at lower spatial resolution, and compare the sensitivity achieved with state-of-the-art radio-frequency (RF) hardware for imaging the mouse brain at 9.4 T versus imaging the human brain at 3.0 T, a commonly used clinical field strength. Finally, we estimated the concentration of siponimod reached in a mouse brain.
Methods
Siponimod and phantoms
Siponimod (BAF312) was purchased from MedChemExpress LLC (New Jersey, USA) and dissolved in 100% dimethylsulfoxide (DMSO, Roth; Karlsruhe, Germanyl) at a concentration of 58 mM (29.4 mg/ml) or in 100% human serum (from male type AB plasma, Sigma-Aldrich, H4522) at a concentration of 6.8 mM or 3.9 mM (3.5 mg/ml or 2 mg/ml) for in vitro experiments, and formulated in 0.6% carboxymethylcellulose (CMC, Sigma, Schnelldorf, Germany) as stabilizer and suspending agent at a concentration of 19.4 mM (10 mg/ml) for in vivo administration. The latter was formulated using a vortex mixer and kept at body temperature prior to application. The MR properties of siponimod were characterized in 2 ml phantoms: syringes (inner diameter (ID) of 10 mm) equipped with stopper closing-cones (B. Braun, Melsungen, Germany) and filled with either the solution in DMSO or in serum (6.8 mM). For continuous, homogenous heating at physiological temperature (PT, 37 °C), phantoms were inserted into a coil of tubing with circulating water; temperature was monitored with a fiber-optic sensor and controlled with a remote water bath. The same phantom was employed for the comparison of RARE, FLASH, bSSFP and UTE pulse sequences. A 10 ml syringe phantom (ID = 16 mm) with 3.9 mM siponimod dissolved in serum was used to determine the relative sensitivity of the ex vivo liver and brain imaging protocols and as a reference tube for determining the siponimod concentration.
To compare between imaging a human brain at 3.0 T and a mouse brain at 9.4 T, two phantoms mimicking the respective loading characteristics were built. An outer compartment was filled with a mixture of distilled water, sucrose and NaCl matching the electromagnetic properties of gray matter (40%) and white matter (60%) at 123 MHz or 400 MHz (123 MHz: 1041 g sucrose and 25 g NaCl, 400 MHz: 1420 g sucrose and 43 g NaCl per 1l water) [34, 35]. A smaller inner compartment was filled with distilled water only, to provide a volume with identical proton density. For both phantoms, 0.073% CuSO4 was added to both compartments to shorten T1 relaxation and prevent bacterial growth. For imaging at 3.0 T, we used a 2800 ml sphere with a 15 ml polypropylene conical tube (ID = 14 mm, Corning Science México, Raynosa, México) insert. At 9.4 T, we used a syringe (ID = 16 mm, B. Braun, Melsungen, Germany) filled to 12 ml with a glass NMR tube (ID = 3 mm, Wilmad-Labglass, Vineland, USA) as an insert.
Animal experiments
All animal experiments were conducted in accordance with procedures approved by the Animal Welfare Department of the State Office of Health and Social Affairs Berlin (LAGeSo) and conformed to guidelines to minimize discomfort to animals (86/609/EEC).
In vivo experiments
Heathy male (n = 5, designated M1, M2, M4-M6) and female (n = 1, M3) C57BL/6 mice (4-6 months old) were anesthetized by intraperitoneal (IP) injection using a mixture of xylazine (5 mg/kg, CP Pharma, Burgdorf, Germany) and ketamine (50 mg/kg, WDT, Garbsen, Germany) maintained by an IP catheter line. After achieving the appropriate level of anesthesia, an intubation catheter was inserted into the esophagus of the mouse for later administration of siponimod suspension (the distance to the stomach was measured and marked on the catheter prior to insertion). Mice were transferred to a temperature-regulated animal holder and supplied with pressurized air (30%) and O2 (70%). A respiration probe and body temperature sensors (Neoptix, OmniLink version 1.15, Omniflex, Neoptix, Québec, Canada) were connected for continuous monitoring of physiological parameters and the body temperature was maintained throughout the measurements. The animal holder was inserted into the MR scanner bore and Cryogenic Radiofrequency Probe (CRP, see below). A single dose of siponimod (4 mg in 400 μl CMC, ≈133 mg/kg body weight) was administered remotely to each mouse while in the scanner during the MR measurements (see below).
Preparation of ex vivo samples
Mice were transcardially perfused with 20 ml phosphate-buffered saline (PBS) followed by 20 ml paraformaldehyde (4% PFA, Santa Cruz Biotechnology, Inc., Dallas, TX, USA) at the end of each in vivo experiment [36]. Ex vivo tissues including liver, kidneys, brain, and thymus were extracted and stored in tubes filled with 4% PFA. After fixation, the tissues were embedded in 2% agarose in 15 ml conical centrifuge tubes (liver, kidneys) or 5 ml Eppendorf tubes (brain, thymus) to prevent movement during the MR acquisition. All samples were stored at 4 °C.
MR hardware
With the exception of sensitivity comparison measurements at 3.0 T, all MR experiments were performed on a Biospec 9.4 T horizontal bore MR scanner (Bruker Biospin, Ettlingen, Germany). We used both an in-house built room temperature (RT, 20 °C) dual-tunable 19F/1H head RF volume coil (ID = 16 mm) [37] and a cryogenically-cooled 2-channel transceive 19F quadrature RF surface probe (ID = 20 mm, Cryogenic Radiofrequency Probe or CRP, Bruker, Fällanden, Switzerland) [36]. Since the 19F CRP does not have a 1H channel, anatomical 1H scans were performed with a linear 1H volume coil (ID = 72 mm, Bruker Biospin, Ettlingen, Germany) using a CRP replica emulating the geometry of the CRP coil-head and supporting components to reproduce the position in the CRP.
Due to the very close gyromagnetic ratios of the 1H and 19F nuclei (≈6% deviation) [38], conclusions about RF hardware aspects of MR sensitivity obtained at the 1H resonance frequency are transferable to 19F measurements. For the comparison of preclinical and clinical settings, we used a 1H cryogenic quadrature RF probe (Bruker, Fällanden, Switzerland) with a very similar geometry as a proxy for the 19F CRP [36, 39]. The measurements at 3.0 T were performed on a Siemens Magnetom SkyraFit (Siemens Healthcare, Erlangen, Germany) using the built-in body RF array for transmission and a 32-channel head RF array (Siemens Healthcare, Erlangen, Germany) for reception.
MR protocols
MR characterization experiments
The 19F MR properties of siponimod were characterized in DMSO and in human serum at RT and PT. They were also measured in ex vivo liver tissue at RT. All protocols were performed with the RT head volume RF coil and used Gauss excitation RF pulses with a bandwidth (BWRF) of 10 kHz and a spectral acquisition bandwidth (BWspec) of 200 kHz. We used non-localized free induction decay (FID) MRS sequences with 13 different repetition times (TR) to determine T1. The DMSO RT and DMSO PT protocols used: TR = 136 - 5000 ms, acquisition time (TA) =4 min for each TR, acquired points (nacq) = 4096. Serum RT and serum PT protocols used: TR =20 and 2500 ms, TA = 20 min, nacq = 1024 (RT) or 2048 (PT). For the 19F MRI assessment of the ex vivo samples we used: TRs=20-2500 ms, TA = 3 h, and nacq = 1024. T2 was measured with Carr-Purcell-Meiboom-Gill (CPMG) MR spectroscopy (number of echoes = 32). The measurements in DMSO used TR = 5000 ms, ΔTE = 32 ms (RT) or 41.5 ms (PT), TA = 10 min, and nacq = 6144 (RT) or 8192 (PT). In serum, we used TR = 2500 ms, ΔTE = 3.2 ms, TA = 20 min (RT) or 1 h (PT), and nacq = 512. For the ex vivo samples, we conducted a 70 h measurement with TR = 1000 ms, ΔTE = 3.2 ms, and nacq = 512.
To determine the most sensitive imaging method, we acquired 3D images of siponimod in the serum phantom with RARE, FLASH, bSSFP and UTE MRI techniques, which were optimized based on the determined T1 and T2 relaxation times. Measurements were performed at RT and PT with the head volume RF coil. The RT experiments were repeated with the CRP. For all protocols, the field of view (FOV) was 28×28×28 mm3, image matrix 32×32×32 voxels, TA = 4 h (20 min with CRP), and receiver bandwidth (BWread) =75 kHz. RARE was employed with flip-back pulse and centric phase encoding. ΔTE was set to the shortest possible timing (1.5 ms). Based on the measured transverse relaxation times, we calculated the expected point spread function (PSF) in the phase encoding direction and chose the highest ETL with a full width at half maximum (FWHM) of the PSF below 1.5 voxels (ETL = 8 at RT, ETL = 16 at PT) [40, 41]. TR was optimized based on the steady-state signal equation (TR = 350 ms at RT, TR = 369 ms at PT) [42]. The FLASH sequence was used with the minimal possible TE (0.89 ms), a short TR (10 ms), and the Ernst excitation flip angle (α = 15.2° at RT, α = 14.2° at PT) [42]. For bSSFP, TR = 1.4 ms was chosen and the excitation angle set to arccos((T1/T2 - 1)/(T1/T2 + 1)) (α = 16.5° at RT, α = 26.3° at PT) [43]. UTE was optimized as the FLASH sequence (TR = 10 ms, TE of 0.14 ms, α = 15.2° at RT and α = 14.2° at PT). In each case, a separate noise scan was acquired with 1 average and 0 W transmit power.
In vivo experiments
All in vivo 19F measurements were performed with the CRP positioning the mouse abdomen at the center of the coil. One non-localized 19F MR spectrum (TR = 1000 ms, block pulse, BWRF-excitation = 10 kHz, BWreceiver = 25 kHz, nacq = 4096, TA = 128 s) was acquired before the administration of siponimod. Directly following the administration, an interleaved series of 19F MRS acquisitions (as above) and 2D-UTE experiments (3 horizontal slices, 6 mm slice thickness, 32×32 mm2 FOV, 32×32 voxel image matrix, TR = 100 ms, block pulse, BWRF-excitation = 10 kHz, TE = 0.27 ms, α = 28°, BWreceiver = 20 kHz, TA = 10 min) was started. Depending on the stability of the anesthesia, the protocol was repeated 10, 19 or 9 times for mouse M1, M2 or M3, respectively. During analysis, 3 acquisitions were averaged, corresponding to a 19F TA of 30 min. Multiple 1H images were measured in between to control for shifts in the animal's position (not shown). After the 19F acquisitions, the animal was transferred to the 72 mm 1H volume RF resonator to acquire a high-quality anatomical image (RARE, 20 horizontal slices, slice thickness = 0.9 mm, FOV = 30×30 mm2, matrix size 154×154, TR = 1200 ms, TE = 5.9 ms, BWreceiver = 81.5 kHz, TA = 10 min).
Ex vivo experiments
We acquired 19F spectra of all ex vivo tissue samples using the CRP to detect siponimod and possible metabolites: non-localized MRS, TR = 50 ms, block pulse, BWRF-excitation = 200 kHz, BWreceiver = 200 kHz, nacq = 512, α = 30°, TA = 1 h. This protocol was repeated 18 times spaced over 3 days without any sample inserted to characterize short T2* 19F signals originating from the RF coil itself.
3D-UTE images were acquired for liver (M1-M3) and brain (M4-M6) tissue samples. In both cases, the CRP was used to achieve sufficient sensitivity and the center RF resonance frequency was offset from the siponimod resonance frequency by 2 kHz to avoid exciting nuisance signal from the RF coil. Acquisition parameters for the liver were: FOV = 28×28×28 mm3, matrix size = 32×32×32, TR = 10 ms, Gauss pulse, BWRF-excitation = 10 kHz, TE = 0.14 ms, α = 14°, BWreceiver = 75 kHz, TA = 16 h (3632 averages), 2-fold radial undersampling. For the brain we used the same parameters, except FOV = 24×24×24 mm3, matrix size = 24×24×24 and TA = 64 h (27024 averages). In both cases, additional scans with 1 average and 0 W transmit power, but with otherwise identical settings were acquired to estimate the noise level, necessary for SNR estimation and quantification. To determine the relative sensitivity of these 19F 3D-UTE protocols, identical measurements were performed on the 10 ml serum phantom with 1362 averages (liver protocol) and 844 averages (brain protocol). Anatomical images were recorded similar to the in vivo experiment for both the liver (RARE, 18 horizontal slices, slice thickness = 0.87 mm, FOV = 28×28 mm2, matrix size = 512×512 , TR = 2500 ms, TE = 13.5 ms, BWreceiver = 75 kHz, TA = 32 min) and the brain (RARE, 12 horizontal slices, slice thickness = 1 mm, FOV = 24×24 mm2, matrix size = 168×168 , TR = 2500 ms, TE = 22 ms, BWreceiver = 35 kHz, TA = 12 min).
To demonstrate the possibility of localizing siponimod with a shorter acquisition time, additional ex vivo images were acquired of the brain of M6. The above 3D-UTE brain protocol was adapted by removing radial undersampling, increasing the FOV to 48×48×48 mm3 or 64.8×64.8×64.8 mm3 for 2 mm or 2.7 mm isotropic resolution, and reducing the TA to 60 min (205 averages) or 10 min (35 averages), respectively. The acquisition at 2 mm resolution was repeated 4 times and the average used for estimating the concentration of siponimod. A corresponding image of the 10 ml syringe phantom (3.9 mM siponimod in serum) was acquired with 30 averages as a SI reference. The anatomical image 1H protocol was adapted by matching the slice thickness to the new 19F resolutions.
Sensitivity comparison to clinical imaging at 3.0 T
The human brain is approximately 2750 times larger than the mouse brain (V = 1400 cm3 vs. V = 0.509 cm3) [44, 45]. Thus, equivalent relative spatial resolution is achieved with 2750 times larger voxel volumes, which is equal to 14 times longer voxel edge lengths for 3D isotropic imaging. We used Cartesian 3D gradient echo protocols with adapted FOVs but otherwise identical parameters: matrix size = 256×256×16, TR = 3000 ms (full relaxation), TE = 2.8 ms, α = 90°, BWreceiver = 200 kHz, 1 average. The FOVs were 358×358×22.4 mm3 and 25.6×25.6×1.6 mm3 for 3.0 T and 9.4 T, respectively.
Data analysis and image reconstruction
All data analysis was performed using MATLAB and Optimization Toolbox Release 2018a (The MathWorks, Inc., Natick, Massachusetts, United States).
MR spectroscopy processing
All chemical shifts reported are referenced to trichloro-fluoro-methane (CFCl3).
The FID-sequence data of the MR characterization, acquired with the 1-channel volume coil, was processed by removing the digital filter delay and zero-padding the time domain data to 16384 points before Fourier transformation. 0th order phase correction was performed manually and a real Voigt peak with baseline was fitted to the spectrum using Matlab's lsqnonlin routine and the trust-region-reflective algorithm to quantify the signal intensity (SI) [46-48]. To quantify the 19F T2* of siponimod in DMSO or serum and ex vivo, the spectrum was transformed back to the time domain after phase correction and shifting the signal peak to the central frequency. Afterwards, the phase corrected FID signal was cut to the original length. The echoes of the CPMG data were individually Fourier transformed without zero-padding and the 0th order phase was corrected manually before computing the SI by integrating the real signal over a width of 1.5 kHz (DMSO) or 5 kHz (serum and ex vivo) around the peak.
The in vivo and ex vivo MRS data acquired with the 2-channel CRP was prepared in a similar fashion. The time domain data of the in vivo experiments and the control experiments with an empty RF coil was truncated to 256 points and that of all ex vivo measurements to 768 points before Fourier transformation to increase SNR. Zero-padding was limited to 4096 points to accelerate fitting procedures. Further processing steps of the control experiment and ex vivo data are described in the following section. For the in vivo data these steps were not necessary due to the shorter measurement time and thus lower sensitivity. Here complex Voigt peaks were first fitted to each channel individually to estimate 0th and 1st order phase correction terms. After application of the phase correction, the channels were averaged and a Voigt peak was fitted to the combined spectrum to estimate the SI.
Artifact signal characterization and subtraction
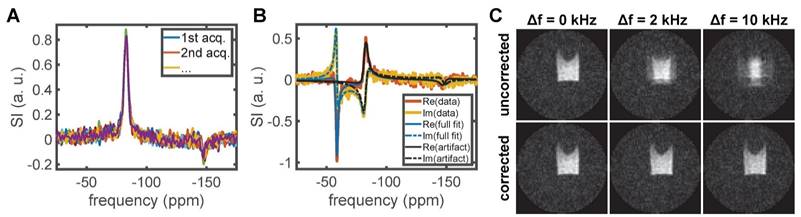
19F MR spectra acquired with the empty CRP containing no sample showed two distinct lines at ≈-83 ppm and ≈-147 ppm (Figure 1A). Such artifact signals can originate from trace amounts of fluorinated substances in, for example, capacitor electrolytes and lubricants used for the manufacturing of the RF coil. Contamination of MR spectra could be mitigated by selective excitation, suppression techniques, or in post-processing. We opted for the latter by fitting an analytic line shape model and subtracting the artifact contribution to preserve any potential metabolite signals. The code used for this is available on Github and details can be found in the associated documentation [49].
19F traces in the RF coil were detected with spectroscopy protocols optimized for short T2* compounds. Here the real part of 18 spectra acquired with an unloaded RF coil is shown with manually adjusted 0th and 1st order phase (A). The two 19F lines occur at ≈-83 ppm and ≈-147 ppm. A. u. denotes arbitrary units. To remove this artifact from spectra acquired in ex vivo tissue samples, the sum of three complex Voigt functions was fitted with Bayesian constraints on the two artifact lines (B). The artifact component could then be subtracted. We show the full fit and artifact component for the channel 1 data of kidney M2. See Figure 5 for the final result. To selectively excite only the siponimod resonance in UTE imaging while minimizing the excitation pulse length, off-resonance excitation shifted by +2 kHz was used. The resultant image blurring was corrected by multiplication with a delay-dependent phase factor. (C) shows the efficacy of this correction for a 3D UTE protocol with 64×64×64 image matrix and data acquired in a phantom with siponimod dissolved in DMSO.
The artifact was characterized by fitting two complex Voigt peaks to the 18 spectra acquired with an empty RF coil [48, 50, 51]. Each RF channel of the data was treated separately. The model was parameterized with coupled peak amplitudes to later enable a Bayesian constraint on the relative contributions independent of the absolute SI: L(f) = a⋅e-iϕf⋅(r⋅e-ip⋅V(f,v1,w1,m1) + (1-r)⋅e-iq⋅V(f,v2,w2,m2)), where L is the modeled line shape, f the frequency, a the joint amplitude, ϕ the first order phase correction, r the peak ratio, p and q are the zeroth order phase correction, and V is a complex Voigt function with center frequency v, full widths at half maximum (FWHM) w and mixing parameter m. To enable automatic fitting, Weideman's polynomial approximation of the error function was used for fast computation of the Voigt function [49, 52]. Based on the 18 acquired control spectra (Figure 1A), we found the following means and standard deviations: for channel 1 r = 0.84±0.02, v1 = -82.96±0.08 ppm, w1 = 5.1±0.4 ppm, r1 = 0.82±0.06, v2 = -147.9±0.4 ppm, w2 = 6±1 ppm, r2 = 0.8±0.2; for channel 2 r = 0.85±0.01, v1 = -82.5±0.1 ppm, w1 = 4.8±0.3 ppm, r1 = 0.79±0.06, v2 = -146.9±0.4 ppm, w2 = 5±1 ppm, r2 = 0.7±0.2.
The knowledge of this artifact signal was then used to constrain fits of the acquired spectra of ex vivo tissue samples by placing Gaussian priors on two of three modeled peaks. To account for magnetic field drift and inhomogeneity, the uncertainty on the artifact frequencies was increased equivalent to the addition of a zero mean Gaussian variable with a standard deviation of 250 Hz. The third peak was left unconstrained and initialized to capture the main siponimod signal. To remove the artifact signal, the corresponding portion of the fit was subtracted (Figure 1B). Due to the limited degrees of freedom of the model, it is expected that potential metabolite signals are not captured by the fit and thus unaffected. Analogous to the processing of the in vivo data, a single, unconstrained complex Voigt peak was fitted to the cleaned spectrum to estimate the 0th order phase term. After phase correction, the data of both RF channels was averaged, and the noise level was determined in a background region of the combined spectrum. Both the peak signal-to-noise ratio (pSNR) and the ratio of the area under the curve of a fitted Voigt peak to the noise level (area-to-noise ratio, ANR) are reported as metrics of SI.
MR Relaxometry
We computed T1, T2 and T2* relaxation times using a non-linear least squares cost function, the Levenberg-Marquardt algorithm and Matlab's lsqcurvefit function. The parameter covariance matrix was estimated using the linear approximation: Vp = σr2(JTJ)-1, where J denotes the Jacobian and σr2 the error variance calculated from the residuals [53, 54]. We report parameter standard errors given by the square root of the diagonal elements of Vp. The used SI equations were S(TR) ∝ 1 - exp(-TR/T1) for T1 estimation and both S(t) ∝ exp(-t/T2) and S(t) ∝ β⋅exp(-t/T2(a)) + (1 - β)⋅exp(-t/T2(b)) for T2 and T2* estimation. As the mono-exponential decay can be understood as a constrained version of the bi-exponential model, a likelihood ratio test was performed to determine whether the hypothesis that T2 or T2* decay follow a single exponential curve can be rejected. Apparent T2 and T2* values summarizing the bi-exponential decay were calculated by sampling 5⋅104 parameter values from a multivariate normal with mean equal to the parameter estimate and covariance Vp, determining t' where S(t') = S(0)⋅exp(-1) for each sample, and reporting the mean and standard deviation of the results for t'.
Image reconstruction and analysis
UTE images were reconstructed using the Michigan Image Reconstruction Toolbox (MIRT) non-uniform fast Fourier transform (NUFFT) based on trajectory measurements performed with a 1H coil and an adjusted FOV to compensate the change of gyromagnetic ratio [55-58]. For data acquired with the CRP, each channel was reconstructed separately before computing a root sum-of-squares image. Off-resonance effects in the ex vivo imaging data were compensated before image reconstruction by multiplying each k-space point with delay-dependent phase factor exp(2πi⋅(TE + (j-1)⋅td)⋅Δf), where i is the imaginary unit, TE the echo time, j the position on the k-space spoke, td the frequency encoding dwell time and Δf the off-resonance frequency shift (Figure 1C). Noise levels were estimated based on a background region (in vivo) or a separate noise scan (ex vivo) and background subtraction was performed with cluster-based thresholding [59] at SNR = 3.5 (in vivo) or 4.0 (ex vivo) following the protocol outlined in Starke et al. [60].
For comparison of the employed ex vivo liver and brain protocols, SNR maps of the serum phantom measurements were adjusted for the difference in scan time to the ex vivo acquisitions, the FOVs and spatial resolutions of the SNR maps were matched by nearest neighbor interpolation and the SNR ratio was averaged over all voxels with SNR > 10 in both images. To estimate the siponimod concentration in a mouse brain, the pixelwise SI ratio between data acquired in the brain and in the reference phantom was computed, and the result multiplied by the reference concentration.
Sensitivity comparison to clinical imaging at 3.0 T
Noise data was extracted from rectangular 32×32×16 voxel background regions located in the 4 corners of the individual image volumes obtained for each RF receive channel. Noise prewhitening was performed with Cholesky decomposition of the inverse noise covariance matrix followed by sum-of-squares reconstruction [61, 62]. The SI was evaluated in a central slice of the phantom by averaging over 32×5 (3.0 T) or 12×12 (9.4 T) voxel rectangles inside the inner compartment. SNRs were determined taking into account the RF channel number-dependent noise distributions [60, 63].
Results
Temperature and protein binding alter the MR properties of siponimod
In vitro and ex vivo experiments showed that the 19F MR properties of siponimod are strongly influenced by the chemical environment. All results are outlined in Table 2 and Figure 2. Siponimod gives a single peak spectrum under the investigated conditions. In DMSO, a chemical shift of -57.08 ppm (at RT ≈ 20 °C) and -57.06 ppm (at PT ≈ 37 °C) was observed (Figure 2A). In the presence of plasma protein (in serum), the resonance frequency shifted to -59.13 ppm (RT) and -59.06 ppm (PT, Figure 2E). A similar observation was made in ex vivo liver tissue, where a chemical shift of -59.09 ppm was observed at RT.
Pulse sequence parameters used for SNR comparison in the serum phantom (Figure 3).
| Repetition time, TR (ms) | Echo time, TE (ms) | Excitation flip angle α (°) | Echo train length, ETL | ||
|---|---|---|---|---|---|
| RT | RARE | 350 | 1.5 | 90 | 8 |
| FLASH | 10 | 0.89 | 15.2 | - | |
| bSSFP | 1,4 | 0.7 | 16.5 | - | |
| UTE | 10 | 0.14 | 15.2 | - | |
| PT | RARE | 269 | 1.5 | 90 | 16 |
| FLASH | 10 | 0.89 | 14.2 | - | |
| bSSFP | 1.4 | 0.7 | 26.3 | - | |
| UTE | 10 | 0.14 | 14.2 | - |
19F MR characterization of siponimod. T2(bi) and T2*(bi) are apparent relaxation times computed from a bi-exponential fit. T2(mono) and T2*(mono) denote the results of a mono-exponential fit. P values report a likelihood ratio test if T2 or T2* decays follow a mono-exponential. βT2 and βT2* give the ratio between the (a) and (b) components in the bi-exponential fits.
| DMSO, RT | DMSO, PT | Serum, RT | Serum, PT | Ex vivo | |
|---|---|---|---|---|---|
| chem. shift (ppm) | -57.08 | -57.06 | -59.13 | -59.06 | -59.09 |
| T1 (ms) | 553.2±4.3 | 802.4±7.2 | 282.1±1.8 | 321.7±2.1 | 272.9±3.8 |
| T2(bi) (ms) | 380.8±2.9 | 611.6±1.6 | 5.3±0.4 | 14.7±0.4 | 20.8±2.8 |
| T2(mono) (ms) | 385.6±0.9 | 621.4±1.3 | 6.4±0.2 | 17.8±0.3 | 47.2±2.9 |
| T2(a) (ms) | 226.0±32.4 | 205.3±39.9 | 4.7±0.6 | 8.0±0.9 | 9.4±1.6 |
| T2(b) (ms) | 409.0±7.7 | 636.9±3.9 | 12.9±3.2 | 21.7±0.7 | 80.6±9.3 |
| βT2 | 0.137±0.056 | 0.047±0.009 | 0.880±0.072 | 0.405±0.037 | 0.618±0.030 |
| PT2 | ≪.001 | ≪.001 | ≪.001 | ≪.001 | ≪.001 |
| T2*(bi) (ms) | 2.304±0.008 | 1.410±0.000 | 0.952±0.014 | 0.643±0.007 | 0.493±0.146 |
| T2*(mono) (ms) | 3.710±0.018 | 2.040±0.018 | 1.316±0.012 | 1.696±0.012 | 0.551±0.017 |
| T2*(a) (ms) | 1.037±0.006 | 0.778±0.004 | 0.336±0.018 | 0.325±0.004 | 0.240±0.196 |
| T2*(b) (ms) | 6.12±0.02 | 3.94±0.02 | 1.83±0.04 | 3.42±0.03 | 0.65±0.11 |
| βT2* (1/ms) | 0.554±0.002 | 0.629±0.002 | 0.425±0.014 | 0.671±0.003 | 0.260±0.286 |
| PT2* | ≪.001 | ≪.001 | ≪.001 | ≪.001 | 0.086 |
Chemical shift and MR relaxation times for siponimod dissolved in DMSO and serum (mimicking biological conditions), and in ex vivo liver tissue from mouse M3. Room temperature (RT) equals 20 °C and physiological temperature (PT) 37 °C. Where the hypothesis of a mono-exponential decay was rejected, an apparent T2 or T2* value (T2(bi) or T2*(bi)) is reported, which reflects the time after which 63% of the signal has decayed. More detailed results, including measurement uncertainties, are reported in Table 2.
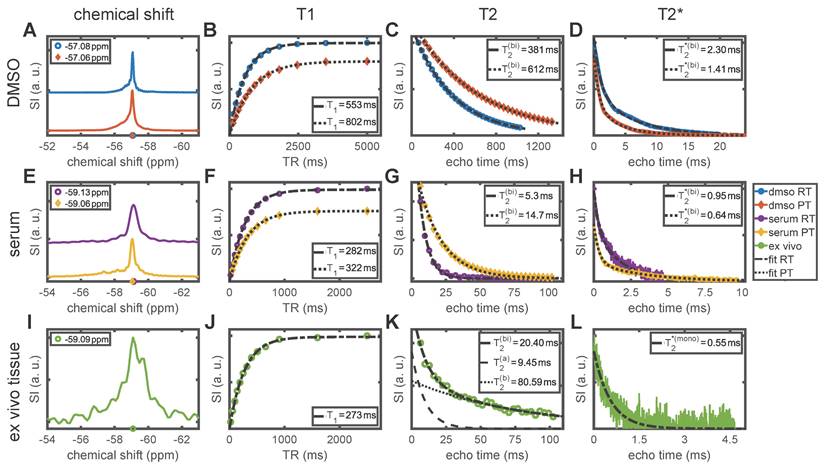
Longitudinal relaxation time measurements in DMSO yielded T1 = 553±4 ms (RT) and T1 = 802±7 ms (PT, Figure 2B). In serum, T1 was shortened to 282±2 ms (RT) and 322±2 ms (PT, Figure 2F), which is similar to 273±4 ms observed in ex vivo tissue at RT (Figure 2J). For transverse relaxation, the shortening of relaxation times in serum and ex vivo tissue compared to DMSO was even more pronounced (up to 98% reduction). For all conditions, the null-hypothesis (mono-exponential decay) was rejected in favor of a bi-exponential decay (P ≪ .001, Table 2). We observed an apparent T2 of 381 ms (RT) and 612 ms (PT, Figure 2C) in DMSO. In serum, T2 was 5.3±0.4 ms (RT) and 14.7±0.4 ms (PT, Figure 2G). Ex vivo, a bi-exponential decay with an apparent T2 of 20±3 ms was observed (Figure 2K, see Table 2 for details). For T2*, a bi-exponential decay also best described the FID signal in DMSO and in serum (P ≪ .001, Table 2). We found apparent T2* = 2.30 ms (DMSO RT), 1.41 ms (DMSO PT), 0.95±0.01 ms (serum RT), and 0.643±0.007 ms (serum PT). For the ex vivo sample, the mono-exponential decay hypothesis was not rejected (P = .09) and we observed T2* = 0.55±0.02 ms. The stated uncertainties reflect the ambiguity of the fits only, and no deviation is given where the value falls below 1%, as in those cases divergences due to biological factors or temperature variations can be expected to dominate.
Ultrashort echo time MRI is most sensitive for imaging siponimod
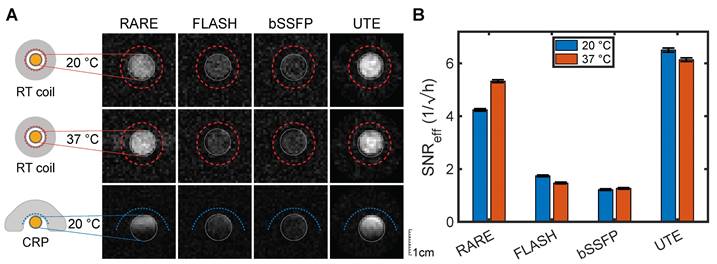
As the relaxation times in serum closely mimicked those observed ex vivo and were also expected to approximate in vivo conditions, optimized MRI acquisition methods were compared by experiments on a serum phantom. At both RT and PT, measurements using a volume transceive RF coil with high transmission and reception field (B1) homogeneity showed the highest SNReff for the UTE protocol (Figure 3A and B, Table 3). FLASH and bSSFP were much less SNR efficient with more than 70% lower SNReff. RARE emerged as the next best MRI method with 36% and 13% lower SNReff than UTE at RT and PT, respectively (Table 3).
Comparison of optimized 3D 19F MR protocols imaging the serum phantom. (A) The first two rows show measurements with the room temperature (RT) volume RF coil at sample temperatures of 20 °C (RT) and 37 °C (PT). The acquisition time was 4 h per image. The third row highlights the different impact of the surface coil design of the CRP (20 min acquisition time). Each row is adjusted to one SNR scale. (B) SNR efficiencies (SNR/√(acquisition time)) in the volume RF coil measurements. Error bars show the standard error of the measurement (numerical values are reported in Table 3). UTE showed superior SNReff compared to the other three sequences for both temperature conditions (pUTE-RARE, RT = 3.7⋅10-19, pUTE-RARE, PT = 1.5⋅10-133, p-value below 2.3⋅10-308 for all other comparisons, two-sided z-test).
SNR and SNR efficiency results for the MR pulse sequence comparison shown in Figure 3. Uncertainties were estimated as described in Starke et al. [60] with 270 pixel signal ROIs and 4100 pixel (UTE) or 6144 pixel (all other sequences) noise ROIs.
| RARE | FLASH | bSSFP | UTE | ||
|---|---|---|---|---|---|
| RT | SNR | 8.5±0.1 | 3.48±0.07 | 2.44±0.06 | 13.0±0.2 |
| SNReff (1/√h) | 4.24±0.05 | 1.74±0.03 | 1.22±0.03 | 6.50±0.08 | |
| PT | SNR | 10.7±0.1 | 2.94±0.07 | 2.53±0.07 | 12.3±0.1 |
| SNReff (1/√h) | 5.32±0.06 | 1.47±0.03 | 1.26±0.03 | 6.14±0.07 | |
| RT, CRP | pSNR | 17.7 | 9.0 | 8.7 | 26.7 |
| pSNReff (1/√h) | 30.5 | 15.6 | 15.0 | 46.2 |
Analogous experiments using a 19F cryogenically-cooled surface transceiver RF coil (CRP, see Methods) showed similar differences between the MRI methods (Figure 3A, lower panel) but highlight inhomogeneity and signal loss distal from the coil, characteristic of surface transceiver soils. The RARE protocol achieved high sensitivity only in the region close to the RF coil array, while FLASH and UTE had a much better signal coverage. Based on the peak SNR measured with UTE and the CRP (Table 3), we can extrapolate that siponimod concentrations as low as 516 µM would be detectable under ideal conditions at the tested spatial resolution, with an acquisition time of 1 h. This is equivalent to 6.2⋅1014 19F-atoms per voxel. Importantly, the detection limit can be further reduced by increased averaging or with larger voxel sizes. It is inversely proportional to the square root of the measurement time. For radial sequences such as UTE, the SNR does not strictly follow the same straightforward dependence on the image resolution as with Cartesian sampling. Thus, we determined experimentally the detection limits for two lower spatial resolution protocols: at 2 mm and 2.7 mm 3D isotropic spatial resolution, the detection limit with 1 h of measurement time dropped to 76 µM and 33 µM, respectively. This equates to 186 µM and 82 µM detection limits for a 10 min acquisition.
In vivo 19F MRS and MRI of siponimod in the stomach and liver
We remotely administered siponimod via an intubation catheter to the stomach (Figure 4A) and acquired 19F MRS measurements interleaved with 19F imaging using the CRP. A 19F MRS signal was detected within the first 5 min following siponimod administration in all three mice, after which a signal increase was observed over the initial minutes of the experiment (Figure 4B). The increase was much faster for mice M1 and M3 than for mouse M2, for which the signal took more than an hour to gradually reach a plateau. In all mice, the MR spectroscopy signal was mostly stable throughout the measurement, indicating a prolonged gastric emptying and slow uptake into the blood stream. Mouse M3 showed a sharp signal drop after 120 min, which coincided with an increase in the respiration rate, indicating attenuation of anesthesia, that required termination of the experiment (Figure 4B).
In vivo 19F MRS and MRI after oral administration of siponimod. (A) Siponimod suspended in carboxymethylcellulose was administered through an oral intubation tube (marked in yellow) directly into the stomach. (B) Dynamic tracking of non-localized 19F MRS signal intensity. (C) 2D 19F UTE images overlaid on an anatomical 1H scan. Each image corresponds to the average of 3 × 10 min 19F acquisition. The time envelope of these is indicated by the gray boxes in the bottom plot with the hashed areas highlighting the actual UTE measurement.
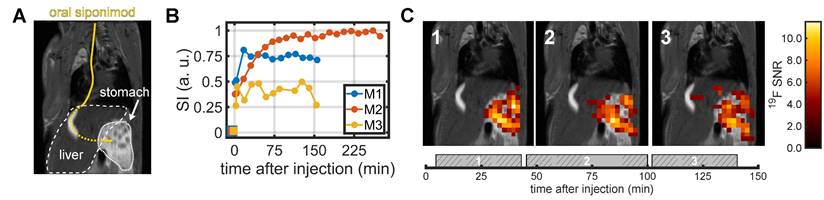
A clearly localized siponimod-derived 19F signal was observed in the stomach. The signal mostly remained stable over time (Figure 4C). The second and third imaging block (45-100 min and 102-145 min after siponimod administration) showed 19F signal also in the liver. However, the highest SNR values were observed only within the stomach (Figure 4C).
Siponimod-derived signal is detected in ex vivo tissues
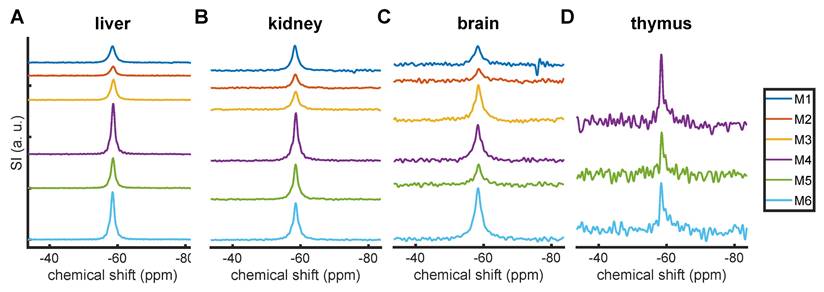
We acquired ex vivo 19F MR spectra from liver, kidney, brain, and thymus samples from 6 mice. A siponimod-derived 19F MR signal was detected in all samples (Figure 5). Due to the inhomogeneous transmission and reception field of the CRP surface coil, SNRs and ANRs can be considered only semi-quantitative measures of the amount of siponimod in the sample. The highest SNRs were observed in the liver, followed by the kidney (Figure 5A and B, Table 4). All samples exhibited a single peak with a chemical shift of -59 ppm similar to the spiked serum (Figure 2). The signal from the brain of mouse M1 showed a secondary peak (Figure 5C). Only weak signals were detected in the thymus (Figure 5D).
19F MRS in ex vivo tissues. Signal intensities represent the SNR with one common scale for each organ. Mice M1-M3 underwent perfusion ≈2.5-4 h after siponimod administration while M4-M6 were perfused after ≈6 h.
Peak SNR (pSNR) and area-to-noise ratio (ANR) in the MR spectra of ex vivo tissue samples (Figure 5).
| pSNR | ANR | |||||||
|---|---|---|---|---|---|---|---|---|
| liver | kidney | brain | thymus | liver | kidney | brain | thymus | |
| M1 | 159.4 | 86.8 | 19.4 | - | 446.2 | 260.0 | 77.9 | - |
| M2 | 88.5 | 47.2 | 12.5 | - | 223.5 | 135.4 | 49.3 | - |
| M3 | 197.5 | 61.9 | 37.4 | - | 487.3 | 185.7 | 144.1 | - |
| M4 | 489.5 | 166.0 | 36.6 | 22.6 | 927.6 | 398.7 | 129.2 | 44.0 |
| M5 | 292.0 | 121.8 | 20.4 | 13.7 | 606.2 | 286.5 | 61.6 | 25.9 |
| M6 | 462.5 | 128.4 | 53.0 | 15.5 | 953.5 | 340.6 | 193.2 | 36.0 |
| mean | 281.5 | 102.0 | 29.9 | 17.3 | 607.4 | 267.8 | 109.2 | 35.3 |
| std. dev. | 164.5 | 44.8 | 15.1 | 4.7 | 286.4 | 97.1 | 55.7 | 9.1 |
Mice M4-M6 showed increased 19F MR signals in all tissues, due to a longer time after oral administration (Table 4). Yet even in the same cohort, large variations were seen, for example in the observed SNRs for the liver and brain between M2 and M3 (>100% difference).
Ex vivo 19F MRI of siponimod in the liver and brain
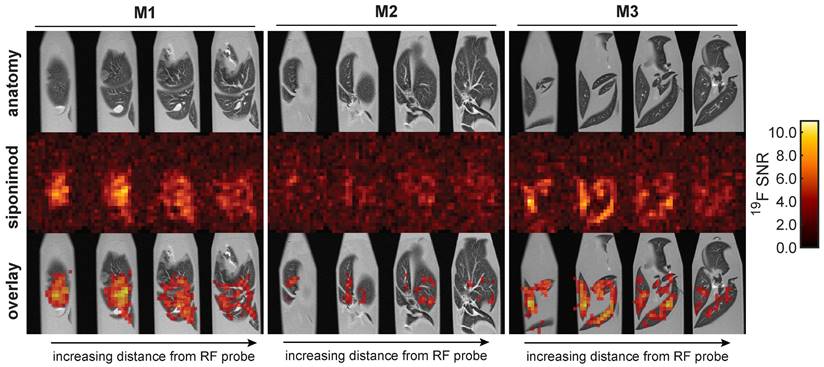
Ex vivo 19F MR images were acquired in liver (Figure 6) and brain (Figure 7) samples using the 3D-UTE MRI method. The 19F signal in the livers clearly follows the anatomy of the liver lobes, especially for mouse M3. Different anatomic segments showed different 19F signal intensities derived from siponimod. For example, less signal was detected in the upper liver lobe of mouse M1, compared to the lower lobe. Siponimod signals, especially those in the upper lobe of M1 were confined within the vascular boundaries. As expected, observed signal levels dropped with increasing distance from the RF coil. The overall much lower SNR in the liver 19F MRI signal of M2 (Figure 6) is consistent with the 19F MRS signal (Figure 5A).
3D UTE 19F MRI in ex vivo liver tissues with 16 h acquisition time and 0.875 mm isotropic spatial resolution.
3D UTE 19F MRI in ex vivo brain tissues with 64 h acquisition time and 1 mm isotropic spatial resolution. This protocol is 3.1 times more sensitive than that employed for the liver (Figure 6). Thus, equal SNR values correspond to 3.1 times lower concentrations of siponimod.
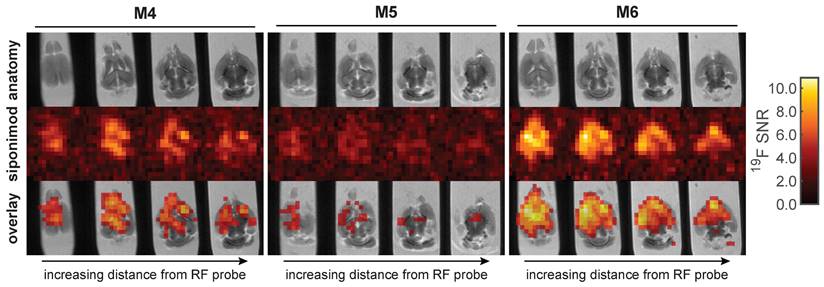
Similar observations were made in the brain (Figure 7). The brain with the highest 19F MRS signal (M6) among all analyzed samples also showed the highest SNR in the 19F UTE MR images. Conversely, the brain with the lowest SNR in 19F MRI (M5) also had the lowest 19F MRS signal (Figure 5). Differences in siponimod-derived 19F signals could be resolved between white and grey matter, especially in the M6 brain (Figure 7). M4 and M6 show a clear difference between the cerebral and cerebellar regions of the brain. In the brain of M4, a region of low or no siponimod accumulation was observed within and around the right lateral ventricle. In a control measurement of a spiked serum phantom, the protocol employed for the brain resulted in 3.1-fold higher sensitivity than the protocol used for imaging the liver (Figure 6). Thus, based on similar recorded SNRs, we conclude that siponimod concentrations in the liver were about 3 times higher (Figure 6 and 7).
Short acquisition time imaging of siponimod in the brain
In vivo imaging of siponimod in the brain necessitates a substantial reduction of the acquisition time compared to the protocol above. Figure 8A and B present ex vivo images acquired at 2.7 mm or 2 mm isotropic spatial resolution, acquired in 10 min or 60 min, respectively. In both cases, siponimod could be localized within the brain and, particularly with 2 mm spatial resolution, a non-homogeneous SI distribution was also observed (Figure 8B). Comparison with SIs measured in a spiked serum phantom enabled an estimation of siponimod concentrations as well as an RF field (B1) inhomogeneity correction (Figure 8C). Drug levels up to 145 μM were reached in the brain of mouse M6.
Short acquisition time 3D UTE 19F MRI in ex vivo brain tissue and siponimod concentration estimation. All subfigures show data acquired in the brain sample of mouse M6. (A) With 2.7 mm isotropic resolution, siponimod can be localized in only 10 min of acquisition time. (B) 60 min of acquisition enable imaging of siponimod at 2 mm isotropic resolution. (C) Siponimod concentration estimates computed by comparison of 19F SIs measured in a phantom with spiked serum and in the mouse brain. 4 acquisitions of the protocol shown in B were averaged and the same slices as in B are presented.

To evaluate the possibility of imaging siponimod in a clinical setting, we determined the hardware sensitivity ratio between imaging a mouse brain at 9.4 T and imaging a human brain at 3.0 T at equivalent relative resolution. Due to the very close gyromagnetic ratios (≈6% deviation), this comparison could be performed at the 1H resonance frequencies. For the specific hardware investigated, we found that the larger voxel size viable for human brain measurements and higher RF channel count render the clinical acquisition 2.75 times more sensitive.
Discussion
In the present study, we achieved for the first time in vivo and ex vivo 19F MR images of a fluorinated drug with disease modifying properties that is indicated in SPMS, a progressive form of MS with increasing brain degeneration.
In SPMS patients, the daily maintenance dose of siponimod is 2 mg. In an early phase 2 clinical trial in RRMS, one cohort received 10 mg daily up to 24 months [64]. In a later phase 3 clinical trial in SPMS patients, a dose of 2 mg was used [65]. A daily dose of 2 mg and 10 mg siponimod in humans corresponds to 0.03 and 0.17 mg/kg, respectively, for an average weight of 60 kg. In preclinical studies, doses ranged between 0.3 to 25 mg/kg, and therapeutic efficacy depended on species, application route, experimental design, as well as variations on the MS animal model, experimental autoimmune encephalomyelitis (EAE) [66-69]. In these preclinical studies, siponimod was administered daily over extended periods (up to 4 weeks). A recent study reported a protective effect of siponimod, that was most pronounced at 15.5 mg/kg [66]. The absolute oral bioavailability of siponimod is ≈84% in humans [70], 50% in rats and 71% in monkeys [71]. The time (Tmax) for siponimod to reach maximum plasma concentrations (Cmax) after oral administration is 3-4 hours in healthy subjects [72]. Steady-state Cmax are reached after ≈6 days of once-daily dosing [73] and are 2-3 fold greater than after the initial dose [72, 73]. In this proof-of-concept study we administered 4 mg (≈133 mg/kg) as a single, one-time application in healthy mice.
A dose-proportionality in steady-state siponimod levels in the brain was recently reported [69]. Following repeated daily application (25 mg/kg) in female C57BL/6 EAE mice (over 27 days), concentrations of ≈45 μM were measured in whole brain homogenates [69]. Considering this, a repeated application of 133 mg/kg (as applied in the present study but as a single dose) would result in brain concentrations of ≈240 µM. This is 2-3x greater than what we measured with fluorine MRI across different regions in the mouse brain following one application of siponimod, and is consistent with the expected 2-3-fold increase in Cmax after several doses (steady-state after ≈6 days), when compared to one dose [72, 73].
Siponimod demonstrated very short transverse relaxation times in the presence of serum, analogous to our previous observations with teriflunomide, another MS drug [19, 74]. We used serum as a biological medium to simulate the in vivo environment for siponimod. These investigations ultimately made the first 19F MR images of siponimod possible because we adapted acquisition protocols to the MR properties of the drug within the specific biological environment.
Siponimod is known to have a very high plasma protein binding capacity (>99.9% bound fraction) [75]. The CF3 group in siponimod greatly improves its affinity to its target [76] as well as its lipophilicity, and thus likely its penetration into the CNS. A recent study in non-human primates using 123I- radiolabeling for in vivo single-photon emission CT showed penetration of siponimod into the CNS, with higher uptake in white matter versus grey matter [69]. Therefore, the high plasma protein binding of siponimod does not appear to hinder its penetration into the CNS. This has also been described for many other drugs, which show high plasma protein binding, but which are nevertheless detected in the CNS in higher amounts than their unbound fraction in the plasma [77]. Drug plasma protein binding reduces passive diffusion and uptake by peripheral tissue, as well as penetration into the CNS [78]. However, apart from diffusion, active mechanisms such as receptor-mediated transport exist for drug uptake into the CNS [79]. Siponimod targets both S1P1 and S1P5 receptors on BBB endothelial cells [80], which might contribute to an active transport into the brain. Inhibition of S1P1 receptors, specifically in endothelial cells, results in a transient opening of the BBB [81]. Binding of smaller molecules such as siponimod to a much larger protein molecule is expected to strongly influence the MR resonance frequency (chemical shift) and relaxation rates [82, 83]. While the observed change in chemical shift between solution in DMSO and in serum is moderate (≈ -2 ppm), the relaxation times were substantially shortened in serum. Similarly shortened relaxation times were observed in ex vivo tissue, and we expect that the properties in in vivo tissues will not differ substantially. The effect of protein binding on the transverse relaxation times (reduction by up to 98%) creates challenges for pulse sequences which are employed in the more common 19F MR methods such as point resolved spectroscopy (PRESS) or highly accelerated RARE in the case of perfluorocarbon imaging [37, 84-86].
Here, we determined radially encoded UTE to be the current best suited acquisition method for detecting siponimod under physiological conditions. In the context of 19F MRI, UTE acquisitions are mostly used for imaging fluorinated gases in the lungs [87, 88]. Besides superior sensitivity for short T2* compounds compared to RARE or bSSFP [42], UTE acquisitions offer intrinsic robustness to motion artifacts [89]. The lower flip angles used with UTE reduce RF power deposition compared to RARE, which is essential for enabling efficient acquisitions in a clinical context [90]. As shown in Figure 3A, UTE also offers a crucial enlargement of the sensitive FOV for acquisitions with transceive surface RF arrays, as was used in this study. We employed 2D multislice protocols for acquisitions with slice thicknesses of multiple millimeters, where slice encoding gradients do not entail substantial acquisition delays. For higher through-plane resolutions, 3D protocols were preferred. We chose tailored frequency encoding bandwidth to ensure that the signal readout did not extend beyond the signal decay. Short duration RF excitation pulses were chosen to achieve the lowest possible TEs. Unfortunately, this prohibits the use of adiabatic pulses which would improve transmission field (B1+) uniformity. More research is necessary to identify short RF pulses that balance a narrow frequency range with good penetration. Additionally, the readout trajectories could be further optimized for sensitivity and sharpness, for example by the implementation of spiral [91], twisted projection imaging [92], or density adaptation techniques [93], which were developed in the context of sodium (23Na) MRI [94, 95].
Using radially encoded 2D UTE 19F MRI in healthy mice in vivo, we localized siponimod in the stomach and the liver. Siponimod was also detected in the kidneys, brain, and thymus, even only 2.5-4.5 hours following a single oral dose. Nevertheless, differences in siponimod levels were observed among different tissues. Changes in the chemical environment e.g., pH could also influence the MR signal. Previously we showed that the 19F signal measured using MR spectroscopy with full relaxation was reduced in an acidic environment, as in the stomach [19]. Therefore, acidosis which is prevalent in conditions associated with hypoxia such as inflammation or in tumors, would be expected to result in a decreased 19F signal.
Ex vivo 19F MR images of liver and brain samples revealed a non-homogenous distribution of the drug, contrary to our expectations from previous studies [96]. In accordance with a recent report using in vivo SPECT-imaging of the siponimod analog [123I]MS565 in non-human primates [69], we observed a pattern of higher siponimod concentrations in white than in gray matter. We also observed signal variations in different anatomical regions, e.g., between the cerebral versus cerebellar regions of the brain, and between the liver lobes. No major differences were seen between brain cerebral and cerebellar regions in the previous SPECT study, even following the first 2 hours of intravenous administration [69]. One important difference between the studies is that here we investigated the unmanipulated drug, identical to the form that is administered to SPMS patients as an oral dosage, whereas the SPECT study used a radiolabeled drug. The fluorine that we exploit for imaging with 19F MRI is intrinsic to the chemical structure of siponimod. The close match of tissue borders, e.g., in the liver lobes, between the anatomical images and the overlaid siponimod 19F MR images indicates an accurate localization of the drug. It is crucial that future studies investigate the signal distribution over repeated administrations of the drug, and importantly, during disease. This can be done using the EAE animal model. Different variants of the EAE model reproduce features of RRMS and SPMS [97, 98], and using 19F MRI to monitor siponimod distribution in conjunction with clinical disease activity could yield crucial insights. Our 19F MR spectroscopy results also indicate that the concentration of siponimod in the liver and the kidney are higher than those in the brain. Future studies will investigate the concentrations of siponimod in other organs apart from the central nervous system, also during pathology.
Ultimately, detection of fluorinated drugs with 19F MRI depends on the levels of the drug reaching the tissue, which depends not only on the administered dose but also on the drug distribution, e.g., in the CNS. Yet the general strategy of the current study - careful characterization of the MR properties of a fluorinated drug, and optimizing the MR methods to image in vivo and ex vivo - can in principle be extended to other fluorinated compounds relevant for diseases beyond MS. The sensitivity improvement offered by the CRP was crucial for achieving the detection limits necessary to detect a DMD in the mouse. Cryogenically-cooled surface RF probes can be employed for all preclinical studies which do not require whole-body coverage [36] and could enable 3D in vivo imaging of drugs which have so far only been investigated with spectroscopic 19F MR techniques or localized with very low spatial resolution 2D projection images, e.g., the cytostatic agents 5-fluorocytosine (5FC) including its metabolites [31, 99] and gemcitabine [100], the neuroleptic fluphenazine [101], the anti-depressants fluvoxamine and fluoxetine [33, 102], and the anti-fungal drug voriconazole [103]. Our proposed spectral post-processing method could be used for the removal of all consistent, hardware-derived artifact signals and could also easily be adapted for dealing with confounding signals from anesthetics such as isoflurane. The suitability of UTE imaging protocols depends on the MR properties of the specific compound. Relaxation times under physiological conditions, especially T2*, have not been reported for most investigated fluorinated drugs. However, protein binding can be expected to have similar effects on other drugs [82, 83], and we also observed a binding-induced severe shortening of transverse relaxation times in both teriflunomide and teriflunomide derivatives [19, 74]. We can assume that for compounds with short T2 and T2*, UTE will provide higher SNR efficiency than the often-employed magnetic resonance spectroscopic imaging (MRSI) protocols, due to the shorter TEs enabled by the absence of phase encoding gradients and the inherent oversampling of the k-space center. Fluorinated drugs with complex, multi-peak spectra or prominent metabolites present a challenge for standard UTE techniques, as chemical shift artifacts will lead to signal blurring and the downstream compounds cannot be distinguished. Especially at high magnetic field strengths and with large chemical shifts, this can be overcome with selective excitation of individual resonances. However, new techniques will need to be developed to overcome the resulting efficiency penalty and enable true multi-color 19F MRI, as has been demonstrated for perfluorocarbons [104].
In vivo imaging of siponimod in the brain at 1 mm isotropic spatial resolution will admittedly not be feasible in reasonable measurement times given the equipment and protocols described in this study. However, our exploration of lower spatial resolution, short acquisition time protocols suggests that informative mapping of the siponimod distribution in vivo in the mouse brain can be achieved, even as part of comprehensive multi-contrast or longitudinal study designs. We also found that, when considering differences in magnetic field strength, RF hardware, and species anatomy, detection limits are expected to be about 2.75 times lower in clinical measurements at equivalent relative spatial resolution (14 times larger voxel edge lengths) compared to preclinical imaging. Due to the availability of state-of-the-art hardware, the comparison was performed at the 1H resonance frequency leveraging the closeness of the 1H and 19F nuclei's gyromagnetic ratios (≈ 6% deviation). No substantial difference in transmission and reception RF field (B1+/B1-) penetration is expected between 1H and direct 19F measurements. The signal per nucleus is proportional to the third power of the gyromagnetic ratio (γ3) which impacts the measurement at 9.4 T and 3.0 T equally and thus does not affect the determined ratio [105]. Crucially, choosing the 1H alternative for the comparison allowed the use of modern RF arrays with a geometry optimized for head imaging and excluded signal attenuation effects from operating the RF array of the clinical scanner outside the optimal bandwidth. While RF arrays developed for 1H imaging could be adapted for the construction of 19F coil designs, dedicated hardware with components free of fluorinated contaminants is necessary to achieve the best performance [90]. The determined SNR improvement equates to 7.6 times faster acquisitions with equal sensitivity, which could be further enhanced by increasing the magnetic field strength (B0) of the clinical scanner from 3.0 T to 7.0 T (first systems are already in clinical use) or 10.5 T and beyond (first research systems available) [106-108]. In practice, the sensitivity ratio will also depend on B0 effects on the relaxation times, primarily T1 relaxation. An increase of T1 with increasing B0, favoring high sensitivity at lower magnetic field strengths, is well documented for the 1H resonances of water and metabolites [109], but the opposite has been shown for the 19F resonance of perfluorocarbons [110, 111]. Further developments of MR hardware, acquisition methods, and data processing are still necessary to shorten acquisition times, but the current study lays the groundwork for future, more elaborate studies, with the ultimate objective to translate 19F MRI into routine clinical practice.
Besides the trend towards higher magnetic field strengths [111], new developments in post-processing methods offer further possibilities to enhance 19F MRI sensitivity. The encoding trajectories commonly employed in UTE sequences are well-suited for undersampling and compressed sensing (CS) image reconstruction [112-114]. Multiple publications have demonstrated that the increased averaging enabled by CS can lead to sensitivity improvements for low SNR MRI [86, 115, 116]. The distribution of siponimod is less sparse than that of inflammatory lesions [86]. At the spatial resolution achieved in this study, the signal distribution has important features at the scale of single voxels, and thus does not possess the sparsity necessary for successful application of conventional CS techniques. There is a need to investigate whether tailored reconstruction methods could overcome this challenge, and to determine whether CS can only be harnessed at enhanced spatial resolutions. Another post-processing method relevant to 19F MRI of fluorinated drugs is B1 correction for data acquired with transceive surface RF probes. This would allow the computation of quantitative concentration maps with the help of an external standard. Retrospective techniques based on the steady-state signal equation can be employed for the UTE sequence employed in this study [117], while more complex, model-based approaches would be recommended if a RARE sequence were employed [118]. Finally, should sensitive hardware that enables alternating or even simultaneous 1H and 19F acquisition be available, motion correction techniques could be employed to reduce the need for restraining the subject under investigation and promote the successful outcome of the experiment without compromising animal welfare or patient comfort [119, 120].
Our goal is to harness the potential of 19F MRI as a powerful theranostic tool in the treatment and management of neurological pathologies such as MS. The stability of the siponimod signal in the stomach indicates a reduced gastric emptying and absorption of the drug. Future studies will investigate drug distribution in the absence of the confounding effects of anesthesia, since drug pharmacokinetics including absorption and distribution are likely to be affected [121]. Nevertheless, the increasing signals observed in the liver during the experiment, and presence of siponimod in subsequently harvested tissues indicate that siponimod was indeed absorbed despite reduced gastric motility.
A study with radioactively labeled siponimod reported detection of metabolites in blood samples from healthy human volunteers [122]. In mice, a cholesterol ester of siponimod, C56H80N2O3F3, still preserving the CF3 group, was reported as the main metabolite. This chemical change is unlikely to lead to significant differences in the chemical shift relative to the parent compound [122]. In our study, in vivo and ex vivo MR spectroscopy did not reveal secondary peaks, except for the brain sample of mouse 1 (M1), which showed a small peak at -76.2 ppm. An increase in negative chemical shift (-60 to -80 ppm) indicates increased shielding of the CF3 group, which can occur as a result of branching or hydrogen bond donors in close proximity to the CF3 group [123], as is the case with a known hydroxylated siponimod glucoronide metabolite [122]. However, considering that the -76.2 ppm peak is 0.6-1.1 ppm downstream of isoflurane [124], which sometimes contaminates the bore of the animal scanner following previous in vivo experiments, we cannot exclude isoflurane as a possible contaminant. Future experiments will involve repeated oral administrations of siponimod to determine whether the second -76.2 ppm peak will appear in the brain and other organs, especially in the context of neuroinflammatory pathology. It would also be appealing to determine whether siponimod metabolites can be differentiated from the parent drug in MS patients with in vivo 19F MRS. Alongside 19F MRI to image and localize drugs in vivo, localized MRS methods suitable for short T2 compounds, such as image-selected in vivo spectroscopy (ISIS), would be highly advantageous for non-invasive metabolite quantification to provide more insight into drug metabolism in vivo [125], especially during pathology.
Conclusions
We imaged siponimod for the first time in its unmanipulated form, as administered to MS patients, using non-invasive 19F MRI. Further technological progress will enable the necessary accelerations required to provide measurement protocols for drug imaging in the CNS in vivo. While larger studies are necessary to draw conclusions on the pharmacokinetics of siponimod, the present study reports its distribution in the CNS and other organs. The methods used in this study will provide the groundwork for future clinical studies in MS patients to monitor drugs in vivo. These developments will ultimately enable the use of 19F MRI, which has thus far been an underexploited and underexplored tool in theranostics.
Abbreviations
ANR: area-to-noise-ratio; a. u.: arbitrary units; BBB: blood brain barrier; bSSFP: balanced steady-state free precession; B0: static magnetic field; B1: radiofrequency field; CMC: carboxymethylcellulose; CNS: central nervous system; CPMG: Carr-Purcell-Meiboom-Gill; CRP: cryoprobe; DMD: disease-modifying drug; DMSO: dimethylsulfoxide; EAE: experimental autoimmune encephalomyelitis; FID: free induction decay; FLASH: Fast Low-Angle Shot; FOV: field of view; FWHM: full-width half maximum; ID: inner diameter; IP: intraperitoneal; MR: magnetic resonance; MRI: magnetic resonance imaging; MRS: magnetic resonance spectroscopy; MS: multiple sclerosis; PFA: paraformaldehyde; PSF: point spread function; pSNR: peak signal-to-noise ratio; PT: physiological temperature; RF: radio-frequency; RARE: Rapid Acquisition with Relaxation Enhancement; RRMS: relapse-remitting multiple sclerosis; RT: room temperature; SI: signal intensity; SPECT: single-photon emission computed tomography; SPMS: secondary progressive multiple sclerosis; SNR: signal-to-noise ratio; TA: acquisition time; TE: echo time; TR: repetition time; T1: longitudinal relaxation time; T2: transverse relaxation time; T2*: effective transverse relaxation time; UTE: ultrashort echo time; ΔTE: echo spacing; γ: gyromagnetic ratio.
Acknowledgements
This study was supported by Novartis, the European Research Council (ERC) under the European Union's Horizon 2020 research and innovation program under grant agreement No 743077 (ThermalMR) and the Deutsche Forschungsgemeinschaft to SW (DFG WA2804). We thank Mariya Aravina and Stefanie Münchberg for their support with carrying out the experiments.
TN is founder and CEO of MRI.TOOLS GmbH and received travel funds from Siemens Healthcare. SW received research grants from Novartis and Genzyme. LS and SW received presentation fees from Novartis.
Competing Interests
The authors have declared that no competing interest exists.
References
1. Cao L, Lao Y, Yao L, Yan P, Wang X, Yang Z. et al. Siponimod for multiple sclerosis. The Cochrane Database of Systematic Reviews. 2020. 2020
2. Cinamon G, Matloubian M, Lesneski MJ, Xu Y, Low C, Lu T. et al. Sphingosine 1-phosphate receptor 1 promotes B cell localization in the splenic marginal zone. Nature Immunology. 2004;5:713-20
3. Matloubian M, Lo CG, Cinamon G, Lesneski MJ, Xu Y, Brinkmann V. et al. Lymphocyte egress from thymus and peripheral lymphoid organs is dependent on S1P receptor 1. Nature. 2004;427:355-60
4. Kipp M. Does Siponimod Exert Direct Effects in the Central Nervous System? Cells. 2020;9:1771
5. Brand RM, Diddens J, Friedrich V, Pfaller M, Radbruch H, Hemmer B. et al. Siponimod Inhibits the Formation of Meningeal Ectopic Lymphoid Tissue in Experimental Autoimmune Encephalomyelitis. Neurology-Neuroimmunology Neuroinflammation. 2022 9
6. Dietrich M, Hecker C, Martin E, Langui D, Gliem M, Stankoff B. et al. Increased Remyelination and Proregenerative Microglia Under Siponimod Therapy in Mechanistic Models. Neurology-Neuroimmunology Neuroinflammation. 2022 9
7. Gentile A, Musella A, Bullitta S, Fresegna D, De Vito F, Fantozzi R. et al. Siponimod (BAF312) prevents synaptic neurodegeneration in experimental multiple sclerosis. Journal of Neuroinflammation. 2016;13:1-13
8. Correale J, Halfon MJ, Jack D, Rubstein A, Villa A. Acting centrally or peripherally: A renewed interest in the central nervous system penetration of disease-modifying drugs in multiple sclerosis. Multiple Sclerosis and Related Disorders. 2021;56:103264
9. Dong X. Current strategies for brain drug delivery. Theranostics. 2018;8:1481
10. Pandit R, Chen L, Götz J. The blood-brain barrier: Physiology and strategies for drug delivery. Advanced Drug Delivery Reviews. 2020;165-166:1-14
11. Banks WA. From blood-brain barrier to blood-brain interface: new opportunities for CNS drug delivery. Nature Reviews Drug Discovery. 2016;15:275-92
12. Shaughnessy MJ, Harsanyi A, Li J, Bright T, Murphy CD, Sandford G. Targeted Fluorination of a Nonsteroidal Anti-inflammatory Drug to Prolong Metabolic Half-Life. ChemMedChem. 2014;9:733-6
13. Wilkinson SM, Barron ML, O'Brien-Brown J, Janssen B, Stokes L, Werry EL. et al. Pharmacological Evaluation of Novel Bioisosteres of an Adamantanyl Benzamide P2X7 Receptor Antagonist. ACS Chemical Neuroscience. 2017;8:2374-80
14. Metelev VG, Bogdanov AA. Synthesis and applications of theranostic oligonucleotides carrying multiple fluorine atoms. Theranostics. 2020;10:1391-414
15. Xiong B, Wang Y, Chen Y, Xing S, Liao Q, Chen Y. et al. Strategies for Structural Modification of Small Molecules to Improve Blood-Brain Barrier Penetration: A Recent Perspective. Journal of Medicinal Chemistry. 2021;64:13152-73
16. Park BK, Kitteringham NR, O'Neill PM. Metabolism of Fluorine-Containing Drugs. Annual Review of Pharmacology and Toxicology. 2001;41:443-70
17. Richardson P. Applications of fluorine to the construction of bioisosteric elements for the purposes of novel drug discovery. Expert Opinion on Drug Discovery. 2021;16:1261-86
18. Liu S, Ma H, Zhang Z, Lin L, Yuan G, Tang X. et al. Synthesis of enantiopure 18F-trifluoromethyl cysteine as a structure-mimetic amino acid tracer for glioma imaging. Theranostics. 2019;9:1144-53
19. Prinz C, Starke L, Millward JM, Fillmer A, Delgado PR, Waiczies H. et al. In vivo detection of teriflunomide-derived fluorine signal during neuroinflammation using fluorine MR spectroscopy. Theranostics. 2021;11:2490-504
20. Food-and-Drug-Administration. Summary Review for Regulatory Action: Drug Approval Package - Mayzent (siponimod). In: Services USDoHaH, editor. FDA, ed. Center for drug evaluation and research. 2019
21. Ding H, Wu F. Image guided biodistribution and pharmacokinetic studies of theranostics. Theranostics. 2012;2:1040
22. Niendorf T, Ji Y, Waiczies S. Fluorinated natural compounds and synthetic drugs. In: Ahrens ET, Flögel U, editors. Fluorine magnetic resonance imaging: Pan Stanford Publishing. 2016 p. 311-44
23. Reid DG, Murphy PS. Fluorine magnetic resonance in vivo: a powerful tool in the study of drug distribution and metabolism. Drug Discovery Today. 2008;13:473-80
24. Chen XS. Introducing theranostics journal-from the editor-in-chief. Theranostics. 2011;1:1
25. Chen X, Wong S. Cancer theranostics: Academic Press; 2014
26. Holland G, Bottomley PA, Hinshaw W. 19F magnetic resonance imaging. Journal of Magnetic Resonance. 1977;28:133-6
27. Ruiz-Cabello J, Barnett BP, Bottomley PA, Bulte JW. Fluorine (19F) MRS and MRI in biomedicine. NMR in Biomedicine. 2011;24:114-29
28. Bartusik-Aebisher D, Bober Z, Aebisher D. Selected applications of fluorinated MR contrast agents and fluorine-containing drugs in medicine. Acta Poloniae Pharmaceutica-Drug Research. 2020;77:403-10
29. Xu Y, Tang P, Zhang W, Firestone L, Winter PM. Fluorine-19 nuclear magnetic resonance imaging and spectroscopy of sevoflurane uptake, distribution, and elimination in rat brain. The Journal of the American Society of Anesthesiologists. 1995;83:766-74
30. Constantinides C, Maguire ML, Stork L, Swider E, Srinivas M, Carr CA. et al. Temporal accumulation and localization of isoflurane in the C57BL/6 mouse and assessment of its potential contamination in 19F MRI with perfluoro-crown-ether-labeled cardiac progenitor cells at 9.4 Tesla. Journal of Magnetic Resonance Imaging. 2017;45:1659-67
31. Brix G, Bellemann ME, Haberkorn U, Gerlach L, Bachert P, Lorenz WJ. Mapping the biodistribution and catabolism of 5-fluorouracil in tumor-bearing rats by chemical-shift selective 19F MR imaging. Magnetic Resonance in Medicine. 1995;34:302-7
32. van Gorp JS, Seevinck PR, Andreychenko A, Raaijmakers AJ, Luijten PR, Viergever MA. et al. 19 F MRSI of capecitabine in the liver at 7 T using broadband transmit-receive antennas and dual-band RF pulses. NMR in Biomedicine. 2015;28:1433-42
33. Bolo NR, Hodé Y, Nédélec J-F, Lainé E, Wagner G, Macher J-P. Brain pharmacokinetics and tissue distribution in vivo of fluvoxamine and fluoxetine by fluorine magnetic resonance spectroscopy. Neuropsychopharmacology. 2000;23:428-38
34. Gabriel C, Gabriel S, Corthout Y. The dielectric properties of biological tissues: I. Literature survey. Physics in medicine & biology. 1996;41:2231
35. Duan Q, Duyn JH, Gudino N, De Zwart JA, Van Gelderen P, Sodickson DK. et al. Characterization of a dielectric phantom for high-field magnetic resonance imaging applications. Medical physics. 2014;41:102303
36. Waiczies S, Millward JM, Starke L, Delgado PR, Huelnhagen T, Prinz C. et al. Enhanced Fluorine-19 MRI Sensitivity using a Cryogenic Radiofrequency Probe: Technical Developments and Ex vivo Demonstration in a Mouse Model of Neuroinflammation. Scientific reports. 2017;7:9808
37. Waiczies H, Lepore S, Drechsler S, Qadri F, Purfurst B, Sydow K. et al. Visualizing brain inflammation with a shingled-leg radio-frequency head probe for 19F/1H MRI. Scientific reports. 2013;3:1280
38. Fuller GH. Nuclear spins and moments. Journal of physical and chemical reference data. 1976;5:835-1092
39. Baltes C, Radzwill N, Bosshard S, Marek D, Rudin M. Micro MRI of the mouse brain using a novel 400 MHz cryogenic quadrature RF probe. NMR in Biomedicine. 2009;22:834-42
40. Qin Q. Point spread functions of the T2 decay in k-space trajectories with long echo train. Magnetic Resonance Imaging. 2012;30:1134-42
41. Brown RW, Cheng Y-CN, Haacke EM, Thompson MR, Venkatesan R. Magnetic resonance imaging: physical principles and sequence design: John Wiley & Sons; 2014
42. Faber C, Schmid F. Pulse Sequence Considerations and Schemes in Fluorine Magnetic Resonance Imaging (ed. Flögel, U. and Ahrens, E.) 1-28. Pan Stanford Publishing. 2016
43. Scheffler K, Lehnhardt S. Principles and applications of balanced SSFP techniques. European Radiology. 2003;13:2409-18
44. Hofman MA. Evolution of the human brain: when bigger is better. Frontiers in neuroanatomy. 2014;8:15
45. Badea A, Ali-Sharief AA, Johnson GA. Morphometric analysis of the C57BL/6J mouse brain. NeuroImage. 2007;37:683-93
46. Coleman TF, Li Y. An interior trust region approach for nonlinear minimization subject to bounds. SIAM Journal on Optimization. 1996;6:418-45
47. Marshall I, Bruce SD, Higinbotham J, MacLullich A, Wardlaw JM, Ferguson KJ. et al. Choice of spectroscopic lineshape model affects metabolite peak areas and area ratios. Magnetic Resonance in Medicine. 2000;44:646-9
48. Bruce SD, Higinbotham J, Marshall I, Beswick PH. An analytical derivation of a popular approximation of the Voigt function for quantification of NMR spectra. Journal of Magnetic Resonance. 2000;142:57-63
49. Starke L. MRS Artifact Removal by Bayesian Fitting of Complex Voigt Line Shapes (v1.0) [Computer software]. GitHub: 10.5281/zenodo.6507817; 2022
50. Keeler J. Understanding NMR spectroscopy: John Wiley & Sons; 2011
51. Wójtewicz S, Wcisło P, Lisak D, Ciuryło R. Dispersion corrections to the Gaussian profile describing the Doppler broadening of spectral lines. Physical Review A. 2016;93:042512
52. Weideman JAC. Computation of the complex error function. SIAM Journal on Numerical Analysis. 1994;31:1497-518
53. Ruckstuhl A. Introduction to nonlinear regression. Institut fur Datenanalyse und Prozessdesign, Zürcher Hochschule für Angewandte Wissenschaften, available at https://statethzch/~stahel/courses/cheming/nlreg10Epdf. 2010
54. Gavin HP. The Levenberg-Marquardt algorithm for nonlinear least squares curve-fitting problems. Department of Civil and Environmental Engineering, Duke University. 2019 19
55. Fessler JA, Sutton BP. Nonuniform fast Fourier transforms using min-max interpolation. IEEE Transactions on Signal Processing. 2003;51:560-74
56. Fessler JA. Michigan Image Reconstruction Toolbox. available at https://webeecsumichedu/~fessler/code/. downloaded April 23rd. 2021
57. Duyn JH, Yang Y, Frank JA, van der Veen JW. Simple correction method for k-space trajectory deviations in MRI. Journal of Magnetic Resonance. 1998;132:150-3
58. Bruker. ParaVision 6.0.1 Operating Manual Version 001. Bruker BioSpin MRI GmbH; 2015
59. Forman SD, Cohen JD, Fitzgerald M, Eddy WF, Mintun MA, Noll DC. Improved assessment of significant activation in functional magnetic resonance imaging (fMRI): Use of a cluster-size threshold. Magnetic Resonance in Medicine. 1995;33:636-47
60. Starke L, Niendorf T, Waiczies S. Data preparation protocol for low signal-to-noise ratio fluorine-19 MRI. Preclinical MRI of the Kidney: Methods and Protocols, Pohlmann A; Niendorf T, Eds Springer US: New York, NY. 2021:711-22
61. Hansen MS. Nuts & Bolts of Advanced Imaging: Image Reconstruction - Parallel Imaging. Proceedings of the International Society of Magnetic Resonance in Medicine. 2014
62. Hansen MS, Kellman P. Image reconstruction: an overview for clinicians. Journal of Magnetic Resonance Imaging. 2015;41:573-85
63. Constantinides CD, Atalar E, McVeigh ER. Signal-to-noise measurements in magnitude images from NMR phased arrays. Magnetic Resonance in Medicine. 1997;38:852-7
64. Kappos L, Li DK, Stüve O, Hartung H-P, Freedman MS, Hemmer B. et al. Safety and efficacy of siponimod (BAF312) in patients with relapsing-remitting multiple sclerosis: dose-blinded, randomized extension of the phase 2 BOLD study. JAMA neurology. 2016;73:1089-98
65. Kappos L, Bar-Or A, Cree BAC, Fox RJ, Giovannoni G, Gold R. et al. Siponimod versus placebo in secondary progressive multiple sclerosis (EXPAND): a double-blind, randomised, phase 3 study. The Lancet. 2018;391:1263-73
66. Behrangi N, Heinig L, Frintrop L, Santrau E, Kurth J, Krause B. et al. Siponimod ameliorates metabolic oligodendrocyte injury via the sphingosine-1 phosphate receptor 5. Proceedings of the National Academy of Sciences. 2022;119:e2204509119
67. Ward LA, Lee DS, Sharma A, Wang A, Naouar I, Ma XI. et al. Siponimod therapy implicates Th17 cells in a preclinical model of subpial cortical injury. JCI Insight. 2020 5
68. Hundehege P, Cerina M, Eichler S, Thomas C, Herrmann AM, Göbel K. et al. The next-generation sphingosine-1 receptor modulator BAF312 (siponimod) improves cortical network functionality in focal autoimmune encephalomyelitis. Neural regeneration research. 2019;14:1950
69. Bigaud M, Rudolph B, Briard E, Beerli C, Hofmann A, Hermes E. et al. Siponimod (BAF312) penetrates, distributes, and acts in the central nervous system: Preclinical insights. Multiple Sclerosis Journal - Experimental, Translational and Clinical. 2021;7:20552173211049168
70. Shakeri-Nejad K, Gardin A, Gray C, Neelakantham S, Dumitras S, Legangneux E. Safety, Tolerability, Pharmacodynamics and Pharmacokinetics of Intravenous Siponimod: A Randomized, Open-label Study in Healthy Subjects. Clinical Therapeutics. 2020;42:175-95
71. Pan S, Gray NS, Gao W, Mi Y, Fan Y, Wang X. et al. Discovery of BAF312 (Siponimod), a potent and selective S1P receptor modulator. ACS medicinal chemistry letters. 2013;4:333-7
72. Gergely P, Nuesslein-Hildesheim B, Guerini D, Brinkmann V, Traebert M, Bruns C. et al. The selective sphingosine 1-phosphate receptor modulator BAF312 redirects lymphocyte distribution and has species-specific effects on heart rate. British journal of pharmacology. 2012;167:1035-47
73. Novartis-Europharm-Ltd. Siponimod (Mayzent®): EPAR - Summary of product characteristics. 2020.
74. Prinz C, Starke L, Ramspoth T-F, Kerkering J, Martos Riaño V, Paul J. et al. Pentafluorosulfanyl (SF5) as a Superior 19F Magnetic Resonance Reporter Group: Signal Detection and Biological Activity of Teriflunomide Derivatives. ACS Sensors. 2021: 10.1021/acssensors.1c01024.
75. Weiss HM, Gatlik E. Equilibrium gel filtration to measure plasma protein binding of very highly bound drugs. Journal of Pharmaceutical Sciences. 2014;103:752-9
76. Mei H, Remete AM, Zou Y, Moriwaki H, Fustero S, Kiss L. et al. Fluorine-containing drugs approved by the FDA in 2019. Chinese Chemical Letters. 2020;31:2401-13
77. Wanat K. Biological barriers, and the influence of protein binding on the passage of drugs across them. Molecular Biology Reports. 2020;47:3221-31
78. Banks WA. Characteristics of compounds that cross the blood-brain barrier. BMC Neurology. 2009;9:S3
79. Kadry H, Noorani B, Cucullo L. A blood-brain barrier overview on structure, function, impairment, and biomarkers of integrity. Fluids and Barriers of the CNS. 2020;17:69
80. Cohan SL, Benedict RHB, Cree BAC, DeLuca J, Hua LH, Chun J. The Two Sides of Siponimod: Evidence for Brain and Immune Mechanisms in Multiple Sclerosis. CNS Drugs. 2022;36:703-19
81. Yanagida K, Liu CH, Faraco G, Galvani S, Smith HK, Burg N. et al. Size-selective opening of the blood-brain barrier by targeting endothelial sphingosine 1-phosphate receptor 1. Proceedings of the National Academy of Sciences of the United States of America. 2017;114:4531-6
82. Pellecchia M, Bertini I, Cowburn D, Dalvit C, Giralt E, Jahnke W. et al. Perspectives on NMR in drug discovery: a technique comes of age. Nature Reviews Drug Discovery. 2008;7:738-45
83. Nicholson J, Lindon J. Analysis of drug-protein binding using nuclear magnetic resonance based molecular diffusion measurements. Analytical Communications. 1997;34:225-8
84. Garello F, Boido M, Miglietti M, Bitonto V, Zenzola M, Filippi M. et al. Imaging of Inflammation in Spinal Cord Injury: Novel Insights on the Usage of PFC-Based Contrast Agents. Biomedicines. 2021;9:379
85. Chapelin F, Capitini CM, Ahrens ET. Fluorine-19 MRI for detection and quantification of immune cell therapy for cancer. Journal for Immunotherapy of Cancer. 2018;6:1-11
86. Starke L, Pohlmann A, Prinz C, Niendorf T, Waiczies S. Performance of compressed sensing for fluorine-19 magnetic resonance imaging at low signal-to-noise ratio conditions. Magnetic Resonance in Medicine. 2020;84:592-608
87. Couch MJ, Ball IK, Li T, Fox MS, Biman B, Albert MS. 19F MRI of the lungs using inert fluorinated gases: Challenges and new developments. Journal of Magnetic Resonance Imaging. 2019;49:343-54
88. Couch MJ, Ball IK, Li T, Fox MS, Littlefield SL, Biman B. et al. Pulmonary ultrashort echo time 19F MR imaging with inhaled fluorinated gas mixtures in healthy volunteers: feasibility. Radiology. 2013;269:903-9
89. Block KT, Chandarana H, Milla S, Bruno M, Mulholland T, Fatterpekar G. et al. Towards routine clinical use of radial stack-of-stars 3D gradient-echo sequences for reducing motion sensitivity. Journal of the Korean Society of Magnetic Resonance in Medicine. 2014;18:87-106
90. Rothe M, Jahn A, Weiss K, Hwang J-H, Szendroedi J, Kelm M. et al. In vivo 19F MR inflammation imaging after myocardial infarction in a large animal model at 3 T. Magnetic Resonance Materials in Physics, Biology and Medicine. 2019;32:5-13
91. Gai ND, Rochitte C, Nacif MS, Bluemke DA. Optimized three-dimensional sodium imaging of the human heart on a clinical 3T scanner. Magnetic Resonance in Medicine. 2015;73:623-32
92. Boada FE, Gillen JS, Shen GX, Chang SY, Thulborn KR. Fast three dimensional sodium imaging. Magnetic Resonance in Medicine. 1997;37:706-15
93. Nagel AM, Laun FB, Weber MA, Matthies C, Semmler W, Schad LR. Sodium MRI using a density-adapted 3D radial acquisition technique. Magnetic Resonance in Medicine: An Official Journal of the International Society for Magnetic Resonance in Medicine. 2009;62:1565-73
94. Bottomley PA. Sodium MRI in human heart: a review. NMR in Biomedicine. 2016;29:187-96
95. Zaric O, Juras V, Szomolanyi P, Schreiner M, Raudner M, Giraudo C. et al. Frontiers of sodium MRI revisited: From cartilage to brain imaging. Journal of Magnetic Resonance Imaging. 2021;54:58-75
96. Solon EG. Autoradiography techniques and quantification of drug distribution. Cell and Tissue Research. 2015;360:87-107
97. Burrows DJ, McGown A, Jain SA, De Felice M, Ramesh TM, Sharrack B. et al. Animal models of multiple sclerosis: from rodents to zebrafish. Multiple Sclerosis Journal. 2019;25:306-24
98. Bjelobaba I, Begovic-Kupresanin V, Pekovic S, Lavrnja I. Animal models of multiple sclerosis: Focus on experimental autoimmune encephalomyelitis. Journal of Neuroscience Research. 2018;96:1021-42
99. Hamstra DA, Lee KC, Tychewicz JM, Schepkin VD, Moffat BA, Chen M. et al. The use of 19F spectroscopy and diffusion-weighted MRI to evaluate differences in gene-dependent enzyme prodrug therapies. Molecular Therapy. 2004;10:916-28
100. Cron GO, Beghein N, Ansiaux R, Martinive P, Feron O, Gallez B. 19F NMR in vivo spectroscopy reflects the effectiveness of perfusion-enhancing vascular modifiers for improving gemcitabine chemotherapy. Magnetic Resonance in Medicine. 2008;59:19-27
101. Arndt DC, Ratner AV, Faull KF, Barchas JD, Young SW. 19F magnetic resonance imaging and spectroscopy of a fluorinated neuroleptic ligand: In vivo and in vitro studies. Psychiatry research. 1988;25:73-9
102. Strauss WL, Layton ME, Dager SR. Brain elimination half-life of fluvoxamine measured by 19F magnetic resonance spectroscopy. American Journal of Psychiatry. 1998;155:380-4
103. Henry ME, Bolo NR, Zuo CS, Villafuerte RA, Cayetano K, Glue P. et al. Quantification of brain voriconazole levels in healthy adults using fluorine magnetic resonance spectroscopy. Antimicrobial agents and chemotherapy. 2013;57:5271-6
104. Schoormans J, Calcagno C, Daal MR, Wüst RC, Faries C, Maier A. et al. An iterative sparse deconvolution method for simultaneous multicolor 19F-MRI of multiple contrast agents. Magnetic resonance in medicine. 2020;83:228-39
105. Mason J. Multinuclear Nmr: Springer Science & Business Media; 2012
106. Barisano G, Sepehrband F, Ma S, Jann K, Cabeen R, Wang DJ. et al. Clinical 7 T MRI: Are we there yet? A review about magnetic resonance imaging at ultra-high field. The British Journal of Radiology. 2019;92:20180492
107. Sadeghi-Tarakameh A, DelaBarre L, Lagore RL, Torrado-Carvajal A, Wu X, Grant A. et al. In vivo human head MRI at 10.5 T: A radiofrequency safety study and preliminary imaging results. Magnetic resonance in medicine. 2020;84:484-96
108. Budinger TF, Bird MD. MRI and MRS of the human brain at magnetic fields of 14 T to 20 T: Technical feasibility, safety, and neuroscience horizons. NeuroImage. 2018;168:509-31
109. de Graaf RA, Brown PB, McIntyre S, Nixon TW, Behar KL, Rothman DL. High magnetic field water and metabolite proton T1 and T2 relaxation in rat brain in vivo. Magnetic resonance in medicine. 2006;56:386-94
110. Kadayakkara DK, Damodaran K, Hitchens TK, Bulte JW, Ahrens ET. 19F spin-lattice relaxation of perfluoropolyethers: dependence on temperature and magnetic field strength (7.0-14.1 T). Journal of Magnetic Resonance. 2014;242:18-22
111. Waiczies S, Rosenberg JT, Kuehne A, Starke L, Delgado PR, Millward JM. et al. Fluorine-19 MRI at 21.1 T: enhanced spin-lattice relaxation of perfluoro-15-crown-5-ether and sensitivity as demonstrated in ex vivo murine neuroinflammation. Magnetic Resonance Materials in Physics, Biology and Medicine. 2019;32:37-49
112. Lustig M, Donoho D, Pauly JM. Sparse MRI: The application of compressed sensing for rapid MR imaging. Magnetic Resonance in Medicine. 2007;58:1182-95
113. Block KT, Uecker M, Frahm J. Undersampled radial MRI with multiple coils. Iterative image reconstruction using a total variation constraint. Magnetic Resonance in Medicine. 2007;57:1086-98
114. Madelin G, Chang G, Otazo R, Jerschow A, Regatte RR. Compressed sensing sodium MRI of cartilage at 7T: preliminary study. Journal of Magnetic Resonance. 2012;214:360-5
115. Zhong J, Mills PH, Hitchens TK, Ahrens ET. Accelerated fluorine-19 MRI cell tracking using compressed sensing. Magnetic Resonance in Medicine. 2013;69:1683-90
116. Chen J, Pal P, Ahrens ET. Enhanced detection of paramagnetic fluorine-19 MRI agents using zero echo time sequence and compressed sensing. NMR in Biomedicine. 2022: e4725.
117. Vernikouskaya I, Pochert A, Lindén M, Rasche V. Quantitative 19F MRI of perfluoro-15-crown-5-ether using uniformity correction of the spin excitation and signal reception. Magnetic Resonance Materials in Physics, Biology and Medicine. 2019;32:25-36
118. Delgado PR, Kuehne A, Aravina M, Millward JM, Vázquez A, Starke L. et al. B1 inhomogeneity correction of RARE MRI at low SNR: Quantitative in vivo 19F MRI of mouse neuroinflammation with a cryogenically-cooled transceive surface radiofrequency probe. Magnetic Resonance in Medicine. 2022;87:1952-70
119. Keupp J, Rahmer J, Grässlin I, Mazurkewitz PC, Schaeffter T, Lanza GM. et al. Simultaneous dual-nuclei imaging for motion corrected detection and quantification of 19F imaging agents. Magnetic resonance in medicine. 2011;66:1116-22
120. Wilferth T, Müller M, Gast LV, Ruck L, Meyerspeer M, Lopez Kolkovsky AL. et al. Motion-corrected 23Na MRI of the human brain using interleaved 1H 3D navigator images. Magnetic Resonance in Medicine. 2022;88:309-21
121. van den Berg JP, Vereecke HEM, Proost JH, Eleveld DJ, Wietasch JKG, Absalom AR. et al. Pharmacokinetic and pharmacodynamic interactions in anaesthesia. A review of current knowledge and how it can be used to optimize anaesthetic drug administration. British Journal of Anaesthesia. 2017;118:44-57
122. Glaenzel U, Jin Y, Nufer R, Li W, Schroer K, Adam-Stitah S. et al. Metabolism and disposition of siponimod, a novel selective S1P1/S1P5 agonist, in healthy volunteers and in vitro identification of human cytochrome P450 enzymes involved in its oxidative metabolism. Drug Metabolism and Disposition. 2018;46:1001-13
123. Dalvit C, Vulpetti A. Intermolecular and intramolecular hydrogen bonds involving fluorine atoms: implications for recognition, selectivity, and chemical properties. ChemMedChem. 2012;7:262-72
124. Prinz C, Delgado PR, Eigentler TW, Starke L, Niendorf T, Waiczies S. Toward (19)F magnetic resonance thermometry: spin-lattice and spin-spin-relaxation times and temperature dependence of fluorinated drugs at 9.4 T. Magnetic Resonance Materials in Physics, Biology and Medicine. 2019;32:51-61
125. Ordidge RJ, Connelly A, Lohman JA. Image-selected in vivo spectroscopy (ISIS). A new technique for spatially selective NMR spectroscopy. Journal of Magnetic Resonance (1969). 1986;66:283-94
Author contact
![]() Corresponding author: Dr. Sonia Waiczies, Max-Delbrück-Center for Molecular Medicine (MDC) in the Helmholtz Association, Berlin Ultrahigh Field Facility (B.U.F.F.), Robert-Rössle-Str. 10 | D-13125 Berlin-Buch. e-mail: sonia.waicziesde.
Corresponding author: Dr. Sonia Waiczies, Max-Delbrück-Center for Molecular Medicine (MDC) in the Helmholtz Association, Berlin Ultrahigh Field Facility (B.U.F.F.), Robert-Rössle-Str. 10 | D-13125 Berlin-Buch. e-mail: sonia.waicziesde.