Impact Factor
- Issue 14; 2026
- Issue 13; 2026
- Issue 12; 2026
- Issue 11; 2026
- Issue 10; 2026
- Volume 16; 2026
- Advance Articles
- Past Issues
- Cover Images
- Cover Suggestion
- Index & Coverage
- Special Issues
Introduction
Materials and Methods
Results and Discussion
Conclusion
Supplementary Material
Acknowledgements
References
International Journal of Biological Sciences
International Journal of Medical Sciences
 Global reach, higher impact

Theranostics 2022; 12(6):2549-2559. doi:10.7150/thno.68743 This issue Cite
Research Paper
High-fidelity imaging of amyloid-beta deposits with an ultrasensitive fluorescent probe facilitates the early diagnosis and treatment of Alzheimer's Disease
Rongrong Tao1, Ning Wang2, Tianruo Shen3, Yuhang Tan1, Yong Ren2, Wenjing Wei1, Meihua Liao1, Davin Tan3, Chunzhi Tang1, Nenggui Xu1, Huan Wang4 ![]() , Xiaogang Liu3
, Xiaogang Liu3 ![]() , Xin Li2
, Xin Li2 ![]()
1. Medical College of Acupuncture-Moxibustion and Rehabilitation, Guangzhou University of Chinese Medicine, Guangzhou, Guangdong 510006, China
2. College of Pharmaceutical Sciences, Zhejiang University, Hangzhou, Zhejiang 301158, China
3. Fluorescence Research Group, Singapore University of Technology and Design, 8 Somapah Road, Singapore 487372, Singapore
4. College of Life Science and Technology, Dalian University, Dalian, Liaoning 116622, China
Received 2021-11-5; Accepted 2022-2-6; Published 2022-2-28
Abstract

Background: Imaging amyloid-beta (Aβ) deposits with high fidelity in naturally aging brains is crucial for the early diagnosis of Alzheimer's disease (AD). However, this is impeded by the lack of highly sensitive probes.
Methods: By conducting computational modelling to quantitatively fine-tune the twisted intramolecular charge transfer (TICT) tendency of Thioflavin T (ThT) analogues, we developed an ultrasensitive probe AH-2. AH-2 retained the binding affinity and binding mode of ThT towards Aβ deposits, and exhibited ca 10-fold less background fluorescence and 5-10 folds of improved signal-to-background contrast upon binding Aβ deposits. These desirable features endowed AH-2 the sensitivity to detect Aβ deposition in naturally aging wild-type mice.
Results: AH-2 imaging revealed that Aβ puncta signals appeared near the nuclei in young mice and spread through the intracellular and extracellular compartments in older mice. Moreover, Aβ deposits were observed to emerge earlier in mice cerebral cortex than in the hippocampus region. Given this desirable sensitivity and good spatiotemporal resolution, AH-2 was successfully applied in the preclinical evaluation of Aβ-targeted treatment by melatonin.
Conclusions: We expect that AH-2 is promising for early diagnosis of AD and will serve as a sensitive tool for studying Aβ-related AD pathology.
Keywords: fluorescent probe, fluorescent imaging, amyloid-beta, Alzheimer's disease, intramolecular charge transfer
Introduction
Alzheimer's disease (AD) is the leading cause of neurological disorders in the aging population. It is characterized by continuous memory loss and progressive decline of cognitive abilities, eventually resulting in the death of patients [1, 2]. In the United States alone, AD caused 122,019 deaths in 2018, and cost $244 billion in patient care in 2019, in addition to unmeasurable physical and mental distress to both patients and caregivers [3]. Unfortunately, no effective treatment is currently available to restore AD-related neurological deficits in clinical cases, which is largely attributed to the delayed intervention and the complexity of AD pathogenesis [4, 5]. Early detection and accurate diagnosis are thus crucial to the success of pre-symptomatic intervention initiation and the improvement of treatment outcomes [6].
To obtain accurate information with predictive or early diagnostic value, researchers have been targeting the cerebral deposition of amyloid-beta (Aβ) peptides, a pathological hallmark of AD that can occur decades before the onset of dementia [7, 8]. Previous studies have revealed that Aβ deposition, hippocampal atrophy, and episodic memory impairment occurred sequentially in elderly subjects, with Aβ deposition being the initial event in the cascade [9, 10]. These results suggest that detecting cerebral Aβ deposition with high fidelity would offer credible information to support the early diagnosis of AD. However, an extensive breakthrough in the field is still needed for the effective imaging of Aβ deposition before the onset or in the pre-symptomatic stage of AD.
Currently, there are two molecular imaging modalities for the non-invasive detection of Aβ deposits, namely radionuclide imaging and fluorescence imaging [11]. Radionuclide imaging includes single-photon emission computed tomography (SPECT) and positron emission computed tomography (PET) [12]. The radioactive nature of SPECT and PET, coupled with their heavy reliance on radiochemistry facilities, makes these techniques less ideal and limits their widespread applicability. In contrast, fluorescence imaging represents a much safer and more affordable alternative to realize the in vivo imaging of Aβ plaques. In this regard, various fluorescent probes selectively staining Aβ deposits have been developed [13-17], with Congo Red and Thioflavin T (ThT) being the key representatives. Whilst some reported probes have realized the in vivo imaging of Aβ deposits in AD-modelled transgenic mice [18-23], highly sensitive probes remain underexplored that are capable of imaging Aβ deposits in naturally aged wide-type mice which express only a trace amount of Aβ deposits and represent the pre-symptomatic stage of AD. The ability to effectively image Aβ deposition in the normal brain aging process is essential to understand Aβ-related dementia pathogenesis and could serve as a gold standard for predicting the onset of AD [24, 25]. However, accurately mapping Aβ deposits in normal mice before the onset of AD demands a probe with ultra-sensitivity and high fidelity.
Herein, by computationally modelling to fine-tune the twisted intramolecular charge transfer (TICT) tendency of ThT [26], we developed an ultrasensitive probe AH-2 for detecting Aβ deposits. Unbound AH-2 emitted negligible fluorescence in an aqueous solution, ca. 10-fold less than the parent ThT structure. However, AH-2 displayed dramatically enhanced fluorescence in the range of 550-650 nm upon binding to Aβ deposits, and this fluorogenic response was relatively specific towards Aβ deposits. Accordingly, AH-2 afforded desirable signal-to-noise ratio and enabled three-dimensional (3D) imaging of Aβ deposits with good spatial resolution in the aging brains of mice both in vitro and in vivo. Our experiments revealed that the number of Aβ deposits increased in an age-dependent manner in the wide-type mice, and significant Aβ deposits were observed in wide-type mice as early as 8 months old. The spatial distribution pattern of Aβ deposits in mice aging process was also recorded facilitated by AH-2 imaging. Moreover, AH-2 was successfully applied to assess the efficacy of anti-AD treatments and revealed the great potency of melatonin to decrease cerebral Aβ plaques. These results highlighted the success of this computer-aided probe design strategy and demonstrated AH-2 as a promising tool for early AD diagnosis and treatment evaluation.
Materials and Methods
Materials
Unless otherwise stated, all reagents and chemicals for imaging experiments were purchased from Sigma Aldrich. Human Aβ1-42 monomer was obtained from Chinese Peptide Company (Lot: AMYD-003). Thioflavin T (ThT) dye (HY-D0218) was purchased from MedChemExpress (Shanghai, China). Primary antibodies PKC (2056S), p-PKC (9375S), and HRP-Linked secondary antibody (7074S, 7076S) for Western-blot analysis were purchased from Cell Signal Technology (Massachusetts, US). GAPDH (70-Mab5465-040) was bought from Multi-Sciences Biotech (Hangzhou, China). Primary antibody to Aβ1-42/1-40 (NBP2-13075) was bought from Novus Biologicals (Minnesota, US). The Alexa-fluor 647 mouse IgG (A-31571) was purchased from Thermo Fisher Scientific (Massachusetts, US). Antifade mounting medium containing DAPI (H1200) was obtained from Vector Labs (California, US).
Probe synthesis and structure elucidation
Methods for probe synthesis and for structure elucidation were described in the supporting information.
Animals and drug treatment
All animal experiments were conducted following the experimental animal care and use guidelines of the National Institutes of Health (NIH, USA). Experiment protocols and procedures were approved by the Committee for Animal Experiments at Guangzhou University of Chinese Medicine in China (permit code: SYXK (YUE) 2017-0179). AD-modelled 3xTg AD mice and 5xFAD mice were kindly provided by Song lab in Guangzhou University of Chinese Medicine. Male and female mice were mated and bred in stable conditions in terms of temperature, humidity, and 12 h light/dark cycle. Standard laboratory diet and water were provided for the mice. The male age-matched wild type, 3xTg AD and 5xFAD mice at specific ages ranging from 2 months to 13 months were used in the present study for in vivo two-photon microscope imaging, immunofluorescence staining, and Western blot analysis. For melatonin treatment, mice at age of 12 months were administrated with melatonin (M5250, Sigma Aldrich) at a daily dose of 10 mg/kg for 4 weeks. Melatonin was dissolved in ethanol and then diluted by water to 1% ethanol.
Immunofluorescence and Western blot analysis
Detailed methods were described in the supporting information.
In vivo two-photon imaging
To image Aβ aggregates in vivo, two-photon microscope imaging was performed using an upright two-photon laser scanning microscope Nikon A1R MP equipped with Sapphire laser (Coherent, chameleon vision II) and Nikon 25 × 1.1 NA water-immersion microscope objective lens. The 3xTg AD mice (2, 8, 13 months old, male) and age-matched WT mice (2, 8, 13 months old, male) were anesthetized with 2.5 % isoflurane in 1.5 L/min oxygen flow, and preparation for cranial imaging window surgery was previously described [27]. The anesthetized mice were imaged through a craniotomy window with a 4 mm diameter, centered at stereotaxic coordinates 2.5 mm caudal to bregma and 2.5 mm lateral to the midline. After AH-2 administration, the glass cover lid (6 mm diameter) with a metal frame (10 mm diameter) was glued to the skull to cover the craniotomy window before imaging. To monitoring Aβ aggregation in the brain of 3xTg AD model mice and age-matched WT mice, the AH-2 signal was collected from emission at 580 nm upon the excitation at 860 nm. The images were taken at depth of 100-150 μm below the cortical surface. The images were captured at a solution of 512 × 512 pixels resolution. Image J software was used for image analysis.
Statistics
The data were present graphically and analysed statistically with one-way analysis of variance (ANOVA) followed by a post hoc Tukey's test or Dunnett's comparison to control, or two-way ANOVA analysis for groups during aging. All data were expressed as mean ± SEM, and statistical significance was marked when p < 0.05.
Results and Discussion
Computer-aided probe design
Currently, ThT is probably the most popular fluorescent dye used for staining Aβ fibrils (Figure 1A). ThT is weakly fluorescent in aqueous solutions but exhibits an enhanced emission at 482 nm upon binding to Aβ plaques. This fluorogenic property makes it particularly attractive for the no-wash labelling of Aβ plaques. It is generally accepted that the fluorogenicity of ThT resulted from the modulation of TICT. The free rotation of ThT in a non-viscous solution enables the formation of the TICT state upon photoexcitation, which quenches its fluorescence [28]. Upon binding with amyloid fibrils at the side chain channels along the long axis of amyloid fibrils [29, 30], the TICT rotation of ThT is inhibited, leading to strong emission [31]. ThT is therefore a good starting point to develop ultrasensitive probes for staining Aβ fibrils in naturally-aged wide-type mice. To further improve the signal-to-background imaging contrast of ThT, it is essential to minimize background fluorescence that originates from the unbound probe [32]. Hence, we set out to tune the TICT effect of ThT by adjusting the electron-donating group (EDG) and the electron-withdrawing group (EWG), respectively. In this context, the aniline part of ThT was replaced by a naphthalene amine or a coumarine amine moiety to tune its electron-donating ability, and four derivatives (AH-1, AH-2, AH-3, and AH-4) were designed (Figure 1A).
Molecular design strategy. (A) Molecular structures of ThT, AH-1, AH-2, AH-3, and AH-4. (B) Calculated vertical ionization energies (VIE, eV) of donors D1-D3 and calculated vertical electron affinities (VEA, eV) of acceptors A1-A3. (C) Calculated potential energy surface of AH-2 as a function of θ2 in water. (D) HOMOs and LUMOs of AH-2 in the LE and TICT states in water.
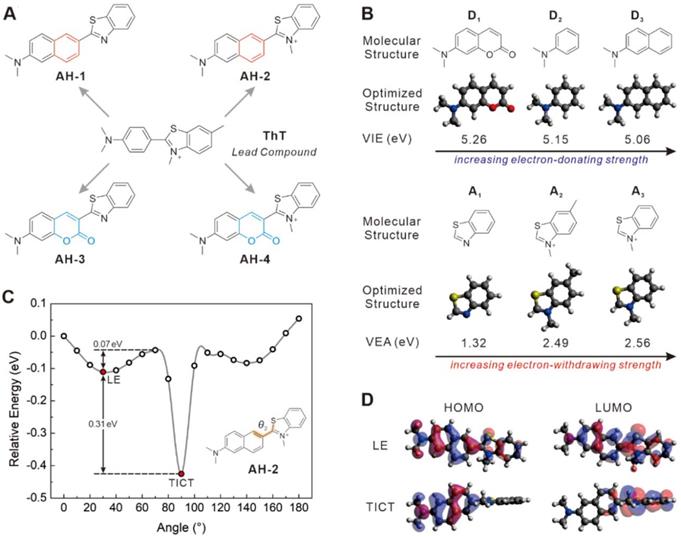
To assess the TICT tendency of these probes, we first analysed the electron-donating/withdrawing strength of their main building blocks, including donors D1-D3 and acceptors A1-A3. This is because increasing the donor electron-donating strength and/or the acceptor electron-withdrawing strength tends to enhance the TICT tendency, thus decreasing background emissions and improving the overall signal-to-noise ratios. According to our calculated vertical ionization energy in vacuo (Figure 1B and S1), the electron-donating strength increases in the order of D1 < D2 < D3. Among the three acceptors, calculated vertical electron affinity revealed that the electron-withdrawing strength follows the order of A1 < A2 < A3 (Figure 1B). These results suggest that AH-2 (or D3+A3) possesses the strongest push-pull effect among all D-A combinations, thus affording a higher TICT tendency than other compounds, such as ThT (or D2+A2), AH-1 (or D3+A1), AH-3 (or D1+A1), and AH-4 (D1+A3).
Indeed, modelling of the excited state potential energy surface (PES) revealed that among AH-1, AH-2, AH-3, and AH-4, which possess similar molecular sizes, only AH-2 displayed a stable TICT state, with a small energy barrier of 0.07 eV and a strong driving force of 0.31 eV (Figure 1C). Notably, while the quasi-planar locally excited (LE) state of AH-2 exhibits a large oscillator strength (f = 1.5537), the twisted conformation of AH-2 (θ = ~90°) possesses a nearly zero oscillator strength (f = 0.0058), with complete charge separation between the donor and acceptor fragments (Figure 1D). These features are consistent with the TICT mechanism and suggest negligible background emissions from AH-2 in a non-viscous environment, due to considerable TICT formation rates.
In stark contrast, PES calculations show that only a stable LE state exists in AH-1, AH-3, and AH-4, and the twisted conformations of these compounds are not stable (Figure S1). In other words, these three compounds are not prone to TICT formations and would exhibit strong background emissions. Moreover, even though previous studies have shown that ThT could form the TICT state upon photoexcitation [33], based on our calculations, ThT possesses a weaker push-pull strength than our designed AH-2 probe.
These modelling experiments predict that amongst all the probe candidates, AH-2 would exhibit the strongest TICT tendency, the lowest background emission, and the highest fluorescence turn-on ratio upon binding with Aβ fibrils.
Confirming the improved sensitivity of AH-2 to Aβ deposits by solution-based assay
To test the reliability of the afore-mentioned probe design strategy, probes AH-1, AH-2, AH-3, and AH-4 were subsequently synthesized (Schemes S1 and S2). Their photophysical responses towards Aβ deposits were tested accordingly. The Aβ deposits were prepared from human Aβ (1-42) peptides and confirmed by transmission electron microscopy, which showed fibril formation (Figure S2). Then the four probes were individually recorded for their fluorescence spectra before and after exposure to Aβ fibrils. As shown in the normalized emission spectra (Figure 2A), only probe AH-2 demonstrated a robust fluorescence enhancement upon the treatment of Aβ fibrils, whereas the increase for probe AH-1, AH-3, and AH-4 was generally below 3-fold. This is in good agreement with the computational results which showed that these three compounds are not prone to TICT formations and thus displayed strong background emissions and low signal-to-noise ratios.
Photophysical characterization of Aβ fibrils-specific response of AH-2. (A) Fluorescence-response of probes AH-1—AH-4 to Aβ fibrils. The concentrations of probes were kept at 5 µM, while that of Aβ fibrils was kept at 2.5 µM. The fluorescence spectra of each probe before binding Aβ fibrils were normalized to its emission after the treatment of Aβ fibrils. (B) Fluorescence increment of probe AH-2 (at 587 nm) in comparison to ThT (at 480 nm) in response to Aβ fibrils. Each probe was kept at 2, 4, or 8 µM; Aβ fibrils were kept at 2 µM. F was the intensity of the probe treated with Aβ fibrils; while F0 was the probe intensity at the indicated concentration without Aβ fibrils treatment. (C) Photophysical property of AH-2 in solvents of various polarities. (D) Fluorescence spectra of AH-2 in PBS with various proportional glycerol to adjusting solution viscosity. (E) Binding affinity plot between AH-2 and Aβ fibrils. Kd1 plot was carried out by setting AH-2 at a fixed concentration of 100 nM and varying concentrations of Aβ (1-42) aggregates. Kd2 plot was carried out by setting Aβ (1-42) aggregates at a fixed concentration of 100 nM and varying concentrations of AH-2. Data in A, B, and D were recorded on a fluorescent spectrometry while those in E were recorded on a microplate reader.
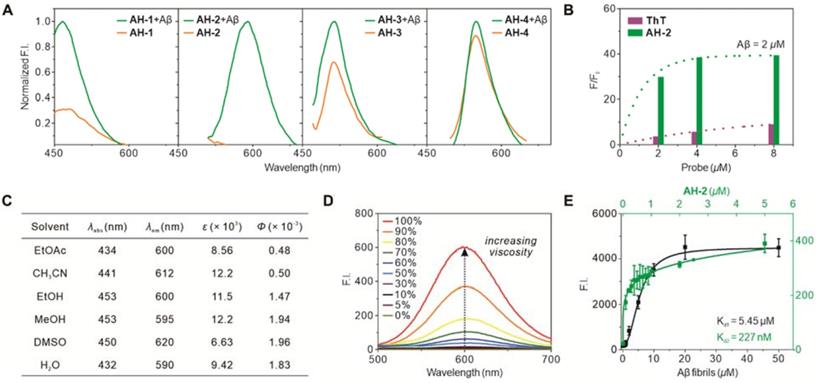
Next, we compared the sensitivity of AH-2 with that of ThT. Various concentrations of AH-2 and ThT were treated with Aβ fibrils (2 µM), and their fibril-triggered fluorescence response was recorded. AH-2 displayed a much higher increase of fluorescence (F/F0) than ThT (Figure 2B), which denotes its improved signal-to-background contrast by ca 5-10 times. This is largely attributed to the decreased background emissions, underscoring the reliability of our computer-aided probe design strategy.
To confirm the TICT mechanism for the fluorogenic response of AH-2 to Aβ fibrils, its emission spectra in solvents of various polarities or viscosities were recorded. As shown in Figure 2C and S3, AH-2 emitted extremely weak in typical organic solvents, suggesting that surrounding polarity posed little effect on its fluorescence brightness. While in a PBS solution containing various proportions of glycerol, the fluorescence of AH-2 intensified as the solvent viscosity increased by up to 750 times (Figure 2D and S4). This phenomenon suggested that inhibition of the free rotation of AH-2 was the major contributor to the fluorogenic response, in accord with the TICT mechanism.
We also measured the binding constants (Kd) between AH-2 and the Aβ fibrils, using two assay formats [34]. First, the AH-2 concentration was fixed at 100 nM and treated with varying concentrations of Aβ fibrils. Plotting the fluorescence intensity against Aβ fibril concentrations gave a logistic regression fit, in which the Kd1 was determined to be 5.45 µM (Figure 2E). In the second format, Aβ fibril concentration was fixed at 100 nM and treated with varying concentrations of AH-2. Similarly, the resulting fluorescence intensity plot resulted in a logistic regression fit, and Kd2 was determined to be 227 nM (Figure 2E). These two Kd values were similar to those of ThT [34], suggesting that the structure modification caused little effect on probe binding with Aβ fibrils. These two Kd values can also be used to estimate the number of AH-2 binding sites on the Aβ fibrils [34]. Since the Aβ deposit concentration herein is represented by the concentration of Aβ (1-42) peptide monomers before aggregation, according to literature [34], our obtained Kd1/Kd2 ratio estimates one AH-2 binding site per 24 Aβ peptide monomers. This binding pattern is also similar to that of ThT, which suggests that probe AH-2 retains the same binding mode as ThT towards Aβ fibrils, but with improved sensitivity.
Aβ oligomers were reported to be the most toxic state among the various types of Aβ assemblies. To test whether probe AH-2 would be active towards Aβ oligomers, a solution of AH-2 was treated with Aβ oligomers and a dramatic fluorescence intensification was observed (Figure S5). Noteworthy, the emission spectra of AH-2 caused by Aβ oligomers differed from that caused by Aβ fibrils by a ca. 10-16 nm red-shift (Figure S6), which was presumably due to the different structures of Aβ oligomers and Aβ fibrils. We also confirmed that the fluorogenic response of AH-2 was specific to Aβ fibrils and is independent of other commonly-found biological analytes such as amino acids, metal cations (Figure S7). Though the benzothiazole moiety in AH-2 is structurally highly electron-deficient, it is relatively stable towards biological nucleophiles such as Cys and GSH (Figure S7). We also confirmed that the presence of Cys caused little interference on the sensitivity of AH-2 towards Aβ oligomers (Figure S8). Moreover, AH-2 also demonstrated the desirable photostability prerequisite for imaging experiments. When the fluorescence of AH-2 was triggered on by the treatment of Aβ fibrils, the continuous excitation caused little quenching effect on the intensity (Figure S9).
Testing the selectivity and sensitivity of AH-2 in brain slices
After confirming the desirable performance of AH-2 in the solution-based assay and before going forward for the imaging experiments, we tested the cytotoxicity of AH-2. It was shown that AH-2 was quite safe under the working concentration of 5 µM (Figure S10). We then further tested its selectivity and sensitivity to endogenous Aβ deposits in AD mice brain slices. 5xFAD mice, 3xTg AD mice and APP/PS1 mice are wildly used in AD-related studies as well-recognized AD-modelled trans-genetic mice [35]. However, the timeline accelerating AD onset and progression differs in these three strains of AD mice, with 5xFAD mice developing AD-like pathology within shortest latency while APP/PS1 mice developing AD-like pathology within longest latency. Herein, we used 5xFAD mice and 3xTg mice as the AD model, and wild-type mice were set as control for experiments.
Firstly, probe selectivity was verified by double-staining brain tissues from the cortex region with AH-2 and Aβ1-42/1-40 specific antibodies. We first confirmed that there was no fluorescence crosstalk or crossover between the AH-2 and antibody signals (Figure S11). Then double-staining experiments were carried out. Strong fluorescence from both AH-2 (the green channel) and Aβ1-42/1-40 antibody (the red channel) in the 5xFAD mice at 5 months old and 3xTg AD mice at 13 months old was observed by confocal imaging (Figure 3A), while the signals in wild-type mice at 5 months old were very weak (Figure 3A). This agrees with the fact that either 5xFAD or 3xTg mice overexpress amyloid precursor protein (APP) to form β-amyloid (Aβ) compared with non-transgenic mice. The overlay of the green and red signals in the 5xFAD group or 3xTg AD group highlights the good selectivity of AH-2 towards Aβ deposits. Orthogonal projection of Z stack images further demonstrated the co-localization of AH-2 signals with Aβ1-42 antibody signals (Figure 3A-d, e, f). The co-localization patterns were further quantitatively presented by Plot Profile analysis, which displayed the fluorescence distribution profile of Aβ1-42 antibody signal (red line) and AH-2 signal (green line) along line-x in Figure 3B-3D. It is noteworthy that the co-localization of the AH-2 signal with the antibody signal was also observed in the hippocampus region of mice brain slices (Figure S12). These results suggest the desirable selectivity of AH-2 towards Aβ deposits in biological conditions.
Specificity and sensitivity test for probe AH-2 to Aβ deposits in mice brain slices. (A) Representative confocal images of Aβ deposits labelled by AH-2 and Aβ1-42/1-40 antibody in the brain cortex of wild-type mice, 5xFAD mice, and 3xTg AD mice. The orthogonal projections of Z-stack images (d1-d3) to y-z (e1-e3) and x-z (f1-f3) further demonstrated the co-localization of AH-2 signal and Aβ antibody signal. (B-D) The fluorescence distributions of Aβ antibody signal (red line) and AH-2 signal (green line) along line x in d1-d3. (E, F) Representative images of AH-2 (E) and ThT (F) staining age-dependent Aβ accumulation in the cortex of wild-type mice and 3xTg mice at ages of 2, 8, and 13 months. Magnified images of boxed regions were displayed in images b1-b6 respectively. (G, H) Quantification of AH-2 or ThT-labeled Aβ deposits in the cortex of wild-type and 3xTg AD mice. Data were expressed as Mean ± SEM normalized to WT at 2 months. **p < 0.01, ***p < 0.001 versus 2 months group. &&& p < 0.001 versus 8 months group. ###p < 0.001 versus age-matched WT group. ns, no significance. N = 5 mice. AH-2: green channel, λex = 488 nm, λem = 595 nm; Aβ1-42/1-40 antibody: red channel, λex = 640 nm, λem = 700 nm. Cell nuclei indicated by DAPI: blue channel, λex = 405 nm, λem = 450 nm.
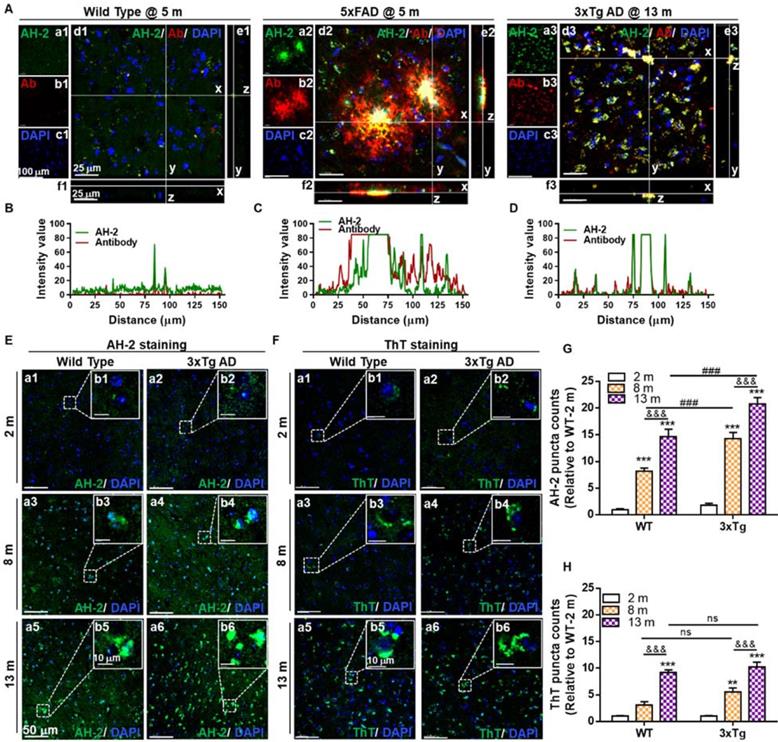
Secondly, the spatial resolution of AH-2 imaging was investigated. Aβ deposits are commonly observed in the extracellular areas. However, recent studies addressed cellular Aβ deposits preceding extracellular Aβ plaques accumulation, being a key determining factor of neurological dysfunction in age-related neurodegenerative pathogenesis [36-40]. To investigate the spatial distribution of AH-2 stained aggregates, the aforementioned slices were co-stained with DAPI, a classic nuclear counterstain. It was observed that AH-2 staining presented two different profiles of spatial distribution in both the 3xTg group and the 5xFAD group. Given that part of AH-2 puncta covered several cell nuclei, these large size deposits should represent the extracellular Aβ plaques (Figure 3A and S7). In contrast, part of the AH-2 positive deposits appeared as small intracellular puncta around the cell nucleus, representing the intracellular Aβ accumulation. Similar Aβ distribution profiles were verified in the brain slices stained with the Aβ1-42 antibody immunostaining (Figure 3A and S7). These results demonstrate the desirable spatial resolution of AH-2 for staining both the intracellular and extracellular Aβ deposits in brain tissue.
Thirdly, we tested if AH-2 would be sensitive enough to accurately stain Aβ deposits in the early stage of AD development or even before AD onset. For this purpose, aging wide-type mice at 2-, 8-, and 13-months were used, with age-matched 3xTg mice set as the positive control group. It was observed that AH-2 signals enhanced in an age-dependent way in both the wide-type group and the 3xTg group (Figure 3E, 3G, and S8), suggesting the accumulation of Aβ aggregates in mice brains as the mice aged. Comparison of the wide-type and 3xTg AD groups revealed that the 3xTg AD mice demonstrated more Aβ deposits in both the cortex (Figure 3E) and the hippocampus region (Figure S13) than their wild-type counterparts at the same ages. Noteworthy, obvious Aβ deposits were observed in the cortex region of the wild-type group at 8 months old (Figure 3E), suggesting that AH-2 was sensitive enough to image Aβ deposits in naturally aging wide-type mice. Interestingly, slices from the hippocampus region of the wild-type mice at 8 months old showed less obvious AH-2 fluorescence (Figure S13), indicating that the cerebral cortex is more vulnerable to neurodegenerative stimulation during aging.
Spatially, AH-2 imaging revealed that Aβ puncta signals appeared near the nuclei in young mice but spread through the intracellular and extracellular compartments in older mice in both wide-type and 3xTg mice. This is in agreement with previous reports that intracellular Aβ deposits precede extracellular ones during aging and AD development [36-40]. The age-dependent accumulation of Aβ deposits in wild-type and 3xTg mice brain was also confirmed by ThT either in the cortex (Figure 3F and 3H) or hippocampus region (Figure S14). However, a comparison between ThT and AH-2 imaging results showed that AH-2 revealed significant statistical differences of Aβ puncta enhancement between the 3xTg group and the age-matched wide-type group (Figure 3G), which were not detectable using ThT staining in the present case (Figure 3H). These results further underscore the enhanced sensitivity of AH-2 to stain Aβ deposits facilitating the prediction and diagnostic applications in AD.
Testing the sensitivity of AH-2 in naturally aging live mice
Encouraged by the desirable selectivity and sensitivity of AH-2 towards Aβ deposits in mice brain slices, we further investigated the feasibility of AH-2 to stain native Aβ deposits in live mice. Two-photon laser scanning microscopy represents a desirable imaging modality to record in situ biological activity with deep tissue penetrations [27, 41], and was used for this study. The general procedures for this experiment was described in Figure 4A. Cranial imaging window surgery was carried out in anesthetized mice of both the wild-type and 3xTg mice. Then AH-2 was administrated, followed by two-photon microscope imaging. Images of AH-2 fluorescent signals in response to Aβ deposits in the cortex at 100 µm depth of wild-type mice and 3xTg AD mice were collected at 580 nm upon the two-photon excitation at 860 nm.
Two-photon in vivo imaging of Aβ deposits in the brains of live mice. (A) Schematic diagram of AH-2 application in vivo with two-photon imaging. (B) Images of AH-2 fluorescence-indicated Aβ deposits acquired from the brain cortex of aging wild-type mice and 3xTg AD mice. AH-2 signal was collected at 580 nm upon the two-photon excitation at 860 nm in the brains of live mice. Representative boxed regions were magnified and displayed in the bottom panel. (C, D) Quantitative analysis of AH-2 labeled Aβ puncta in wild-type and 3xTg AD mice at ages ranging from 2 months to 13 months. The data were expressed as Mean ± SEM. *p < 0.001, ***p < 0.001 versus 2 months group. ##p < 0.01, ###p < 0.001 compared to 8 months group. N = 5 mice.
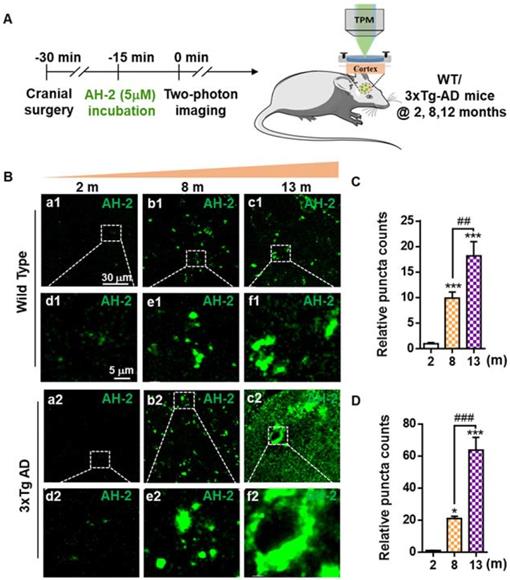
The imaging data showed that AH-2 fluorescence signals increased extensively in the brains as the mice aged from 2-month to 13-month (Figure 4B-4D). For wild-type mice of 8- and 13-month-old, AH-2 deposit counts increased dramatically in an age-dependent pattern when compared with the young mice of 2-month-old (Figure 4B and 4C), indicating the aging-related Aβ accumulation in the normal aging brain. Compared with the wild-type mice, the Aβ deposits increased more sharply in 3xTg AD mice aging from 2 months to 13 months (Figure 4D). These in vivo imaging results from live mice were consistent with those revealed by AH-2 ex vivo imaging in brain slices (Figure 3), but with improved fidelity. These results provided further support for the hypothesis that Aβ aggregates happen in the naturally aging brains, and demonstrated the robustness of AH-2 to stain Aβ aggregates in vivo with excellent sensitivity and spatial resolution.
AH-2 imaging facilitated the efficacy evaluation of anti-AD agents
After confirming the desirable sensitivity and fidelity of AH-2 to image Aβ deposits in naturally aging wide-type mice, we then tested if it would be applicable to evaluate the efficacy of anti-AD agents. The logic is that Aβ aggregation is not only a well-recognized AD diagnostic biomarker but also an indispensable prognostic indicator [42, 43]. For this purpose, melatonin was selected as the positive agent because of its well-recognized efficacy against aging and AD [44-46]. In this context, 3xTg AD mice (13-month) were treated with melatonin at a dose of 10 mg/kg/day for 6 weeks, and the amount of cerebral Aβ aggregates was monitored by AH-2. Noteworthy, the expression levels of cognitive proteins (Kinase C) were also assayed by western blot to confirm the neuro-protective efficacy of melatonin.
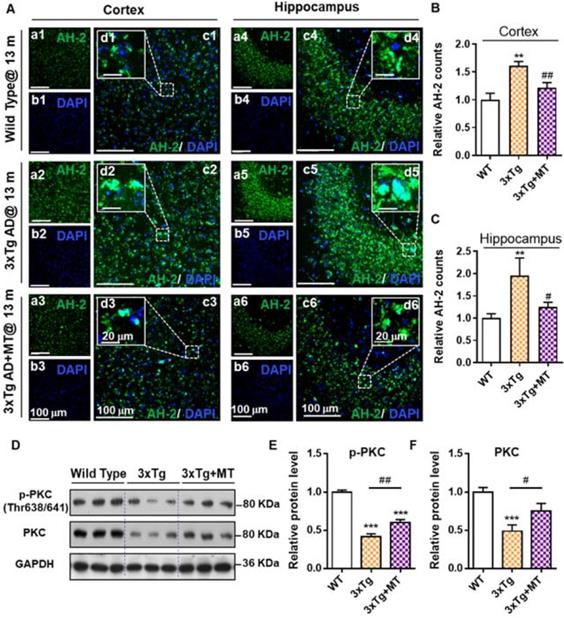
The images of AH-2 staining showed that 3xTg AD mice (13 months) without melatonin treatment displayed a higher level of AH-2 deposits in the cortex region and hippocampus when compared to the age-matched wild-type mice brain (Figure 5A-5C). After melatonin treatment, the AH-2 puncta were significantly blunted both in size (Figure 5A-d3, d6) and in count (Figure 5B and 5C), revealing the benefit of melatonin treatment to decrease cerebral Aβ aggregates in AD mice. In addition, we also confirmed that melatonin treatment contributed to the neurological recovery in AD mice, as indicated by the recovery of cognitive-linked Protein Kinase C (PKC) which plays a crucial role in synaptogenesis and neuronal plasticity, and is needed for learning and memory [47-49]. As shown in Figure 5D by Western blot analysis, comparing with the wild-type mice, 3xTg mice expressed significantly compromised PKC and phosphorylated PKC (p-PKC, the activated state of PKC) levels (Figure 5D-5F). Conversely, melatonin treatment remarkably restored the expression of both PKC and p-PKC in the hippocampus of 3xTg AD mice. These data suggested that melatonin reduced Aβ deposits effectively and protected the cerebral neurons from Aβ stress-induced injury; while probe AH-2 was sensitive enough to image melatonin-rendered Aβ deposits reduction. We anticipate that AH-2 should be promising to evaluate the efficacy of anti-AD agents.
AH-2 imaging revealed melatonin-induced reduction of Aβ deposits in AD mice brain. (A) Representative confocal images of AH-2 tracked Aβ aggregation changes in the cortex (left) and hippocampus (right) of aged wild-type mice (upper panel), 3xTg AD mice (middle panel), and melatonin-treated 3xTg AD mice (bottom panel). AH-2 signal (green) was collected at 595 nm upon laser excitation at 488 nm. Magnified images (d1-d6) of white-box regions showed the expression patterns of Aβ aggregation around the DAPI (blue)-indicated nuclei. Scale bar = 100 µm (a-c). Scale bar = 20 µm (d). (B, C) Effect of melatonin on Aβ aggregation in the cortex (B) and hippocampus (C) was measured and quantified as the counts of AH-2 positive puncta. All data were normalized to the wild-type group and presented as Mean ± SEM. **p < 0.01 versus wild type group. #p < 0.05, ##p < 0.01 versus 3xTg AD group. (D) Representative Western blot bands of cognition-related proteins p-PKC and PKC expression analysis in the hippocampus from wild type and 3xTg AD mice with and without melatonin treatment. GAPDH worked as sample load control for the blots. (E, F) Protein levels in each group were measured by Image J and shown as the ratio of the WT group. Data were expressed as Mean ± SEM. **p < 0.05, ***p < 0.001 versus WT group. #p < 0.05, ##p < 0.01 versus 3xTg group. N = 6 mice.
Conclusion
Aided by quantum chemical calculations, we have rationally designed probe AH-2 sensitive enough to in situ image Aβ deposits in naturally-aging normal mice brains. The probe was a ThT derivative. It retained the binding affinity and binding mode of ThT towards Aβ deposits, as shown by the plot of its binding constants towards Aβ fibrils by the titration experiment. AH-2 was designed to enhance the twisted intramolecular charge transfer (TICT) tendency of ThT, so as to reduce its background emissions. Due to its decreased background signals, AH-2 sensitively stained Aβ aggregates with an improved signal-to-noise ratio by 5-10 times compared to ThT. This improved sensitivity enabled AH-2 to detect a trace amount of Aβ deposits in wide-type mice before the onset of AD, which is more advantageous than those probes that can only be used in AD-modelled trans-genetic mice overexpressing Aβ deposits. We also showed that AH-2 was active towards Aβ oligomers and can detect cellular Aβ deposits in mice brain tissues. Spatially, AH-2 imaging revealed that Aβ first accumulated intracellularly and then spread extracellularly during the naturally aging process of wide-type mice; while the accumulation emerged earlier in the cortex region than in the hippocampus region during this process. Moreover, age-dependent Aβ accumulation in both wide type and AD-modelled trans-genetic mice was revealed by AH-2 staining. We also showed that AH-2 was sensitive enough to detect the reduction of Aβ deposits rendered by ani-AD agents, suggesting its potential application for the screening of anti-AD agents. Given the desirable sensitivity of AH-2 and its desirable spatial resolution, we envision that the probe can be used as a robust tool in understanding the mechanism of native Aβ plaque formation, aiding the predictive and diagnostic prevention of AD, and facilitating the further development of Aβ-related therapies.
Supplementary Material
Supplementary materials and methods, figures.
Acknowledgements
This work was supported by the National Natural Science Foundation of China (22077112, 81603104, 81673417), Key Laboratory Project of Universities in Guangdong Province (2018KSYS006), Key Laboratory Project of Acupuncture and Chinese Medicine in Guangdong Province (2017B030314143), Key Research and Development Program of Zhejiang Province (2021C03045), A*STAR under its Advanced Manufacturing and Engineering Program (A2083c0051), the Ministry of Education, Singapore (MOE-MOET2EP10120-0007) and SUTD-ZJU IDEA grant [SUTD-ZJU (VP) 201905]. The authors are grateful for the super-computing resources of SUTD-MIT IDC and the National Supercomputing Centre (Singapore).
Competing Interests
The authors have declared that no competing interest exists.
References
1. Masters CL, Bateman R, Blennow K, Rowe CC, Sperling RA, Cummings JL. Alzheimer's disease. Nat Rev Dis Primers. 2015;1:15056
2. Scheltens P, De Strooper B, Kivipelto M, Holstege H, Chételat G, Teunissen CE. et al. Alzheimer's disease. Lancet. 2021;397:1577-90
3. 2020 Alzheimer's disease facts and figures. Alzheimers Dement. 2020.
4. Graham WV, Bonito-Oliva A, Sakmar TP. Update on Alzheimer's Disease Therapy and Prevention Strategies. Annu Rev Med. 2017;68:413-30
5. Karran E, Hardy J. A critique of the drug discovery and phase 3 clinical programs targeting the amyloid hypothesis for Alzheimer disease. Ann Neurol. 2014;76:185-205
6. Nordberg A. Dementia in 2014. Towards early diagnosis in Alzheimer disease. Nat Rev Neurol. 2015;11:69-70
7. Sperling R, Mormino E, Johnson K. The evolution of preclinical Alzheimer's disease: implications for prevention trials. Neuron. 2014;84:608-22
8. Palmqvist S, Schöll M, Strandberg O, Mattsson N, Stomrud E, Zetterberg H. et al. Earliest accumulation of β-amyloid occurs within the default-mode network and concurrently affects brain connectivity. Nat Commun. 2017;8:1214
9. Mormino EC, Kluth JT, Madison CM, Rabinovici GD, Baker SL, Miller BL. et al. Episodic memory loss is related to hippocampal-mediated beta-amyloid deposition in elderly subjects. Brain. 2009;132:1310-23
10. d'Errico P, Meyer-Luehmann M. Mechanisms of Pathogenic Tau and Aβ Protein Spreading in Alzheimer's Disease. Front Aging Neurosci. 2020;12:265
11. Villemagne VL, Doré V, Burnham SC, Masters CL, Rowe CC. Imaging tau and amyloid-β proteinopathies in Alzheimer disease and other conditions. Nat Rev Neurol. 2018;14:225-36
12. Valotassiou V, Malamitsi J, Papatriantafyllou J, Dardiotis E, Tsougos I, Psimadas D. et al. SPECT and PET imaging in Alzheimer's disease. Ann Nucl Med. 2018;32:583-93
13. Shimogawa M, Petersson EJ. New strategies for fluorescently labeling proteins in the study of amyloids. Curr Opin Chem Biol. 2021;64:57-66
14. Fu H, Cui M. Fluorescent Imaging of Amyloid-β Deposits in Brain: An Overview of Probe Development and a Highlight of the Applications for In vivo Imaging. Curr Med Chem. 2018;25:2736-59
15. Gyasi YI, Pang YP, Li XR, Gu JX, Cheng XJ, Liu J. et al. Biological applications of near infrared fluorescence dye probes in monitoring Alzheimer's disease. Eur J Med Chem. 2020;187:111982
16. Lee D, Kim SM, Kim HY, Kim Y. Fluorescence Chemicals To Detect Insoluble and Soluble Amyloid-β Aggregates. ACS Chem Neurosci. 2019;10:2647-57
17. Aliyan A, Cook NP, Martí AA. Interrogating Amyloid Aggregates using Fluorescent Probes. Chem Rev. 2019;119:11819-56
18. Zhang X, Tian Y, Li Z, Tian X, Sun H, Liu H. et al. Design and synthesis of curcumin analogues for in vivo fluorescence imaging and inhibiting copper-induced cross-linking of amyloid beta species in Alzheimer's disease. J Am Chem Soc. 2013;135:16397-409
19. Fu W, Yan C, Guo Z, Zhang J, Zhang H, Tian H. et al. Rational Design of Near-Infrared Aggregation-Induced-Emission-Active Probes: In situ Mapping of Amyloid-β Plaques with Ultrasensitivity and High-Fidelity. J Am Chem Soc. 2019;141:3171-7
20. Kim D, Baik SH, Kang S, Cho SW, Bae J, Cha MY. et al. Close Correlation of Monoamine Oxidase Activity with Progress of Alzheimer's Disease in Mice, Observed by in vivo Two-Photon Imaging. ACS Cent Sci. 2016;2:967-75
21. Ma L, Yang S, Ma Y, Chen Y, Wang Z, James TD. et al. Benzothiazolium Derivative-Capped Silica Nanocomposites for β-Amyloid Imaging In vivo. Anal Chem. 2021;93:12617-27
22. Rasmussen J, Mahler J, Beschorner N, Kaeser SA, Häsler LM, Baumann F. et al. Amyloid polymorphisms constitute distinct clouds of conformational variants in different etiological subtypes of Alzheimer's disease. Proc Natl Acad Sci U S A. 2017;114:13018-23
23. Michno W, Nyström S, Wehrli P, Lashley T, Brinkmalm G, Guerard L. et al. Pyroglutamation of amyloid-βx-42 (Aβx-42) followed by Aβ1-40 deposition underlies plaque polymorphism in progressing Alzheimer's disease pathology. J Biol Chem. 2019;294:6719-32
24. Gouras GK. Aging, Metabolism, Synaptic Activity, and Aβ in Alzheimer's Disease. Front Aging Neurosci. 2019;11:185
25. Sengoku R. Aging and Alzheimer's disease pathology. Neuropathology. 2020;40:22-9
26. Wang C, Qiao Q, Chi W, Chen J, Liu W, Tan D. et al. Quantitative Design of Bright Fluorophores and AIEgens by the Accurate Prediction of Twisted Intramolecular Charge Transfer (TICT). Angew Chem Int Ed Engl. 2020;59:10160-72
27. Li X, Tao RR, Hong LJ, Cheng J, Jiang Q, Lu YM. et al. Visualizing peroxynitrite fluxes in endothelial cells reveals the dynamic progression of brain vascular injury. J Am Chem Soc. 2015;137:12296-303
28. Stsiapura VI, Maskevich AA, Kuzmitsky VA, Turoverov KK, Kuznetsova IM. Computational study of thioflavin T torsional relaxation in the excited state. J Phys Chem A. 2007;111:4829-35
29. Krebs MR, Bromley EH, Donald AM. The binding of thioflavin-T to amyloid fibrils: localisation and implications. J Struct Biol. 2005;149:30-7
30. Biancalana M, Koide S. Molecular mechanism of Thioflavin-T binding to amyloid fibrils. Biochim Biophys Acta. 2010;1804:1405-12
31. Amdursky N, Erez Y, Huppert D. Molecular rotors: what lies behind the high sensitivity of the thioflavin-T fluorescent marker. Acc Chem Res. 2012;45:1548-57
32. Xue C, Lin TY, Chang D, Guo Z. Thioflavin T as an amyloid dye: fibril quantification, optimal concentration and effect on aggregation. R Soc Open Sci. 2017;4:160696
33. Ghosh R, Palit DK. Ultrafast twisting dynamics of thioflavin-T: spectroscopy of the twisted intramolecular charge-transfer state. Chemphyschem. 2014;15:4126-31
34. Lockhart A, Ye L, Judd DB, Merritt AT, Lowe PN, Morgenstern JL. et al. Evidence for the presence of three distinct binding sites for the thioflavin T class of Alzheimer's disease PET imaging agents on beta-amyloid peptide fibrils. J Biol Chem. 2005;280:7677-84
35. Jankowsky JL, Zheng H. Practical considerations for choosing a mouse model of Alzheimer's disease. Mol Neurodegener. 2017;12:89
36. Welikovitch LA, Do Carmo S, Maglóczky Z, Szocsics P, Lőke J, Freund T. et al. Evidence of intraneuronal Aβ accumulation preceding tau pathology in the entorhinal cortex. Acta Neuropathol. 2018;136:901-17
37. Bayer TA, Wirths O. Intracellular accumulation of amyloid-Beta - a predictor for synaptic dysfunction and neuron loss in Alzheimer's disease. Front Aging Neurosci. 2010;2:8
38. Park SW, Kim JH, Mook-Jung I, Kim KW, Park WJ, Park KH. et al. Intracellular amyloid beta alters the tight junction of retinal pigment epithelium in 5XFAD mice. Neurobiol Aging. 2014;35:2013-20
39. Zheng L, Cedazo-Minguez A, Hallbeck M, Jerhammar F, Marcusson J, Terman A. Intracellular distribution of amyloid beta peptide and its relationship to the lysosomal system. Transl Neurodegener. 2012;1:19
40. Ripoli C, Cocco S, Li Puma DD, Piacentini R, Mastrodonato A, Scala F. et al. Intracellular accumulation of amyloid-β (Aβ) protein plays a major role in Aβ-induced alterations of glutamatergic synaptic transmission and plasticity. J Neurosci. 2014;34:12893-903
41. Shih AY, Driscoll JD, Drew PJ, Nishimura N, Schaffer CB, Kleinfeld D. Two-photon microscopy as a tool to study blood flow and neurovascular coupling in the rodent brain. J Cereb Blood Flow Metab. 2012;32:1277-309
42. Duan S, Guan X, Lin R, Liu X, Yan Y, Lin R. et al. Silibinin inhibits acetylcholinesterase activity and amyloid β peptide aggregation: a dual-target drug for the treatment of Alzheimer's disease. Neurobiol Aging. 2015;36:1792-807
43. Chiu YJ, Hsieh YH, Lin TH, Lee GC, Hsieh-Li HM, Sun YC. et al. Novel compound VB-037 inhibits Aβ aggregation and promotes neurite outgrowth through enhancement of HSP27 and reduction of P38 and JNK-mediated inflammation in cell models for Alzheimer's disease. Neurochem Int. 2019;125:175-86
44. Wu YH, Feenstra MG, Zhou JN, Liu RY, Toranõ JS, Van Kan HJ. et al. Molecular changes underlying reduced pineal melatonin levels in Alzheimer disease: alterations in preclinical and clinical stages. J Clin Endocrinol Metab. 2003;88:5898-906
45. Zhou JN, Liu RY, Kamphorst W, Hofman MA, Swaab DF. Early neuropathological Alzheimer's changes in aged individuals are accompanied by decreased cerebrospinal fluid melatonin levels. J Pineal Res. 2003;35:125-30
46. Shukla M, Govitrapong P, Boontem P, Reiter RJ, Satayavivad J. Mechanisms of Melatonin in Alleviating Alzheimer's Disease. Curr Neuropharmacol. 2017;15:1010-31
47. Hongpaisan J, Sun MK, Alkon DL. PKC ε activation prevents synaptic loss, Aβ elevation, and cognitive deficits in Alzheimer's disease transgenic mice. J Neurosci. 2011;31:630-43
48. Talman V, Pascale A, Jäntti M, Amadio M, Tuominen RK. Protein Kinase C Activation as a Potential Therapeutic Strategy in Alzheimer's Disease: Is there a Role for Embryonic Lethal Abnormal Vision-like Proteins? Basic Clin Pharmacol Toxicol. 2016;119:149-60
49. Lucke-Wold BP, Turner RC, Logsdon AF, Simpkins JW, Alkon DL, Smith KE. et al. Common mechanisms of Alzheimer's disease and ischemic stroke: the role of protein kinase C in the progression of age-related neurodegeneration. J Alzheimers Dis. 2015;43:711-24
Author contact
![]() Corresponding authors: lixin81edu.cn, xiaogang_liuedu.sg or 0012669edu.cn
Corresponding authors: lixin81edu.cn, xiaogang_liuedu.sg or 0012669edu.cn