Impact Factor
- Issue 14; 2026
- Issue 13; 2026
- Issue 12; 2026
- Issue 11; 2026
- Issue 10; 2026
- Volume 16; 2026
- Advance Articles
- Past Issues
- Cover Images
- Cover Suggestion
- Index & Coverage
- Special Issues
Introduction
Materials and methods
Results
Discussion
Abbreviations
Supplementary Material
Acknowledgements
References
International Journal of Biological Sciences
International Journal of Medical Sciences
 Global reach, higher impact

Theranostics 2022; 12(4):1570-1588. doi:10.7150/thno.67722 This issue Cite
Research Paper
Gα12 overexpression in hepatocytes by ER stress exacerbates acute liver injury via ROCK1-mediated miR-15a and ALOX12 dysregulation
Jihoon Tak1, Yun Seok Kim2, Tae Hyun Kim1,3,4, Gil-Chun Park5, Shin Hwang5, Sang Geon Kim6 ![]()
1. College of Pharmacy, Seoul National University, Seoul 08826, Republic of Korea
2. Department of Clinical Pharmacology and Therapeutics, Seoul National University College of Medicine, Seoul 03080, Republic of Korea
3. Joslin Diabetes Center, Harvard Medical School, Boston, MA 02215, USA
4. Drug Information Research Institute, College of Pharmacy, Sookmyung Women's University, Seoul 04310, Republic of Korea
5. Department of Surgery, Asan Medical Center, University of Ulsan, College of Medicine, Seoul, Republic of Korea
6. College of Pharmacy and Integrated Research Institute for Drug Development, Dongguk University-Seoul, Goyang-si, Kyeonggi-do 10326, Republic of Korea
Received 2021-10-4; Accepted 2021-12-27; Published 2022-1-9
Abstract

Rationale: Liver injury must be further characterized to identify novel therapeutic approaches. Endoplasmic reticulum (ER) stress may cause hepatocyte death. Gα12 affects cell viability and its expression varies depending on physiological conditions. This study investigated whether hepatocyte-specific Gα12 overexpression affects acute liver injury, and if so, what the underlying mechanisms and treatment strategies are.
Methods: All experiments were performed using human liver, hepatocytes, and toxicant injury models with Gna12 KO and/or hepatocyte-specific Gα12 overexpression. RNA-sequencing, immunoblotting, immunohistochemistry, reporter assays, and mutation assays were conducted.
Results: Hepatic Gα12 was overexpressed in mice challenged with acetaminophen or other ER stress inducers or in patients with acute liver injury or fibrosis/cirrhosis. Several Gα12 and ER-associated pathways were identified using transcriptomic analysis. Acetaminophen intoxication was characterized by lipid peroxide-induced ferroptosis and was less severe in Gα12-deficient animals and cells. Conversely, Gα12 overexpression in wild-type or Gna12 KO hepatocytes increased hepatotoxicity, promoting lipid peroxidation, inflammation, and ferroptosis. IRE1α-dependent Xbp1 transactivated Gna12. Moreover, Gα12 overexpression enhanced the ability of acetaminophen to induce ALOX12, while downregulating GPX4. The level of miR-15a, herein identified as an ALOX12 inhibitor, was decreased. siRNA knockdown or pharmacological inhibition of ROCK1 prevented dysregulation of ALOX12 and GPX4, rescuing animals from toxicant-induced ferroptosis. These changes or correlations among the targets were confirmed in human liver specimens and datasets of livers exposed to other injurious medications.
Conclusions: Gα12 overexpression by ER stress facilitates hepatocyte ferroptosis through ROCK1-mediated dysregulation of ALOX12, and miR-15a, supporting the concept that inhibition of Gα12 overexpression and/or ROCK1 axis may constitute a promising strategy for acute liver injury.
Keywords: Gα12, acetaminophen-induced liver injury, miR-15a, ALOX12, GPX4
Introduction
Despite individual variabilities, the mortality rate of patients admitted to hospitals due to drug-induced liver injury is significant (~10%). Hepatotoxicants, herbal medicines, and the metabolites from some medications predispose patients to severe liver toxicity, particularly when they present preexisting conditions such as alcoholic liver disease, cirrhosis, cholestasis, or energy deficiency. Moreover, acetaminophen (APAP) hepatotoxicity, which accounts for ~50% of acute liver failure occurrences in Western societies, is a major cause of acute liver injury, and other toxicants also cause extensive liver damage, which may lead to uncontrolled liver injury [1, 2]. Given the public concern regarding drug/toxicant intoxications, many efforts have been made to understand the basis of acute liver injury, as well as to identify potential treatment agents.
Gα12 converges signals from G-protein-coupled receptors and its expression varies depending on physiological conditions. Moreover, Gα12 may play cell type-specific roles in different pathologies by amplifying or inhibiting receptor signals depending on their expression level. Gα12 regulates SIRT1-dependent mitochondrial respiration, and thus its overexpression contributes to mitochondrial fuel oxidation. In our other studies, phosphorylated JNK levels in macrophages and palmitate-induced apoptosis were diminished in deficient of Gα12 [3, 4]. Due to the divergent roles of Gα12 in energy metabolism and different cell type-specific behaviors, we sought to investigate whether the Gα12 signaling axis exerts a deleterious or protective effect on acute liver injury using mouse models.
Endoplasmic reticulum (ER) stress occurs due to an accumulation of unfolded or misfolded proteins in the ER. A cascade of events may be activated if the aforementioned ER stress exceeds the ER folding capacity, thus resulting in irreversible damage or cell death [5, 6]. Therefore, developing effective strategies to manage ER stress is a key step to control hepatitis development or the progression of different fibrosis stages [7, 8]. Despite the contribution of ER stress in the development of injurious liver diseases, the molecular mechanisms of ER stress regulation in hepatocytes, particularly during the progression of acute liver injury, have not been fully elucidated.
Ferroptosis is characterized by excessive production of lipid peroxides mediated by iron catalysis and is distinct from apoptosis, necroptosis, and pyroptosis. Also, it occurs when intracellular glutathione peroxidase 4 (GPX4) is inhibited by a lowered GSH level [9]. Inhibition of GPX4 causes the accumulation of lipid peroxides derived from polyunsaturated fatty acid-containing phospholipids, triggering cell membrane damage and eventually cell death in the absence of specific effector molecules [10]. Lipid peroxides are normally removed by cellular sulfhydryls, which convert them to lipid alcohols. Thus, depletion of glutathione promotes toxicant-induced liver injury. Moreover, ferroptosis has been implicated in other pathological processes including neurodegenerative disease, cancer, and kidney diseases [11, 12]. Nonetheless, the regulators responsible for ferroptosis in hepatocytes should be further characterized in the context of identifying novel treatment approaches.
Given the importance of ferroptosis in cell fate determination and the role of hepatocytes as a major cell type for iron storage, this study focused on the effect of the Gα12 pathway on acute liver injury in the context of ferroptosis. Here, we report that ER stress triggers Gα12 overexpression, which then facilitates the production of lipid peroxides for ferroptosis through the induction of ALOX12, as mediated by miR-15a dysregulation. Further, we sought to identify new strategies for the treatment of hepatic intoxication. Specifically, we propose that pharmacological inhibition or siRNA-induced knockdown of ROCK1 may effectively prevent ferroptosis downstream from Gα12. To confirm the effects of liver-specific Gα12 overexpression, we utilized a lentiviral albumin-Gα12 (Lv-Alb-Gα12) delivery system in WT or Gna12 KO animals subjected to APAP challenge and found more severe hepatic injuries and inflammatory responses. Finally, the alterations in the levels of the targets discovered in this study were corroborated using liver specimens from patients with acute liver injury or fibrosis/cirrhosis, thus highlighting the potential applications of the Gα12-ROCK1 axis for the treatment of liver injury, and the resulting fibrosis and cirrhosis in humans.
Materials and methods
Additional details of the materials and experimental protocols are available in the Supplementary Materials and Methods.
Animal models and experiments
The mice were housed in a 12 h light/dark cycle and relative humidity of 50% ± 5% under filtered, pathogen-free air, with food and water available ad libitum. Details of the generation of the Gna12 KO mice used in this study have been described previously [13]. Male mice at 8 to 12 weeks of age, unless otherwise indicated, were used. To minimize environmental differences, mice were maintained for at least a week before each experiment. For the acute liver injury model, male C57BL/6 mice were fasted overnight prior to a single dose of APAP treatment (300 mg/kg BW, i.p.), and the liver and blood samples were obtained 6 h afterward; In this experiment, we chose a 6 h time point because APAP treatment at the above dose results in increases of serum ALT activities up to 24 h, which peaked at 6 h post-treatment [14]. The sampling protocol was applied in Gna12 KO mice and their age-matched WT littermates. Where indicated, mice were given an injection of ferrostatin-1 (1 mg/kg BW, i.p.) 1 h before APAP treatment. Carbon tetrachloride (CCl4, 0.5 mL/kg BW, 1:20 in corn oil, i.p.) was injected twice a week for the indicated time period (2 or 6 weeks) for another liver injury model. Separately, male C57BL/6 mice were fasted overnight before a single dose of BSO treatment (1 g/kg BW, i.p.), and tissue and blood samples were obtained 6 h later. To induce ER stress, male C57BL/6 mice were injected with a single dose of tunicamycin (Tm; 2 mg/kg, i.p.) and were subjected to analyses 72 h afterward. For an in vivo rescue experiment, male C57BL/6 mice were fasted overnight and treated with a single dose of APAP (300 mg/kg BW, i.p.). After 1 h, the mice were exposed to ripasudil (50 mg/kg BW, i.p.) and tissue samples were obtained 5 h afterward.
Statistical analyses
Statistical significance was tested via two-tailed Student's t-tests, Mann-Whitney U test, or one-way ANOVA coupled with Bonferroni's method, Tukey's honestly significant difference test, or the least significant difference multiple comparison procedure, where appropriate. Coefficients of correlation (r) were determined via the Pearson correlation method. Differences were considered significant at P < 0.05. Statistical analyses were performed using IBM SPSS Statistics 26 software or Prism version 8.0 (GraphPad Software).
Study approval
All animal studies were approved by the institutional review board of the Seoul National University and conducted under the guidelines of the Institutional Animal Care and Use Committee (IACUC) at Seoul National University. Human liver samples were obtained from donors and recipients undergoing liver transplantation from 2011 to 2020 after histologic examination and ultrasonography at Asan Medical Center (Seoul, South Korea) (IRB no. 2021-0839). All patients in this study provided written informed consent, and the study was approved by the institutional review board of Asan Medical Center.
Results
Association between Gα12 overexpression and ER stress in response to APAP toxicity
To examine the gene pathways affected by liver intoxication, we first performed RNA-sequencing (RNA-seq) analysis using liver tissues of mice treated with an excessive dose of APAP (300 mg/kg BW, i.p.) and found that APAP treatment induced a marked shift in the transcriptional profile (Figure 1A, left). Specifically, a total of 382 genes were significantly upregulated, whereas 161 genes were downregulated (Figure 1A, right). Moreover, a significant proportion of dysregulated genes were associated with the 'GPCR pathway', which was ranked within the top 25 most enriched gene sets in APAP-treated mice compared to controls (Figure 1B, left). Particularly, gene sets associated with Rho/ROCK pathways downstream from Gα12 showed significant enrichment in APAP-treated mice (Figure 1B, right). Next, we assessed the gene ontology (biological processes) of primary hepatocytes using the GSE40336 dataset; APAP treatment upregulated the genes associated with intracellular signal transduction and regulation of Rho protein signal transduction among five major pathways (Figure S1A). Given that the G protein level varies in different cell types and organs, we assessed major G-protein levels. Among the major Gα subunits examined herein, Gna12 transcript levels were highly upregulated (Figure 1C). A similar result was obtained when analyzing a different dataset (GSE74000), indicating the ability of APAP to induce GNA12 (Figure 1D).
APAP-induced Gα12 overexpression in hepatocytes in association with the unfolded protein response. (A) Heatmap and hierarchical correlation analysis for differentially expressed genes in liver tissue between vehicle- and APAP-treated mice using RNA-seq data (left, n = 3 each). Volcano plot of RNA-seq data. Horizontal and vertical lines indicate the filtering criteria (absolute fold-change ≥ 1.5 and P < 0.05, respectively). Red and blue dots show differentially expressed genes (DEGs) upregulated (382 genes) or downregulated (161 genes) in response to APAP treatment (right, n = 3 each). (B) GSEA enrichment plot of the Biocarta category showing the GPCR pathway (left, NES = 1.6, FDR < 0.1) and Rho/ROCK-related signaling pathways positively correlated with APAP-exposed WT mice (300 mg/kg BW, 6 h) in the Reactome pathway (right, n = 3 each). NES and FDR are shown in the bar graph. (C) Heatmap of Gna subunits in primary hepatocytes treated with APAP or vehicle using microarray dataset (n = 5 each). (D) The levels of major GNA transcripts in HepG2 cells treated with APAP (2 mM, 24 h) relative to vehicle control derived from a public dataset (GSE74000). (E) Gα12 and GRP78 immunohistochemistry and histopathology analyses in mouse liver samples (H&E; scale bar: 200 μm) (left). Percent areas of Gα12, GRP78, and damaged areas were assessed using the Image J program (right). The mice were injected with a single dose of APAP (300 mg/kg BW, 6 h) (n = 3 each). (F) qRT-PCR assays for Gna12 and Hspa5 in APAP-treated WT mice (n = 5 or 7 each). (G) Immunoblottings (upper) for Gα12 and GRP78 in APAP-treated WT mice. The band intensities represent values relative to each respective control (lower) (n = 5 or 6 each). (H) qRT-PCR assays for Gna12 and Hspa5 in AML12 cells treated with APAP (10 mM, 12 h) (n = 3 or 4 each). (I) Immunoblottings (left) for Gα12 and GRP78 in AML12 cells treated with APAP (10 mM, 12 h). The band intensities represent values relative to each respective control (right, n = 3 or 4 each). (J) Immunoblottings for Gα12 and GRP78 in mouse primary hepatocytes treated with APAP (10 mM, 12 h) (n = 3 each). For D-I, the reported values represent mean ± SD (*P < 0.05, **P < 0.01). Statistical significance was tested via two-tailed Student's t-tests.
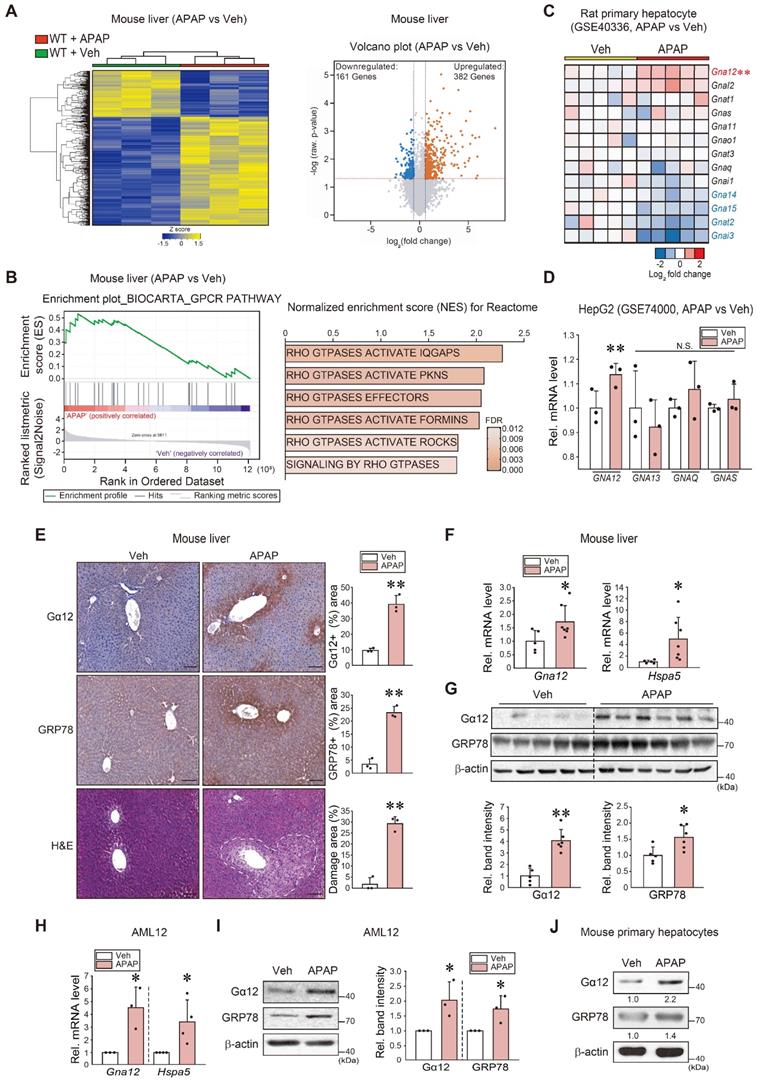
Interestingly, gene ontology (GO) and biological process analyses of another dataset obtained from mice livers (GSE104302) confirmed that APAP treatment upregulated the expression of UPR-associated genes, as well as those linked to the “epigenetic process” and “chaperone-mediated protein folding cofactor” pathways (Figure S1B). In subsequent experiments, WT C57BL/6 mice exposed to a single dose of APAP exhibited a distinctly enhanced Gα12 staining intensity, particularly around the central vein area. A similar staining pattern was observed for GRP78. Histopathological analysis confirmed the occurrence of pronounced hepatocyte injuries (Figure 1E). Increases in Gna12 and Hspa5 transcript levels were confirmed (Figure 1F). Moreover, immunoblotting confirmed the ability of APAP to induce Gα12 (Figure 1G). Furthermore, increases in Gα12 and GRP78 expression were verified using hepatocyte models (Figure 1H-J). Lastly, we identified correlations between Gna12 and ER stress marker (Ddit3) levels using datasets from human primary hepatocytes and mouse livers with liver injury (tolvaptan- and diclofenac-induced, respectively) (Figure S1C). Additionally, Gα12 expression was upregulated in the liver of mice repeatedly exposed to CCl4 (a known ER stress-inducing toxicant) (Figure S1D) [15].
To assess the effects of ER stress on Gα12, we analyzed another dataset from mice treated with tunicamycin (Tm) and found that ER stress increases and positively correlated with the level of Gna12 transcripts (not Gna13 or others) in the liver (Figure S1E). Taken together, these results support the hypothesis that liver intoxication results in Gα12 overexpression in hepatocytes via the ER stress response.
IRE1α-mediated Xbp1s-dependent induction of Gα12
To understand the direct effect of ER stress on Gα12, we used Tm as an inducer of ER stress and found that treatment of WT mice with Tm caused an increase in Gα12 and GRP78 staining intensity (Figure 2A). Immunoblotting also verified increases in Gα12 and GRP78 levels (Figure 2B). This outcome was confirmed using mouse primary hepatocytes and AML12 cells (Figure 2C). We then explored the canonical ER stress pathways that lead to ER stress-mediated Gα12 induction. siRNA or overexpression approaches showed that Gα12 overexpression elicited by Tm primarily depends on IRE1α (Figure 2D). siIRE1α transfection alone unaffected Gα12 level, whereas IRE1 overexpression enhanced it.
Xbp1s-dependent Gna12 transactivation in hepatocytes. (A) Ιmmunohistochemistry for Gα12 and GRP78 in the liver of mice treated with a single dose of Tm (2 mg/kg BW, i.p., 72 h) (left). Percent areas of Gα12 and GRP78 were assessed using the Image J program (right, n = 5 or 6 each). scale bar, 200 μm. (B) Immunoblottings for Gα12 and GRP78 in the same samples as in A (left). Densitometric band intensities represent values relative to respective control (right, n = 5 each). (C) Immunoblottings for Gα12 and GRP78 in mouse primary hepatocytes treated with Tm (2 μg/ml, 12 h) (upper left) and densitometric band intensities relative to respective control (upper right, n = 3 each). Immunoblottings for Gα12 and GRP78 in AML12 cells were treated with Tm (2 μg/ml) for the indicated times (lower, n = 3 each; repeated 3 times with similar results). (D) Immunoblottings for Gα12 and IRE1α in AML12 cells treated with tunicamycin (Tm; 2 μg/ml, 12 h) after transfection with IRE1α siRNA (or siCon) (100 nM, 24 h) (upper) and WT-IRE1α (or mock vector) (1 μg, 24 h) (middle, n = 3 or 4 each). Immunoblottings for Gα12, p-PERK, and ATF6 in AML12 cells treated with Tm (2 μg/ml, 12 h) after transfection with siCon or siPERK or siATF6 (100 nM each, 24 h) (lower, n = 3 each; repeated 3 times with similar results; scan values were shown for representative blots). (E) Levels of major transcription factor mRNAs in primary MEF cells treated with Tm (2 μg/ml, 4 h) relative to the vehicle control derived from a publicly available dataset (GSE2082) (n = 3 or 4 each). (F) Immunoblotting analyses for Gα12 and XBP1s in AML12 cells treated with Tm (2 μg/ml, 12 h) after transfection with siXBP1s (or siCon) (100 nM, 24 h) and WT-XBP1s (or mock vector) (1 μg, 24 h) (n = 3 each). (G) qRT-PCR assays for Gna12 and Xbp1s in AML12 cells treated as in F (n = 3 or 4 each). (H) Gna12 promoter-reporter assays. Luciferase activity was measured in AML12 cells after transfection with a Gna12 luciferase construct and a plasmid encoding XBP1s (mock or active form, 0.5 μg, 24 h) (left, n = 4 each). The cells were treated with Tm or a vehicle after transfection with an Xbp1-RE WT or Xbp1-RE mutant luciferase construct (1 μg, 24 h) (right, n = 3 each). For A-E, G, and H, the values represent the mean ± SD (*P < 0.05, **P < 0.01). Statistical significance was tested via two-tailed Student's t-tests or one-way ANOVA with the LSD multiple comparison procedure, where appropriate.
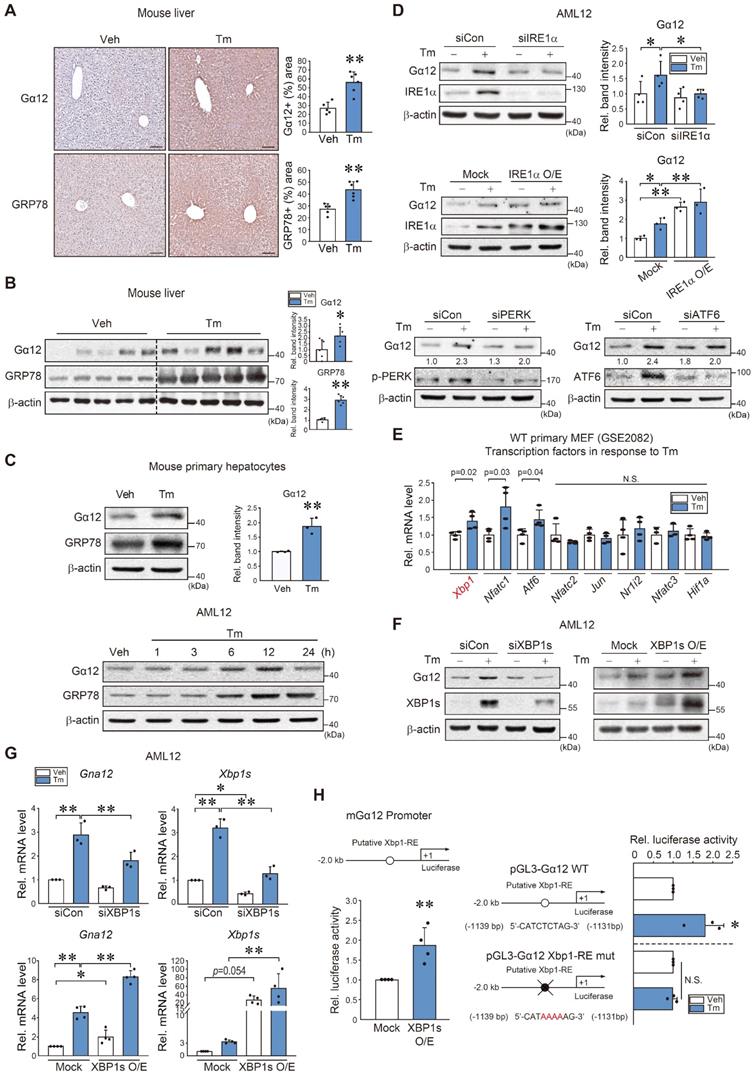
Based on the analysis of a gene expression omnibus (GEO) dataset (GSE2082), Tm-treated primary MEF cells exhibited significant increases in Xbp1, Nfatc1, and Atf6 mRNA levels (Figure 2E). Given that the IRE1α pathway controls the activation of Xbp1, we examined the effect of Xbp1 on Gα12. As expected, modulations of Xbp1 appropriately modified Gα12 protein and transcript levels in AML12 cells in response to Tm exposure (Figure 2F-G).
Further, a putative Xbp1 binding site was identified within the -2 kb promoter region of Gna12 using PROMO analysis. Therefore, we then assessed whether ER stress transactivates this gene through Xbp1. Luciferase assays confirmed the binding of Xbp1 to the promoter region of Gna12 (Figure 2H, left). In addition, Tm treatment enhanced luciferase expression using a pGL3-Gα12 reporter gene, but this effect was completely abolished in the assays using an Xbp1-RE mutant Gα12 reporter construct (Figure 2H, right). These results demonstrate that the IRE1α pathway transactivates Gna12 through Xbp1.
Promotion of hepatocyte ferroptosis and lipid peroxidation by Gα12
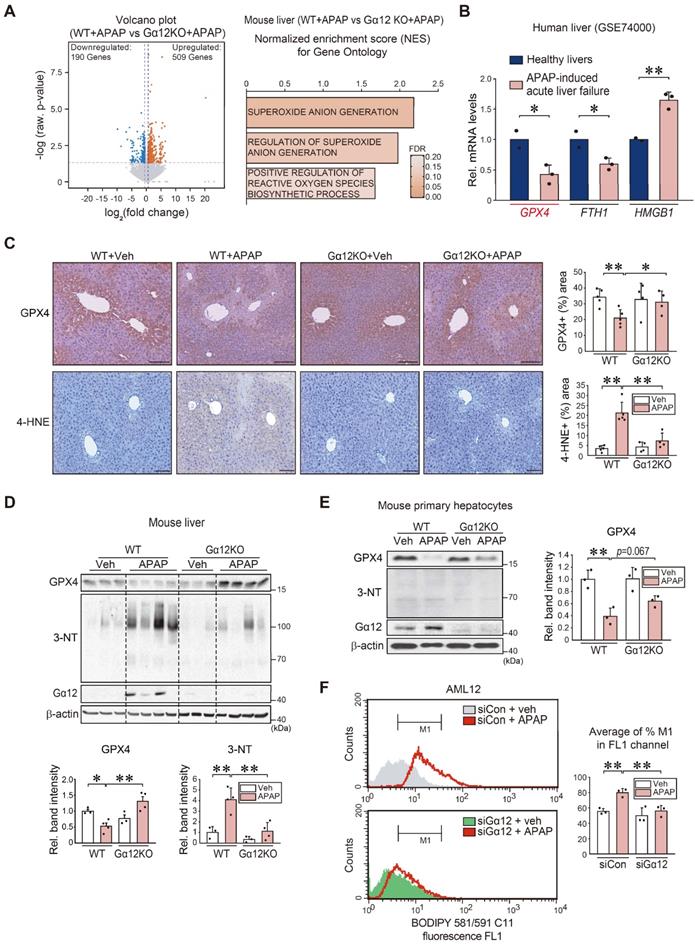
Next, we used a gene-deficient Gna12 KO experimental model to study whether Gα12 modulation affects APAP-induced liver injury (Figure S2A). To identify the mechanistic basis of this phenomenon, we analyzed an RNA-seq dataset for APAP-treated WT or Gna12 KO mice, and found 509 upregulated genes and 190 downregulated genes (Figure 3A, left). Moreover, we conducted GSEA to examine gene ontology sets; Gene sets associated with superoxide anion generation were among the top 25 most enriched genes in APAP-treated WT mice compared to their Gna12 KO counterparts. Gene sets associated with the 'regulation of superoxide anion generation' and 'positive regulation of reactive oxygen species biosynthetic process' pathways were also significantly enriched, being consistent with the effect of Gα12 overexpression on ferroptosis (Figure 3A, right). We then assessed the levels of the biomarker of ferroptosis including GPX4, FTH1, and HMGB1 using a public GEO dataset (GSE74000) obtained from patients with APAP-induced acute liver failure. Among these genes, GPX4 (i.e., a ferroptosis marker) transcript levels showed the biggest change (Figure 3B). We next determined whether Gα12 ablation prevents APAP from inducing ROS generation. The ablation of Gα12 substantially prevented GPX4 downregulation and also diminished the staining intensity of 4-hydroxynonenal (4-HNE) in the liver after APAP intoxication (Figure 3C), as corroborated by changes in 3-nitrotyrosine (3-NT) and GPX4 levels (Figure 3D). The higher intensities of GPX4 in Figure 3D may have resulted from slight overloading of samples and/or differences in analytical methods. The role of Gα12 in ferroptosis was validated using primary hepatocytes (Figure 3E) or AML12 cells (Figure S2B). The impact of Gα12 modulation on lipid peroxidation was further determined in the cells treated with APAP using the BODIPY 581/591 C11 oxidation method. Transfection with siRNA targeting Gα12 caused a significant shift in cell populations in response to APAP treatment (Figure 3F).
Hepatocyte ferroptosis mediated by Gα12-dependent peroxidation upon APAP exposure. (A) Volcano plot representation of differentially expressed genes between APAP-treated WT and Gna12 KO mice using RNA-seq analysis. The horizontal and vertical lines indicate the filtering criteria (absolute fold-change ≥ 1.5 and raw P < 0.05). The red and blue dots indicate the upregulated (509 genes) or downregulated (190 genes) genes (left, n = 3 each). GO terms associated with ROS production were obtained between WT and Gna12 KO mice treated with APAP (300 mg/kg BW, 6 h) (right, n = 3 each). NES and FDR are shown in the bar graph. (B) GPX4, FTH1, and HMGB1 transcript levels in patients with acute liver failure. Hepatic transcripts levels were assessed using a publicly available dataset (GSE74000) from healthy individuals (normal) or patients with APAP-induced acute liver failure (n = 2 or 3 each). (C) Immunohistochemistry for GPX4 and 4-HNE (scale bar: 200 μm). Percent areas of GPX4 and 4-HNE staining were assessed in the livers of WT or Gna12 KO mice treated with APAP (300 mg/kg BW, 6 h) using the Image J program (n = 4 or 5 each). (D) Immunoblottings for GPX4, 3-NT, and Gα12 in the livers of the same mice as in C. The band intensities represent values relative to their respective control (n = 3 or 4 each). (E) Immunoblottings for GPX4, 3-NT, and Gα12 in WT or Gna12 KO primary hepatocytes treated with APAP (10 mM, 12 h). The band intensities represent values relative to the respective controls (n = 3 each). (F) Histograms of BODIPY 581/591 C11 fluorescence at a 530 nm emission wavelength (FL1 channel) in AML12 cells treated with vehicle or APAP (10 mM, 24 h) after transfection with siCon or siGα12 (100 nM each, 24 h; the experiments were simultaneously performed). Averages of M1 proportion (%) in the FL1 channel were also measured (n = 3 each). For B-F, values were expressed as mean ± SD (*P < 0.05, **P < 0.01). Statistical significance was tested via two-tailed Student's t-tests or one-way ANOVA coupled with Tukey's HSD or the LSD multiple comparison procedure, where appropriate.
DL-buthionine-[S, R]-sulfoximine (BSO) leads to inhibit GSH synthesis with reduced GPX4 activity, thus promoting ferroptosis [16]. Therefore, we employed an in vivo BSO treatment model and identified Gα12 overexpression. Consistently, GPX4 was markedly repressed, as demonstrated by immunohistochemistry, which coincided with the liver injury area (Figure S3A). This outcome was confirmed using immunoblotting (Figure S3B). Additionally, we assessed the sulfhydryl-depleting effect of BSO on Gα12 and GPX4 levels in cells (Figure S3C, left). Similar results were obtained when we used Erastin (Figure S3C, right). To assess the causal relationship between Gα12 and ferroptosis, we further examined whether treatment with ferrostatin-1 (Fer-1), a specific inhibitor of ferroptosis [17], changes Gα12 expression in mice, and observed that Fer-1 treatment reversed the effects of APAP on Gα12 and GPX4 with almost a complete normalization of blood liver injury markers (Figure S4A-C). This effect was verified in cells treated with either BSO or Erastin (Figure S4D). Thus, it is highly likely that ferroptosis induces Gα12 expression. Together, these results provide strong evidence that the ER stress-mediated induction of Gα12 contributes to ferroptosis, which further amplifies Gα12 overexpression in a cyclical fashion, thus worsening hepatocyte injury.
Gα12-mediated ALOX12 induction in APAP-intoxicated livers
Having identified the impact of Gα12 on ferroptosis, we then sought to elucidate the regulatory molecules downstream from Gα12. Therefore, to discover the shared molecular functions required for the regulation of ferroptosis, we focused on the upregulated overlapping genes between APAP treatment and vehicle treatment in WT mice, as well as APAP-treated WT mice and APAP-treated Gna12 KO mice, using RNA-seq data. GO term enrichment analysis (molecular function) was performed on 71 genes upregulated in both groups (Figure 4A). We also conducted a KEGG pathway analysis using a Gna12 KO liver tissue cDNA microarray dataset (GSE51694). Several biological processes including “fatty acid elongation” (the foremost affected pathway) and “biosynthesis of unsaturated fatty acids” (the second-most affected pathway) were highly enriched (Figure 4B, left). These pathways are closely associated with ferroptosis, as polyunsaturated fatty acids (PUFAs) in lipid membranes react with ROS [18]. Among these molecules, we focused on lipoxygenases because they belong to a family of nonheme, iron-containing enzymes catalyzing the deoxygenation of PUFAs. In the analysis of cDNA microarray datasets obtained from WT and Gna12 KO livers, Alox12 was the most highly upregulated among major isoforms (Figure 4B, right).
Gα12-mediated induction of ALOX12 by APAP intoxication. (A) Venn diagrams showing the overlap of commonly upregulated genes in the liver of mice treated with APAP (300 mg/kg BW, 6 h) versus vehicle treatment (fold change ≥ 2.5 and raw P < 0.05) and WT mice treated with APAP (300 mg/kg BW, 6 h) versus Gna12 KO mice treated with APAP (fold change ≥ 2 and raw P < 0.05) (left, n = 3 each). GO term enrichment (molecular function) of the genes highlighted for functions such as arachidonic acid binding (second rank) (right). (B) KEGG pathway analysis using a cDNA microarray dataset (GSE51694) obtained from the liver of WT and Gna12 KO mice. Ferroptosis-related pathways are indicated in red (left and middle). Heatmap of Alox isoform transcript levels in the livers of WT and Gna12 KO mice (right, n = 3 each). (C) Immunohistochemistry for ALOX12 in the livers of WT or Gna12 KO mice treated with APAP (300 mg/kg BW, 6 h) (n = 3 or 4 each). (D) Immunoblotting for ALOX12 in the liver of WT or Gna12 KO mice treated with APAP (300 mg/kg BW, 6 h). The densitometric band intensities represent values relative to the respective control (n = 3 or 4 each). (E) Immunoblotting for ALOX12 in WT or Gna12 KO primary hepatocytes treated with APAP (10 mM, 12 h) (n = 3). (F) A schematic showing a construct encoding Gα12-WT (Lv-Alb-Gα12) downstream from the albumin promoter. The mice were injected with a single dose of albumin promoter-Gα12-WT lentivirus (or Lv-control) through the tail vein. After one week, the mice were fasted overnight prior to APAP treatment and sacrificed 6 h thereafter. (G) Representative immunohistochemistry (upper) and immunoblottings (lower) for ALOX12 and Gα12 in WT mice treated with APAP (300 mg/kg BW, 6 h) one week after injection with Lv-con or Lv-Gα12 via the tail vein (n = 3 or 4 each). (H) Representative immunohistochemistry for ALOX12 (upper) and immunoblottings (lower) for ALOX12 and Gα12 in WT mice and Gna12 KO mice treated with APAP (300 mg/kg BW, 6 h) one week after injection with Lv-con or Lv-Gα12 via the tail vein (n = 4-6 each). For D, values were expressed as mean ± SD (**P < 0.01). Statistical significance was tested via one-way ANOVA coupled with Bonferroni's method, where appropriate. scale bar: 200 μm.
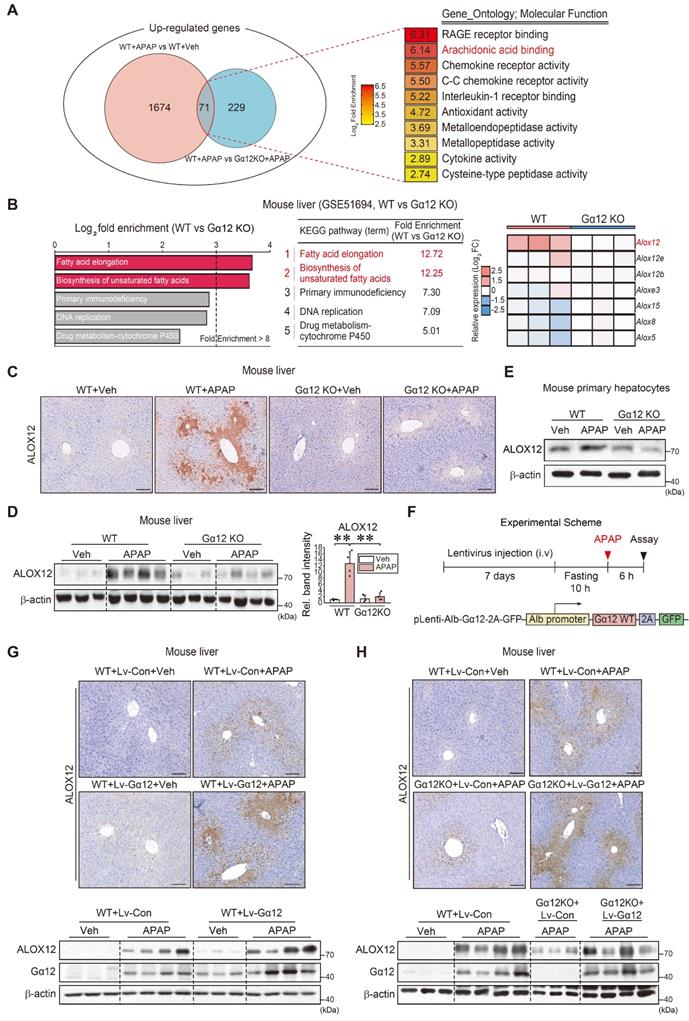
As expected, APAP treatment upregulated ALOX12 in WT mice. A reversal of ALOX12 expression by a Gα12 deficiency was confirmed in primary hepatocytes (Figure 4C-E). To confirm the effects of liver-specific Gα12 overexpression on ALOX12 with more precision, we utilized a lentiviral albumin-Gα12 (Lv-Alb- Gα12) delivery system in WT or Gna12 KO animals subjected to APAP challenge (Figure 4F). We then analyzed the protein levels in the liver of WT and Gna12 KO mice subjected to hepatocyte-specific overexpression of Gα12. The overexpression of Gα12 enhanced the ability of APAP to induce ALOX12 (Figure 4G). Moreover, the lack of ALOX12 induction in Gna12 KO mice was reversed by Gα12 overexpression (Figure 4H and S5A). In Figure S5B, the increasing effect of APAP on the Alox12 transcript was statistically non-significant, but the fold-changes in the absence of Gα12 seemed to be attenuated. Also, hepatocyte-specific Gα12 overexpression in Gna12 KO mice repressed GPX4 (Figure S5C). These results demonstrate that Gα12 overexpression enhances the effects of APAP on ALOX12 and GPX4, which leads to peroxide production and ultimately results in hepatocyte ferroptosis.
Induction of ALOX12 as mediated by miR-15a dysregulation
Given that Gα12 deficiencies led to minor changes in Alox12 transcripts relative to its protein levels, we next explored microRNA-dependent post-transcriptional processes. Candidates were predicted using the Target Scan program after analyzing the overlap between microarray datasets from Gα12QL (an active mutant form)-Huh7 cells (GSE44079), miRNAs downregulated by APAP intoxication in mice [19], and those putatively bound to the 3'-UTR of ALOX12 mRNA (Figure 5A). Among these, we selected microRNA (miR)-15a as a potential inhibitor of ALOX12. As expected, APAP treatment significantly and substantially diminished miR-15a levels. Specifically, the lentiviral delivery of Gα12 to hepatocytes in vivo suppressed the basal miR-15a expression. Combining APAP treatment and Gα12 overexpression in hepatocytes tended to further decrease miR-15a levels (Figure 5B, left). Moreover, ablation of Gα12 lessened the ability of APAP to inhibit miR-15a, which was reversed by hepatocyte-specific delivery of Gα12 (Figure 5B, right). Similarly, silencing of Gα12 increased miR-15a level in response to APAP treatment (Figure 5C, left). The opposite outcome was obtained in cells with Gα12 overexpression (Figure 5C, right). MiR-15a may regulate other targets such as pro-inflammatory (6 genes) and lipid metabolism (8 genes) pathways. Among these, Alox12 displayed a higher fold change in the liver of WT mice compared to Gna12 KO mice (Figure 5D).
Identification of miR-15a as an inhibitor of ALOX12 downstream from Gα12. (A) Venn diagrams showing miR-15a expression among the downregulated miRNAs in the liver of mice treated with APAP (300 mg/kg, 24 h) (Wang K, et al. PNAS, 2009), Huh7 cells with Gα12QL transfection (GSE44079), and those predicted to inhibit ALOX12 based on our Target Scan database analyses; 18 miRNAs were downregulated in the first set, whereas a total of 15 downregulated miRNAs were identified in the second set. Seven miRNAs were predicted to target ALOX12. (B) qRT-PCR assays for miR-15a using the same mice as in Fig. 4G (n = 4-6 each) or Fig. 4H (n = 3-5 each). Experiments were done at the same time and the marked control group (▲) was shared for statistical analysis. (C) qRT-PCR assays for miR-15a in AML12 cells treated with APAP (10 mM, 12 h) after transfection with siGα12 (or siCon) (100 nM, 24 h, n = 5 each) (left), or the plasmid encoding for Gα12 or a mock vector (1 μg, 24 h, n = 5 each) (right). (D) Heatmap of differentially expressed miR-15a target genes based on the GSE51694 dataset from the livers of WT and Gna12 KO mice; Alox12, 6 pro-inflammatory genes, and 8 lipid metabolism genes (n = 3 each). (E) Prediction of miR-15a binding to the 3'-UTR of Alox12 mRNA (upper). Alox12-3'-UTR luciferase assays in AML12 cells transfected with miR-15a ASO (or control ASO) (100 nM, 48 h), or miR-15a mimic (or control mimic) (100 nM, 24 h) (lower, n = 3 or 4 each). (F) Immunoblottings for ALOX12 in AML12 cells transfected with miR-15a ASO (or control ASO) (100 nM, 48 h), or miR-15a mimic (or control mimic) (upper, 100 nM, 24 h). The densitometric band intensities represent values relative to the respective control (lower, n = 3 or 4 each). For B, C, E, and F, values were expressed as mean ± SD (*P < 0.05, **P < 0.01). Statistical significance was tested via two-tailed Student's t-tests or one-way ANOVA with the LSD multiple comparison procedure, where appropriate.
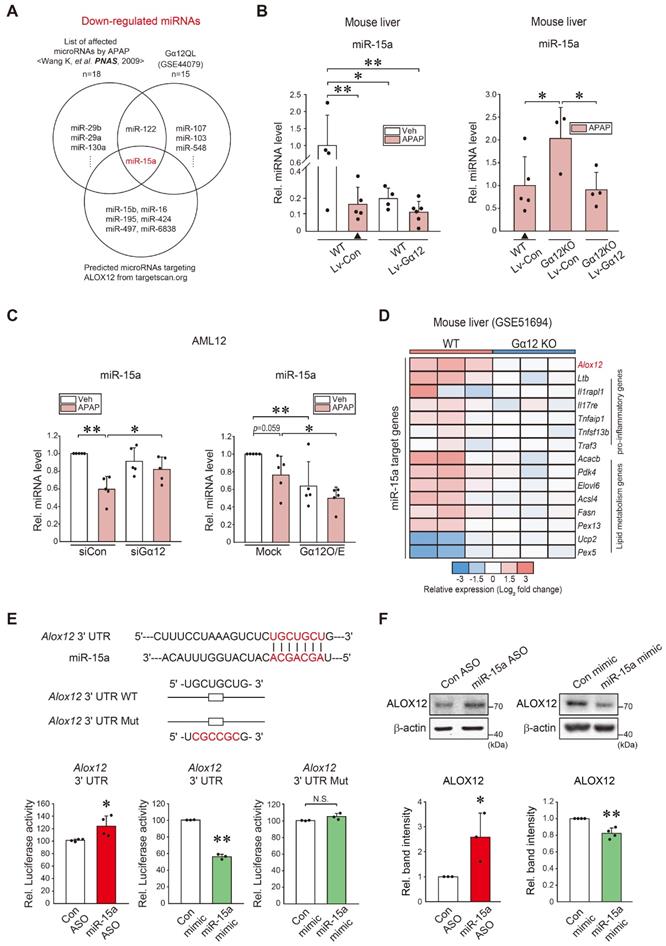
Next, we assessed the effect of miR-15a on ALOX12 using an Alox12 3'-UTR reporter construct. There was a practically complete pairing between Alox12 3'-UTR and the miR-15a seed sequence (Figure 5E, upper). Transfection with miR-15a antisense oligonucleotide (ASO) and miR-15a mimic significantly altered Alox12 3'-UTR luciferase activity and miR-15a mimic transfection effect was not observed in the assay using an Alox12 3'-UTR mutant reporter (Figure 5E, lower). The inhibitory effect of miR-15a on ALOX12 was strengthened by the outcomes of experiments using an ASO inhibitor or mimic (Figure 5F). Collectively, these data show that miR-15a inhibits ALOX12 in hepatocytes, which may be dysregulated by APAP intoxication downstream from Gα12.
Prevention of ALOX12 induction and ferroptosis by ROCK1 inhibition
ROCK1/2 are key effectors of the Gα12-RhoA pathway [20]. Given the association between Gα12, the RhoA-ROCK pathway, and ferroptosis, our findings indicated that miR-15a acts as an ALOX12 inhibitor, we next examined the role of each ROCK isoform and their pharmacological inhibition. First, siRNA knockdown experiments were conducted to confirm the selectivity of ROCK1 in APAP-induced ferroptosis. Knockdown of ROCK1, but not ROCK2, prevented ALOX12 induction. ROCK1 silencing resulted in a moderate GPX4 recovery in primary hepatocytes and AML12 cells (Figure 6A-B and S6A). ALOX12 inhibition by ROCK1 knockdown was reversed by miR-15a ASO transfection (Figure 6C). Lastly, we confirmed the inhibitory effect of miR-15a mimic on the induction of ALOX12 via Gα12 overexpression (Figure 6D). Next, we assessed the effect of ripasudil (a ROCK1 preferential inhibitor) treatment on WT mice after a single dose of APAP (Figure 6E). Interestingly, this compound was found to completely inhibit the onset of acute liver injury. The ability of ripasudil to rescue APAP intoxication was confirmed by ALT and AST assays (Figure 6F). Lipid peroxidation was also suppressed and ALOX12 induction was attenuated with increased GPX4 levels (Figure 6G). Therefore, ripasudil treatment was deemed an effective means to inhibit APAP-induced ferroptosis.
Inhibition of APAP-induced ferroptosis by ROCK1 inhibitors. (A) Immunoblottings for ALOX12, GPX4, and ROCK1 in mouse primary hepatocytes treated with APAP (10 mM, 12 h) after transfection with siROCK1 (or siCon) (100 nM, 24 h). (B) Immunoblottings for ALOX12, GPX4, and ROCK2 in mouse primary hepatocytes treated with APAP (10 mM, 12 h) after transfection with siROCK2 (or siCon) (100 nM, 24 h). (C) Immunoblotting of ALOX12 in AML12 cells transfected with miR-15a ASO (or control ASO) (100 nM, 48 h) after transfection with siROCK1 (100 nM, 24 h). (D) Immunoblotting of ALOX12 in AML12 cells transfected with miR-15a mimic (or control mimic) (100 nM, 24 h) after transfection with Gα12 (1 μg, 24 h). (E) A schematic showing APAP and ripasudil treatment (left). Liver histopathology in WT mice treated with ripasudil (50 mg/kg BW, 5 h) 1 h after APAP treatment (300 mg/kg BW, 6 h) (right, n = 5-7 each). scale bar: 100 μm. (F) Serum ALT and AST activities in the same mice as in E. (G) Immunoblottings for 3-NT, ALOX12, and GPX4 in the same mice as in E. (H) Immunoblotting analyses for ALOX12, GPX4, and p-MLC in WT primary hepatocytes treated with APAP (10 mM, 12 h) 1 h after treatment with ripasudil (50 μM), Y-27632 (10 μM), or netarsudil (2 μM) (n = 3 each). For A-D and G, the band intensities represent values relative to the respective control (n = 3-6 each). For A-D, F, and G, values were expressed as mean ± SD (*P < 0.05, **P < 0.01). Statistical significance was tested via one-way ANOVA coupled with Tukey's HSD or the LSD multiple comparison procedure, where appropriate.
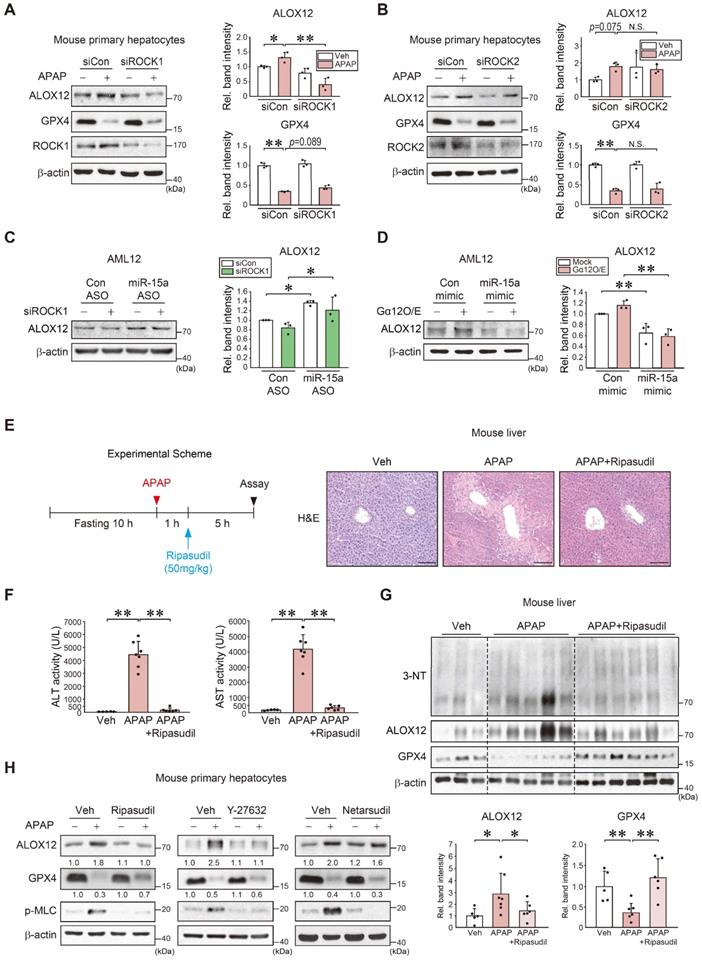
Moreover, treatment with ripasudil inhibited ALOX12 and led to a recovery of GPX4 levels. Y-27632 also decreased ALOX12, albeit with an insignificant GPX4 recovery. In contrast, netarsudil (a selective ROCK2 inhibitor) rendered minimal effects. The levels of p-MLC, a downstream marker of ROCK, were similarly affected (Figure 6H and S6B). These results demonstrate that pharmacological inhibitors or ROCK1-specific siRNA prevent APAP-induced ferroptosis.
Amelioration of APAP-induced liver injury and inflammation by Gα12 ablation
To understand the functional impact of Gα12 modulations on APAP intoxication more in depth, we employed Gα12 genetic knockout and hepatocyte-specific overexpression techniques using a mouse model. Histopathological analyses demonstrated that Gα12 ablation substantially ameliorated liver injury elicited by a single APAP dose. This effect was confirmed by the results of blood biochemical assays (Figure 7A). GSEA was then performed using RNA-seq data obtained from WT and Gna12 KO mice treated with APAP to assess how Gα12 affects liver damage. Interestingly, most of the elucidated liver injury-related pathways were linked to the inflammatory response. To understand the functional significance of this pathway, we examined the function of the leading edge genes (red-dotted box) upregulated in APAP-treated WT compared to APAP-treated Gna12 KO mice. Notably, we identified Il-1β as a key molecule in the 'positive regulation of acute inflammatory response' GO pathway (Figure 7B, upper and S7A). APAP-treated WT mice exhibited significant increases in the transcript levels of Il-1β, Tnf-α, and Il-6 in the liver, which was significantly attenuated by Gna12 KO. However, the Gna12 KO effect was not seen in the assays for anti-inflammatory biomarkers including Arg1, Cd206, and Ym1 (Figure 7B, lower and S7B).
Increase in inflammatory injuries of hepatocytes by Gα12 overexpression. (A) Liver histopathology (H&E), serum alanine transaminase (ALT), and serum aspartate transaminase (AST) activities in WT or Gna12 KO mice treated with APAP (300 mg/kg BW, 6 h) (n = 4-7 each). (B) GSEA plot of GO categories, leading-edge genes (upper, n = 3 each) (NES = 1.94, FDR < 0.1), and qRT-PCR assays in the same mice as in A (lower, n = 3-7 each). (C) Liver histopathology, ALT, and AST activities in the same mice as in Fig. 4G (n = 5 or 6 each). (D) qRT-PCR assays for inflammatory cytokines in the same mice as in Fig. 4G (n = 3-6 each). (E) Liver histopathology (left), ALT and AST activities (right) in the same mice as in Fig. 4H. For C and E, experiments were done at the same time and the marked control groups (▲ and △) were respectively shared for statistical analyses. (F) Flow cytometric analyses for fluorescein isothiocyanate-annexin V and propidium iodide (upper). The average proportion (%) of the upper right portion was measured (lower). AML12 cells were treated with APAP (10 mM, 24 h) after transfection with siCon or siGα12 (100 nM each, 24 h) (n = 3 each). For A-F, values represent the mean ± SD (*P < 0.05, **P < 0.01). Statistical significance was tested via one-way ANOVA coupled with Tukey's HSD or the LSD multiple comparison procedure, where appropriate. scale bar: 100 μm.
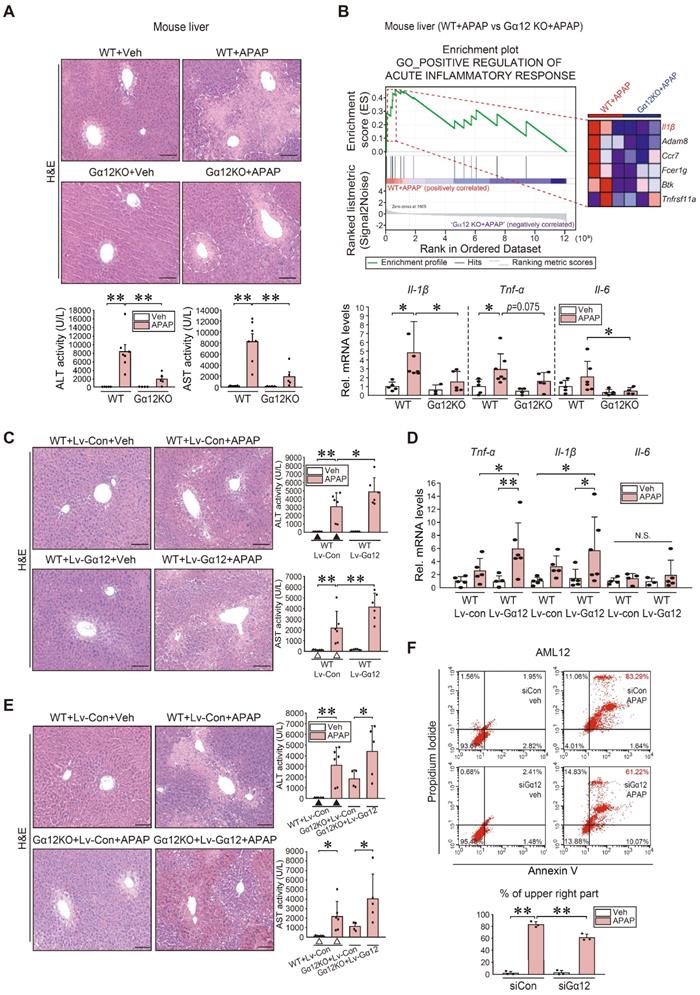
To verify the effects of liver-specific Gα12 overexpression, we employed an Lv-Alb-Gα12 system in WT or Gna12 KO animals subjected to APAP challenge. As expected, more severe hepatic injuries and inflammatory responses were observed in WT mice due to hepatocyte-specific overexpression of Gα12 (Figure 7C-D and S7C). Similarly, the liver-specific Gα12 delivery to Gna12 KO mice abrogated the liver-protective effect (Figure 7E). In contrast, Gα12 deficiency significantly decreased necrotic cell populations. Moreover, Gα12 siRNA transfection decreased the population of propidium iodide (PI) and Annexin V double-positives in cells treated with APAP (Figure 7F). Likewise, APAP-induced increases in the number of TUNEL-positive cells in the liver were significantly diminished in Gna12 KO mice (Figure S7D). In addition, adenoviral delivery of Gα12 to AML12 cells enhanced the ability of Tm to increase Annexin V/PI double-positive cell populations (Figure S7E). Together, these findings strongly support the role of ER stress-mediated Gα12 overexpression in hepatic inflammation and necrosis in response to APAP intoxication.
Dysregulation of Gα12, ALOX12, and miR-15a in patients with acute liver injury or fibrosis/cirrhosis
Finally, we analyzed the identified regulatory molecules in patient liver samples. Analysis of public GEO databases obtained from patients with HBV-associated acute liver failure (HBV-ALF) (GSE38941) indicated that hepatic ROCK1 transcript levels were higher in patients with submassive hepatic necrosis (SHN) or massive hepatic necrosis (MHN) compared to healthy individuals, whereas ROCK2 mRNA levels were not significantly affected (Figure 8A). To further assess the association of GNA12, ALOX12, and miR-15a transcript levels and liver injury in clinical situations, we analyzed samples of patients with acute liver injury on drugs. As expected, the intoxicated patients, which consisted of drugs, herb medications, and unknown origin, exhibited increases in hepatotoxicity-related values compared to normal subjects (Supplementary Table 1). Patients with acute liver injury showed significantly higher GNA12, ALOX12 transcript levels along with the decrease of miR-15a as compared to healthy subjects (Figure 8B). Hepatic GNA12 and ALOX12 mRNA levels positively correlated with each other. The negative correlations existed between miR-15a and GNA12, or miR-15a and ALOX12 (Figure 8C). Immunoblottings confirmed strong increases in Gα12 and ALOX12 levels in patients with acute liver injury (Figure 8D).
Correlations between Gα12-ROCK1, ALOX12, miR-15a, and GPX4 in liver specimens of patients with acute liver injury or liver fibrosis. (A) ROCK1 and ROCK2 transcript levels in the livers of healthy individuals or patients with HBV-acute liver failure (ALF). MHN, massive hepatic necrosis; SHN, submassive hepatic necrosis. The data are reported as a box-and-whisker plot. Box, interquartile range (IQR); whiskers, 5-95 percentiles; horizontal line within the box, median (n = 10 samples from 10 individual normal subjects; n = 8 samples from 2 patients with SHN-ALF; n = 9 samples from 2 patients with MHN-ALF; as described in the GSE38941 database). (B) GNA12, ALOX12, and miR-15a transcript levels in the livers of healthy individuals (n = 5) or patients with DILI (n = 21 for GNA12 and ALOX12, and n = 16 for mir-15a). In some of the patient samples, GNA12 (n = 1), ALOX12 (n = 1) and miR-15a (n = 6) levels were undetectable. (C) Correlations between GNA12 and ALOX12 (left, n = 26), or GNA12 and miR-15a (middle, n = 20), or miR-15a and ALOX12 (right, n = 20) transcripts. In some samples, GNA12 (n = 1), ALOX12 (n = 1) and miR-15a (n = 6) levels were undetectable. (D) Immunoblottings for Gα12 and ALOX12 in healthy individuals (n = 5) or patients with DILI (left, n = 22), and their quantifications (right, n = 27). Representative blots were shown. Short and long exposures were shown for comparison. (E) ROCK1 and ROCK2 transcript levels in the livers of healthy individuals or a large cohort of patients with liver fibrosis (GSE25097, n = 46). (F) Correlations between GNA12 and ALOX12 (left, n = 47), or GNA12 and miR-15a (right, n = 38) transcripts in patients with no fibrosis and liver fibrosis. MiR-15a levels in 9 patients with fibrosis were undetectable. (G) Immunoblottings for Gα12 and ALOX12 in patients with no fibrosis (Metavir score F0) or patients with the portal (Metavir score F1, 2) or septal (Metavir score F3) fibrosis, or those with cirrhotic (Metavir score F4) lesion (upper), and their quantifications (lower, n = 47). Fibrosis was scored as F0 (absent), F1 (portal fibrosis), F2 (portal fibrosis with few septa), F3 (septal fibrosis), and F4 (cirrhosis) according to the Metavir Score System. (H) Immunohistochemistry for Gα12, ALOX12, and GPX4 in patients without fibrosis (n = 2) or septal fibrosis (right, n = 10). Representative liver sections are shown. scale bar: 200 μm. For A and E, Values were expressed as mean ± SD (*P < 0.05, **P < 0.01). For B, D, and G, violin plots show all independent biological replicates with the median as a red straight line and the upper/lower quartiles as black straight lines (*P < 0.05, **P < 0.01). Statistical significance was tested via two-tailed Student's t-tests, Pearson correlation, or one-way ANOVA coupled with Tukey's HSD or the LSD multiple comparison procedure, where appropriate.
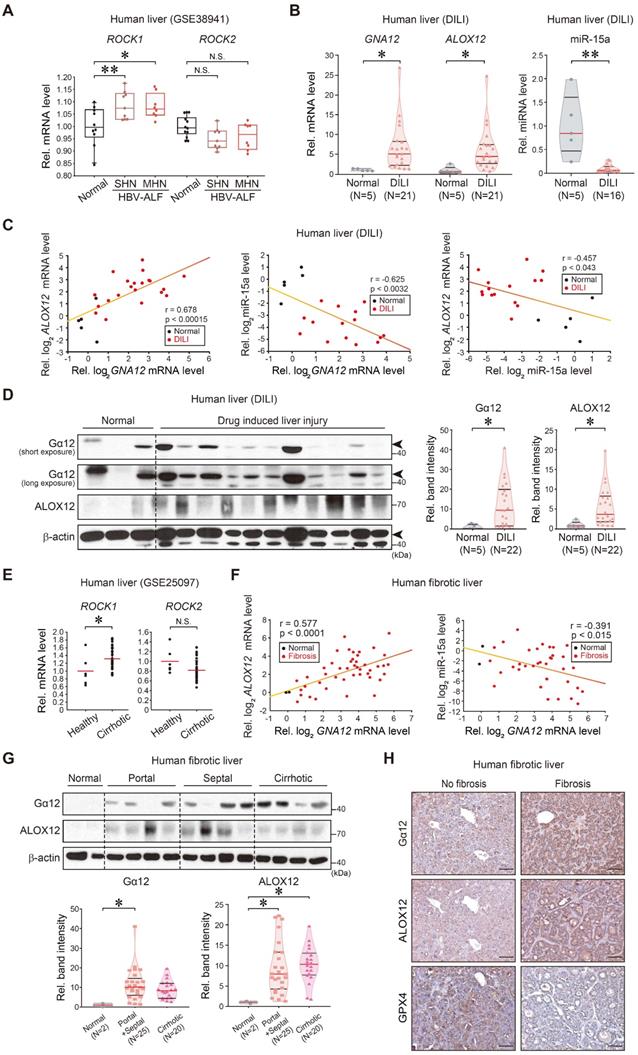
To extend our findings to patients with liver fibrosis, we further analyzed a public cirrhosis dataset and experimentally the non-tumorous regions of HCC patients with fibrosis; cirrhotic patients exhibited significantly higher transcript levels of ROCK1, but not ROCK2 than healthy individuals in a human cirrhotic liver cohort database (GSE25097) (Figure 8E). When we analyzed liver samples of HCC patients with fibrosis, we found a positive correlation between GNA12 and ALOX12 mRNAs (Figure 8F, left), and an inverse correlation between miR-15a and GNA12 mRNAs (Figure 8F, right). Moreover, we corroborated an overall increase in Gα12 and ALOX12 levels in the analyses of the portal, septal fibrosis, and cirrhosis subgroups divided according to fibrosis severity (Figure 8G). Among these, the septal fibrosis subgroup appeared to display the highest fold change in Gα12 and ALOX12 compared to the remaining subgroups. Immunohistochemistry confirmed the induction of Gα12 and ALOX12 with reciprocal decreases in GPX4 (Figure 8H). Taken together, these results indicate that Gα12 overexpression mediated by ER stress promotes ALOX12 induction in hepatocytes through ROCK1 by dysregulating miR-15a, which then promotes ferroptosis.
Discussion
Our findings shown here indicated that ER stress-mediated Gα12 overexpression facilitates APAP-induced liver injury, thus elucidating a novel role of Gα12 in the signaling pathway culminating in acute hepatic injury. This hypothesis was further supported by the fact that Gα12 ablation prevented liver injury, an effect that was abrogated by hepatocyte-specific overexpression of Gα12. Moreover, other toxicant challenges also lead to Gα12 overexpression, resulting in hepatocyte ferroptosis, all of which provide novel insights into the mechanisms of liver pathology. Also, the effects of other ER stress-inducers strengthen the role of the Gα12 signaling axis in acute liver injury. Previously, we investigated the regulatory role of Gα12 in hepatic lipid metabolism for mitochondrial energy expenditure through SIRT1 and PPARα, identifying Gα12 as a physiological regulator that contributes to mitochondrial oxidation. However, overexpression of Gα12 in conjunction with ER stress unexpectedly causes hepatocyte ferroptosis presumably due to dysregulation of the coordinated functions of mitochondria and ER capacity. Thus, our findings confirm that Gα12 and its downstream molecules may be promising targets for the treatment of acute liver injury accompanying ER stress.
In this study, we elaborated on the role of the IRE1α-Xbp1 pathway in the transcriptional induction of Gna12. This, in turn, results in an ER stress-induced vicious cycle in hepatocytes, suggesting that ER stress induction of Gα12 may lead to hepatocyte dysfunction if not treated promptly, contributing to the development of liver injurious symptoms and subsequently fibrosis progression. Previously, we reported the role of the JNK pathway in macrophages downstream of Gα12 contributes to NF-κB-mediated inflammatory responses. Our study also showed augmented increases of Il-1β, Tnf-α, and Il-6 in the liver of APAP-treated WT or Gα12 KO mice subjected to hepatocyte-specific overexpression of Gα12. Therefore, Gα12 overexpression in hepatocytes coupled with inflammatory cytokine production from macrophages likely leads to hepatocyte death, exacerbating injurious symptoms, as further corroborated by our analyses of human liver samples.
APAP-induced liver toxicity mainly results from apoptotic and necrotic cell death, as supported by the resulting mitochondrial permeability transition pore opening, membrane swelling, and lysis [21]. Our results showing changes in AnnexinV/PI and TUNEL staining after modulation of Gα12 in the present study supports this idea, being also consistent with Gα12-JNK-dependent apoptosis. Thus, both apoptosis and necroptosis are responsible for APAP-induced hepatotoxicity [22]. However, it is now accepted that apoptosis plays a limited role due to the ineffectiveness of pan-caspase inhibitors in a rodent model of APAP-induced hepatotoxicity [23]. In addition, RIPK3 and MLKL were found to be dispensable [24], suggesting that necroptosis may not account for the entire necrotic cell death. An important finding of our study is that Gα12 plays a critical role in the ferroptosis process. NAPQI, a reactive intermediate produced from APAP metabolism, causes GSH depletion in hepatocytes, which would contribute to ferroptosis. These findings were confirmed by our experiments, indicating that Fer-1 prevents BSO- or Erastin-induced dysregulation of GPX4. While we were finishing this research, a report came out showing Fer-1 inhibition of APAP toxicity [25]. Altogether, our findings elucidate previously uncharacterized features of ferroptosis and its contribution to the progression of acute liver injury.
Lipoxygenase (LOXs) catalyzed lipid peroxides production. PUFAs are the preferred substrates of LOXs and thus lead to the acceleration of the pro-ferroptotic oxidation process [26]. Specifically, ALOX12 is induced in hepatocytes during ischemia-reperfusion and catalyzes the dioxygenation of PUFAs. Moreover, an increase in ALOX12 expression may facilitate a variety of stress conditions [27]. Therefore, the induction of ALOX12 is likely to accelerate an inflammatory response. ALOX12 also contributes to p53-mediated ferroptosis [28]. Our data clearly demonstrate that ALOX12 expression relies on Gα12 signaling. This was particularly demonstrated by our experiments involving hepatocyte-specific Gα12 gene delivery in Gna12 KO mice. These findings reiterate the initiating role of APAP-induced Gα12 overexpression in the context of ALOX12 induction, elucidating new molecular mechanisms of liver pathogenesis, as well as the role of ER stress in hepatocytes.
Mir-15a has been implicated in a variety of pathological events. Specifically, miR-15a is repressed during the development of liver fibrosis and liver cancer [29, 30]. Another important finding of this study was the discovery of miR-15a as a regulator located downstream from the Gα12 pathway in normal hepatocytes. Moreover, miR-15a levels were decreased in animals subjected to either APAP treatment or Gα12 overexpression, whereas the opposite occurred when Gα12 was ablated. The outcomes of this study demonstrated that miR-15a directly interacts with the 3'-UTR of ALOX12 mRNA, thereby inhibiting ALOX12. The negative relationship between miR-15a and Gα12 was corroborated using human liver samples, providing a new clinical basis for the targeting of specific disease-associated molecules.
Lipid peroxides are also removed by GPX4 and its cofactor GSH. GPX4 inactivation causes GSH depletion through lipid hydroperoxide accumulation [31], highlighting the key role of this enzyme in regulating cell death control. Moreover, APAP-induced Gα12 overexpression affects several gene clusters such as superoxide generation, arachidonic acid binding, and biosynthesis of unsaturated fatty acids, all of which may favor the supply of PUFAs. In line with these observations, ferroptosis inducers led to Gα12 overexpression. The cyclic link between Gα12 overexpression and GPX4 inhibition was further strengthened by the fact that APAP-triggered lipid peroxidation was alleviated in the liver of Gna12 KO mice or by Gα12 silencing. Together, our findings strongly support the hypothesis that Gα12 overexpression by ER stress facilitates lipid peroxidation through GPX4 inhibition. It has been shown that interaction between ALOX12 and SLC7A11 was unaffected by Erastin or other ferroptosis inducers, or by GPX4 inhibition [32]. Thus, GPX4 and ALOX12 may independently mediate ferroptosis.
APAP poisoning and fatalities are linked to increased production of reactive metabolites [33]. Currently, N-acetylcysteine is used to treat APAP-intoxicated patients. However, its efficacy is insufficient to treat patients with acute liver injury, and this antidote has other limitations [34]. Therefore, new therapeutic agents must be identified. The role of ROCK inhibitors in a variety of diseases has been widely investigated [35]. Here, inhibitors of ROCK1, but not ROCK2, effectively ameliorated acute liver injury. Moreover, ROCK1 inhibition increased GPX4 levels while also inhibiting ALOX12. Therefore, it is likely that ROCK1-dependent changes in GPX4 and ALOX12 levels contribute to APAP toxicity. Our findings highlight the potential applications of ROCK1 inhibitors for the development of novel approaches to treat acute liver injury and related liver diseases.
Repetitive or long-term exposure to toxicants may lead to the development of hepatitis and liver fibrosis [36]. Previously, we showed that Gα12 is overly expressed in activated hepatic stellate cells, thus promoting liver fibrosis through autophagy [37]. In the present human fibrotic sample analyses, Gα12 expression correlated well with that of ALOX12, as well as reciprocal changes in GPX4 and miR-15a levels. This outcome was further supported by additional data showing that ROCK1 transcripts were markedly upregulated in patients with acute liver failure or cirrhosis, suggesting that the Gα12-ROCK1 axis may culminate in ferroptosis and related liver diseases in clinical settings. Additionally, the correlations existed between Gna12 and Ddit3 (or Alox12/Gpx4) levels in the datasets obtained from hepatocytes or liver tissues exposed to tolvaptan, diclofenac, and methapyrilene (Figure S1C and S8).
In the present study, we analyzed the dataset originated from hepatocytes to obtain information on hepatocyte biology excluding the influences of non-parenchymal cell mediators [38]. Liver tissue was also used for RNA sequencing in addition to GEO dataset analyses, which is necessary to understand in vivo physiology. HepG2 cell line was employed for signaling pathway mapping. All of these models consistently show comparable outcomes, supporting our hypothesis. Collectively, our findings demonstrate that overexpression of Gα12 in hepatocytes by ER stress induces ALOX12 through ROCK1 by dysregulating miR-15a. This, in turn, promotes hepatocyte ferroptosis during the event of acute liver injury, and also presumably leads to the progression of fibrosis. Therefore, pharmacological inhibition of the Gα12-ROCK1 axis may represent a promising strategy for the treatment of liver diseases including acute liver injury, hepatitis, and fibrosis/cirrhosis.
Abbreviations
4-HNE: 4-hydroxynonenal; 3-NT: 3-nitrotyrosine; Ad: adenovirus; ALOX12: arachidonate 12-lipoxygenase; ALT: alanine aminotransferase; ANOVA: analysis of variance; APAP: acetaminophen; ASO: antisense oligonucleotide; AST: aspartate aminotransferase; ATF6: activating transcription factor 6; BSO: buthionine sulfoximine; CASP1: caspase 1; CCl4: carbon tetrachloride; DILI: drug induced liver injury; ER: endoplasmic reticulum; FDR: false discovery rate; Fer-1: ferrostatin-1; Gα12: G protein subunit alpha 12; GEO: Gene Expression Omnibus; GFP: green fluorescence protein; GO: Gene Ontology; GPCR: G protein-coupled receptors; GPX4: glutathione peroxidase 4; GRP78: glucose regulatory protein 78; GSH: glutathione; GSEA: gene set enrichment analysis; IRE1α: inositol-requiring enzyme 1α; KEGG: Kyoto Encyclopedia of Genes and Genomes; KO: knockout; MHN: massive hepatic necrosis; miR-15a: microRNA-15a; miRNA: microRNA; MLKL: mixed lineage kinase domain like pseudokinase; NAC: N-acetylcysteine; NAPQI: N-acetyl-p-benzoquinone imine; NES: normalized enrichment score; PERK: protein kinase R-like endoplasmic reticulum kinase; PI: propidium iodide; PUFAs: polyunsaturated fatty acids; RhoA: ras homolog gene family member a; RIPK3: receptor-interacting serine/threonine-protein kinase 3; RNA-seq: RNA sequencing; ROCK1: rho associated coiled-coil containing protein kinase 1; ROCK2: rho associated coiled-coil containing protein kinase 2; ROS: reactive oxygen species; SHN: submassive hepatic necrosis; siRNA: small interfering RNA; Tm: tunicamycin; TUNEL: terminal deoxynucleotidyl transferase dUTP nick end labeling; UTR: untranslated region; WT: wild type; Xbp1: the X-box binding protein 1.
Supplementary Material
Supplementary materials and methods, figures and tables.
Acknowledgements
We thank Melvin I. Simon (California Institute of Technology, Pasadena, California, USA) for providing the Gna12-KO mice, Richard D. Palmiter (University of Washington, Seattle, Washington, USA) for the mouse albumin enhancer/promoter (NB) construct. This work was supported by a National Research Foundation of Korea (NRF) grant funded by the Korean government (MSIP) (NRF-2021R1A2B5B03086265).
Author Contributions
JHT: study concept and design; experimental data acquisition; data analysis and interpretation; statistical analysis; manuscript writing. YSK and THK: data acquisition; data analysis and interpretation. GCP and SH: collection of human samples and analysis of electronic medical records. SGK: study concept and design; data analysis and interpretation; manuscript writing; critical revision of the manuscript; obtained funding; administrative, technical, and material support; study supervision.
A part of the data included in this manuscript was presented at the 2019 AACR (American Association for Cancer Research).
Competing Interests
The authors have declared that no competing interest exists.
References
1. Bernal W, Wendon J. Acute liver failure. N Engl J Med. 2013;369:2525-34
2. Andrade RJ, Chalasani N, Björnsson ES, Suzuki A, Kullak-Ublick GA, Watkins PB. et al. Drug-induced liver injury. Nature Reviews Disease Primers. 2019;5:58
3. Kang KW, Choi SY, Cho MK, Lee CH, Kim SG. Thrombin induces nitric-oxide synthase via Galpha12/13-coupled protein kinase C-dependent I-kappaBalpha phosphorylation and JNK-mediated I-kappaBalpha degradation. J Biol Chem. 2003;278:17368-78
4. Kim TH, Yang YM, Han CY, Koo JH, Oh H, Kim SS. et al. Gα12 ablation exacerbates liver steatosis and obesity by suppressing USP22/SIRT1-regulated mitochondrial respiration. J Clin Invest. 2018;128:5587-602
5. Dara L, Ji C, Kaplowitz N. The contribution of endoplasmic reticulum stress to liver diseases. Hepatology. 2011;53:1752-63
6. Malhi H, Kaufman RJ. Endoplasmic reticulum stress in liver disease. J Hepatol. 2011;54:795-809
7. Koo JH, Lee HJ, Kim W, Kim SG. Endoplasmic Reticulum Stress in Hepatic Stellate Cells Promotes Liver Fibrosis via PERK-Mediated Degradation of HNRNPA1 and Up-regulation of SMAD2. Gastroenterology. 2016;150:181-93.e8
8. Kim JY, Garcia-Carbonell R, Yamachika S, Zhao P, Dhar D, Loomba R. et al. ER Stress Drives Lipogenesis and Steatohepatitis via Caspase-2 Activation of S1P. Cell. 2018;175:133-45.e15
9. Dixon SJ, Lemberg KM, Lamprecht MR, Skouta R, Zaitsev EM, Gleason CE. et al. Ferroptosis: an iron-dependent form of nonapoptotic cell death. Cell. 2012;149:1060-72
10. Kagan VE, Mao G, Qu F, Angeli JP, Doll S, Croix CS. et al. Oxidized arachidonic and adrenic PEs navigate cells to ferroptosis. Nat Chem Biol. 2017;13:81-90
11. Wang H, An P, Xie E, Wu Q, Fang X, Gao H. et al. Characterization of ferroptosis in murine models of hemochromatosis. Hepatology. 2017;66:449-65
12. Friedmann Angeli JP, Schneider M, Proneth B, Tyurina YY, Tyurin VA, Hammond VJ. et al. Inactivation of the ferroptosis regulator Gpx4 triggers acute renal failure in mice. Nat Cell Biol. 2014;16:1180-91
13. Gu JL, Müller S, Mancino V, Offermanns S, Simon MI. Interaction of G alpha(12) with G alpha(13) and G alpha(q) signaling pathways. Proc Natl Acad Sci U S A. 2002;99:9352-7
14. Mohar I, Stamper BD, Rademacher PM, White CC, Nelson SD, Kavanagh TJ. Acetaminophen-induced liver damage in mice is associated with gender-specific adduction of peroxiredoxin-6. Redox Biol. 2014;2:377-87
15. Han CY, Lim SW, Koo JH, Kim W, Kim SG. PHLDA3 overexpression in hepatocytes by endoplasmic reticulum stress via IRE1-Xbp1s pathway expedites liver injury. Gut. 2016;65:1377-88
16. Xie Y, Hou W, Song X, Yu Y, Huang J, Sun X. et al. Ferroptosis: process and function. Cell Death Differ. 2016;23:369-79
17. Stockwell BR, Friedmann Angeli JP, Bayir H, Bush AI, Conrad M, Dixon SJ. et al. Ferroptosis: A Regulated Cell Death Nexus Linking Metabolism, Redox Biology, and Disease. Cell. 2017;171:273-85
18. Su L-J, Zhang J-H, Gomez H, Murugan R, Hong X, Xu D. et al. Reactive Oxygen Species-Induced Lipid Peroxidation in Apoptosis, Autophagy, and Ferroptosis. Oxid Med Cell Longev. 2019;2019:5080843 -
19. Wang K, Zhang S, Marzolf B, Troisch P, Brightman A, Hu Z. et al. Circulating microRNAs, potential biomarkers for drug-induced liver injury. Proc Natl Acad Sci U S A. 2009;106:4402-7
20. Riobo NA, Manning DR. Receptors coupled to heterotrimeric G proteins of the G12 family. Trends Pharmacol Sci. 2005;26:146-54
21. Woolbright BL, Jaeschke H. Role of the inflammasome in acetaminophen-induced liver injury and acute liver failure. J Hepatol. 2017;66:836-48
22. Ramachandran A, Jaeschke H. Acetaminophen Hepatotoxicity. Semin Liver Dis. 2019;39:221-34
23. Jaeschke H, Duan L, Akakpo JY, Farhood A, Ramachandran A. The role of apoptosis in acetaminophen hepatotoxicity. Food Chem Toxicol. 2018;118:709-18
24. Dara L, Johnson H, Suda J, Win S, Gaarde W, Han D. et al. Receptor interacting protein kinase 1 mediates murine acetaminophen toxicity independent of the necrosome and not through necroptosis. Hepatology. 2015;62:1847-57
25. Yamada N, Karasawa T, Kimura H, Watanabe S, Komada T, Kamata R. et al. Ferroptosis driven by radical oxidation of n-6 polyunsaturated fatty acids mediates acetaminophen-induced acute liver failure. Cell Death Dis. 2020;11:144
26. Yang WS, Kim KJ, Gaschler MM, Patel M, Shchepinov MS, Stockwell BR. Peroxidation of polyunsaturated fatty acids by lipoxygenases drives ferroptosis. Proc Natl Acad Sci U S A. 2016;113:E4966-75
27. Zhang XJ, Cheng X, Yan ZZ, Fang J, Wang X, Wang W. et al. An ALOX12-12-HETE-GPR31 signaling axis is a key mediator of hepatic ischemia-reperfusion injury. Nat Med. 2018;24:73-83
28. Chu B, Kon N, Chen D, Li T, Liu T, Jiang L. et al. ALOX12 is required for p53-mediated tumour suppression through a distinct ferroptosis pathway. Nature Cell Biology. 2019;21:579-91
29. Jiang XP, Ai WB, Wan LY, Zhang YQ, Wu JF. The roles of microRNA families in hepatic fibrosis. Cell Biosci. 2017;7:34
30. Xin X, Wu M, Meng Q, Wang C, Lu Y, Yang Y. et al. Long noncoding RNA HULC accelerates liver cancer by inhibiting PTEN via autophagy cooperation to miR15a. Mol Cancer. 2018;17:94
31. Yang WS, SriRamaratnam R, Welsch ME, Shimada K, Skouta R, Viswanathan VS. et al. Regulation of ferroptotic cancer cell death by GPX4. Cell. 2014;156:317-31
32. Pan X, Lin Z, Jiang D, Yu Y, Yang D, Zhou H. et al. Erastin decreases radioresistance of NSCLC cells partially by inducing GPX4-mediated ferroptosis. Oncol Lett. 2019;17:3001-8
33. Kaplowitz N. Idiosyncratic drug hepatotoxicity. Nat Rev Drug Discov. 2005;4:489-99
34. Smilkstein MJ, Knapp GL, Kulig KW, Rumack BH. Efficacy of oral N-acetylcysteine in the treatment of acetaminophen overdose. Analysis of the national multicenter study (1976 to 1985). N Engl J Med. 1988;319:1557-62
35. Hahmann C, Schroeter T. Rho-kinase inhibitors as therapeutics: from pan inhibition to isoform selectivity. Cell Mol Life Sci. 2010;67:171-7
36. Bai Q, Yan H, Sheng Y, Jin Y, Shi L, Ji L. et al. Long-term acetaminophen treatment induced liver fibrosis in mice and the involvement of Egr-1. Toxicology. 2017;382:47-58
37. Kim KM, Han CY, Kim JY, Cho SS, Kim YS, Koo JH. et al. Gα(12) overexpression induced by miR-16 dysregulation contributes to liver fibrosis by promoting autophagy in hepatic stellate cells. J Hepatol. 2018;68:493-504
38. Racanelli V, Rehermann B. The liver as an immunological organ. Hepatology. 2006;43:S54-62
Author contact
![]() Corresponding author: Prof Sang Geon Kim, Ph.D., College of Pharmacy and Integrated Research Institute for Drug Development, Dongguk University-Seoul, Goyang-si, Kyeonggi-do 10326, Republic of Korea. E-mail: sgkimedu; Tel: +8231-961-5218; Fax: +8231-961-5206.
Corresponding author: Prof Sang Geon Kim, Ph.D., College of Pharmacy and Integrated Research Institute for Drug Development, Dongguk University-Seoul, Goyang-si, Kyeonggi-do 10326, Republic of Korea. E-mail: sgkimedu; Tel: +8231-961-5218; Fax: +8231-961-5206.