Impact Factor
- Issue 14; 2026
- Issue 13; 2026
- Issue 12; 2026
- Issue 11; 2026
- Issue 10; 2026
- Volume 16; 2026
- Advance Articles
- Past Issues
- Cover Images
- Cover Suggestion
- Index & Coverage
- Special Issues
Introduction
Results
Discussion
Methods
Abbreviations
Supplementary Material
Acknowledgements
References
International Journal of Biological Sciences
International Journal of Medical Sciences
 Global reach, higher impact

Theranostics 2022; 12(2):639-656. doi:10.7150/thno.65773 This issue Cite
Research Paper
Antigen presentation and interferon signatures in B cells driven by localized ablative cancer immunotherapy correlate with extended survival
Kaili Liu1, Ashley R. Hoover1,2, Jason R. Krawic3, Christa I. DeVette3, Xiao-Hong Sun2, William H. Hildebrand3, Mark L. Lang3, Robert C. Axtell2,3, Wei R. Chen1 ![]()
1. Stephenson School of Biomedical Engineering, University of Oklahoma, Norman, OK, USA.
2. Arthritis and Clinical Immunology Research Program, Oklahoma Medical Research Foundation, Oklahoma City, OK, USA.
3. Department of Microbiology and Immunology, University of Oklahoma Health Sciences Center, Oklahoma City, OK, USA.
Received 2021-8-6; Accepted 2021-11-11; Published 2022-1-1
Abstract

Rationale: B cells have emerged as key regulators in protective cancer immunity. However, the activation pathways induced in B cells during effective immunotherapy are not well understood.
Methods: We used a novel localized ablative immunotherapy (LAIT), combining photothermal therapy (PTT) with intra-tumor delivery of the immunostimulant N-dihydrogalactochitosan (GC), to treat mice bearing mouse mammary tumor virus-polyoma middle tumor-antigen (MMTV-PyMT). We used single-cell RNA sequencing to compare the transcriptional changes induced by PTT, GC and PTT+GC in B cells within the tumor microenvironment (TME).
Results: LAIT significantly increased survival in the tumor-bearing mice, compared to the treatment by PTT and GC alone. We found that PTT, GC and PTT+GC increased the proportion of tumor-infiltrating B cells and induced gene expression signatures associated with B cell activation. Both GC and PTT+GC elevated gene expression associated with antigen presentation, whereas GC elevated transcripts that regulate B cell activation and GTPase function and PTT+GC induced interferon response genes. Trajectory analysis, where B cells were organized according to pseudotime progression, revealed that both GC and PTT+GC induced the differentiation of B cells from a resting state towards an effector phenotype. The analyses confirmed upregulated interferon signatures in the differentiated tumor-infiltrating B cells following treatment by PTT+GC but not by GC. We also observed that breast cancer patients had significantly longer survival time if they had elevated expression of genes in B cells that were induced by PTT+GC therapy in the mouse tumors.
Conclusion: Our findings show that the combination of local ablation and local application of immunostimulant initiates the activation of interferon signatures and antigen-presentation in B cells which is associated with positive clinical outcomes for breast cancer. These findings broaden our understanding of LAIT's regulatory roles in remodeling TME and shed light on the potentials of B cell activation in clinical applications.
Keywords: Single-cell RNA sequencing, B cell activation, localized ablative immunotherapy, N-dihydrogalactochitosan, breast cancer
Introduction
A major challenge in cancer treatment is the failure of the host to detect and destroy tumor cells [1, 2]. Breast cancer is a major worldwide health burden coupled with growing prevalence of malignancy-related mortality [3, 4]. Its progression involves complicated biologic processes, which are not only controlled by genetic abnormalities but also by the interactions within the tumor microenvironment (TME) including the immune cells, extracellular matrix, surrounding blood vessels and stromal cells [5]. Although tumor-infiltrating lymphocytes (TILs), as an important component of immune cells in the breast cancer niche, have been widely studied [6], there is still no broadly effective therapy for breast cancer [7, 8].
A localized ablative immunotherapy (LAIT) was developed based on the strategy of combining local photothermal therapy (PTT) with intra-tumor delivery of an immunostimulant [9]. Targeting primary tumors with LAIT may represent a viable solution for metastatic cancers due to its capacity to induce systemic, long-term antitumor immunity [9]. The LAIT combination therapy serves two major purposes. PTT disrupts target tumor homeostasis and releases tumor antigens [10, 11] while the immunostimulant enhances pro-inflammatory responses in the presence of released tumor antigens [12-15]. In preliminary clinical studies of patients with metastatic, treatment-recalcitrant breast cancer and melanoma, LAIT successfully reduced and, in many cases, eliminated the treated primary tumors and untreated metastases in the lungs [16-18]. The promising outcomes observed in our clinical studies prompted us to determine the underlying mechanism by which LAIT achieves effective antitumor immunity.
T and B cells play important roles in the local environment of solid tumors. While T cells have been widely investigated and therapeutically targeted for cancer treatment [6], the functions of B cells in cancer therapy have not been sufficiently evaluated. Tumor-infiltrating B cells (TIBs) are an important component of adaptive immunity and participate in both humoral and cellular immunity with diverse functions. TIBs have been reported to play both immunopotentiating and immunosuppressing roles in breast cancer [19, 20]. The subtypes and mechanisms of B cells in the TME of breast cancer and how they interact with tumor cells and other stromal cell types remain largely unknown. Therefore, a comprehensive characterization of the immunological landscape of breast cancer, including the composition and roles of B lymphocytes, is essential for understanding immune mechanisms, identifying novel biomarkers and designing therapeutic strategies.
In this study, we treated murine breast tumors with LAIT, in which PTT was achieved by laser and N-dihydrogalactochitosan (GC) was used as the immunostimulant. We investigated the responses of TIBs in PTT, GC and PTT+GC treated mouse mammary tumor virus-polyoma middle tumor-antigen (MMTV-PyMT) tumors. PTT+GC significantly extended the survival of tumor-bearing animals. Using single-cell RNA sequencing (scRNA-seq), we performed clustering analyses to identify B cell subtypes in tumors after different treatments. We also identified differential gene expression (DGE) patterns by comparing individual treatment groups with untreated controls using gene functional enrichment methods. We observed that PTT, GC and PTT+GC enhanced the proportion of TIBs and stimulated gene expression signatures related to B cell activation. Both GC and PTT+GC elevated gene expression associated with antigen presentation, whereas GC elevated transcripts that regulate B cell activation and GTPase function and PTT+GC induced interferon response genes. Trajectory inference revealed that both GC and PTT+GC induced the differentiation of B cells from a resting state toward an effector phenotype along the pseudotime progression. The analyses also confirmed upregulation of interferon signatures in tumors treated by PTT+GC but not by GC in the differentiated B cells. Moreover, we discovered that breast cancer patients had significantly extended overall survival if they had elevated expression of genes that were induced by PTT+GC therapy in the mouse tumors. Our findings show that LAIT initiates the activation of interferon signatures and antigen-presentation in B cells which is positively associated with favorable clinical outcomes for breast cancer.
Results
PTT+GC therapy extends the survival of mice bearing MMTV-PyMT breast tumors and increases the proportion of tumor-infiltrating B cells
The therapeutic effects of LAIT (PTT+GC in this study) on breast tumors were determined using the MMTV-PyMT transgenic tumor model. Spontaneous MMTV-PyMT tumor cells were isolated from MMTV-PyMT transgenic mice as previously described [21] and were injected into the mammary fat pad of wild type female FVB mice (Figure S1A). When tumors reached a volume of ~0.5 cm3, mice were separated into four treatment groups: Untreated controls (CTRL), PTT alone, GC alone, and PTT+GC. Treated animals were monitored for up to 60 days following treatment and euthanized when tumors reached ethical endpoints. PTT+GC significantly reduced tumor growth and increased the survival time compared to other groups, whereas PTT or GC alone had no statistically significant effect on changes of tumor size (Figure 1A) or survival (Figure 1B) compared with CTRL.
Analysis of tumor-infiltrating B cells in different treatment groups (Control, PTT only, GC only, and PTT+GC). (A) Individual and mean tumor size of mice following different treatments. Days after treatment up to 60 were selected for measuring the tumor volume. (B) Survival rates of tumor-bearing mice in different treatment groups. Log-rank (Mantel-Cox) test was used for statistical analysis. Days after treatment up to 60 were selected for measuring the mice survival. (C) Pie chart showing the proportions of different immune cell types in MMTV-PyMT tumors (combining all groups). B cells, consisting of 12% of total immune cells, were analyzed in this study. Mac: macrophages; NK: natural killer cells; Mono: monocytes; DC: dendritic cells; Gran: granulocytes. (D) Two-dimensional visualization of single-cell clusters using method of t-distributed Stochastic Neighbor Embedding (t-SNE) for B cells from all treatment groups. B cells were classified into naïve B and memory B cells. (E) Feature plots (t-SNE) showing expressions of major genes that identify tumor-infiltrating B cells, including Cd19, Ms4a1, Ighd, Ighm, Cd27, and Il2ra. (F) t-SNE plots of B cells in different treatment groups (CTRL, PTT, GC, and PTT+GC). (G) Number of naïve and memory B cells in each treatment group. (H) Proportion of naïve and memory B cells among all immune cells in each treatment group, in comparison with CTRL group (**: p<0.01). The number of B cells in each treatment group was divided by the number of all tumor-infiltrating CD45+ immune cells in the same treatment group.
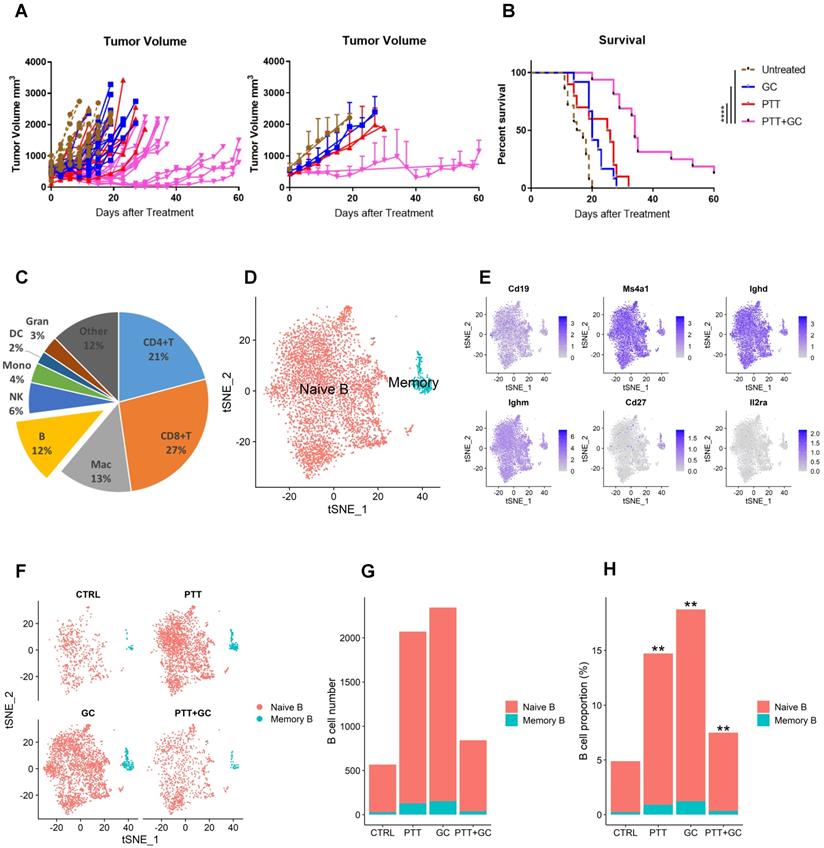
As shown in Figure 1A, the tumor size in the group of PTT+GC experienced statistically significant reduction when compared with CTRL at day 10. Day 10 was also a time point when untreated tumor-bearing mice in CTRL group started to die as time proceeds. The mice survival status differences among different group allowed us to infer that, at day 10, the immunologically cellular and molecular responses have affected the tumor size and animal survival. To assess changes in numbers and gene expression profiles in TIBs, we collected tumors 10 days after treatment. Cells were prepared as described in methods section and subjected to scRNA-seq analysis, following the workflow depicted in Figure S1B. After obtaining 49,380 CD45+ immune cells (11,584 in CTRL; 14,071 in PTT; 12,501 in GC; 11,224 in PTT+GC) and annotating these immune cell subtypes, we calculated the proportions of CD4+ T cells, CD8+ T cells, macrophages, B cells, natural killer (NK) cells, monocytes, dendritic cells, and granulocytes (Figure 1C). B cells accounted for 12% of all CD45+ tumor-infiltrating cells (Figure 1C). To further investigate the effect of different treatments on B cell composition and function, we conducted the clustering analysis for B cell lineage using Seurat R package [22]. B cells were classified into two major subtypes, naïve B cell and memory B cell (Figure 1D), based on the expression of genes encoding B cell subtype markers, such as Cd19, Ms4a1 (CD20), Ighd, Ighm, memory cell marker Cd27, and the activation cell marker Il2ra (CD25) (Figure 1E). Most of the cells expressed naïve B cell markers Cd19, Ms4a1 (CD20), Ighd, and Ighm, with only a small number of cells expressing Cd27 and little to no Il2ra expression (Figure 1E). Therefore, we obtained 5477 naïve B cells (540, 1943, 2190, and 804 for CTRL, PTT, GC, and PTT+GC, respectively) and 342 memory B cells (26, 127, 152, and 37 for CTRL, PTT, GC, and PTT+GC, respectively), as shown in Figure 1F. This result showed that the naïve B cell proportions were 4.7%, 13.8%, 17.5% and 7.2% while the memory B cell proportions were 0.2%, 0.9%, 1.2% and 0.3% for the treatments of CTRL, PTT, GC and PTT+GC, respectively (Figure 1G). Furthermore, PTT, GC and PTT+GC treatments all significantly (p < 0.01) increased the proportion of B cells within CD45+ cells compared with untreated CTRL (Figure 1H), suggesting that single and combination of treatment modality may influence the infiltrating B cell frequencies and transcriptome dynamics in TME.
Differential gene expression and functional enrichment analysis of tumor-infiltrating B cells
ScRNA-seq technology not only dissects the cell heterogeneity but also captures the transcriptome of individual cells, expanding the broadness of researches in cell lineage, development, physiology, pathology and therapy [23-27]. To explore the effect of each treatment on the functions of TIBs at the transcriptional level, we carried out differential gene expression and functional enrichment analysis. Three comparisons were made: PTT vs CTRL, GC vs CTRL, and PTT+GC vs CTRL. For each comparison, differentially expressed genes (DEGs) were generated by using FindMarkers function in Seurat R package [22]. DEGs from comparing two treatment groups were defined as log Fold change > 0.25 or < -0.25 along with adjusted p value < 0.05, shown as red and blue dots in the volcano plots (Figure 2A-C). Functional enrichment analyses were performed using both over-representation analysis (ORA) [28] and gene set enrichment analysis (GSEA) [29]. The clusterProfiler R package [30] was used to perform functional enrichment analysis for pseudotime-dependent genes by using ORA method and databases of Gene Ontology (GO) [31], Kyoto Encyclopedia of Genes and Genomes (KEGG) [32], Reactome Pathway Database (Reactome) [33] and Molecular Signatures Database (MsigDB) [34].
Differential gene expression and pathway enrichment analysis for tumor-infiltrating B cells. (A) Volcano plot showing differential gene expression comparing PTT with CTRL (PTT vs CTRL). Top 10 upregulated and downregulated genes are labeled. (B) Volcano plot showing differential gene expression comparing GC with CTRL. (C) Volcano plot showing differential gene expression comparing PTT+GC with CTRL. (D) Dot plot showing biological process (BP) of gene ontology (GO) analysis using over-representation analysis (ORA) method for both upregulated (up) and downregulated (down) genes for PTT vs CTRL, GC vs CTRL, and PTT+GC vs CTRL. (E) Network plot showing gene set enrichment analysis (GSEA) for DEGs from PTT vs CTRL using MsigDB hallmark gene sets. (F) Network plot showing the GSEA for DEGs from GC vs CTRL. (G) Network plot showing the GSEA for DEGs from PTT+GC vs CTRL.
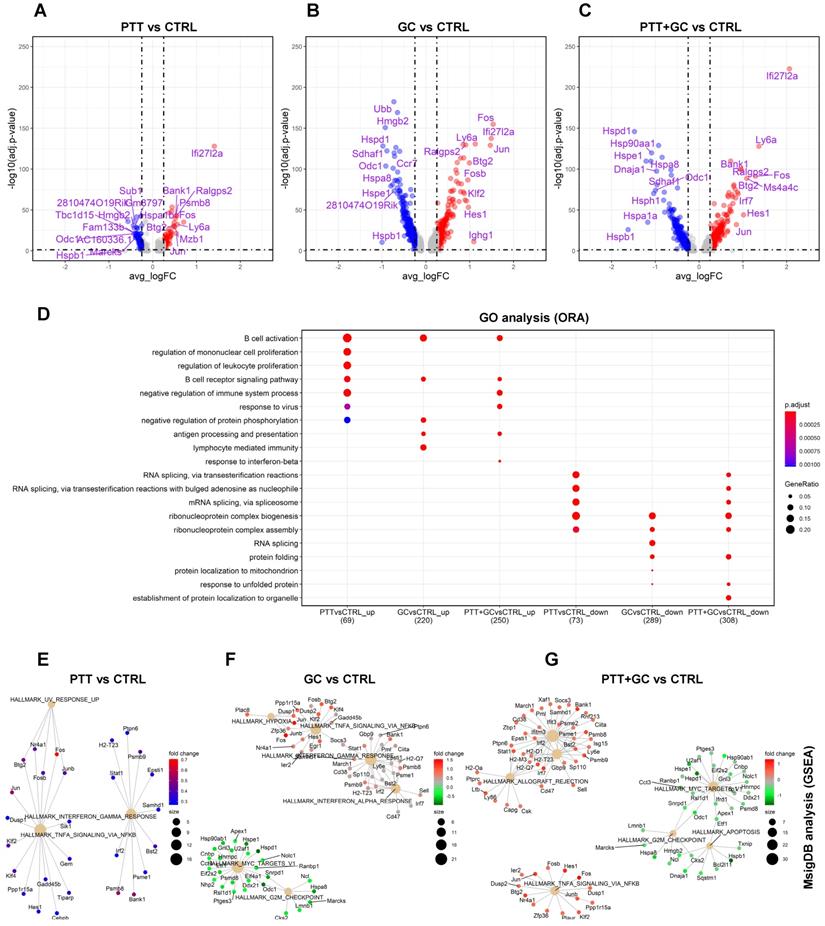
For PTT vs CTRL, 73 upregulated and 81 downregulated genes were shown in the volcano plot (Figure 2A). Biological process (BP) of gene ontology (GO) analysis using the ORA method demonstrated that PTT enriched B cell activation and B cell receptor (BCR) signaling pathways compared to CTRL (Figure 2D). This result was confirmed by KEGG analyses (Figure S2A) and Reactome analyses (Figure S2B). In contrast, PTT downregulated genes involved in RNA splicing and ribonucleoprotein complex biogenesis which likely affect protein translation (Figure 2D). KEGG and Reactome enrichment analyses gave similar results (Figure S2A-B).
GC stimulation upregulated 233 genes and downregulated 308 genes compared to CTRL (Figure 2B). GO analysis revealed that GC upregulated genes were involved in B cell activation, BCR signaling pathway, negative regulation of protein phosphorylation, antigen processing and presentation, and lymphocyte mediated immunity (Figure 2D, Figure S2A-B). Similar results were also obtained by using KEGG and Reactome analyses, including increases in expression of genes associated with the BCR signaling pathway and antigen processing and presentation (Figure S2A-B). Conversely, GC also downregulated genes involved in ribonucleoprotein complex biogenesis, RNA splicing, and protein folding (Figure 2D, Figure S2A-B).
When comparing PTT+GC vs CTRL, we observed 264 upregulated and 327 downregulated genes (Figure 2C). PTT+GC induced transcription of genes involved in B cell activation, BCR signaling, response to virus, antigen processing and presentation, and response to interferon beta (Figure 2D, Figure S2A-B). PTT+GC also downregulated genes involved in RNA splicing, ribonucleoprotein complex biogenesis, and protein folding (Figure 2D, Figure S2A-B).
The ORA analysis revealed that PTT, GC and PTT+GC initiated overlapping gene expression signatures (Figure 2D), although the numbers and fold changes of DEGs were not identical (Figure 2A-C). To further explore gene expression differences induced by these treatments, we used hallmark gene sets of MsigDB and conducted GSEA to visualize gene-pathway networks (Figure 2E-G). As shown in Figure 2E, PTT elevated IFNγ and TNFα signaling pathways. GC enriched IFNγ and TNFα signaling whilst downregulating Myc targets pathway (Figure 2F). PTT+GC upregulated IFNγ signaling, TNFα signaling, and uniquely enriched IFNα signaling. Like GC, PTT+GC also downregulated Myc targets and G2M checkpoint signaling (Figure 2G). These analyses showed that PTT, GC and PTT+GC had overlapping pathways including the IFNγ and TNFα responses. However, GC and PTT+GC enriched pathways had more associated genes than those enriched by PTT alone.
In addition to the MsigDb collection, the KEGG and Reactome pathway databases were used in GSEA. For PTT vs CTRL, no gene set enrichment was found, likely due to the small number of DEGs between the two groups. GC stimulation upregulated pathways involved BCR (Figure S2C) and IFNα signaling (Figure S2E) and downregulated spliceosome (Figure S2C) and mRNA splicing (Figure S2E) pathways. PTT+GC synergized to upregulate antigen processing and presentation pathways (Figure S2D) and IFNαβ signaling (Figure S2F), and downregulated spliceosome (Figure S2D) and heat shock protein composed pathways (Figure S2F). Taken together, both ORA and GSEA achieved consistent enrichment results (Figure 2D-G, S2A-F). It also demonstrated that treatments of PTT, GC, and PTT+GC had overlapping and nonoverlapping functions on B cells. This was further elucidated by the degrees of B cell activation from individual treatments to the combined PTT+GC treatment (Figure 2E-G, S2C-F). These results provide evidence that PTT+GC has a greater impact on activating B cell gene signatures and potential antitumor related functions than PTT or GC alone.
Overlapping of treatment-upregulated genes in TIB cells
We hypothesized that understanding the relationships among the treatment-regulated DEGs would shed light on the molecular mechanism stimulated by PTT+GC therapy. To determine B cell gene expression signatures associated with PTT+GC-enhanced survival of tumor-bearing mice, we investigated the relationship of treatment-regulated DEGs and focused on the PTT+GC-specific DEGs in TIBs. A Venn diagram was used to display the overlap of PTT, GC, PTT+GC regulated genes (Figure 3A). Genes uniquely regulated by PTT alone were confined in Set0. PTT-GC-(PTT+GC) intersecting genes were confined in Set1; GC-(PTT+GC) intersecting genes (excluding Set1) were confined in Set2. Genes uniquely regulated by GC alone were grouped in Set3. Similarly, Set0, Set3 and Set4 were defined as specific upregulation by PTT, GC and PTT+GC, respectively.
Overlapping of treatment-upregulated genes. (A) Venn diagram showing upregulated genes from comparisons of PTT vs CTRL, GC vs CTRL, and PTT+GC vs CTRL. Five gene sets, from Set_0 to Set_4, are labeled. (B) Dot plot for BP of GO analysis of genes in Set_1 to Set_4. (C) Circular heatmap showing the expression of genes from upregulated set 1 (Set_1) in each treatment group. Heatmap columns for groups of CTRL, PTT, GC and PTT+GC were arranged from outside to inside. Higher expression was colored in red while lower in blue. (D) Circular heatmap showing the expression of genes from upregulated set 2 (Set_2) in each treatment group. (E) Circular heatmap showing the expression of genes from upregulated set 3 (Set_3) in each treatment group. (F) Circular heatmap showing the expression of genes from upregulated set 4 (Set_4) in each treatment group. (G) Violin plot showing relative gene signature scores from Set_1 in each treatment group. (H) Violin plot showing relative gene signature scores from Set_2 in each treatment group. (I) Violin plot showing relative gene signature scores from Set_3 in each treatment group. (J) Violin plot showing relative gene signature scores from Set_4 in each treatment group.
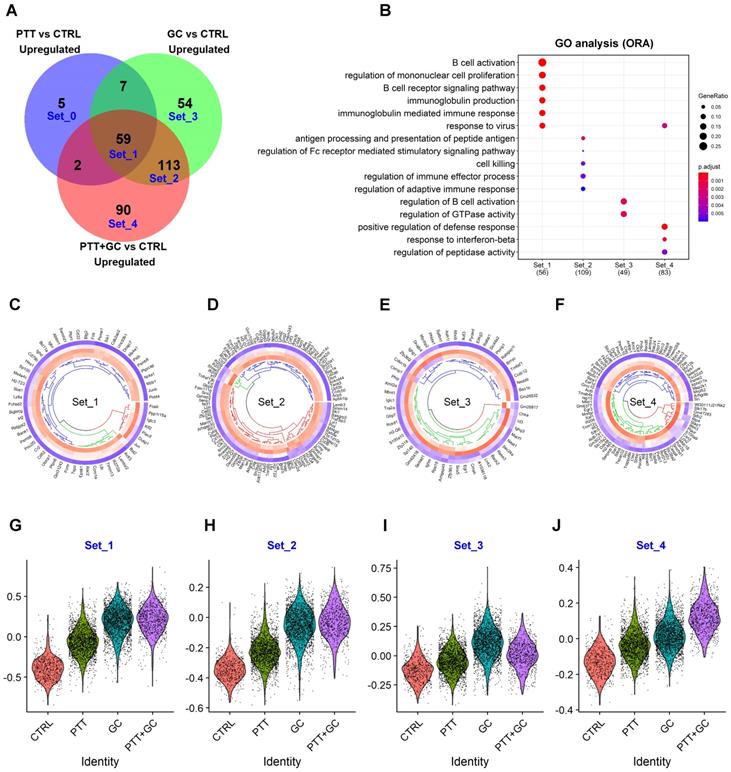
Collectively, 59 genes of Set1 were upregulated among PTT, GC, and PTT+GC (Figure 3A). Individually, PTT, GC and PTT+GC specifically upregulated 5 (Set0), 54 (Set3) and 90 (Set4) genes, respectively (Figure 3A). GO analysis for the individual gene sets were shown in Figure 3B. Biological processes (BP), such as B cell activation, BCR signaling, and response to virus were enriched in gene Set1 which were common to all 3 treatments (Figure 3B). Antigen processing and presentation of peptide antigens, cell killing, and regulation of immune effector processes were enriched in Set2, only shared by GC and PTT+GC (Figure 3B). Of note, Set2 contains more genes associated with class II antigen presentation machinery than Set1, suggesting that the difference between GC and PTT is that GC can activate more antigen-presenting processing genes than PTT. GC alone (Set3) specifically enriched pathways regulating B cell activation and GTPase activity (Figure 3B). PTT+GC-specific (Set4) pathways were enriched for positive regulation of the defense response and response to IFNβ (Figure 3B).
To confirm the above enrichment analysis for different gene sets, MsigDB, KEGG, and Reactome analyses were used. Similar enrichments were found (Figure S3A-C) compared with GO analysis (Figure 3B). For example, PTT+GC-specific genes (Set4) were involved with IFNγ and IFNα responsiveness (Figure S3A) and antigen processing and presentation (Figure S3B).
Although enrichments from genes in Set1 to Set4 share B cell activation related pathways, we hypothesized that their capacities for activating B cells were different for each treatment. To test this hypothesis, we compared the expression levels of each component of these confined gene sets in different treatment groups using circular heatmap. Set0 was not used for analysis likely due to the small number of genes. Even though Set1 genes were common to all treatment groups, genes with the highest level of expression were largely found in the PTT+GC group (Figure 3C). This was also observed in gene Set2 (shared by GC and PTT+GC) for selected genes (Figure 3D), again indicating that PTT+GC has a greater capacity for activating B cells than GC alone. Consistent with the pattern established in Set1 and Set2, Set4 genes showed the highest expression on B cells in the PTT+GC treated tumors (Figure 3F). In GC-specific upregulated gene Set3, GC treatment showed the highest promotion (Figure 3E).
Instead of showing the individual expression of genes from Set1 to Set4 in each treatment, we next used AddModuleScore function from Seurat R package [22] to calculate the average expression level of these upregulated gene sets. These expression scores for each treatment were displayed using violin plots with each dot representing a score of an individual cell (Figure 3G-J). The expression scores in gene Set1 (Figure 3G) and Set2 (Figure 3H) for GC and PTT+GC treatments were higher than that in CTRL and PTT, indicating that (1) Both PTT and GC upregulated B cell activation signatures compared with CTRL; (2) GC mainly promoted the degree of B cell activation signatures in Set1 when combining with PTT. GC has the highest B cell activation degree in Set3 (Figure 3I) because this gene set is GC-specifically upregulated. Consistently, PTT+GC has the highest B cell activation degree in Set4 because this gene set is PTT+GC-specifically upregulated (Figure 3J), also indicating that PTT and GC can synergize to promote the expression of gene signatures in Set4. This result is consistent with that of the gene expression dot plots (Figure 3C-F) and consistent with the hypothesis that although genes in Set1, 2, and 4 were all enriched in B cell activation related pathways, PTT+GC resulted in higher degrees of B cell activation than GC or PTT alone.
We further dissected the PTT+GC-specific upregulated genes by displaying several representative genes based on previous enrichment analysis and literature searches. We compared the gene expression among B cells after different treatments using dot plots (Figure S3D). It is worth noting that only PTT+GC vs CTRL, but not PTT vs CTRL or GC vs CTRL, resulted in significant expression changes in the indicated genes (adjusted p value < 0.05). We observed that PTT+GC-specific upregulated genes included Toll-like receptor cascades (Figure S3D). Among these genes, PTT+GC-specifically upregulated Btk and Ctss, which are not only involved in TLR signaling cascades, but also participate in antigen presentation. Additionally, PTT+GC-specific upregulated genes also included interferon signaling genes, such as Ifit3, Ifitm3, Isg15, Xaf1, Ddx58, Nedd8, Rnf213, Tmsb4x, Trim12c (Figure S3D). We also observed that PTT+GC upregulated cell survival genes, such as Dynll1, Eef1d, Tnfaip8, Pecam1, and favorable clinical prognosis genes, such as Bin1, Erp29, Serpinb1a (Figure S3D). The functions of these genes are listed in Table S1.
Overlapping of treatment-downregulated genes in TIB cells
We next investigated the relationship of treatment-downregulated DEGs and focused on the PTT+GC-specific negative regulation on these genes in TIBs. A Venn diagram was used to illustrate the overlap of PTT, GC, and PTT+GC downregulated genes (Figure 4A). Genes intersected with different treatments were grouped similarly to Figure 3A: Set0 was for PTT-specific genes; Set1 for PTT-GC-(PTT+GC) intersecting genes; Set2 for GC-(PTT+GC) intersected genes (Set1 not included), Set3 for GC-specific genes, and Set4 for PTT+GC-specific genes (Figure 4A).
Overlapping of treatment-downregulated genes. (A) Venn diagram showing downregulated genes from comparisons of PTT vs CTRL, GC vs CTRL and PTT+GC vs CTRL. Five gene sets, from Set_0 to Set_4, were labeled. (B) Dot plot for BP of GO analysis of genes in Set_1 to Set_4. (C) Circular heatmap showing the expression of genes from downregulated set 1 (Set_1) in each treatment group. Heatmap columns for groups of CTRL, PTT, GC and PTT+GC were arranged from outside to inside. Higher expression was colored in red while lower in blue. (D) Circular heatmap showing the expression of genes from downregulated set 2 (Set_2) in each treatment group. (E) Circular heatmap showing the expression of genes from downregulated set 3 (Set_3) in each treatment group. (F) Circular heatmap showing the expression of genes from downregulated set 4 (Set_4) in each treatment group. (G) Violin plot showing relative gene signature scores from Set_1 in each treatment group. (H) Violin plot showing relative gene signature scores from Set_2 in each treatment group. (I) Violin plot showing relative gene signature scores from Set_3 in each treatment group. (J) Violin plot showing relative gene signature scores from Set_4 in each treatment group.
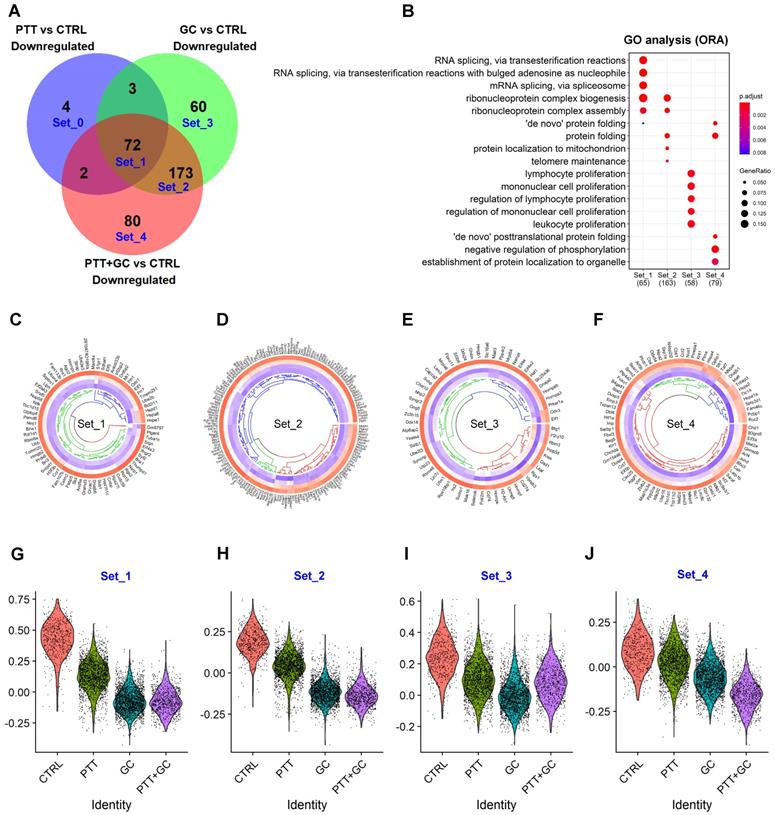
Collectively, for Set1, PTT, GC and PTT+GC commonly downregulated 72 genes (Figure 4A). GC and PTT+GC (Set2) co-downregulated 173 genes, while individually, PTT downregulated 4 genes (Set0), GC downregulated 60 genes (Set3), and PTT+GC downregulated 80 genes (Figure 4A). GO analysis of genes from the different sets was shown in Figure 4B. RNA splicing and ribonucleoprotein complex biogenesis and assembly pathways were enriched in Set1. Set2 was also enriched in genes involved in ribonucleoprotein complex biogenesis and assembly (Figure 4B) but with a greater number of genes involved in these pathways. GC specifically enriched for genes involved in the regulation of lymphocyte and mononuclear cell proliferation, while PTT+GC-specific genes were involved in protein folding, negative regulation of phosphorylation, and protein localization to organelles (Figure 4B). The results in Figure 4A-B demonstrate that PTT, GC and PTT+GC treatments shared some overlapping gene regulation, like what was observed for the upregulated genes in Figure 3. Using MsigDB (Figure S4A), KEGG (Figure S4B) and Reactome (Figure S4C) databases revealed similar findings.
Although RNA splicing and protein folding related pathways were shared among genes in Set1 and Set4, we assume their capacities for negatively regulating activated B cells were different in and unique to each treatment. To test this assumption, we compared the expression levels of these confined gene sets in different treatment groups using circular heatmap analysis. Set0 was not used for analysis likely due to the small number of genes. Gene expression pattern showed an increasing inhibition from CTRL to PTT, GC and PTT+GC in Set 1, 2 and 4, suggesting the unique and combinatory effect of each treatment in regulating these gene expression profiles (Figure 4C, 4D, 4F). In Set3, GC showed the highest inhibition due to these genes were GC-specific downregulated genes (Figure 4E).
Next, we calculated the average expression level of these downregulated genes from Set1 to Set4 in each treatment (Figure 4G-J). The expression scores for gene Set1 (Figure 4G) and Set2 (Figure 4H) were lower in GC and PTT+GC than that in CTRL and PTT, indicating that the degree of RNA splicing and potential negative regulation on B cell activations from Set1 and Set2 genes were predominantly inhibited by GC. GC showed the lowest downregulation on expression score in Set3 (Figure 4I) while PTT+GC exhibited the lowest score in Set4 (Figure 4J).
To further investigate the synergy between PTT and GC in terms of gene downregulation, we compared B cell gene expression among the four treatments using dot plots (Figure S4D). We found that selected PTT+GC-specific downregulated genes were involved in negative regulation of antigen-presenting, restriction of IFN production, cell death, and unfavorable clinical prognosis (Figure S4D). PTT+GC synergistically repressed genes, including Aggf1, Calr, Cct2, Cct7, Chd1, Eif5b, Pmepa1, Rcc2, Serbp1, Skp1a, Slc9a3r1, and Vim (Table S1), have been reported to be associated with unfavorable clinical prognosis, suggesting that PTT+GC may attenuate poor clinical prognosis and outcome.
Single-cell trajectory analysis of TIBs reveals pseudotime progression driven by GC treatment
To further explore the treatment effects on TIB cell composition and function, we performed single-cell trajectory inference using Monocle2 [35]. The single-cell trajectory for TIBs was constructed with 7 states (branches) along with a progressing pseudotime (Figure 5A). CTRL and PTT-treated tumors contained more B cells than GC and PTT+GC in state 1 while GC- and PTT+GC-treated tumors contained more B cells in state 4 and state 5 than CTRL and PTT (Figure 5B). The pseudotime for the B cell trajectory progressed from state 1 (the root branch on the top) to state 4 and 5 (the terminal branches at the bottom), showing a clear transition of cell states from beginning state 1 to the ending states 4 and 5 induced by GC and PTT+GC (Figure 5B). Therefore, we established a connection between the pseudotime progression of B cells and the effect of GC treatment.
Identification of GC/PTT+GC driven cell states, transcriptional signatures, and functional enrichment, by single-cell trajectory inference. (A) Cell states following pseudotime in B cell trajectory. Pseudotime progresses from state 1 to states 2/7 to states 3/6 and finally to states 4/5. (B) Cell states in B cell trajectory for different treatment groups. Blue circles showed state 1 and red circles showed states 4 and 5. (C) Three-dimensional column plot showing distribution of cells in different states for each treatment group. Horizontal axis represents pseudotime progression. In CTRL and PTT groups, there is a decreasing pattern of cell state proportions, while in GC and PTT+GC groups there is an increasing pattern of cell state proportions. (D) Heatmap showing expression of genes along the pseudotime progression from left (state 1) to right (states 4/5). Genes were classified into 3 clusters according to their expression dynamics. Genes with expression patterns of “Terminal” (red), “Transitional” (black) and “Initial” (blue) are labeled. (E) Dot plot of the GO analysis using ORA method for genes with patterns of “Terminal”, “Transitional” and “Initial” along pseudotime progression. (F) Dot plot of the KEGG analysis using ORA method for genes with patterns of “Terminal”, “Transitional” and “Initial” along pseudotime progression. (G) Dot plot of Reactome analysis using ORA method for genes with patterns “Terminal”, “Transitional” and “Initial” along pseudotime progression. Only enrichment for “Initial” pattern was obtained. (H) Violin plot showing gene signature scores for “Terminal” genes in each treatment group. (I) Violin plot showing gene signature scores for “Transitional” genes in each treatment group. (J) Violin plot showing gene signature scores for “Initial” genes in each treatment group.
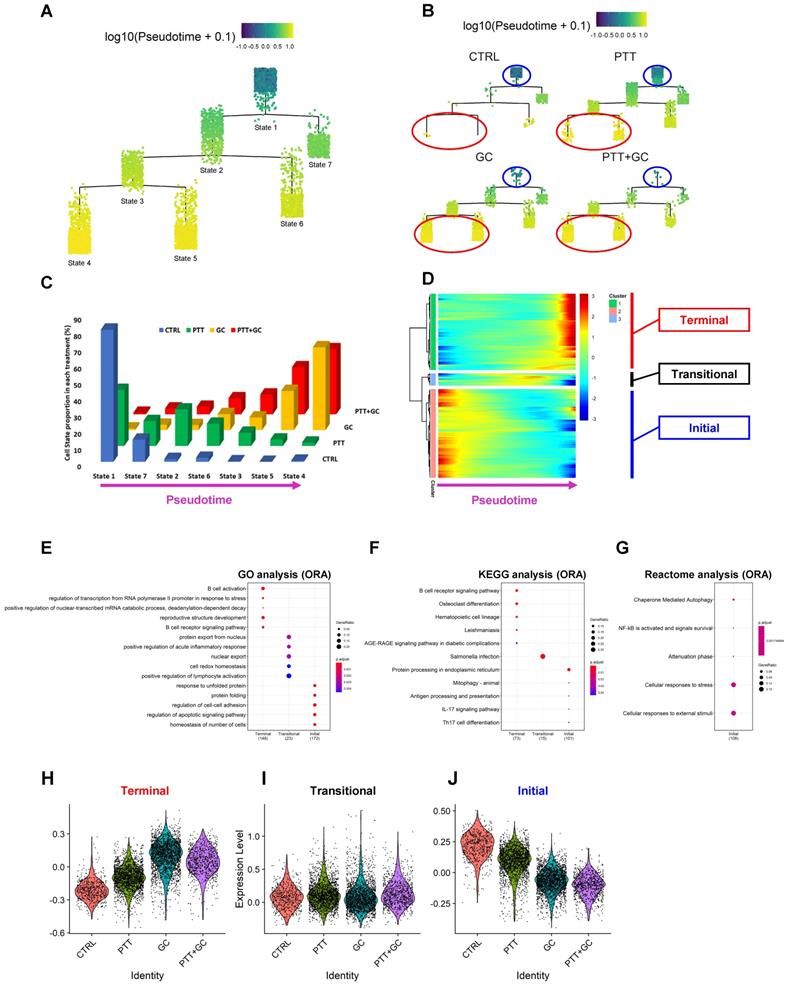
Next, we calculated B cell proportions for each state under different treatments. In CTRL group, 81% (459 out of 566) of B cells were assigned to state1 (Figure 5C). Along the pseudotime progression (state 1 to states 7/2 to states 6/3 and to states 5/4), the CTRL B cell proportion decreases significantly (Figure 5C). In the PTT group, most of the cells were with state 1, state 7 and state 2, corresponding with a cell proportion of 34%, 15% and 22%, respectively. The cell proportion in PTT showed a decreasing pattern along pseudotime progression, which was similar to that of CTRL but with a smoother degree of decline compared to CTRL. Interestingly, the opposite trend was observed for GC and PTT+GC treatments with the majority of TIBs residing in state 4 and 5 (Figure 5C). For example, the cell proportion with state 4 and state 5 in GC and PTT+GC groups reached 75% and 69%, respectively. These results clearly showed that GC and/or PTT+GC strongly switched the cell states when compared with CTRL and PTT (Figure 5A-C).
We hypothesized that gene dynamics along the trajectory would reflect GC and/or PTT+GC's regulatory mechanism on B cell properties. To test this hypothesis, we used Monocle2 R package [35] to analyze the pseudotime-dependent genes in TIBs. Modules of genes that co-vary along pseudotime were visualized in the heatmap (Figure 5D). These genes, along the pseudotime, exhibited 3 expression patterns (Figure 5D): (1) the genes in red on the right side of the heatmap exhibited a progressively increased gene expression pattern (“Terminal”), ending in states 4 and 5; (2) the genes in red on the left side of the heatmap were enriched in state 1 and progressively-decreased (“Initial”); and (3) genes with yellow color in the middle of the heatmap showed a transitional expression pattern (“Transitional”).
To explore the function of these pseudotime-dependent genes, these 3 patterns of gene sets were extracted for functional enrichment analysis. GO and KEGG enrichment analyses using ORA method for the genes upregulated late in pseudotime were enriched in B cell activation and B cell receptor signaling pathways (Figure 5E-F). Conversely, the downregulated genes were enriched in protein folding, regulation of cell-cell adhesion, protein processing in ER, and mitophagy pathways (Figure 5E-G). For “Transitional” genes, enrichment results included protein export from nucleus, and positive regulation of acute inflammation by GO analysis (Figure 5E) and Salmonella infection by KEGG analysis (Figure 5F). It is worth noting that KEGG analysis (Figure 5F) for downregulated genes includes “antigen processing and presentation”, in which only HSP gene transcripts were found. These results demonstrated that B cell activation gene signature progresses along pseudotime and correlates with the transition of cell states caused by GC and/or PTT+GC. This analysis demonstrates the ability of GC and/or PTT+GC in switching TIBs from an inactivated state to an activated phenotype.
Furthermore, we calculated the expression scores for these “Terminal”, “Transitional”, “Initial” pseudotime-dependent gene sets. In “Terminal” gene set, expression scores in GC and PTT+GC were higher than that in CTRL and PTT (Figure 5H). In “Initial” module, an opposite trend was observed (Figure 5J). However, there was no apparent change of the expression scores among the four groups for the “Transitional” module (Figure 5I). This analysis (Figure 5H-J) confirmed the above enrichment analyses (Figure 5E-G).
To further validate the relationship of gene expression profiles with cell state changes, we assessed the DEGs generated by comparing states 4/5 versus state 1. We carried out the differential gene expression and functional enrichment analyses using the same parameters as previously described. DEGs from comparing states 4/5 vs state 1 were shown in the volcano plot (Figure S5A). GO, KEGG, and Reactome enrichment analyses using ORA method showed that in states 4/5, TIBs were enriched in genes involved in B cell activation, response to type I IFN (Figure S5B), BCR signaling (Figure S5B-C), antigen processing and presentation (Figure S5C), and antigen processing-cross presentation (Figure S5D). This indicated that B cells in states 4/5 were more activated than those in state 1, correlating with the upregulated genes from the trajectory analysis (Figure 5E-G). Alternatively, RNA splicing (Figure S5B-D), protein folding/processing (Figure S5B-C), and heat shock protein (HSP) 90 related pathways (Figure S5D) were downregulated. In addition to ORA, we used GSEA to further analyze the gene enrichment conditions for these DEGs between state 4/5 and state 1. GSEA MsigDB analysis revealed that TIBs in states 4/5 expressed upregulated type I and type II IFN and TNFα pathways, with downregulated genes involved in Myc target pathways (Figure S5E). GSEA KEGG analysis revealed that BCR signaling pathway was enriched while spliceosome pathways were diminished (Figure S5F). Consistently, the Reactome database revealed the TIBs in states 4/5 expressed genes involved in IFNαβ signaling, cytokine signaling, with downregulated genes involved in autophagy and cellular stress (Figure S5G).
Taken together, the comprehensive gene functional enrichment analyses concluded that the GC and PTT+GC treatment induced a cell state change that correlated with B cell activation. This strongly suggests a molecular mechanism by which B cells play an important role in executing an anticancer effect directly or indirectly (by collaborating with other cell types) in the TME.
Pro-inflammatory effect by PTT+GC is stronger than GC alone in subsets of differentiated B cell states
As GC drove the progression along pseudotime with shifting the cells from state 1 into states 4 and 5, we sought to define what type of B cell resides in each state. By finding enriched genes specific for each state, TIBs in state 1 were determined to be stimulated, yet undifferentiated B cells, compared to that in states 4 and 5. For example, B cells in state 1 expressed with genes involved in antigen presentation and processing, germinal center formation and homeostasis, and T cell activation and interaction (Figure 6A). These data suggest that the B cells were under the process of encountering antigen, but the TME confined B cell differentiation. Treatment with GC and PTT+GC released the restriction on B cells allowing them to differentiate toward effector subsets.
Identification of B cell states, higher pro-inflammatory effect by PTT+GC versus GC, and association of PTT+GC specifically upregulated genes with breast cancer patient survival. (A) Dot plot showing expression of B cell state marker genes. States were arranged along the pseudotime. B cells were identified as “Resting”, “Pre-Plasma”, “Plasma”, “Germinal Center” and “APC”. (B) Heatmaps showing the upregulated genes from comparison of PTT+GC vs GC in B cell states 3, 6, 4 and 5. These upregulated genes were not found in states 1, 2, and 7 (shown as N). (C) Kaplan-Meier plots showing the significant difference in survival time (days) between breast cancer patients in groups with “high” and “low” expressions of PTT+GC vs GC-derived upregulated genes from (B). Patient groups were stratified by the median of enrichment score calculated by gene set variation analysis (GSVA). Log-rank method was used for statistical analysis.
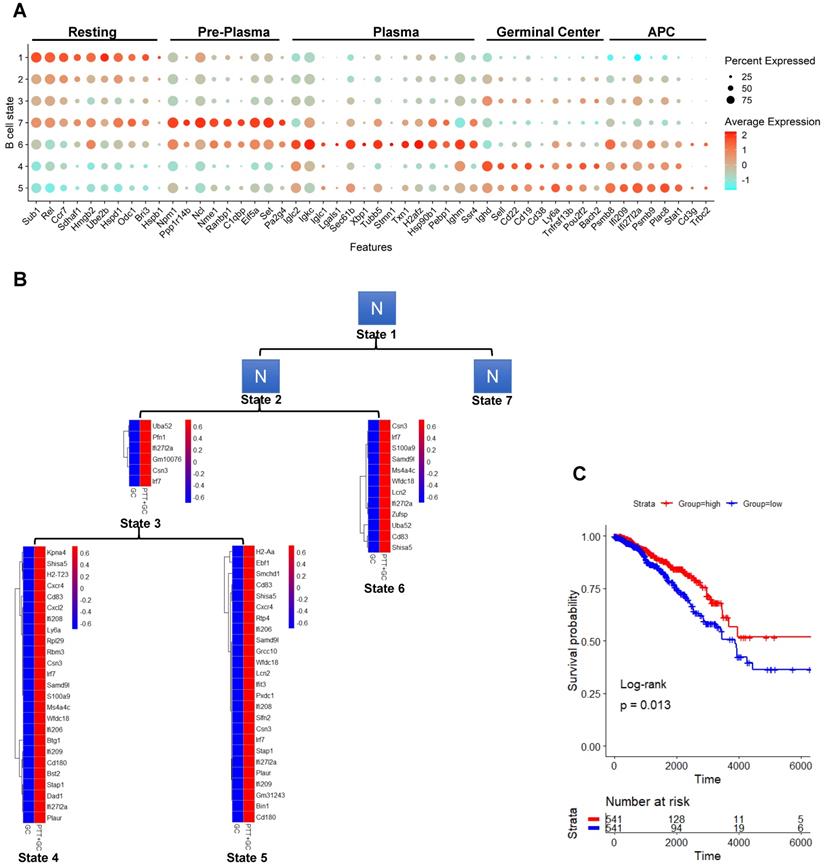
The B cells residing in states 2 and state 3 were characterized by few genes and unable to be defined. Likely these B cells were in a transitional state, on their way to becoming more differentiated effector B cells. State 7 was characterized as a plasma cell precursor (pre-plasma) (Figure 6A). Many of the genes characterizing this state were involved in cellular metabolism, transcription, translation, and protein folding, but no Ig genes were observed. However, further along the pseudotime progression, many Ig genes were observed in state 6, suggesting that these cells may be plasma cell-like. For example, B cells in state 6 expressed Iglc2, Igkc, Iglc1, and Ighm, genes encoding the constant region of immunoglobin light chains (Figure 6A). Further supporting this conclusion, B cells in state 6 express Lgals1, Sec61b, and Xbp1, all genes induced during plasma cell differentiation. Likely the cells in state 7 were plasma cell precursors and cells in state 6 are differentiating plasma cells.
Next, we characterized state 4 as germinal center-like B cells since they expressed Ighd/IgD+, Sell/CD62L+, CD22+, CD19+, CD38+, Ly6a/Sca-1+, and Tnfrsf13b/TACI+ (Figure 6A). Furthermore, state 4 B cells expressed the germinal center transcription factors Pou2f2 (OCT2) and Bach2, and Ig genes required for antibody production. While state 4 had >100 genes characterizing this state, state 5 only had 24 transcripts. Cells in state 5 expressed genes involved in antigen processing, base excision and repair for class switch recombination, and express genes involved in T cell interaction such as Plac8 and Zpb1. From this we concluded that state 5 B cells were memory-like B cells (Figure 6A).
As tumor growth was suppressed by PTT+GC, but not by GC alone (Figure 1A-B), we assessed the difference between GC and PTT+GC treatments by comparing the gene expression signatures of TIBs residing in states 3, 4, 5 and 6 (Figure 6B). A common theme among the PTT+GC treated cells residing in these states is a type I IFN signature, including Bst2, Ifi206, Ifi208, Ifi209, and Ifit3. The data suggest that these B cells have received type I IFN signals during their activation and differentiation (Figure 6B). Furthermore, upregulation of Cxcr4 and Cxcl2, and H2-Aa by PTT+GC treatment indicates an increase in antigen presentation and pro-inflammatory functions of the tumor-infiltrating B cells. These upregulated genes prompted us to hypothesize that PTT+GC may stimulate a more robust pro-inflammatory response than GC alone (Figure 6B) and in turn lead to prolonged survival of tumor-bearing animals (Figure 1A-B).
We next determined if the efficacy of PTT+GC treatment, in mouse breast tumors, translates to human disease by determining the relationship between the expression level of the PTT+GC vs GC upregulated genes and clinical outcomes in breast cancer patients. We utilized these upregulated and downregulated genes to obtain the enrichment score (ES) based on gene set variation analysis (GSVA) [36] (Figure S6A). Breast cancer patients with a higher expression of the genes found in the PTT+GC samples exhibited prolonged survival compared to the patients with lower gene expression (Figure 6C). This demonstrated that the genes specifically induced by PTT+GC, but not GC alone (Figure 6B), correlated with greater overall survival in breast cancer patients. On the other hand, the PTT+GC vs GC derived downregulated genes did not affect patient survival (Figure S6B). Taken together, we provided predictive evidence that PTT+GC treatment modalities have a greater potential in prolonging patient survival by driving B cell activation.
Discussion
Although it has been shown that tumor-infiltrating T cells participate in anti-tumor immune responses [37], there are increasing reports showing that TIBs have antitumor functions and indicate a favorable prognosis in many cancer types, including breast cancer [38]. This beneficial effect of the TIBs was attributed to the following processes: (1) antibody production; (2) antigen presentation; (3) tumor-killing cytokine secretion [39, 40]. Previously, we reported that a combination of locally administered PTT with GC induced systemic immunity against established tumors and metastases and prolonged animal survival in several aggressive tumor models [41-43]. To further understand the mechanism of localized ablative immunotherapy (LAIT), we applied scRNA-seq analysis to investigate the functional changes in the tumor-infiltrating leukocytes, particularly B cells, in the TME after PTT+GC treatment.
Specifically, we adopted LAIT (Figure S1) and successfully extended the survival of mice bearing MMTV-PyMT mammary tumors (Figure 1A-B). LAIT increased the TIB proportions (Figure 1G-H), and induced expression of genes enriched in B cell activation, including antigen-presentation (Figure 2D, S2A-B) and type I interferon signaling (Figure 2D, 2G, S2F, 3B, S3A). Single-cell trajectory analysis, which represents pseudotime progression, showed that both PTT+GC and GC, but not PTT, induced activation and differentiation of resting B cells toward an effector phenotype (Figure 5A-F, 6A). It also revealed that the B cells in the activated states were enriched with antitumor related gene expression (Figure 5E-J), specifically by PTT+GC treatment. We also showed that the combination of PTT and GC, not GC alone, induced higher B cell activation (Figure 6B) and upregulated genes associated with greater overall survival in breast cancer patients (Figure 6C).
We previously reported that, based on imaging observation and analysis, neutrophil infiltration was induced by the combination therapy of locally administered PTT with GC against B16 melanoma [41]. However, whether B cells were affected by LAIT treatment was not known. In this work, using scRNA-seq analysis, which can dissect both the cell heterogeneity and transcriptional changes, we found B cells constituted 12% of all CD45+ immune cells, much more than that of neutrophils/granulocytes (3%). That prompted us to investigate the potential regulations of LAIT on this presumed humoral immunity and antibody-producing related cells. In this experiments, LAIT-treated MMTV-PyMT tumors exhibited increased proportions of TIBs, enriched for the expression of genes involved in B cell activation, antigen-presenting, and IFNαβ signaling responses. Although PTT+GC did not result in quantitatively or proportionally more tumor-infiltrating B cells when compared to PTT and GC alone, the protective anti-tumor pathways, including “positive regulation of defense response” and “response to interferon-beta”, were unique to PTT+GC (Figure 3B, F, J). Additionally, the expression level of these protective anti-tumor genes also showed the pattern of being the highest in PTT+GC, when compared with other groups (Figure S3D). Therefore, although “quantity” (number, proportion) and “quality” (gene expression) of immune cells are important factors in the tumor microenvironment, B cell “quality” is more important than “quantity” in inducing anti-tumor responses. Therefore, it is the functionality, not the number of B cells, after the LAIT treatment, that made the difference in efficacy. On the other hand, we did not find clearly defined plasma cells in the tumors 9 days after local treatments, single-cell trajectory analysis revealed that B cells residing in state 7 and state 6 (Figure 6A) were potential plasma-like precursor cells and plasma-like cells. Analysis of TIBs at a later time point may reveal the development of plasma cells within the TME following LAIT.
LAIT-activated TIBs amplified their APC function, as these cells were enriched in genes associated with antigen-presentation. Furthermore, both GC and PTT+GC upregulated the expression of Cd40 and downregulated suppressing molecule Cd274 (PD-L1) [44] in TIBs, but PTT+GC selectively induced CD40 ligand (Cd40lg) expression in conventional CD4T cells (Figure S1C), suggesting that LAIT treated TIBs could interact with tumor-infiltrating T helper cells and inhibit the suppressing molecule PD-L1 expression in B cells to further augment a potent antitumor immune response. Further supporting T-B cell interactions is the activation of type I IFN signature in B cells, which in turn drives T cell responses to eliminate tumors. Strikingly, this immunological cascade was reported to drive inflammation in certain autoimmune diseases that have increased expression of type I IFN inducible genes [45-47]. This was best characterized in neuromyelitis optica, where type I IFNs directly acted on B cells to promote autoreactive T cell responses, which exacerbates inflammation of the central nervous system [47]. While detrimental in autoimmunity, this cascade is beneficial for immune mediated cancer elimination.
Although both GC and PTT+GC induce the differentiation of TIBs, further comparison using single-cell trajectory analysis between these two groups revealed that PTT+GC induced a greater pro-inflammatory response in TIBs with more activated attributes (Figure 6B). Furthermore, PTT+GC specifically upregulated a set of genes that correlated with greater overall survival in breast cancer patients (Figure 6A). Genes specifically upregulated by GC alone (downregulated by PTT+GC) did not have this effect (Figure S6B). We hypothesize that PTT disrupted tumor homeostasis and released tumor-specific antigens. GC drove a type I IFN response, which in turn enhanced the antigen-presenting functions of TIBs. Synergizing the functions of PTT and GC led to a strong antitumor immunity, because PTT allows the immune stimulating function of GC to overcome the anti-inflammatory TME.
In our results, we found PTT+GC increased the cell proportion of TIBs and upregulated genes that have a positive association with the overall survival of breast cancer patients (Figure 6C). In support of this observation, a study on hepatocellular carcinoma (HCC) indicated that CD20+ TIBs were positively correlated with small tumor size and the increase of CD20+ TIBs was significantly correlated with the overall and recurrence-free survival rate of HCC patients [48]. It was also reported that, in colorectal cancer, the high density of CD20+ TILs were significantly correlated with the improvement of overall survival of patients [49]. Additionally, in muscle-invasive bladder cancer (MIBC), the overall survival of the patients with high CD19+ TIB MIBC was significantly longer and CD19+ TIBs were identified as an independent prognostic factor and served as antigen-presenting cells (APCs) to activate CD4+ T cell in the TME [50]. These data support our conclusion on the importance of B cells in cancer control. Furthermore, we speculate that patients who do not have the favorable B cell signatures could benefit from LAIT-induced B cell immune responses.
Altogether, this study demonstrates the effectiveness of LAIT in a breast cancer model. Our data provided novel insights into how LAIT-induced B cell activation contributes to the upregulation of pro-inflammatory genes that show positive correlation with prolonged patient survival. Overall, these findings broadened our understanding of LAIT's regulatory roles in remodeling TME and shed light on the potential of B cell activation in clinical applications.
Methods
Study approval
Experimental procedures and handling of mice were performed in accordance with the University of Oklahoma Health Sciences Center (OUHSC) and Oklahoma Medical Research Foundation (OMRF) Institutional Animal Care and Use Committee (IACUC) regulations and approved protocols.
Mice
Female FVB/NJ wild-type (stock #001800) and FVB/N transgenic MMTV-PyMT (stock #002374) mice were purchased from Jackson Laboratories and housed according to institutional guidelines at the University of Oklahoma Health Sciences Center. All studies were approved and adhered to OUHSC Institutional Animal Care and Use Committee protocols (#17-032-HCL).
Syngeneic tumor cell transplantation
MMTV-PyMT murine breast tumor organoids were isolated from FVB/N-Tg (MMTV-PyVT) 634M ul/J mice as previously described [21]. Briefly, cells were incubated overnight in mammary epithelial cell media (DMEM/F12 supplemented with 10% fetal bovine serum (Sigma Aldrich, F2442-500ML) 100 U/mL penicillin-streptomycin (Sigma Aldrich, P0781-20×100 ml), 5ug/mL insulin-transferrin-selenium (ThermoFisher Scientific, 51500056), 1ug/mL hydrocortisone (Sigma Aldrich, H0888-10G), 10 ng/mL mouse epidermal growth factor (EGF) (ThermoFisher Scientific, 53003018), and 50 ug/mL gentamicin (Genesee Scientific, 25-533). Cells were washed twice with Hepes Buffered Saline (HBSS) (Gibco, 14175-095) trypsinized, and resuspended to a concentration of 1x10⁵ cell per 20 uL. Cells were injected into the mammary fat pad of wild type FVB mice without clearing. The incision was closed with Vetbond tissue adhesive (3M).
Treatment of mouse tumors
When tumors reached 0.5 cm3, the tumor site was shaved and mice received one of four treatments: CTRL (without treatment), GC alone, PTT alone, and LAIT (PTT+GC). The mice in GC group received an intratumoral injection of 1% GC in 0.1 ml solution (Immunophotonics, Inc.). For mice in PTT group, the laser parameters were selected based on our previous studies [42, 51-54]. The tumor was treated by an 805-nm laser (AngioDynamics, Latham, NY) with a power density of 1 W/cm2 for 10 minutes, using an optical fiber with a diffusion lens (Pioneer Optics, Bloomfield, CT) to delivery uniform light distribution on the treatment surface. For the mice in LAIT group, the tumor was treated by the laser (1 W/cm2 for 10 minutes), followed by an intratumoral injection of GC (0.1 ml at 1%). Ten days after treatment, tumors were collected from selected mice in each group. The remaining mice were observed for up to 60 days or when the tumors reached a size of 2.5 cm3 or reached ethical endpoints.
Sample preparation and single-cell RNA sequencing library generation
In each of the four treatment groups, immune cells from four mice were used for single-cell RNA sequencing. Tumor tissues were isolated, minced with scalpels, and digested with Collagenase IV and Dnase I at 37°C for 20-30 minutes. After enzymatic digestion, immune cells were enriched using lymphocyte separation medium. The enriched cells were then subjected to magnetic bead separation (EasySep Mouse Streptavidin Rapidspheres Isolation Kit, Stem Cell, 19860) to remove the EpCAM+ cells (CD326 1:200, ThermoFisher Scientific, 13-5791-82). The EpCAM-depleted cells were stained with antibodies against CD45 and a viability dye. Live CD45+ cells (CD45 1:100, Biolegend, 103112), were sorted using MoFlo and then processed for droplet-based 3' end scRNA-seq by encapsulating sorted live CD45+ tumor-infiltrating immune cells into droplets via a 10× Genomics platform according to the manufacturer's instructions (10× Genomics). Paired-end RNA-seq was performed via an Illumina NovaSeq 6000 sequencing system.
Data processing
The Cell Ranger pipeline was used to perform sample sequencing reads. The Linux command cellranger count was used to process sample-specific fastq files. Seurat-guided analyses were used to process and integrate datasets from different treatment groups [22, 55]. Genes that were expressed in less than 5 cells or cells that expressed less than 800 and more than 6000 genes were excluded. Also, cells with a mitochondria percentage over 10% were excluded. Most variable genes were identified using the FindVariableFeatures function by setting feature numbers as 2000. Principal component analysis (PCA) was performed using the first 30 principal components (PCs). Clustering was performed using FindClusters that implements a shared nearest neighbor (SNN) modularity optimization-based clustering algorithm with resolution 0.5 for default analysis. B cells were subset and re-clustered to generate its t-SNE plot.
Differential gene expression (DGE) analysis
Comparisons were conducted by comparing treatments of PTT, GC, and PTT+GC with CTRL, respectively. Differential gene expression was analyzed by using FindMarkers function in Seurat R package [22] for each comparison and visualized by volcano plot. Threshold of Log fold change (logFC) was set at 0.25 and -0.25 as default. Top 10 of both upregulated and downregulated differentially expressed genes (DEGs) were labelled on volcano plots.
Functional enrichment analysis
clusterProfiler R package [30] was used for gene functional enrichment analysis. Both methods of over-representation analysis (ORA) and gene set enrichment analysis (GSEA) were used. Corresponding pathway databases include GO, KEGG, Reactome and MsigDB etc. Dot plot was mainly used for ORA result visualization and network plot for GSEA result.
Analysis of overlapping of treatment-derived DEGs
Overlapping of treatment-derived DEGs were analyzed and visualized by using Venn Diagram. Subset of indicated gene sets were used for functional enrichment analysis. Expression of these subset genes were obtained using AverageExpression function in Seurat R package [22] and visualized using circular heatmap [56, 57].
Analysis of correlation between clinical survival and derived gene sets
To assess the clinical significance of expression of a given gene set, we utilized gene expression RNA-seq and survival data available from GDC TCGA Breast Cancer (BRCA) (20 datasets) [58]. To evaluate whether there was a relationship between differentially expressed gene sets and clinical survival in breast cancer patients, we utilized PTT+GC vs GC uniquely expressed gene sets as the input and get the enrichment score (ES) using gene set variation analysis (GSVA) R package [36]. Cancer patients were considered “high” if ES was above the median and “low” if ES is below median. Analyses were carried out with Kaplan-Meier estimates and log-rank tests. Numbers below plots represent numbers of breast cancer patients. Survival times are presented as days.
Single-cell trajectory analysis
Monocle2 R package was used for single-cell trajectory inference based on the DDRTree algorithm [35]. The construction of tumor-infiltrating B cell Seurat object was imported into Monocle2 and highly variable genes were used for gene ordering and trajectory and pseudotime construction. Heatmap for pseudotime associated genes were generated and clusters of genes were selected for downstream functional enrichment analysis.
Statistical analyses
Statistical analysis was conducted with GraphPad Prism and R. Unless indicated otherwise, data were expressed as means ± SD or SEM. One-way analysis of variance (ANOVA) was used for multiple group comparisons. Proportion test function (“prop.test”) in R was used for cell proportion test. Differences in survival were determined on the basis of Kaplan-Meier survival analysis. Adjusted P values less than or equal to 0.05 were considered statistically significant (*, p ≤ 0.05; **, p ≤ 0.01).
Data and code availability
The accession number for the scRNA-seq data reported in this paper is GEO: GSE150675. Analysis for such data can be available upon request.
Abbreviations
CTRL: control; PTT: photothermal therapy; GC: N-dihydrogalactochitosan; LAIT: localized ablative immunotherapy; MMTV-PyMT: mouse mammary tumor virus-polyoma middle tumor-antigen; scRNA-seq: single-cell RNA sequencing; TILs: tumor-infiltrating lymphocytes; TIBs: tumor-infiltrating B cells; TME: tumor microenvironment; IFN-γ: interferon-γ; TNFα: tumor necrosis factor-α; t-SNE: t-distributed stochastic neighbor embedding; DEGs: differentially expressed genes; ES: enrichment score; GO: gene ontology; ORA: over-representation analysis; GSEA: gene set enrichment analysis; GSVA: gene set variation analysis; KEGG: kyoto encyclopedia of genes and genomes; MsigDB: Molecular Signatures Database.
Supplementary Material
Supplementary figures and table.
Acknowledgements
This work was supported in part by the National Cancer Institute (R01CA205348 to WRC), National Eye Institute (R01EY027346 to RCA) and National Institute of Allergy and Infectious Diseases (R01AI137047 to RCA), National Institutes of Health (AI134719 to MLL), and the Oklahoma Center for the Advancement of Science and Technology (HR16-085 and HF20-019 to WRC). We would like to thank the Flow Cytometry Core Facility and Genomics Core Facility at the Oklahoma Medical Research Foundation (OMRF) for providing flow cytometry services and assisting in scRNA-seq analysis. The authors (WRC, KL, ARH) also appreciate the generous support of Dr. and Mrs. Lee and Sherry Beasley, Dr. and Mrs. J. Michael and Kathy Steffen, and Dr. and Mrs. Damon and Heather Johnston.
Ethics declarations
Wei R. Chen is co-founder and an unpaid member of the Board of Directors of Immunophotonics, Inc. Robert C. Axtell has consulted Roche, EMD-Serono, Biogen-Idec, and is on the advisory board for Progentec Diagnostics Inc. All other authors declare no competing interests.
Competing Interests
The authors have declared that no competing interest exists.
References
1. Finn OJ. Cancer immunology. N Engl J Med. 2008;358:2704-15
2. Gonzalez H, Hagerling C, Werb Z. Roles of the immune system in cancer: from tumor initiation to metastatic progression. Genes Dev. 2018;32:1267-84
3. Youlden DR, Cramb SM, Dunn NA, Muller JM, Pyke CM, Baade PD. The descriptive epidemiology of female breast cancer: an international comparison of screening, incidence, survival and mortality. Cancer Epidemiol. 2012;36:237-48
4. Siegel RL, Miller KD, Jemal A. Cancer statistics, 2020. CA Cancer J Clin. 2020;70:7-30
5. Savas P, Salgado R, Denkert C, Sotiriou C, Darcy PK, Smyth MJ. et al. Clinical relevance of host immunity in breast cancer: from TILs to the clinic. Nat Rev Clin Oncol. 2016;13:228-41
6. Dushyanthen S, Beavis PA, Savas P, Teo ZL, Zhou C, Mansour M. et al. Relevance of tumor-infiltrating lymphocytes in breast cancer. BMC Medicine. 2015;13:202
7. Kraljevic Pavelic S, Sedic M, Bosnjak H, Spaventi S, Pavelic K. Metastasis: new perspectives on an old problem. Mol Cancer. 2011;10:22
8. Lambert AW, Pattabiraman DR, Weinberg RA. Emerging Biological Principles of Metastasis. Cell. 2017;168:670-91
9. Wang M, Rao J, Wang M, Li X, Liu K, Naylor MF. et al. Cancer photo-immunotherapy: from bench to bedside. Theranostics. 2021;11:2218-31
10. Chen WR, Carubelli R, Liu H, Nordquist RE. Laser immunotherapy. Mol Biotechnol. 2003;25:37-43
11. Zhou F, Li X, Naylor MF, Hode T, Nordquist RE, Alleruzzo L. et al. InCVAX-a novel strategy for treatment of late-stage, metastatic cancers through photoimmunotherapy induced tumor-specific immunity. Cancer Lett. 2015;359:169-77
12. Chen WR, Jeong SW, Lucroy MD, Wolf RF, Howard EW, Liu H. et al. Induced antitumor immunity against DMBA-4 metastatic mammary tumors in rats using laser immunotherapy. Int J Cancer. 2003;107:1053-7
13. Chen WR, Zhou F, Yang J, Zhang Y, Liu M, Lang ML. et al. Local phototherapy synergizes with immunoadjuvant for treatment of pancreatic cancer through induced immunogenic tumor vaccine. Clin Cancer Res. 2018;24:5335-46
14. Chen WR, Singhal AK, Liu H, Nordquist RE. Antitumor immunity induced by laser immunotherapy and its adoptive transfer. Cancer Res. 2001;61:459-61
15. Chen WR, Zhu WG, Dynlacht JR, Liu H, Nordquist RE. Long-term tumor resistance induced by laser photo-immunotherapy. Int J Cancer. 1999;81:808-12
16. Li X, Ferrel GL, Guerra MC, Hode T, Lunn JA, Adalsteinsson O. et al. Preliminary safety and efficacy results of laser immunotherapy for the treatment of metastatic breast cancer patients. Photochem Photobiol Sci. 2011;10:817-21
17. Li X, Naylor MF, Le H, Nordquist RE, Teague TK, Howard CA. et al. Clinical effects of in situ photoimmunotherapy on late-stage melanoma patients: a preliminary study. Cancer Biol Ther. 2010;10:1081-7
18. Naylor MF, Chen WR, Teague TK, Perry LA, Nordquist RE. In situ photoimmunotherapy: a tumour-directed treatment for melanoma. Br J Dermatol. 2006;155:1287-92
19. Zhang Z, Zhu Y, Wang Z, Zhang T, Wu P, Huang J. Yin-yang effect of tumor infiltrating B cells in breast cancer: From mechanism to immunotherapy. Cancer Letters. 2017;393:1-7
20. Shen M, Wang J, Ren X. New Insights into Tumor-Infiltrating B Lymphocytes in Breast Cancer: Clinical Impacts and Regulatory Mechanisms. Front Immunol. 2018;9:470
21. Smith BA, Shelton DN, Kieffer C, Milash B, Usary J, Perou CM. et al. Targeting the PyMT Oncogene to Diverse Mammary Cell Populations Enhances Tumor Heterogeneity and Generates Rare Breast Cancer Subtypes. Genes Cancer. 2012;3:550-63
22. Butler A, Hoffman P, Smibert P, Papalexi E, Satija R. Integrating single-cell transcriptomic data across different conditions, technologies, and species. Nat Biotechnol. 2018;36:411-20
23. Luecken MD, Theis FJ. Current best practices in single-cell RNA-seq analysis: a tutorial. Mol Syst Biol. 2019;15:e8746
24. Li Q, Zhu Z, Wang L, Lin Y, Fang H, Lei J. et al. Single-cell transcriptome profiling reveals vascular endothelial cell heterogeneity in human skin. Theranostics. 2021;11:6461-76
25. Wang J-J, Tian Y, Li M-H, Feng Y-Q, Kong L, Zhang F-L. et al. Single-cell transcriptome dissection of the toxic impact of Di (2-ethylhexyl) phthalate on primordial follicle assembly. Theranostics. 2021;11:4992-5009
26. Liu Y, Hu J, Liu D, Zhou S, Liao J, Liao G. et al. Single-cell analysis reveals immune landscape in kidneys of patients with chronic transplant rejection. Theranostics. 2020;10:8851-62
27. Gubin MM, Esaulova E, Ward JP, Malkova ON, Runci D, Wong P. et al. High-Dimensional Analysis Delineates Myeloid and Lymphoid Compartment Remodeling during Successful Immune-Checkpoint Cancer Therapy. Cell. 2018;175:1014-30.e19
28. Boyle EI, Weng S, Gollub J, Jin H, Botstein D, Cherry JM. et al. GO::TermFinder-open source software for accessing Gene Ontology information and finding significantly enriched Gene Ontology terms associated with a list of genes. Bioinformatics. 2004;20:3710-5
29. Subramanian A, Tamayo P, Mootha VK, Mukherjee S, Ebert BL, Gillette MA. et al. Gene set enrichment analysis: A knowledge-based approach for interpreting genome-wide expression profiles. Proc Natl Acad Sci USA. 2005;102:15545-50
30. Yu G, Wang LG, Han Y, He QY. clusterProfiler: an R package for comparing biological themes among gene clusters. OMICS. 2012;16:284-7
31. Ashburner M, Ball CA, Blake JA, Botstein D, Butler H, Cherry JM. et al. Gene ontology: tool for the unification of biology. The Gene Ontology Consortium. Nat Genet. 2000;25:25-9
32. Kanehisa M, Goto S. KEGG: kyoto encyclopedia of genes and genomes. Nucleic Acids Res. 2000;28:27-30
33. Fabregat A, Sidiropoulos K, Viteri G, Forner O, Marin-Garcia P, Arnau V. et al. Reactome pathway analysis: a high-performance in-memory approach. BMC Bioinformatics. 2017;18:142
34. Liberzon A, Birger C, Thorvaldsdóttir H, Ghandi M, Mesirov JP, Tamayo P. The Molecular Signatures Database (MSigDB) hallmark gene set collection. Cell Syst. 2015;1:417-25
35. Qiu X, Mao Q, Tang Y, Wang L, Chawla R, Pliner HA. et al. Reversed graph embedding resolves complex single-cell trajectories. Nat Methods. 2017;14:979-82
36. Hänzelmann S, Castelo R, Guinney J. GSVA: gene set variation analysis for microarray and RNA-Seq data. BMC Bioinformatics. 2013;14:7
37. Liu Z, Han C, Fu Y-X. Targeting innate sensing in the tumor microenvironment to improve immunotherapy. Cell Mol Immunol. 2020;17:13-26
38. Wouters MCA, Nelson BH. Prognostic significance of tumor-infiltrating B cells and plasma cells in human cancer. Clin Cancer Res. 2018;24:6125-35
39. Liu Z, Fu Y-X. Chemotherapy Induces Cancer-Fighting B Cells. Cell. 2020;180:1037-9
40. Yuen GJ, Demissie E, Pillai S. B lymphocytes and cancer: a love-hate relationship. Trends Cancer. 2016;2:747-57
41. Qi S, Lu L, Zhou F, Chen Y, Xu M, Chen L. et al. Neutrophil infiltration and whole-cell vaccine elicited by N-dihydrogalactochitosan combined with NIR phototherapy to enhance antitumor immune response and T cell immune memory. Theranostics. 2020;10:1814-32
42. Zhou F, Yang J, Zhang Y, Liu M, Lang ML, Li M. et al. Local phototherapy synergizes with immunoadjuvant for treatment of pancreatic cancer through induced immunogenic tumor vaccine. Clin Cancer Res. 2018;24:5335-46
43. Luo M, Shi L, Zhang F, Zhou F, Zhang L, Wang B. et al. Laser immunotherapy for cutaneous squamous cell carcinoma with optimal thermal effects to enhance tumour immunogenicity. Int J Hyperthermia. 2018;34:1337-50
44. Khan AR, Hams E, Floudas A, Sparwasser T, Weaver CT, Fallon PG. PD-L1hi B cells are critical regulators of humoral immunity. Nat Commun. 2015;6:5997
45. Biswas PS, Aggarwal R, Levesque MC, Maers K, Ramani K. Type I interferon and T helper 17 cells co-exist and co-regulate disease pathogenesis in lupus patients. Int J Rheum Dis. 2015;18:646-53
46. Brkic Z, Corneth OBJ, van Helden-Meeuwsen CG, Dolhain RJEM, Maria NI, Paulissen SMJ. et al. T-helper 17 cell cytokines and interferon type I: partners in crime in systemic lupus erythematosus? Arthritis Res Ther. 2014;16:R62
47. Agasing AM, Wu Q, Khatri B, Borisow N, Ruprecht K, Brandt AU. et al. Transcriptomics and proteomics reveal a cooperation between interferon and T-helper 17 cells in neuromyelitis optica. Nat Commun. 2020;11:2856
48. Shi J-Y, Gao Q, Wang Z-C, Zhou J, Wang X-Y, Min Z-H. et al. Margin-infiltrating CD20(+) B cells display an atypical memory phenotype and correlate with favorable prognosis in hepatocellular carcinoma. Clin Cancer Res. 2013;19:5994-6005
49. Berntsson J, Nodin B, Eberhard J, Micke P, Jirström K. Prognostic impact of tumour-infiltrating B cells and plasma cells in colorectal cancer. Int J Cancer. 2016;139:1129-39
50. Zhou Q, Wang Z, Zeng H, Zhang H, Liu Z, Huang Q. et al. Identification and validation of poor prognosis immunoevasive subtype of muscle-invasive bladder cancer with tumor-infiltrating podoplanin(+) cell abundance. Oncoimmunology. 2020;9:1747333
51. West CL, Doughty ACV, Liu K, Chen WR. Monitoring tissue temperature during photothermal therapy for cancer. J BioX Res. 2019;2:159-68
52. Liu S, Doughty A, West C, Tang Z, Zhou F, Chen WR. Determination of temperature distribution in tissue for interstitial cancer photothermal therapy. Int J Hyperthermia. 2018;34:756-63
53. Gnyawali SC, Chen Y, Wu F, Bartels KE, Wicksted JP, Liu H. et al. Temperature measurement on tissue surface during laser irradiation. Med Biol Eng Comput. 2008;46:159-68
54. Crochet JJ, Gnyawali SC, Chen Y, Lemley EC, Wang LV, Chen WR. Temperature distribution in selective laser-tissue interaction. J Biomed Opt. 2006;11:34031
55. Stuart T, Butler A, Hoffman P, Hafemeister C, Papalexi E, Mauck WM 3rd. et al. Comprehensive Integration of Single-Cell Data. Cell. 2019;177:1888-902.e21
56. Gu Z, Gu L, Eils R, Schlesner M, Brors B. circlize Implements and enhances circular visualization in R. Bioinformatics. 2014;30:2811-2
57. Gu Z, Eils R, Schlesner M. Complex heatmaps reveal patterns and correlations in multidimensional genomic data. Bioinformatics. 2016;32:2847-9
58. Goldman MJ, Craft B, Hastie M, Repečka K, McDade F, Kamath A. et al. Visualizing and interpreting cancer genomics data via the Xena platform. Nat Biotechnol. 2020;38:675-8
Author contact
![]() Corresponding author: E-mail: Wei-R-Chenedu.
Corresponding author: E-mail: Wei-R-Chenedu.