Impact Factor
- Issue 14; 2026
- Issue 13; 2026
- Issue 12; 2026
- Issue 11; 2026
- Issue 10; 2026
- Volume 16; 2026
- Advance Articles
- Past Issues
- Cover Images
- Cover Suggestion
- Index & Coverage
- Special Issues
Introduction
Results
Discussion
Methods
Abbreviations
Supplementary Material
Acknowledgements
References
International Journal of Biological Sciences
International Journal of Medical Sciences
 Global reach, higher impact

Theranostics 2022; 12(1):459-473. doi:10.7150/thno.65739 This issue Cite
Research Paper
Comprehensive omics analyses profile genesets related with tumor heterogeneity of multifocal glioblastomas and reveal LIF/CCL2 as biomarkers for mesenchymal subtype
Sheng-Qing Lv1 ![]() *, Zhen Fu2*, Lin Yang1, Qing-Rui Li2,3, Jiang Zhu2, Qu-Jing Gai2, Min Mao2, Jiang He2, Yan Qin2, Xiao-Xue Yao2, Xi Lan2, Yan-Xia Wang2, Hui-Min Lu2,3, Yan Xiang1, Zuo-Xin Zhang1, Guo-Hao Huang1, Wei Yang1, Ping Kang4, Zhijian Sun4, Yu Shi2, Xiao-Hong Yao2, Xiu-Wu Bian2
*, Zhen Fu2*, Lin Yang1, Qing-Rui Li2,3, Jiang Zhu2, Qu-Jing Gai2, Min Mao2, Jiang He2, Yan Qin2, Xiao-Xue Yao2, Xi Lan2, Yan-Xia Wang2, Hui-Min Lu2,3, Yan Xiang1, Zuo-Xin Zhang1, Guo-Hao Huang1, Wei Yang1, Ping Kang4, Zhijian Sun4, Yu Shi2, Xiao-Hong Yao2, Xiu-Wu Bian2 ![]() , Yan Wang2
, Yan Wang2 ![]()
1. Department of Neurosurgery, Xinqiao Hospital, Third Military Medical University (Army Medical University), Chongqing, China.
2. Institute of Pathology and Southwest Cancer Center, Southwest Hospital, Third Military Medical University (Army Medical University), Chongqing, China.
3. Biobank of Institute of Pathology, Southwest Hospital, Third Military Medical University (Army Medical University), Chongqing, China.
4. K2 Oncology Co., Ltd, Beijing, China.
* These authors contributed equally to this work.
Received 2021-8-5; Accepted 2021-10-27; Published 2022-1-1
Abstract

Rationale: Around 10%-20% patients with glioblastoma (GBM) are diagnosed with more than one tumor lesions or multifocal GBM (mGBM). However, the understanding on genetic, DNA methylomic, and transcriptomic characteristics of mGBM is still limited.
Methods: In this study, we collected nine tumor foci from three mGBM patients followed by whole genome sequencing, whole genome bisulfite sequencing, RNA sequencing, and immunohistochemistry. The data were further examined using public GBM databases and GBM cell line.
Results: Analysis on genetic data confirmed common features of GBM, including gain of chr.7 and loss of chr.10, loss of critical tumor suppressors, high frequency of PDGFA and EGFR amplification. Through profiling DNA methylome of individual tumor foci, we found that promoter methylation status of genes involved in detection of chemical stimulus, immune response, and Hippo/YAP1 pathway was significantly changed in mGBM. Although both CNV and promoter methylation alteration were involved in heterogeneity of different tumor foci from same patients, more CNV events than promoter hypomethylation events were shared by different tumor foci, implying CNV were relatively earlier than promoter methylation alteration during evolution of different tumor foci from same mGBM. Moreover, different tumor foci from same mGBM assumed different molecular subtypes and mesenchymal subtype was prevalent in mGBM, which might explain the worse prognosis of mGBM than single GBM. Interestingly, we noticed that LIF and CCL2 was tightly correlated with mesenchymal subtype tumor focus in mGBM and predicted poor survival of GBM patients. Treatment with LIF and CCL2 produced mesenchymal-like transcriptome in GBM cells.
Conclusions: Together, our work herein comprehensively profiled multi-omics features of mGBM and emphasized that components of extracellular microenvironment, such as LIF and CCL2, contributed to the evolution and prognosis of tumor foci in mGBM patients.
Keywords: multifocal GBM, molecular subtype, extracellular matrix, immune response, LIF, CCL2
Introduction
Glioblastoma (GBM) is the most common primary malignancy in adult brain and 10% - 20% of GBM patients are diagnosed with more than one tumor lesion or multifocal GBM (mGBM) [1, 2]. Patients with mGBM have shortened overall survival compared to those with one GBM mass or unifocal GBM (uGBM) and are resistant to current therapeutic measures [3, 4]. Previous genetic analysis on mGBM patients reveals the monoclonal nature of different tumor foci from same patients [5, 6], but the genes or genesets involved in tumor evolution of mGBM remain to be elucidated. Given worse prognosis of mGBM than uGBM, identifying genes critically involved in GBM progression might reveal mechanisms underlying dismal prognosis of GBM and provide novel therapeutic targets for both mGBM and uGBM.
According to the transcriptomic profiles and genetic alterations, GBM is classified into three molecular subtypes - proneural, classical, and mesenchymal with distinct genetic and transcriptomic features, respectively [7, 8]. Proneural subtype is significantly associated with copy number amplification of PDGFRA gene and point mutations in IDH1, and showed high expression of PDGFRA, NKX2-2, and OLIG2, but reduced expression of CDKN1A tumor suppressor gene. Gene ontology (GO) categories of proneural transcriptome include developmental processes and cell cycle/proliferation signature [9]. Classical subtype is featured with EGFR gene amplification and homozygous deletion of Ink4a/ARF locus. In addition, Notch and Sonic hedgehog signaling pathways are highly expressed in this subtype [7]. Mesenchymal subtype is characterized by high expression of CHI3L1 and MET, high frequency of NF1 mutation/deletion, and low levels of NF1 mRNA expression. Signature genes of wound healing and NF-κB signaling pathway is remarkably involved in mesenchymal subtype. In clinical prognosis and treatment, the three subtypes are corresponding to different survival length and treatment response [7, 8]. The existence of different GBM subtypes raises questions regarding their natural history and the sequential events in which individual alterations are incorporated [10, 11]. Interestingly, different subtypes also share some common genetic alterations, e.g., gain of chromosome 7 (chr.7) and loss of chr.10 [10, 12], implying that various molecular might arise from a common origin [12]. Recently, DNA methylation profiling has become an important adjunct tool for tumor classification and identification of molecular subclasses [13-15]. Whole genome methylation, especially methylation alterations in promoter area, pivotally regulates gene expression. Genome-wide methylation profiles not only define subgroup of gliomas [13, 16], but also are associated with survival time in GBM patients [15, 17]. By now, it has been known that whole-genome methylation, especially promoter CpG methylation, are tightly correlated with glioma phenotype [13-15].
So far, comprehensive omics data, including genomic, methylomic, and transcriptomic profiles of GBM have been extensively investigated, which delineate novel disease-driver mutations and chromosomal rearrangement events and provide new molecular subtype classification according to genetic alterations, methylation, and transcription [7, 8, 13, 18-20]. Moreover, IDH1 mutation has been found to act as oncogenic events through comprehensively modifying metabolism and methylation profiles to drive glioma development [21-24]. As a specific pathological population of GBM, mGBM remains to be investigated through comprehensive omics. Abou-El-Ardat et al. has reported the genomic characteristics of eleven tumor foci from five mGBM cases without profiling transcriptome and methylome [6]. Liu et al. has reported the comparison of genetic characteristics of mGBM with uGBM using TCGA database but no omics information of individual tumor foci from mGBM [25]. By now, investigation on transcriptomes and methylomes on different tumor foci of mGBM has not yet been performed and it is unclear which genes/signaling pathways are pivotally involved in the progression of different tumor foci of mGBM. Therefore, in this work, we comprehensively analyzed multi-omics of nine tumor foci from three mGBM patients and revealed several genes/genesets tightly related with tumor evolution of mGBM.
Results
Different tumor foci from same mGBM patient shared critical genetic alterations of GBM
Here, two male patients (47 and 72 years old, respectively) and one female patient (36 years old) (Table S1) were subjected to neuro-navigation and fluorescein-guided surgery (Figure 1A, Figure S1A, and S1B) in Xinqiao hospital, Chongqing, China. We collected totally nine tumor foci from three mGBM patients (mGBM1, mGBM2, and mGBM3). mGBM1, mGBM2, and mGBM3 included four tumor foci (mGBM1_A-D), three tumor foci (mGBM2_A-C), and two tumor foci (mGBM3_A and mGBM3_B), respectively. In our cases, all tumor foci localized in the same cerebral hemisphere, which was consistent with previous reports, in which most of patients (5 of 6 cases [6] and 30 of 35 cases [25]) developed tumor foci in the same cerebral hemisphere. HE staining confirmed that all tumor foci assumed pathological features of GBM (Figure S1C). Then, all tumor foci were subjected to whole-genome sequencing (WGS) for genome, whole genome bisulfite sequencing (WGBS) for methylome, and RNA sequencing (RNA-Seq) for transcriptome followed by bioinformatic analyses.
Analysis on genomes of tumor foci from the three mGBM patients. A) Representative MRI images of mGBM1 patient. Solid line circle in upper panels and dash line circle in lower panels indicate the tumor areas before and after surgical removal, respectively. B) Diagram of chromosomal copy number variation of tumor foci from the three mGBM patients. Red color and blue color represent chromosomal gain and loss, respectively. C) Distribution of cancer driver genes with mutations in tumor foci from the three mGBM patients. D) Evolution route of tumor foci from the three mGBM patients according to CNV and SNV. Red color font and green color font represent chromosomal gain and loss, respectively.
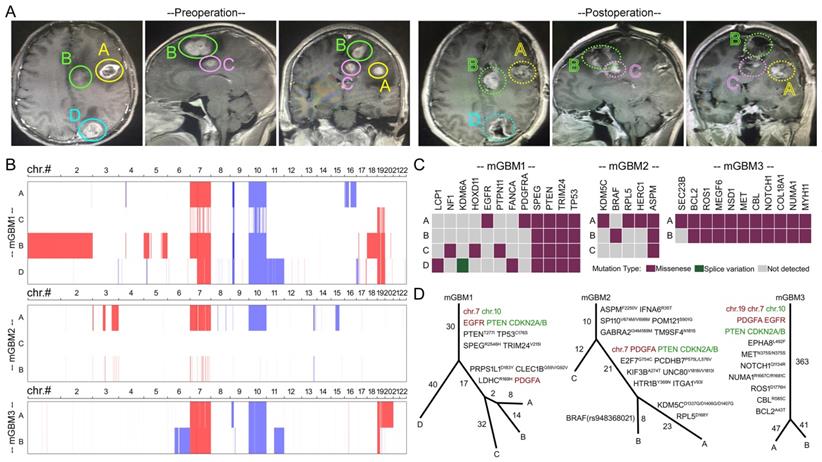
We first profiled the genetic features of nine tumor foci from three mGBM patients through WGS. The data showed that all tumor foci lacked of IDH1/2 mutations (Data not shown) and tumor foci of mGBM1 and mGBM2 carried TERT promoter mutation C228T (chr.5:1,295,228:C>T) [26] (Table S2). As reported previously [6, 10, 12, 25], gain of chr.7 and loss of chr.10 were identified as common features for GBM (mGBM and uGBM) (Figure 1B) (Table S3). In addition, loss of chr.9 and gain of chr.19 were also detected as frequent events in our study (Figure 1B) (Dataset 1) and previous reports [6, 25]. Moreover, in the tumor foci, we detected alterations of signature genes broadly reported in GBM. Losses of PTEN and CDKN2A/CDKN2B [7, 20] were frequent events in 7 and 8 tumor foci, respectively (Table S3). Amplification of PDGFA gene and EGFR gene was detected in 7 tumor foci (Table S3). It should be mentioned that PDGFA was a prognostic marker for glioma and analyses on several glioma databases consistently indicated that high expression of PDGFA predicted poor survival (Figure S1D). Our study observed high frequency of PDGFA gene amplification with 3 in 3 patients (100%) and 7 in 9 tumor foci (77.8%), which was comparable to previous report by Abou-El-Ardat et al. with 6 in 6 patients (100%) and 9 in 12 tumor foci (75%) [6].
Since derivation of multiple tumor foci is important for understanding the progression of mGBM, we explored tumor evolution routes of the three mGBM patients according to copy number variations (Dataset 1) and single nucleotide variations (Dataset 2). We found that different tumor foci from same patients shared critical driver mutations (Figure 1C). The evolution simulation indicated that mGBM1_D and mGBM1_A, B, C took different evolution route due to variations of mutation accumulation, but mGBM1_A and B were close to each other at the mutation levels (Figure 1D). For mGBM2, the simulation of evolution route implied that mGBM2_C and the other two foci might develop separately in very early stage, but mGBM2_B and A were close to each other in evolution route (Figure 1D). For mGBM3, the two foci shared most significant mutations (Figure 1D), supporting their common origination. Together, these data revealed common features of GBM, including gain of chr.7 and loss of chr.10, lacking IDH1/2 mutations, high frequency of TERT promoter mutation, loss of critical tumor suppressors (e.g., PTEN and CDKN2A/CDKN2B), high frequency of PDGFA and EGFR amplification. Critical oncogenic alterations in genome were shared by different tumor foci of mGBM, emphasizing the pivotal roles of genetic events in mGBM initiation.
Methylomic analysis profiled common features and genesets in tumor foci of mGBM
In GBM, CpG methylation profiles play critical roles for classification of molecular subtypes [13, 20, 27], but methylomic features of individual tumor focus of mGBM have not yet been studied. Thus, we performed WGBS to profile DNA methylation features of the nine tumor foci (Dataset 3). A specific G-CIMP has been identified in glioma, featured with somatic IDH1/2 mutation, lack of chr.7 amplification, obvious amplification of 8q23.1-24.3 and 10p15.3-p11.21, and prevalence in low-grade glioma but not GBM [13, 20]. All samples in our study were confirmed as GBM, harbored wild-type IDH1/2, and had no typical chromosomal alterations of G-CIMP, indicating Non G-CIMP characteristics of our samples. Principle component analysis (PCA) showed that genomic methylation of different tumor foci from same patients were remarkably varied (Figure S2A). Methylation pattern and gene expression correlation showed that in all samples, CG methylation account for the major methylation events and high CG methylation remarkably leaded to gene silence (Figure S2B). Methylomic heatmap cluster and PCA on the nine tumor foci revealed that despite significant diversity of methylomes of the nine tumor foci, tumor foci from same patients could be preferentially clustered together with an exception of mGBM1_A (Figure S2A and S2C).
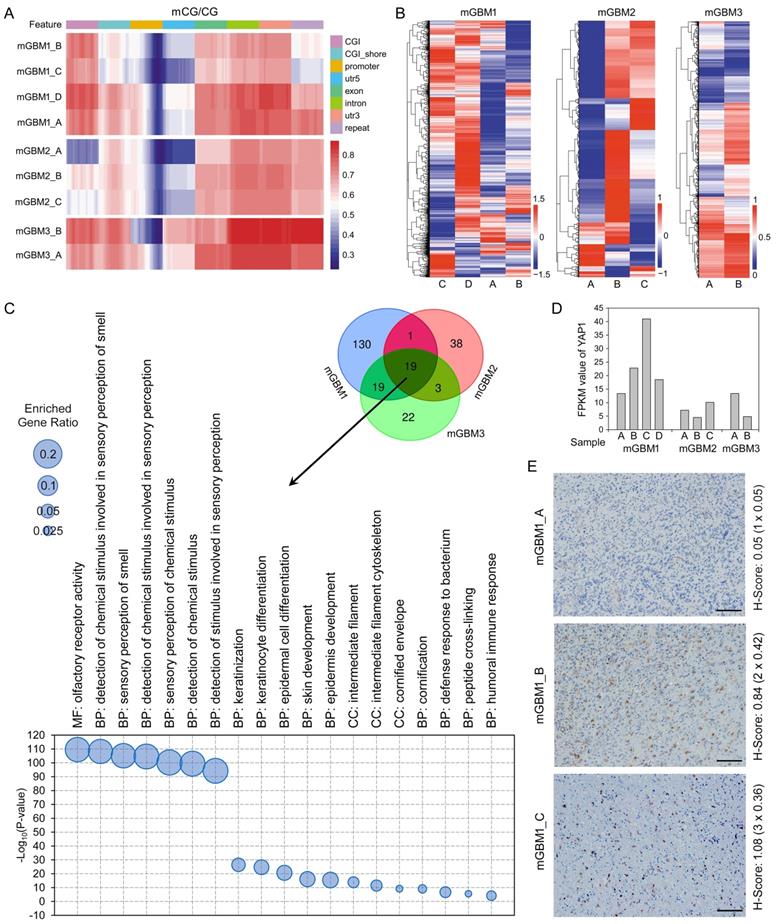
Although methylation levels in different chromosomes of tumor foci from same patients were varied, chr.22, 17, and 16 were the most frequently hypomethylated chromosomes in the three mGBM patients (Table S4). Then, we measured the methylation level in different DNA regions and found that the promoter region harbored the lowest methylation level among all measured regions (Figure 2A). Further analysis showed that the lowest methylation level in promoter was at the location close to the gene body (Figure S2D). Cluster analysis revealed distinguished promoter methylation profiles in different tumor foci from same patients (Figure 2B). To categorize genes with methylation alterations in promoter region, we performed GO analysis and found that 169, 61, and 63 genesets were enriched in mGBM1, 2, and 3, respectively (Table S5). Among these genesets, 19 genesets were consistently enriched in the three patients, including detection of chemical stimulus, epidermal cell development and differentiation, immune response, and intermediate filament (Figure 2C). To further delineate the signaling pathways potentially affected in mGBM evolution, we performed KEGG analysis between tumors from same patients (Table S6). Interestingly, Hippo pathway was consistently enriched in all samples. We then examined the key transcription factor of Hippo pathways, YAP1, in transcriptomes (Dataset 4). In patient 1, mGBM1_C showed the highest YAP1 expression (Figure 2D). IHC of YAP1 protein further confirmed higher nucleus expression of YAP1 in mGBM1_C than mGBM1_A and B (Figure 2E). It was noted that mGBM1_C had the longest evolution route in patient 1. Using TCGA_GBM database, YAP1 mRNA level in mesenchymal subtype was higher than that in proneural and classical subtypes (Figure S2E). Moreover, YAP1 expression consistently predicted worse prognosis in several glioma databases (Figure S2F-J). These data implied that Hippo/YAP1 pathway was critical for mGBM evolution. Together, our results for the first time profiled the chromosomes, DNA regions, and genes susceptible to DNA methylation alterations during mGBM evolution.
Analysis on genetic methylomes of tumor foci from the three mGBM patients. A) Heatmap diagram showing the comparison of methylated CpG with total CpG in different gene regions of tumor foci from the three mGBM patients. Red color and blue color represent hypermethylation and hypomethylation, respectively. B) Heatmap cluster of methylomes of tumor foci from the three mGBM patients. C) Venn diagram and scatter graph showing 19 GO genesets consistently enriched by genes with altered promoter CpG methylation in all three mGBM patients. D) FPKM value of YAP1 in tumor foci from the three mGBM patients. E) IHC of YAP1 in three tumor foci from mGBM1. H-Score (intensity × percentage) for each slide were labelled at the right of images. Scale bars: 100 μm.
Transcriptomic analysis revealed critical genesets in tumor foci of mGBM
We collected RNA-seq data of all tumor foci and analyzed their transcriptomes (Dataset 4). To inspect the purity of the tumor foci, we used ESTIMATE algorithm to analyze mRNA expression data of the nine tumor foci and noticed that the tumor purity value of all tumor foci was above 0.7 (Table S7), which is the most accurate cutoff value to measure tumor purity according to previous report [28]. PCA indicated that different tumor foci from same mGBM patient and different mGBM patients were transcriptionally varied (Figure S3A). Cluster analysis revealed dramatically upregulated gene clusters in mGBM1_C compared with the other three mGBM1 tumor foci (Figure 3A). GO analysis and KEGG analysis on these genes indicated that extracellular matrix (ECM), leukocyte migration, angiogenesis, and immune response-related genesets (e.g., cytokine-cytokine receptor interaction, chemokine signaling pathway, JAK-STAT signaling pathway) were significantly enriched (Figure 3B and Table S8). ECM-related genesets were also enriched in upregulated genes in mGBM1_D (Figure 3C and Table S8).
Analysis on transcriptomes of tumor foci from mGBM1 and mGBM2. A) Heatmap diagram showing the cluster of gene expression in different tumor foci from mGBM1. B) Gene enrichment of significantly changed mRNA in mGBM1_C compared with the other three tumor foci in mGBM1. C) Gene enrichment of significantly changed mRNA in mGBM1_D compared with the other three tumor foci in mGBM1. D) Representative IHC images of indicated protein markers. Scale bars: 100 μm. E) Heatmap diagram showing the cluster of gene expression in different tumor foci from mGBM2. F) Gene enrichment of significantly changed mRNA in mGBM1_A compared with the other two tumor foci in mGBM2. G) Gene enrichment of significantly changed mRNA in mGBM1_A compared with the other two tumor foci in mGBM2.
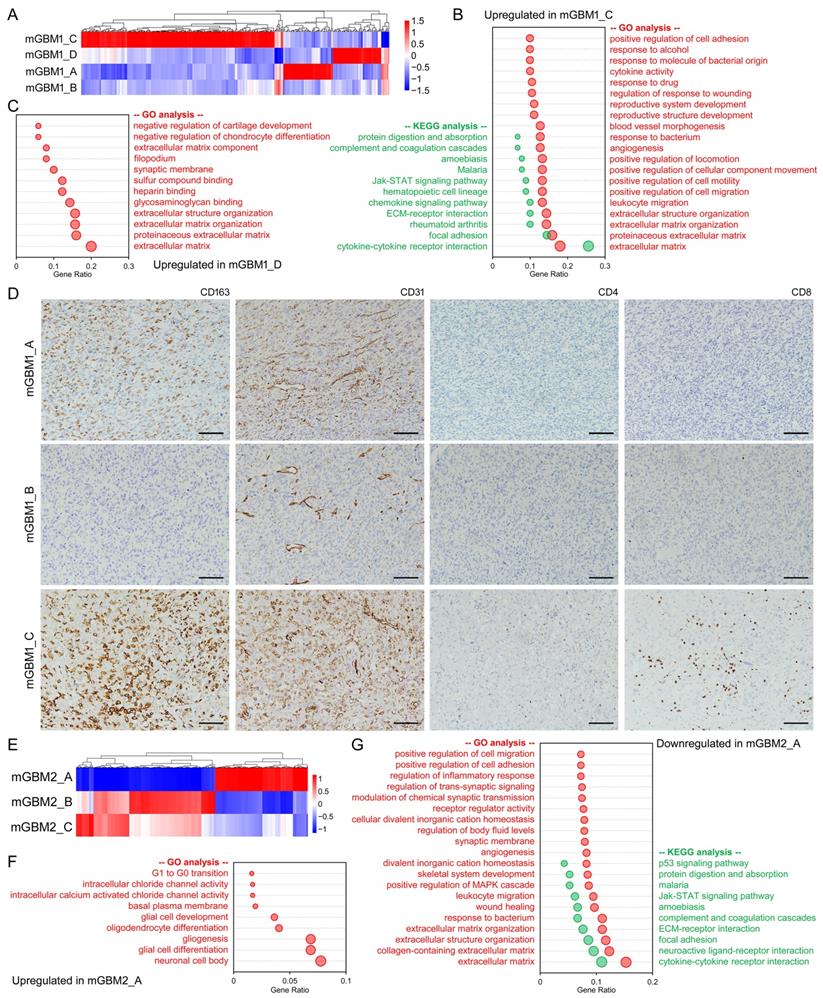
To confirm the results of enrichment in mGBM1, we performed immunohistochemistry (IHC) on mGBM1_A, B, and C using anti-CD31 (for angiogenesis), anti-CD163 (for Macrophage), anti-CD4 (for CD4+ T cell), and anti-CD8 (for CD8+ T cell). Consistently, IHC data indicated that all tested markers were much higher in mGBM1_C than the other two samples (Figure 3D). In mGBM2, two clusters were established according to gene expression profile of mGBM2_A (Figure 3E). GO and KEGG analyses showed that the upregulated genes in mGBM2_A enriched genesets on neuron, glia, and G1 to G0 transition (Figure 3F and Table S8), but downregulated genes enriched genesets related with ECM, cell migration, immune response, synapse, and angiogenesis (Figure 3G and Table S8). For mGBM3, the upregulated genes in mGBM3_A enriched genesets on ECM, cell migration, transcription regulation, cell cycle regulation, angiogenesis, cytokine-cytokine receptor interaction and signaling pathways in cancers (Figure S3B and Table S8), but the upregulated genes in mGBM3_B enriched genesets on interactions with neurons, synapses, and ion channels (Figure S3B and Table S8), pointing out that mGBM3_A might be more malignant than mGBM3_B. Combination analysis on top 100 enriched GO genesets in all three patients revealed that ECM, migration and adhesion, circulatory system, and synapse proteins were frequently enriched (Figure S3C). Together, these data indicated that tumor microenvironment including ECM, immune response, angiogenesis, and interaction with neuron were frequently altered and thus might be critically involved in mGBM progression.
Multi-omics analyses indicated intratumor and intertumor heterogeneity of mGBM
We noticed that the three tumor foci from mGBM2 harbored fewer CNV events than those from mGBM1 and mGBM3 (Figure S4A and Dataset 1). Consistently, total CNV events of mGBM2 was also fewer than mGBM1 and mGBM3 (Figure S4A and Dataset 1). Therefore, intratumor (tumors from same patient) heterogenicity was in accordance with intertumor (tumors from different patient) heterogenicity. In addition, genes with CNV could be shared by different tumor foci from same mGBM patients, but one or two tumor foci showed significantly specific CNV events (Figure S4B). For example, all gains in mGBM1_C were shared by mGBM1_A, B, and D. mGBM1_B showed the most focus-specific gains but mGBM1_A and D showed significant loss. mGBM2_A harbored the most gain and loss among three tumor foci from mGBM2. CNV in mGBM2_B and C were almost detected in mGBM2_A. In mGBM3, focus A and B showed specific gain and loss, respectively. The shared CNV in different foci from same patients indicated common origin of different foci in early stage of tumor initiation. But with evolution, different tumor foci continued to accumulate tumor-specific CNV, which were importantly involved in tumor heterogeneity. We also analyzed promoter methylation and found that genes with promoter hypomethylation in one sample compared to the other samples from same patients were few overlayed with each other (Figure 4A and Dataset 3). The percentage of focus-specific promoter-hypomethylated genes to full promoter-hypomethylated genes in tumor focus was 79.3% (mGBM1_A), 46.2% (mGBM1_B), 73.4% (mGBM1_B), 63% (mGBM1_B), 98.4% (mGBM2_A), 57.1% (mGBM2_B), 75.9% (mGBM2_C), 91% (mGBM3_A), and 72.9% (mGBM3_B), respectively. Interestingly, although promoter methylation is critical regulation mechanism on gene expression, only less than 20% genes with promoter hypomethylation finally showed increased mRNA levels (Table S9). Thus, a large number of genes with CNV shared by two or more tumor foci from same patients, even though some samples showed unique CNV. For promoter hypomethylation, however, most changed events were focus-specific in same patients. These data implied that genetic changes and methylation status alterations might not be synchronize during tumor evolution.
Molecular subtype classification of tumor foci from the three mGBM patients. A) Venn diagram of counts of genes with promoter hypomethylation in individual tumor foci of three mGBM samples. B) Molecular subtype of individual tumor focus. C) Percentage of different molecular subtypes of GBM in mGBM and uGBM, respectively. D) The MRI images showing comparison of original tumor foci (mGBM1_B-D) with newly developed tumor foci (mGBM1_R1 and R2) after surgery and standard radio- and chemo-therapy. E) Schematic diagram of commonly altered genesets in our mGBM samples, mGBM vs. uGBM (TCGA_GBM), and mesenchymal vs. non-mesenchymal (TCGA_GBM).
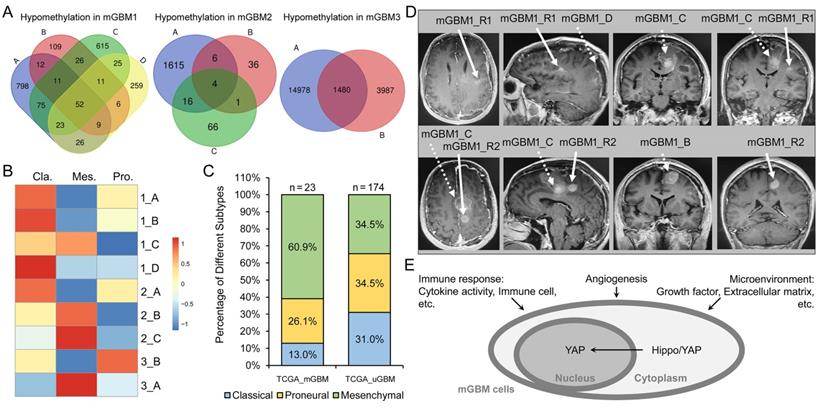
We then explored the molecular subtype for each tumor focus according to previously reported algorithm by Wang et al [8]. Transcriptomic analysis showed that mGBM1_A, B, and D were classical subtype, but mGBM1_C was mesenchymal subtype (Figure 4B). Interestingly, mGBM1_A, B, and D harbored high amplification of EGFR gene (Table S3), which supported their classical subtype classification [7]. The mesenchymal feature of mGBM1_C was consistent with the previous results that tumor microenvironment critically contributes to the development of mesenchymal subtype in GBM [8, 29]. In addition, critical mesenchymal transcriptional factors were significantly higher in mGBM1_C, than the other samples (Figure S4C and Dataset 4). Hedgehog signaling pathway was enhanced as expected in mesenchymal subtype (Figure S4C and Dataset 4). In mGBM2, both mGBM2_B and mGBM2_C were mesenchymal subtype (Figure 4B), but mGBM2_A was classical subtype with highest EGFR amplification in patient 2 (Figure 4B and Table S3). In addition, downregulated genes in mGBM2_A compared to mGBM2_B and C enriched genesets on ECM, angiogenesis, and immune response, further confirming the contribution of microenvironment to mesenchymal subtype in GBM. In patient 3, mGBM3_A and mGBM3_B were mesenchymal and proneural, respectively (Figure 4B). Analysis on TCGA GBM cases with MRI documents described by Liu et al. [25] showed that mesenchymal subtype was more prevalent in mGBM than uGBM (14 in 30 mGBM cases (46.7%) versus 60 in 211 uGBM (28.4%) (Figure 4C). The study by Abou-El-Ardat et al. indicated that mesenchymal subtype existed in all mGBM cases from their cohort [6]. It has been thought that mesenchymal subtype of GBM bears stronger recurrence potential than the other subtypes [30-32]. In patient 1, we documented the post-operation data and noticed that there were two recurrent tumor foci (mGBM1_R1 and R2) by 35 days after surgery. It was noted that both R1 and R2 were very close to mGBM1_C, which was identified as mesenchymal subtype in mGBM1 (Figure 4D). By 165 days after surgery, two more new lesions were detected with mGBM1_R1 as the largest one (Figure S4D). Thus, mesenchymal subtype was a major molecular subtype for mGBM and the mesenchymal tumor focus might be critically contributed to the relapse of mGBM.
Besides previously reported core pathways for mGBM [6], including TP53, Receptor Tyrosine Kinases, CDKN2A/2B, and PI3K-AKT (Table S3 and Dataset 1), we also explored genesets correlated with mGBM through combination of analysis on our mGBM samples (CNV, promoter methylation, and transcriptome) and analysis on TCGA database, which have not yet been evaluated in previous mGBM-related work. Our data showed that genesets on immune response, cell-extracellular matrix interaction, and angiogenesis were enriched in our mGBM samples as well as mGBM vs. uGBM and mesenchymal vs. non-mesenchymal (Figure 4E and Table S10). In addition, Hippo/YAP signaling pathway was also enriched by our mGBM samples, mGBM vs. uGBM, and mesenchymal vs. non-mesenchymal (Figure 4E and Table S10). Together, mGBM might frequently involve mesenchymal subtype, as well as, increased immune response, interaction between tumor and microenvironment, angiogenesis, and Hippo/YAP signaling pathway.
LIF and CCL2 were highly expressed by mesenchymal tumor focus in mGBM
Our current study and previous mGBM studies showed that mGBM were significantly associated with the mesenchymal subtype [6, 25], revealing mesenchymal subtype a typical feature of mGBM. It has been known that immune microenvironment is responsible for development of mesenchymal subtype in GBM [8, 29] and results in treatment resistance [32, 33]. In our study, both transcriptomic and methylomic analyses indicated the involvement of immune response-related genes in the evolution of tumor foci of mGBM, and it is well-known that cytokines play critical roles for immune response. Thus, we investigated the expression characteristics of cytokines in mesenchymal subtype tumor foci vs. non-mesenchymal subtype ones from same mGBM patients. For this purpose, we had got the list of 187 cytokines from Uniprot database using cytokine as keyword (Table S11) and analyzed the list in transcriptomes of tumor foci from same mGBM patients. We used 5-fold upregulation as threshold to select interesting cytokines. Intriguingly, the mesenchymal tumor foci in the three mGBM patients consistently highly expressed two cytokines, i.e., LIF and CCL2 (Figure S5A and Table S12). IHC result further confirmed high expression of LIF and CCL2 in mGBM1_C compared to mGBM1_A and B (Figure 5A). Since CCL2 plays strong chemotaxis function to recruit macrophage and LIF activates STAT3 pathway [34-40], we performed IHC to examine macrophage infiltration using CD86 antibody and activation of STAT3 using p-STAT3 antibody. The data indicated the consistence between CCL2 and CD68, as well as, LIF and p-STAT3 (Figure 5A).
Expression and clinical significance of LIF and CCL2 in GBM. A) Representative IHC images of indicated proteins on mGBM1_A-C. For p-STAT3 on mGBM1_C, there is a 2× enlargement (small rectangle to large rectangle) to show the nuclear localization of brown p-STAT3 signal. Scale bars: 100 μm. B) Representative Immunofluorescence images of indicated proteins on mGBM1_C. Dapi is used to show cell nuclei. Scale bars: 20 μm.
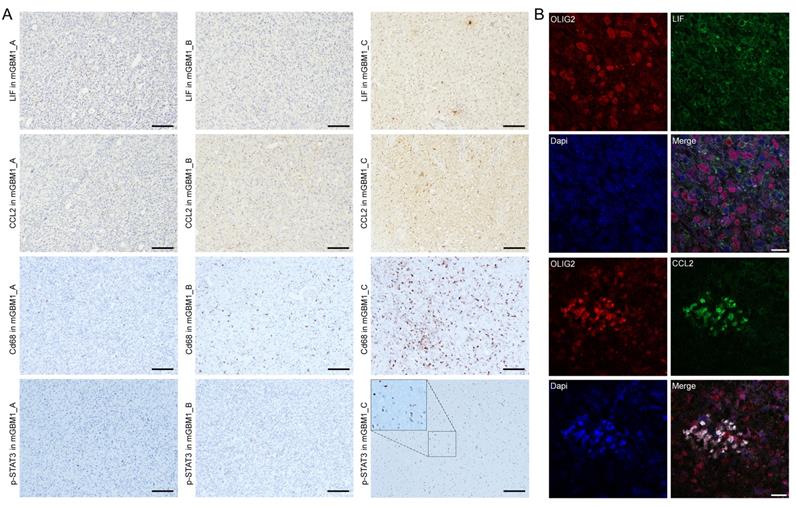
To investigate the cell source of the two cytokines, we checked literature and analyzed data of the single cell sequencing on GBM by Wang et al. [41]. CCL2 was found expressed by GBM cells and macrophages [34-37], but LIF mainly expressed in GBM cells [38-40], which were also supported by single cell sequencing data (Figure S5B). Through immunofluorescence, we found that LIF rarely expressed in macrophages labelled with CD68 (Figure S5C), but highly expressed in GBM cells labelled with Olig2 (Figure 5B). However, CCL2 was localized in both GBM cells and macrophages (Figure 5B and S5C).
LIF and CCL2 were tightly correlated with poor prognosis of GBM patients
Then, we analyzed the expression of LIF and CCL2 in multiple GBM databases, including TCGA_GBM, CGGA, Rembrandt, and Gravendeel databases. In the four GBM databases, LIF mRNA level and CCL2 mRNA level were positively correlated (Figure S6A) and the expression of LIF and CCL2 in mesenchymal subtype was significantly higher than the other subtypes (Figure 6A and S6B). we also investigated the combined expression of LIF and CCL2 in the context of GBM molecular subtype. In TCGA_GBM databases, among 173 GBM cases with LIFHigh/CCL2High, 60.1% were mesenchymal subtype. Among 142 GBM cases with LIFLow/CCL2Low, only 9.2% were mesenchymal subtype, but 64.1% were proneural subtype (Figure 6B), confirming the tight correlation of high levels of LIF and CCL2 with mesenchymal subtype in GBM. In addition, we noticed that 0.5% (1 in 185) GBM cases with LIFHigh/CCL2High were Non G-CIMP, but 22.2% (39 in 176) GBM cases with LIFLow/CCL2Low were Non G-CIMP, indicating that LIF and CCL2 was also positively correlated to the development of Non G-CIMP GBM (Figure S6C). We then performed IHC on a tissue microarray containing 169 glioma cases to evaluate the prognostic significance of LIF and CCL2 (Figure 6C). Survival analysis using our own glioma tissue microarray and four GBM databases consistently showed that LIF and CCL2 predicted poor survival of GBM patients (Figure 6D and S6D). Moreover, patients with LIFHigh/CCL2High had significantly shorter overall survival time than those with LIFLow/CCL2Low (Figure 6D).
Clinical significance of LIF and CCL2 in GBM. A) mRNA expression of LIF and CCL2 in different molecular subtypes using TCGA_GBM database. B) Percentage of different molecular subtypes of GBM with LIFHigh/CCL2High and LIFLow/CCL2Low, respectively. C) Representative IHC images of indicated proteins on glioma tissue microarray. Scale bars: 100 μm. D) Kaplan-Meier survival analysis on protein levels of LIF or/and CCL2 in our glioma tissue microarray and mRNA levels of LIF or/and CCL2 in TCGA_GBM database. E) Measurement on protein levels of LIF and CCL2 in serum from 2 mGBM patients (mGBM1 and mGBM2) and additional 5 uGBM patients through ELISA.
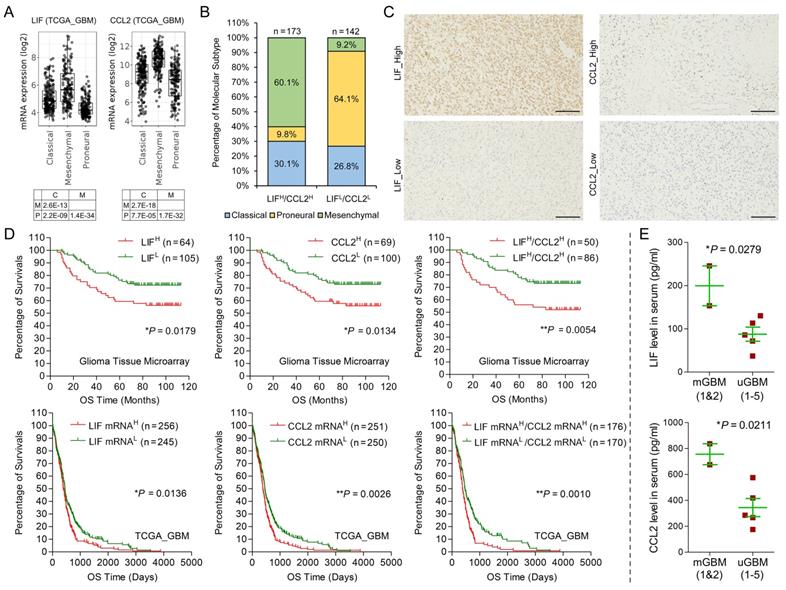
Radiation and chemotherapy with alkylating agents, such as Temozolomide (TMZ), are the most prevalent first-line treatment regimens for GBM treatment. In clinic practice, radiation and chemotherapy can be used individually (single regimen) or conjointly (radio-chemo) [1, 2]. We analyzed therapeutic effects of single regimen therapy or radio-chemo therapy using cases of TCGA_GBM database. For single regimen, the survival curve of patients with LIFHigh/CCL2High was similar to that of patients with LIFHigh/CCL2High (Figure S6E). For radio-chemo therapy, however, patients with LIFLow/CCL2Low had significantly longer survival time than those with LIFHigh/CCL2High (Figure S6E). In addition, both mesenchymal and proneural subtype GBM showed similar response to single regimen therapy, but proneural subtype GBM could benefit from radio-chemo therapy much more than mesenchymal subtype GBM. Interestingly, we noticed that the survival curves of LIFHigh/CCL2High and LIFLow/CCL2Low resembled the survival curves of Mesenchymal and Proneural, respectively (Figure S6E). These results implied that LIF and CCL2 might be related with sensitivity of GBM cells to alkylating agents. To further examine this point, we stimulated two GBM cell lines, LN18 and LN229, with recombinant human LIF and CCL2 followed by TMZ treatment. MTT assay showed that LIF and CCL2 stimulation effectively elevated IC50 of TMZ in both cell lines compared with vehicle treatment (Figure S6F). We also examined the protein levels of CCL2 and LIF in serum from 2 mGBM patients (mGBM1 and mGBM2) and additional 5 uGBM patients (Table S13) through ELISA. The data showed that the serum levels of the two cytokines in mGBM were significantly higher than those in uGBM (Figure 6E). Together, LIF and CCL2 were associated with mesenchymal and Non G-CIMP subtypes and predicted poor prognosis of GBM patients.
LIF and CCL2 induced mesenchymal-like transcriptome in GBM cells
To evaluate the involvement of LIF and CCL2 in GBM, we performed Gene Set Enrichment Analysis (GSEA) [42, 43] using three TCGA_GBM sub-datasets: mGBM vs. uGBM [25], LIFHigh/CCL2High vs. LIFLow/CCL2Low, and mesenchymal subtype vs. other subtypes. In all three sub-datasets, GSEA consistently showed that the top one enriched geneset was Verhaak Glioblastoma Mesenchymal in the context of curated genesets (Molecular Signatures Database C2) (Figure 7A), and majority enriched genesets were overlapped among the three sub-datasets (Figure S7A and Table S14). In the context of Hallmark genesets, the enriched genesets by mGBM vs. uGBM, LIFHigh/CCL2High vs. LIFLow/CCL2Low, and mesenchymal subtype vs. other subtypes were also significantly overlapped (Figure S7B and Table S15), and Epithelial Mesenchymal Transition (Figure 7B), TNFA Signaling Via NFKB, Inflammatory Response, and IL6 JAK STAT3 Signaling were consistently among top-ranked genesets (Table S15). GSEA in the contexts of GO and Oncogenic Signature indicated that the most of enriched genesets were shared by the three sub-datasets (Figure S7C and S7D and Table S16 and S17). We also analyzed TCGA_GBM database and compared the transcriptomic profiles of the three sub-genesets. The data showed that transcriptomic profile of GBM with LIFHigh/CCL2High was significantly correlated with that of mGBM or mesenchymal GBM, but transcriptomic profile of GBM with LIFLow/CCL2Low was significantly correlated with that of uGBM or non-mesenchymal GBM (Figure 7C). These data collectively implied that LIF and CCL2 produced similar mRNA expression profiles resembled to that of mGBM or mesenchymal GBM. Moreover, LIF and CCL2 not only prevalent in mGBM but responsible for mesenchymal subtype development in GBM patients.
The correlations among LIF/CCL2 co-expression, mGBM, and mesenchymal GBM. A) Enrichment of Verhaak_Glioblastoma_Mesenchymal geneset by different GBM phenotypes from TCGA_GBM database through GSEA. B) Enrichment of Hallmark_Epithelial_Mesenchymal_Transition geneset by different GBM phenotypes from TCGA_GBM database through GSEA. C) Cluster heatmap of transcriptomes of different GBM phenotypes from TCGA_GBM database through GSEA. D) Enrichment of Verhaak_Glioblastoma_Mesenchymal geneset by LN18 cells treated with LIF/CCL2 vs. vehicle. E) Enrichment of Hallmark_Epithelial_Mesenchymal_Transition geneset by LN18 cells treated with LIF/CCL2 vs. vehicle. F) Venn diagram of genes significantly upregulated in LN18 cells treated with LIF/CCL2 vs. vehicle and mesenchymal subtype vs. other subtypes from TCGA_GBM database. FC means Fold Change. G) Schematic diagram of tumor initiation and progression of mGBM.
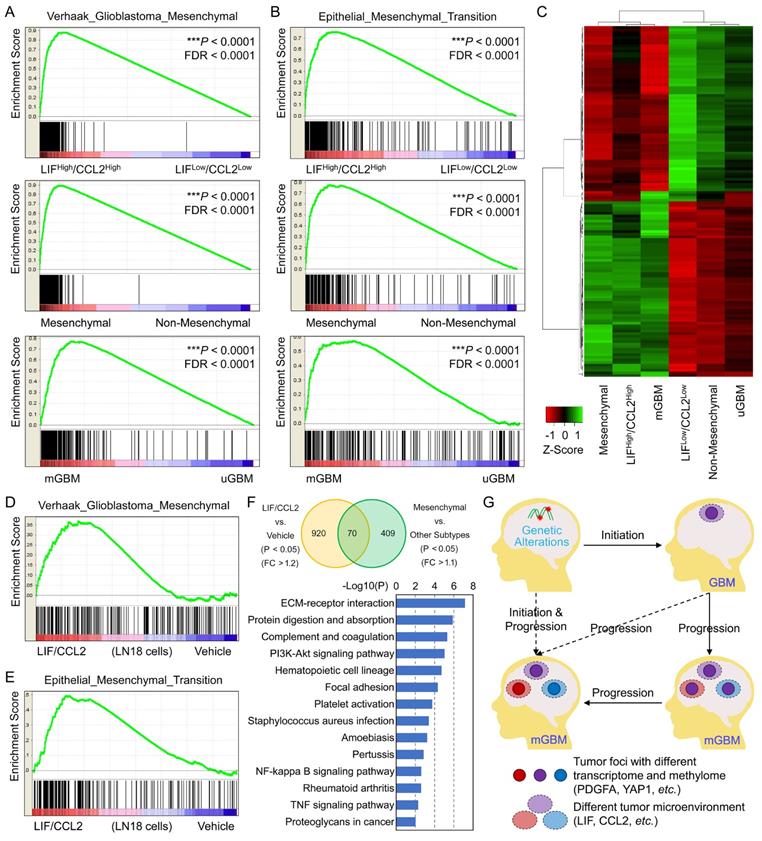
Finally, we examined the effects of LIF and CCL2 on GBM cells through treating LN18 cells with the mixture of recombinant human LIF and CCL2 followed by RNA-seq for transcriptomic profiling. Analysis on transcriptome data (Dataset 5) showed that the treatment indeed resulted in the enrichment of mesenchymal signature (Figure 7D). Additionally, neural and proneural signature genes were enriched by vehicle treatment, but no enrichment of classical (Figure S7E-G). In addition, through GSEA on Hallmark genesets (Table S18), we found the most significantly enriched genesets were Epithelial Mesenchymal Transition (Figure 7E), Inflammatory Response, and IL6 JAK STAT3 Signaling, which was consistent with the results of database analysis above. To describe mesenchymal-related genes induced by LIF and CCL2 treatment in GBM cells, we compared genes upregulated in LIF/CCL2 vs. Vehicle (P<0.05 and Fold-Change>1.2) and those upregulated in mesenchymal subtype vs. other subtypes (P<0.05 and Fold-Change>1.1), which revealed 70 genes consistently increased (Figure 7F and Table S19). KEGG analysis indicated these genes were mainly categorized into genesets related with ECM and NFKB (Figure 7F). Thus, our findings supported that LIF and CCL2 were tightly implicated in mesenchymal subtype of GBM.
Discussion
In this study, we performed WGS, WGBS, and RNA-seq to profile genetic, methylomic and transcriptomic features of mGBM patients. Pathological and genetic examination confirmed that all tumor foci from the three mGBM patients were primary GBM featured with gain of chr.7 and loss of chr.10, lacking IDH1/2 mutations, high frequency of TERT promoter mutation. High frequency of genetic alterations of tumor suppressors (e.g., PTEN and CDKN2A/CDKN2B) and oncogenes (e.g., PDGFA and EGFR) suggested that these cancer driver genes might be responsible for initiation of mGBM but not contribute to the progression of mGBM. Instead, the most significant difference among tumor foci from same patient was microenvironment-related genes (such as LIF and CCL2), emphasizing the critical involvement of these genes in various tumor evolution routes (Figure 7G). For mGBM1 and mGBM3, all tumor foci shared critical oncogenic alterations of GBM, including gain of chromosome 7, loss of chromosome 10, and many significantly mutated genes, supporting their monoclonal origin for mGBM1 and 3, which is consistent with report by Abou-El-Ardat et al. [6]. For mGBM2, focus A and B showed consistent chromosomal alterations, but focus C lacked of chromosomal alterations, which might imply different origin of mGBM2_C with A and B, or differentially evolved at very early stage of GBM initiation. Similar case has also been reported by Lombardi et al. [44].
Whole genome methylation, especially methylation alterations in promoter area, pivotally regulates gene expression. Through analysis on the methylomes of the nine tumor foci, we found that chr.22, 17, and 16 were consistently hypomethylated in all tumor foci from the three mGBM patients. GO analysis showed that promoter methylation levels of olfactory transduction-related genes were significantly altered in the three mGBM patients. It has been reported that olfactory-related genes are actually involved in GBM development and could serve as prognostic markers for GMB [45-47]. Methylomic analysis also showed critical involvement of Hippo/YAP1 signaling axis. Analysis on public glioma databases revealed higher expression of YAP1 in mesenchymal subtype than other subtypes and shortened survival of patients with high YAP1 expression compared to those with low YAP1 expression. Our previous work also showed critical involvement of YAP1 in GBM [48, 49]. Thus, our findings in mGBM implied that the promoter methylation might be responsible for the regulation of olfactory-related genes and Hippo/YAP1 pathway in GBM.
Analysis on transcriptomic profiles of the nine tumor foci suggested that gene clusters of different tumor foci from same patients were distinguished from each other. As a result, tumor foci from same patients showed varied molecular subtypes and predicted varied prognosis, further confirming intratumor heterogeneity. Interestingly, we noticed that ECM and immune system were pivotally involved in mGBM evolution. Genes related with ECM and immune response were found to be dramatically changed among tumor foci from same patients. It has been known that ECM is altered in GBM and plays critical role in invasive growth of GBM cells [50-52]. Moreover, immune microenvironment is responsible for development of mesenchymal subtype in GBM [8, 29] and results in treatment resistance [32, 33]. We also noticed that interaction with neuron and normal synapse functions were involved in evolution of tumor foci. It has been found that there is direct communication between neurons and glioma cells through synapses and the integration of synaptic and electrical into neural circuits promotes glioma progression [53, 54].
Our work intriguingly revealed that two cytokines, LIF and CCL2, were positively correlated in expression levels and produced a phenotype resembling mesenchymal subtype GBM with poor prognosis. It is hard to define molecular subtype of GBM cell line, but our work indicated that treatment of CCL2 and LIF altered gene expression profiles in GBM cells, which significantly enriched signature genes of mesenchymal subtype, but failed to enrich signature genes of other molecular subtypes. LIF and CCL2 have been found to be involved in glioma [39, 55, 56], but their relationships with molecular subtypes of GBM have not yet been described. Herein, we noticed that high expression of both cytokines was tightly correlated with mesenchymal subtype but low expression of both cytokines was significantly related with proneural subtype. Previous reports indicated that mGBM mainly assumes mesenchymal subtype almost half (47%) the mGBM belonged to the mesenchymal subtype, and examined 6 tumor foci and showed that 1 was associated with mesenchymal and the other 5 were associated with both mesenchymal and classical subtypes [6, 25]. Thus, LIF and CCL2 might be responsible for high percentage of mesenchymal subtype tumor focus in mGBM and the two cytokines could help diagnosis of molecular subtypes of GBM in histopathological examination.
Intertumor and intratumor heterogeneity of GBM is believed to render resistance of GBM patients to routine treatments [18, 57]. According to our results, the mGBM reported here was highly heterogenous and might be resistant to radio and chemotherapy. Consistently, the patient reported here developed two new neoplasms in brain at 35-day after surgery and progressed to form two more neoplasms by 165-day after surgery. Thus, mGBM patients assumed high recurrence rate possibly due to the high heterogeneity.
We should mention that the size of patient samples in this study were limited and the functions of CCL2 and LIF in mGBM have not been examined with animal models, which were worth further pursuing in the following study to delineate the mechanisms on the formation of mGBM. Altogether, the integrative omics analyses confirmed existence of various GBM molecular subtypes from same patients and revealed pivotal impact of tumor microenvironment on molecular subtypes during tumor progression. Key genetic drivers were actually shared by all tumor foci from same patients, and thus might not be responsible for tumor evolution. Instead, extracellular components, including LIF, CCL2, PDGFA, Hippo/YAP1, as well as, immune responses and angiogenesis, might pivotally participate in development of intratumor heterogeneity through remodeling methylome and transcriptome of tumor foci from same mGBM patients.
Methods
Patient and samples
The three patients were hospitalized in the Department of Neurosurgery, Xinqiao Hospital of Third Military Medical University in 2019 and 2020 and performed operation after a clear evaluation 3 days later. This study was approved by the Medical Ethical Committees of Xinqiao Hospital and Southwest Hospital, Third Military Medical University. Written informed consents were obtained from the patients. Glioma tissue microarray (HBraG169Su01) was purchased from Shanghai Outdo Biotech CO., LTD. (http://www.superchip.com.cn/index.html).
More details on Methods were described in supplementary materials.
Abbreviations
Chr.: chromosome; ECM: extracellular matrix; GO: gene ontology; GSEA: gene Set Enrichment Assay; GBM: glioblastoma; mGBM: multifocal GBM; PCA: principal component analysis; WGBS: whole genome bisulfite sequencing; WGS: whole-genome sequencing.
Supplementary Material
Supplementary figures and materials and methods.
Supplementary table 1.
Supplementary dataset 1.
Supplementary dataset 2.
Supplementary dataset 3.
Supplementary dataset 4.
Supplementary dataset 5.
Acknowledgements
This work was supported by: The National Key Research and Development Program of China (2017YFC1309004 to Y.W.); The National Natural Science Foundation of China (81972365 to Y.W., 81972360 to S.-Q.L., and 81922056 to Y.S.); The Joint Research Foundation from Chongqing Science & Technology Bureau and Chongqing Municipal Health Commission (2018ZDXM011 to S.-Q.L.); The Science and Technology Innovation Project of Chongqing Science and Technology Commission (cstc2018jcyjAX0538 to Y.W.). We thank Biobank of Institute of Pathology (Southwest Hospital, Third Military Medical University) for assistance in the study.
Ethics approval and consent to participate
This study was approved by the Medical Ethical Committees of Xinqiao Hospital and Southwest Hospital, Third Military Medical University. Written informed consents were obtained from the patients.
Data availability
All data are available in the manuscript and its supplemental material.
Author Contributions
YW, XWB, and SQL design this study; SQL, ZF, QRL, JZ, HML, QJG, XXY, MM, JH, YXW, and YQ prepare samples and perform experiments; ZF, LY, XL, YX, ZXZ, GHH, YS, XHY, and WY acquire and organize data; YW, YS, XHY, PK, and ZS analyze data; YW and XWB write the manuscript. All authors read and approved the final manuscript.
Competing Interests
The authors have declared that no competing interest exists.
References
1. Louis DN, Perry A, Reifenberger G, von Deimling A, Figarella-Branger D, Cavenee WK. et al. The 2016 World Health Organization Classification of Tumors of the Central Nervous System: a summary. Acta Neuropathol. 2016;131:803-20
2. Hassaneen W, Levine NB, Suki D, Salaskar AL, de Moura Lima A, McCutcheon IE. et al. Multiple craniotomies in the management of multifocal and multicentric glioblastoma. Clinical article. J Neurosurg. 2011;114:576-84
3. Patil CG, Yi A, Elramsisy A, Hu J, Mukherjee D, Irvin DK. et al. Prognosis of patients with multifocal glioblastoma: a case-control study. J Neurosurg. 2012;117:705-11
4. Lou E, Peters KB, Sumrall AL, Desjardins A, Reardon DA, Lipp ES. et al. Phase II trial of upfront bevacizumab and temozolomide for unresectable or multifocal glioblastoma. Cancer Med. 2013;2:185-95
5. Krex D, Mohr B, Appelt H, Schackert HK, Schackert G. Genetic analysis of a multifocal glioblastoma multiforme: a suitable tool to gain new aspects in glioma development. Neurosurgery. 2003;53:1377-84 discussion 84
6. Abou-El-Ardat K, Seifert M, Becker K, Eisenreich S, Lehmann M, Hackmann K. et al. Comprehensive molecular characterization of multifocal glioblastoma proves its monoclonal origin and reveals novel insights into clonal evolution and heterogeneity of glioblastomas. Neuro Oncol. 2017;19:546-57
7. Verhaak RG, Hoadley KA, Purdom E, Wang V, Qi Y, Wilkerson MD. et al. Integrated genomic analysis identifies clinically relevant subtypes of glioblastoma characterized by abnormalities in PDGFRA, IDH1, EGFR, and NF1. Cancer Cell. 2010;17:98-110
8. Wang Q, Hu B, Hu X, Kim H, Squatrito M, Scarpace L. et al. Tumor Evolution of Glioma-Intrinsic Gene Expression Subtypes Associates with Immunological Changes in the Microenvironment. Cancer Cell. 2017;32:42-56 e6
9. Whitfield ML, Sherlock G, Saldanha AJ, Murray JI, Ball CA, Alexander KE. et al. Identification of genes periodically expressed in the human cell cycle and their expression in tumors. Mol Biol Cell. 2002;13:1977-2000
10. Sottoriva A, Spiteri I, Piccirillo SG, Touloumis A, Collins VP, Marioni JC. et al. Intratumor heterogeneity in human glioblastoma reflects cancer evolutionary dynamics. Proc Natl Acad Sci U S A. 2013;110:4009-14
11. Bhat KPL, Balasubramaniyan V, Vaillant B, Ezhilarasan R, Hummelink K, Hollingsworth F. et al. Mesenchymal differentiation mediated by NF-kappaB promotes radiation resistance in glioblastoma. Cancer Cell. 2013;24:331-46
12. Ozawa T, Riester M, Cheng YK, Huse JT, Squatrito M, Helmy K. et al. Most human non-GCIMP glioblastoma subtypes evolve from a common proneural-like precursor glioma. Cancer Cell. 2014;26:288-300
13. Noushmehr H, Weisenberger DJ, Diefes K, Phillips HS, Pujara K, Berman BP. et al. Identification of a CpG island methylator phenotype that defines a distinct subgroup of glioma. Cancer Cell. 2010;17:510-22
14. de Souza CF, Sabedot TS, Malta TM, Stetson L, Morozova O, Sokolov A. et al. A Distinct DNA Methylation Shift in a Subset of Glioma CpG Island Methylator Phenotypes during Tumor Recurrence. Cell Rep. 2018;23:637-51
15. Wiestler B, Capper D, Sill M, Jones DT, Hovestadt V, Sturm D. et al. Integrated DNA methylation and copy-number profiling identify three clinically and biologically relevant groups of anaplastic glioma. Acta Neuropathol. 2014;128:561-71
16. Reinhardt A, Stichel D, Schrimpf D, Sahm F, Korshunov A, Reuss DE. et al. Anaplastic astrocytoma with piloid features, a novel molecular class of IDH wildtype glioma with recurrent MAPK pathway, CDKN2A/B and ATRX alterations. Acta Neuropathol. 2018;136:273-91
17. Hwang T, Mathios D, McDonald KL, Daris I, Park SH, Burger PC. et al. Integrative analysis of DNA methylation suggests down-regulation of oncogenic pathways and reduced somatic mutation rates in survival outliers of glioblastoma. Acta Neuropathol Commun. 2019;7:88
18. Cancer Genome Atlas Research N. Comprehensive genomic characterization defines human glioblastoma genes and core pathways. Nature. 2008;455:1061-8
19. Hodgson JG, Yeh RF, Ray A, Wang NJ, Smirnov I, Yu M. et al. Comparative analyses of gene copy number and mRNA expression in glioblastoma multiforme tumors and xenografts. Neuro Oncol. 2009;11:477-87
20. Brennan CW, Verhaak RG, McKenna A, Campos B, Noushmehr H, Salama SR. et al. The somatic genomic landscape of glioblastoma. Cell. 2013;155:462-77
21. Turcan S, Rohle D, Goenka A, Walsh LA, Fang F, Yilmaz E. et al. IDH1 mutation is sufficient to establish the glioma hypermethylator phenotype. Nature. 2012;483:479-83
22. Flavahan WA, Drier Y, Liau BB, Gillespie SM, Venteicher AS, Stemmer-Rachamimov AO. et al. Insulator dysfunction and oncogene activation in IDH mutant gliomas. Nature. 2016;529:110-4
23. Fu X, Chin RM, Vergnes L, Hwang H, Deng G, Xing Y. et al. 2-Hydroxyglutarate Inhibits ATP Synthase and mTOR Signaling. Cell Metab. 2015;22:508-15
24. Dang L, White DW, Gross S, Bennett BD, Bittinger MA, Driggers EM. et al. Cancer-associated IDH1 mutations produce 2-hydroxyglutarate. Nature. 2009;462:739-44
25. Liu Q, Liu Y, Li W, Wang X, Sawaya R, Lang FF. et al. Genetic, epigenetic, and molecular landscapes of multifocal and multicentric glioblastoma. Acta Neuropathol. 2015;130:587-97
26. Killela PJ, Reitman ZJ, Jiao Y, Bettegowda C, Agrawal N, Diaz LA Jr. et al. TERT promoter mutations occur frequently in gliomas and a subset of tumors derived from cells with low rates of self-renewal. Proc Natl Acad Sci U S A. 2013;110:6021-6
27. Ceccarelli M, Barthel FP, Malta TM, Sabedot TS, Salama SR, Murray BA. et al. Molecular Profiling Reveals Biologically Discrete Subsets and Pathways of Progression in Diffuse Glioma. Cell. 2016;164:550-63
28. Yoshihara K, Shahmoradgoli M, Martinez E, Vegesna R, Kim H, Torres-Garcia W. et al. Inferring tumour purity and stromal and immune cell admixture from expression data. Nat Commun. 2013;4:2612
29. Kaffes I, Szulzewsky F, Chen Z, Herting CJ, Gabanic B, Velazquez Vega JE. et al. Human Mesenchymal glioblastomas are characterized by an increased immune cell presence compared to Proneural and Classical tumors. Oncoimmunology. 2019;8:e1655360
30. Sa JK, Chang N, Lee HW, Cho HJ, Ceccarelli M, Cerulo L. et al. Transcriptional regulatory networks of tumor-associated macrophages that drive malignancy in mesenchymal glioblastoma. Genome Biol. 2020;21:216
31. Olmez I, Love S, Xiao A, Manigat L, Randolph P, McKenna BD. et al. Targeting the mesenchymal subtype in glioblastoma and other cancers via inhibition of diacylglycerol kinase alpha. Neuro Oncol. 2018;20:192-202
32. Azam Z, To ST, Tannous BA. Mesenchymal Transformation: The Rosetta Stone of Glioblastoma Pathogenesis and Therapy Resistance. Adv Sci (Weinh). 2020;7:2002015
33. Ning W, Qiu Z, Ji X, Wang X, An Y, Wang S. et al. The Prognostic Value of EMT in Glioma and its Role in the Glioma Immune Microenvironment. J Mol Neurosci. 2020;70:1501-11
34. Shono K, Yamaguchi I, Mizobuchi Y, Kagusa H, Sumi A, Fujihara T. et al. Downregulation of the CCL2/CCR2 and CXCL10/CXCR3 axes contributes to antitumor effects in a mouse model of malignant glioma. Sci Rep. 2020;10:15286
35. Chen Z, Feng X, Herting CJ, Garcia VA, Nie K, Pong WW. et al. Cellular and Molecular Identity of Tumor-Associated Macrophages in Glioblastoma. Cancer Res. 2017;77:2266-78
36. Takeshima H, Kuratsu J, Takeya M, Yoshimura T, Ushio Y. Expression and localization of messenger RNA and protein for monocyte chemoattractant protein-1 in human malignant glioma. J Neurosurg. 1994;80:1056-62
37. Wei Q, Singh O, Ekinci C, Gill J, Li M, Mamatjan Y. et al. TNFalpha secreted by glioma associated macrophages promotes endothelial activation and resistance against anti-angiogenic therapy. Acta Neuropathol Commun. 2021;9:67
38. Inda MM, Bonavia R, Mukasa A, Narita Y, Sah DW, Vandenberg S. et al. Tumor heterogeneity is an active process maintained by a mutant EGFR-induced cytokine circuit in glioblastoma. Genes Dev. 2010;24:1731-45
39. Penuelas S, Anido J, Prieto-Sanchez RM, Folch G, Barba I, Cuartas I. et al. TGF-beta increases glioma-initiating cell self-renewal through the induction of LIF in human glioblastoma. Cancer Cell. 2009;15:315-27
40. Zhu S, Yang N, Guan Y, Wang X, Zang G, Lv X. et al. GDF15 promotes glioma stem cell-like phenotype via regulation of ERK1/2-c-Fos-LIF signaling. Cell Death Discov. 2021;7:3
41. Wang LB, Karpova A, Gritsenko MA, Kyle JE, Cao S, Li Y. et al. Proteogenomic and metabolomic characterization of human glioblastoma. Cancer Cell. 2021;39:509-28 e20
42. Mootha VK, Lindgren CM, Eriksson KF, Subramanian A, Sihag S, Lehar J. et al. PGC-1alpha-responsive genes involved in oxidative phosphorylation are coordinately downregulated in human diabetes. Nat Genet. 2003;34:267-73
43. Subramanian A, Tamayo P, Mootha VK, Mukherjee S, Ebert BL, Gillette MA. et al. Gene set enrichment analysis: a knowledge-based approach for interpreting genome-wide expression profiles. Proc Natl Acad Sci U S A. 2005;102:15545-50
44. Lombardi G, Della Puppa A, Gardiman MP, Rossi S, Candiotto C, Zanatta L. et al. Discordance of IDH mutational status between lesions in an adult patient with multifocal glioma. Neuro Oncol. 2018;20:1142-3
45. Wu X, Li Y, Glastonbury CM, Cha S. Involvement of the Olfactory Apparatus by Gliomas. AJNR Am J Neuroradiol. 2020;41:712-7
46. Kebir S, Hattingen E, Niessen M, Rauschenbach L, Fimmers R, Hummel T. et al. Olfactory function as an independent prognostic factor in glioblastoma. Neurology. 2020;94:e529-e37
47. Zhou L, Tang H, Wang F, Chen L, Ou S, Wu T. et al. Bioinformatics analyses of significant genes, related pathways and candidate prognostic biomarkers in glioblastoma. Mol Med Rep. 2018;18:4185-96
48. Liu M, Lin Y, Zhang XC, Tan YH, Yao YL, Tan J. et al. Phosphorylated mTOR and YAP serve as prognostic markers and therapeutic targets in gliomas. Lab Invest. 2017;97:1354-63
49. Tan J, Liu M, Zhang JY, Yao YL, Wang YX, Lin Y. et al. Capillary morphogenesis protein 2 is a novel prognostic biomarker and plays oncogenic roles in glioma. J Pathol. 2018;245:160-71
50. Liao WC, Liao CK, Tsai YH, Tseng TJ, Chuang LC, Lan CT. et al. DSE promotes aggressive glioma cell phenotypes by enhancing HB-EGF/ErbB signaling. PLoS One. 2018;13:e0198364
51. Virga J, Szivos L, Hortobagyi T, Chalsaraei MK, Zahuczky G, Steiner L. et al. Extracellular matrix differences in glioblastoma patients with different prognoses. Oncol Lett. 2019;17:797-806
52. Hu B, Nandhu MS, Sim H, Agudelo-Garcia PA, Saldivar JC, Dolan CE. et al. Fibulin-3 promotes glioma growth and resistance through a novel paracrine regulation of Notch signaling. Cancer Res. 2012;72:3873-85
53. Venkataramani V, Tanev DI, Strahle C, Studier-Fischer A, Fankhauser L, Kessler T. et al. Glutamatergic synaptic input to glioma cells drives brain tumour progression. Nature. 2019;573:532-8
54. Venkatesh HS, Morishita W, Geraghty AC, Silverbush D, Gillespie SM, Arzt M. et al. Electrical and synaptic integration of glioma into neural circuits. Nature. 2019;573:539-45
55. Brenier-Pinchart MP, Blanc-Gonnet E, Marche PN, Berger F, Durand F, Ambroise-Thomas P. et al. Infection of human astrocytes and glioblastoma cells with Toxoplasma gondii: monocyte chemotactic protein-1 secretion and chemokine expression in vitro. Acta Neuropathol. 2004;107:245-9
56. Kuratsu J, Yoshizato K, Yoshimura T, Leonard EJ, Takeshima H, Ushio Y. Quantitative study of monocyte chemoattractant protein-1 (MCP-1) in cerebrospinal fluid and cyst fluid from patients with malignant glioma. J Natl Cancer Inst. 1993;85:1836-9
57. Venteicher AS, Tirosh I, Hebert C, Yizhak K, Neftel C, Filbin MG. et al. Decoupling genetics, lineages, and microenvironment in IDH-mutant gliomas by single-cell RNA-seq. Science. 2017 355
Author contact
![]() Corresponding authors: Dr. Yan Wang, Department of Pathology, Institute of Pathology and Southwest Cancer Center, Southwest Hospital, Third Military Medical University (Army Medical University), Chongqing, 400038, China. Tel. and Fax: +86-23-68754431; E-mail: wang_yan1977com. Dr. Xiu-Wu Bian, Department of Pathology, Institute of Pathology and Southwest Cancer Center, Southwest Hospital, Third Military Medical University (Army Medical University), Chongqing, 400038, China. Tel. and Fax: +86-23-68754431; E-mail: bianxiuwunet. Dr. Sheng-Qing Lv, Department of Neurosurgery, Xinqiao Hospital, Third Military Medical University (Army Medical University), Chongqing, 400037, China. Tel: +86-13608324622; Fax: +86-23-65218204; E-mail: lvsq0518com.
Corresponding authors: Dr. Yan Wang, Department of Pathology, Institute of Pathology and Southwest Cancer Center, Southwest Hospital, Third Military Medical University (Army Medical University), Chongqing, 400038, China. Tel. and Fax: +86-23-68754431; E-mail: wang_yan1977com. Dr. Xiu-Wu Bian, Department of Pathology, Institute of Pathology and Southwest Cancer Center, Southwest Hospital, Third Military Medical University (Army Medical University), Chongqing, 400038, China. Tel. and Fax: +86-23-68754431; E-mail: bianxiuwunet. Dr. Sheng-Qing Lv, Department of Neurosurgery, Xinqiao Hospital, Third Military Medical University (Army Medical University), Chongqing, 400037, China. Tel: +86-13608324622; Fax: +86-23-65218204; E-mail: lvsq0518com.