Impact Factor
- Issue 14; 2026
- Issue 13; 2026
- Issue 12; 2026
- Issue 11; 2026
- Issue 10; 2026
- Volume 16; 2026
- Advance Articles
- Past Issues
- Cover Images
- Cover Suggestion
- Index & Coverage
- Special Issues
Introduction
Materials and Methods
Results and Discussion
Conclusions
Supplementary Material
Acknowledgements
References
International Journal of Biological Sciences
International Journal of Medical Sciences
 Global reach, higher impact

Theranostics 2022; 12(1):410-417. doi:10.7150/thno.67155 This issue Cite
Research Paper
Simultaneous enhancement of T1 and T2 magnetic resonance imaging of liver tumor at respective low and high magnetic fields
Huan Li1*, Zijuan Hai2*, Liwei Zou1, Lele Zhang2, Lulu Wang4, Longsheng Wang1 ![]() , Gaolin Liang3
, Gaolin Liang3 ![]()
1. Department of Radiology, the Second Hospital of Anhui Medical University, Hefei, Anhui 230601, China.
2. Key Laboratory of Structure and Functional Regulation of Hybrid Materials, Ministry of Education, Institutes of Physical Science and Information Technology, Anhui University, Hefei, Anhui 230601, China.
3. State Key Laboratory of Bioelectronics, School of Biological Science and Medical Engineering, Southeast University, Nanjing, Jiangsu 210096, China.
4. High Magnetic Field Laboratory, Hefei Institutes of Physical Science, Chinese Academy of Sciences, Hefei, Anhui 230031, China.
* These authors contributed equally to this work.
Received 2021-9-15; Accepted 2021-10-27; Published 2022-1-1
Abstract

Background: Nowadays, magnetic resonance imaging (MRI) is routinely applied in clinical diagnosis. However, using one contrast agent (CA) to simultaneously enhance the T1 and T2 MR contrast at low and high magnetic fields respectively has not been reported.
Methods: Herein, we investigated the MR property of a γ-glutamyl transpeptidase (GGT)-instructed, intracellular formed gadolinium nanoparticle (DOTA-Gd-CBT-NP) at low and high magnetic fields.
Results: Experimental results showed that DOTA-Gd-CBT-NP possesses a low r2/r1 ratio 0.91 which enables it to enhance T1 MR imaging of liver tumor at 1.0 T, and a high r2/r1 ratio 11.8 which renders the nanoparticle to largely enhance T2 MR imaging of liver tumor at 9.4 T.
Conclusion: We expect that our GGT-responsive Gd-nanoparticle could be applied for simultaneous T1 and T2 MRI diagnosis of early liver cancer in clinic at respective low and high magnetic fields when the 9.4 T MR machine is clinically available in the future.
Keywords: γ-glutamyl transpeptidase, gadolinium nanoparticle, magnetic resonance imaging, liver tumor, tumor imaging
Introduction
Magnetic resonance imaging (MRI) has turned to be one of the most widely used clinical diagnostic technologies due to its noninvasiveness, superb spatial resolution, and high contrast in soft tissues [1-3]. However, the low sensitivity of MRI limits its ability to differentiate the pathological region from normal tissues. To further improve MRI contrast, approximately 35% of clinical MRI scans need exogenous contrast agents (CAs) [4,5]. They are mainly divided into two types: (1) T1 CAs, such as paramagnetic gadolinium (Gd) complexes, primarily shorten the longitudinal relaxation time (T1) of protons and result in bright contrast; (2) T2 CAs, such as superparamagnetic iron oxide (SPIO) nanoparticles, mainly reduce the transverse relaxation time (T2) of protons and result in dark contrast [6,7]. Generally, T1 MRI is advantageous in evaluating fat tissues or liquid-fixing concrete structures (e.g., joints), and T2 MRI is powerful in assessing water-rich tissues (or organs) or regional inflammations [8]. The ratio between transverse and longitudinal relaxivities (i.e. r2/r1) of a CA is a defining parameter to predict its MRI type. In general, MRI CAs with small r2/r1 ratio (< 5) serve as T1 CAs and with large r2/r1 ratio (> 8) act as T2 CAs [9,10].
Up to now, varies of T1 CAs, T2 CAs, T1/T2 switchable CAs and T1-T2 dual modal CAs have been developed to increase MRI contrast at low or high magnetic field [11-19]. However, using one CA to simultaneously enhance the T1 and T2 MR contrasts at low and high magnetic fields respectively has not been reported so far. Currently, small molecule Gd chelates, such as Gd-diethylenediaminepentaacetic acid (Gd-DTPA, Magnevist) and Gd-tetraazacyclododecanetetraacetic acid (Gd-DOTA, Dotarem), have been commonly employed as T1 CAs in clinical imaging. Nevertheless, these Gd chelates are small molecules and therefore their body circulation times are short and biodistributions are nonspecific [20-22]. As a result, stimuli-responsive nanoscale CAs which could efficiently improve the specificity and sensitivity of MRI have attracted great attention. In previous works, we found that reduction-controlled self-assembled Gd-nanoparticle could been used as T1 CAs at low magnetic field (0.5, 1.5, 3.0 T) while enzyme-instructed self-assembled Gd-nanofiber (or Gd-nanoparticle) could enhance T2-weighted MR contrast at high magnetic field (9.4 T) [6,23,24]. Therefore, we estimate that self-assembled Gd-nanoparticle might have the potency to simultaneously act as T1 and T2 CA at low and high magnetic fields respectively.
Liver cancer is one of the most common human malignancy. Although surgical (including liver resection and liver transplantation) and non-surgical (including transarterial chemoembolization, radiotherapy, and ablation) treatments have been applied in clinical practice, the 5-year survival rate of liver cancer patients is still less than 30% [25-27]. Early precise diagnosis allows the patients to receive the treatment earlier and achieve better survival rates. During the occurrence of liver cancer, levels of some trace biomarkers in tissues and body fluids are abnormal. Accurate detection of these biomarkers can specifically distinguish the abnormal pathological processes, which is the key to realize early diagnosis of liver cancer [28]. γ-glutamyl transpeptidase (GGT) is an enzyme characterized by it cell surface-binding property and plays important roles in various physiological processes. Up to date, numerous studies have reported that elevated serum GGT level is closely correlated with liver cancer patients [29,30]. Hence, endogenous GGT is a promising biomarker for early diagnosis of liver cancer. Since MRI is commonly used in clinical liver cancer diagnosis and evaluation [31,32], it is of great importance to exploit new biomarker-responsive MRI CAs for early precise diagnosis of liver cancer.
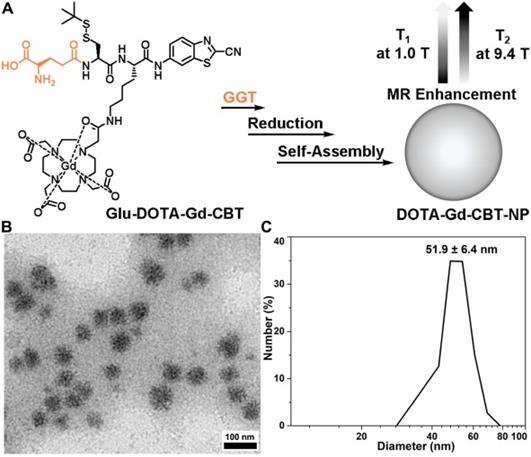
Inspired by above studies, we recalled the “smart” Gd-based probe in our previous work which could intracellularly self-assemble into Gd-nanoparticle under the activation of GGT with T2 enhancement of subcutaneous tumor at 9.4 T [24]. Generally, at increasing magnetic field strengths, r1 typically decreases while r2 is static or increases resulting in an increasing r2/r1 ratio. Specifically, for paramagnetic contrast agents based on Gd or manganese (Mn), the magnetization of the complexes increases linearly with magnetic field strength and this results in higher r2 values of the complexes at higher magnetic field [19,33-35]. In this work, we intended to systematically investigate its MR property for liver tumor imaging at both low (1.0 T) and high (9.4 T) magnetic fields. As shown in Figure 1A, Glu-DOTA-Gd-CBT was consisted of three parts: a GGT-responsive substrate, motifs for 2-cyano-benzothiazole (CBT)-Cysteine (Cys) click reaction, and DOTA-Gd for MRI. Under the process of cell uptake, Glu-DOTA-Gd-CBT is cleaved by GGT at cell surface. Then after reduction by intracellular glutathione (GSH), it self-assembles into Gd-nanoparticle (i.e., DOTA-Gd-CBT-NP) via π-π stacking in situ. We found that DOTA-Gd-CBT-NP possesses a low r2/r1 ratio 0.91 at 1.0 T which enables it to enhance T1 MR imaging of liver tumor by 12.7% at low magnetic field and a high r2/r1 ratio 11.8 at 9.4 T which renders it to enhance T2 MR imaging of liver tumor by 19.7% at high magnetic field.
(A) Schematic illustration of GGT-guided formation of DOTA-Gd-CBT-NP to enhance T1 and T2 MR contrasts at low (1.0 T) and high (9.4 T) magnetic fields, respectively. (B) TEM image and DLS measurement (C) of DOTA-Gd-CBT-NP in PBS buffer.
Materials and Methods
Materials and instruments
All the starting materials were obtained from Sigma, Adamas or GL Biochem. Commercially available reagents were used without further purification, unless noted otherwise. All chemicals were reagent grade or better. Transmission electron micrograph (TEM) images were obtained on a JEM‐2100F field emission transmission electron microscope operated at an acceleration voltage of 200 kV. MRI studies at low magnetic field were performed on a 1.0 T small animal MRI system (Bruker ICON). MRI studies at high magnetic field were performed on a 9.4 T/400 mm wide bore scanner (Agilent Technologies, Inc., Santa Clara, CA, USA) using a volume RF coil. The concentrations of Gd were determined with Inductively Coupled Plasma-Mass Spectrometry (ICP-MS) on the Perkin Elmer Optima 7300DV spectrometer. Each error bar in Figures 2 and 3 in the main text represents the standard deviation of three independent experiments.
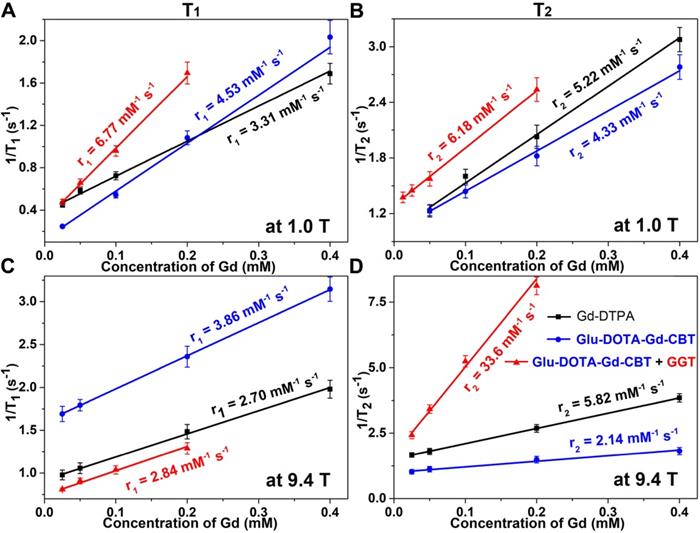
Longitudinal relaxation rates (1/T1) and transverse relaxation rates (1/T2) of Group Glu-DOTA-Gd-CBT + GGT (i.e., DOTA-Gd-CBT-NP), Group Glu-DOTA-Gd-CBT, and Group Gd-DTPA at low (1.0 T) or high (9.4 T) magnetic field.
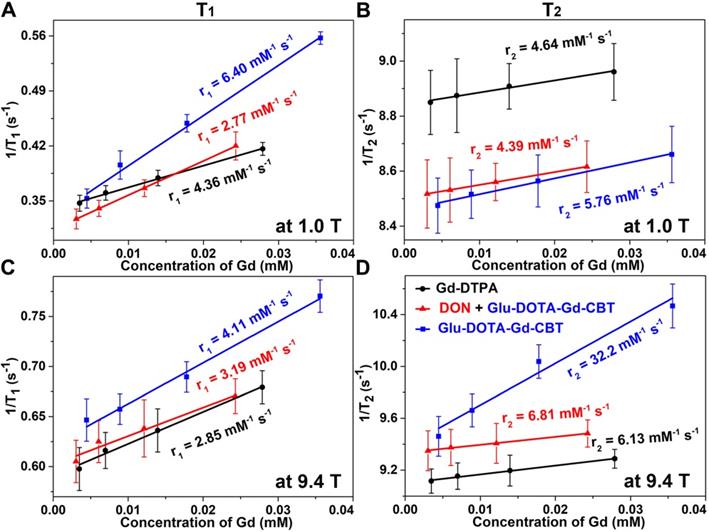
Longitudinal relaxation rates (1/T1) and transverse relaxation rates (1/T2) of HepG2 cells in Group Glu-DOTA-Gd-CBT, Group “DON + Glu-DOTA-Gd-CBT”, and Group Gd-DTPA at low (1.0 T) or high (9.4 T) magnetic field.
Cell experiment
HepG2 cells were divided into three groups: Group Glu-DOTA-Gd-CBT was the cells incubated with 200 μM Glu-DOTA-Gd-CBT for 4 h; Group “DON + Glu-DOTA-Gd-CBT” was the cells pretreated with 2 mM DON for 0.5 h then incubated with 200 μM Glu-DOTA-Gd-CBT for 4 h; Group Gd-DTPA was the cells incubated with 200 μM Gd-DTPA for 4 h. For MRI of living cells, HepG2 cells in three groups were diluted into four concentrations and resuspended in serum-free culture medium with 1 wt% agarose gel.
Construction of liver tumor in situ
All animals received care according to the guidelines of the Care and Use of Laboratory Animals. The procedures were approved by the Anhui Medical University Animal Care and Use Committee (LLSC20210378). 6-8 weeks old (weighting about 18 g) male BALB/c nude mice were used for animal experiments under SPF environment. Human hepatoma cells marked with red fluorescent protein (HepG2-RFP) in logarithmic growth phase were subcutaneous inoculated to male BALB/c nude mice. Dissect the tumor when the HepG2-RFP subcutaneous mass grows to about 500 mm3 and then divided into 1 mm × 1 mm × 1 mm tumor tissue in the medium. The mice were anesthetized with isoflurane anesthesia. After the pain of the nude mice disappeared, a 1 cm transverse incision was made in the lower abdomen of the nude mice under the microscope of 8x surgery with the method of microsurgery, the liver was exposed after cut the skin and peritoneum, and the tumor tissue was transplanted into the liver. Then close the abdominal cavity with 5-0 surgical sutures. The whole operation process is completed in the super clean workbench. The experiment will be carried out when the estimated average volume of the tumor grows about 1cm × 1cm × 1cm by the in vivo fluorescence imaging system.
In vitro and in vivo MRI experiments at 1.0 T
For in vitro MRI experiments, the longitudinal relaxation time (T1) were measured with a spin echo (SE) sequence using parameter of echo time (TE) = 9 ms, nineteen repetition times (TR) as follows: 20, 40, 60, 80, 100, 150, 200, 400, 600, 800, 1000, 1500, 2000, 4000, 6000, 8000, 10000, 15000, and 30000 ms, field of View (FOV) = 35 mm × 35 mm, matrix size = 256 × 256, and 3 slices with slice thickness = 4 mm. The transverse relaxation time (T2) were measured with a multi-echo spin echo sequence using parameter of TR = 2500 ms, eleven echo times (TE) ranging from 16 to 176 ms, field of View (FOV) = 35 mm × 35 mm, matrix size = 192 × 192, and 3 slices with slice thickness = 4 mm.
For in vivo MRI studies, T1-weighted MR images were acquired using fast spin echo sequence with following parameters: field of View (FOV) = 35 mm × 35 mm, matrix size = 256 × 256, slice thickness = 1 mm (10 slices, gap = 0), repetition time (TR) = 446 ms, echo spacing = 15 ms, effective echo time (TE) = 15 ms, 16 averages, rare factor = 2. T2-weighted MR images were acquired using fast spin echo sequence with following parameters: field of View (FOV) = 35 mm × 35 mm, matrix size = 192 × 192, slice thickness = 1 mm (10 slices, gap = 0), repetition time (TR) = 2905 ms, echo spacing = 28 ms; effective echo time (TE) = 84 ms, 6 averages, rare factor = 8.
In vitro and in vivo MRI experiments at 9.4 T
For in vitro MRI experiments, the longitudinal relaxation time (T1) were measured with a rapid acquisition with relaxation enhance sequence using parameter of echo time (TE) = 16.18 ms, eight repetition times (TR) as follows: 843, 1117.378, 1141.050, 1835.969, 2342.620, 3050.310, 4233.124 and 9000 ms, field of View (FOV) = 32 mm × 32 mm, matrix size = 128 × 128, BW 50 kHz, and 5 slices with slice thickness = 1 mm. The transverse relaxation time (T2) were measured with a multi-echo spin echo sequence using parameter of TR = 5,000 ms, thirty echo times (TE) ranging from 12 to 360 ms, echo spacing = 12 ms, field of view (FOV) = 32 mm × 32 mm, matrix size = 128 × 128, BW 50 kHz, and 5 slices with slice thickness = 1 mm.
For in vivo MRI studies, the longitudinal relaxation time (T1) were measured using following parameters: field of view (FOV) = 25 mm × 25 mm; matrix size = 128 × 128; TE = 12 ms, echo spacing = 6 ms, rare factor = 4, T1 experiments = 6 and 15 slices, slice thickness = 1 mm, 1 average. Six inversion times (TI) were used varied from 550 to 1800 ms. The transverse relaxation time (T2) were measured with a multi-echo spin echo sequence using parameter of TR = 3000 ms, twenty echoes with echo times (TE) ranging from 8 to 160 ms, with field of View (FOV) = 25 mm × 25 mm and matrix size = 128 × 128, slice thickness = 1 mm (15 slices, gap = 0); echo averages = 1.
Results and Discussion
MR property of DOTA-Gd-CBT-NP in vitro
Based on our previous work, in the presence of 400 U L-1 GGT and 2 mM GSH at 37 °C in PBS buffer for 2 h, 200 μM Glu-DOTA-Gd-CBT could convert to DOTA-Gd-CBT-NP. TEM image showed that the average diameter of DOTA-Gd-CBT-NP was 48.2 ± 8.5 nm (Figure 1B and Figure S1) and dynamic light scattering (DLS) measurement indicated that its mean hydrated diameter was 51.9 ± 6.4 nm (Figure 1C). Time-course DLS measurements also indicated that DOTA-Gd-CBT-NP was stabile in PBS buffer up to 12 h (Figure S2). These results verified the GGT-guided formation of DOTA-Gd-CBT-NP in vitro. We firstly measured the r1 and r2 values of Group “Glu-DOTA-Gd-CBT + GGT” (i.e., DOTA-Gd-CBT-NP), Group Glu-DOTA-Gd-CBT, and Group Gd-DTPA at low magnetic field (1.0 T). In detail, the r1 value of Group “Glu-DOTA-Gd-CBT + GGT” was measured to be 6.77 mM-1 s-1, Group Glu-DOTA-Gd-CBT be 4.53 mM-1 s-1, and Group Gd-DTPA be 3.31 mM-1 s-1. And the r2 value of Group “Glu-DOTA-Gd-CBT + GGT” was measured to be 6.18 mM-1 s-1, Group Glu-DOTA-Gd-CBT be 4.33 mM-1 s-1, and Group Gd-DTPA be 5.22 mM-1 s-1 (Figure 2A and 2B). These results suggested that DOTA-Gd-CBT-NP increased the r1 value of Glu-DOTA-Gd-CBT by 1.49 folds and increased r2 value of Glu-DOTA-Gd-CBT by 1.43 folds, respectively. The low r2/r1 ratio 0.91 of DOTA-Gd-CBT-NP indicating that it could serve as T1 CAs at 1.0 T (Table S1). Then r1 and r2 values at 9.4 T were calculated. As shown in Figure 2C and 2D, the r1 value of Group “Glu-DOTA-Gd-CBT + GGT” was measured to be 2.84 mM-1 s-1, Group Glu-DOTA-Gd-CBT be 3.86 mM-1 s-1, and Group Gd-DTPA be 2.70 mM-1 s-1, which suggested that DOTA-Gd-CBT-NP decreased the r1 value of Glu-DOTA-Gd-CBT by 0.74 folds. The r2 value of Group “Glu-DOTA-Gd-CBT + GGT” was measured to be 33.6 mM-1 s-1, Group Glu-DOTA-Gd-CBT be 2.14 mM-1 s-1, and Group Gd-DTPA be 5.82 mM-1 s-1, indicating DOTA-Gd-CBT-NP dramatically enhanced the r2 value of Glu-DOTA-Gd-CBT by 15.7 folds. Therefore, the high r2/r1 ratio 11.8 indicating that DOTA-Gd-CBT-NP could act as T2 CAs at 9.4 T (Table S1). The in vitro study verified that GGT-responsive formation of DOTA-Gd-CBT-NP and it could act as T1 or T2 CAs at 1.0 T or 9.4 T, respectively.
MR property of DOTA-Gd-CBT-NP in cell
After in vitro study, we then applied Glu-DOTA-Gd-CBT for MRI of GGT activity in human hepatoma (HepG2) cells. Before that, cytotoxicity was studied. After incubation with 400 μM Glu-DOTA-Gd-CBT, 85% of the cells survived up to 8 h, indicating that 200 μM Glu-DOTA-Gd-CBT is safe for living cells (Figure S3). HepG2 cells were divided into three groups: cells in Group Glu-DOTA-Gd-CBT were incubated with 200 μM Glu-DOTA-Gd-CBT for 4 h; cells in Group “DON + Glu-DOTA-Gd-CBT” were pretreated with 2 mM 6-diazo-5-oxo-L-norleucine (DON, one type of GGT inhibitors) for 0.5 h then incubated with 200 μM Glu-DOTA-Gd-CBT for 4 h; cells in Group Gd-DTPA were incubated with 200 μM Gd-DTPA for 4 h. Inductively coupled plasma-mass spectrometry (ICP-MS) was used to measure the Gd concentrations in HepG2 cells. In detail, Gd concentration in Group Glu-DOTA-Gd-CBT (35.6 μM) was higher than that in Group “DON + Glu-DOTA-Gd-CBT” (27.9 μM) and Group Gd-DTPA (24.3 μM), which suggested the higher uptake efficiency of Glu-DOTA-Gd-CBT (17.8%) than Gd-DTPA (12.2%). As shown in Figure 3A and 3B, the r1 value of HepG2 cells in Group Glu-DOTA-Gd-CBT was measured to be 6.40 mM-1 s-1, Group “DON + Glu-DOTA-Gd-CBT” be 2.77 mM-1 s-1, and Group Gd-DTPA be 4.36 mM-1 s-1 at low magnetic field (1.0 T). And the r2 value of Group Glu-DOTA-Gd-CBT was measured to be 5.76 mM-1 s-1, Group “DON + Glu-DOTA-Gd-CBT” be 4.39 mM-1 s-1, and Group Gd-DTPA be 4.64 mM-1 s-1 at 1.0 T. These results indicated that intracellular formation of DOTA-Gd-CBT-NP by GGT increased the r1 value of Glu-DOTA-Gd-CBT by 2.31 folds and the r2 value of Glu-DOTA-Gd-CBT by 1.31 folds, respectively. The low r2/r1 ratio 0.90 of DOTA-Gd-CBT-NP indicating that it could serve as T1 CAs at 1.0 T (Table S2). The r1 value of cells in Group Glu-DOTA-Gd-CBT was measured to be 4.11 mM-1 s-1, Group “DON + Glu-DOTA-Gd-CBT” be 3.19 mM-1 s-1, and Group Gd-DTPA be 2.85 mM-1 s-1 at high magnetic field (9.4 T) (Figure 3C), which suggested that DOTA-Gd-CBT-NP increased the r1 value of Glu-DOTA-Gd-CBT by 1.29 folds. The r2 value of cells in Group Glu-DOTA-Gd-CBT was measured to be 32.2 mM-1 s-1, Group “DON + Glu-DOTA-Gd-CBT” be 6.81 mM-1 s-1, and Group Gd-DTPA be 6.13 mM-1 s-1 at high magnetic field (9.4 T) (Figure 3D), indicating that DOTA-Gd-CBT-NP obviously enhanced the r2 value of Glu-DOTA-Gd-CBT by 4.73 folds. Therefore, the high r2/r1 ratio 7.83 suggesting that DOTA-Gd-CBT-NP could act as T2 CAs at 9.4 T (Table S2). These results confirmed that intracellular GGT-responsive formation of DOTA-Gd-CBT-NP could act as T1 or T2 CAs at 1.0 T or 9.4 T, respectively.
MR property of DOTA-Gd-CBT-NP in vivo
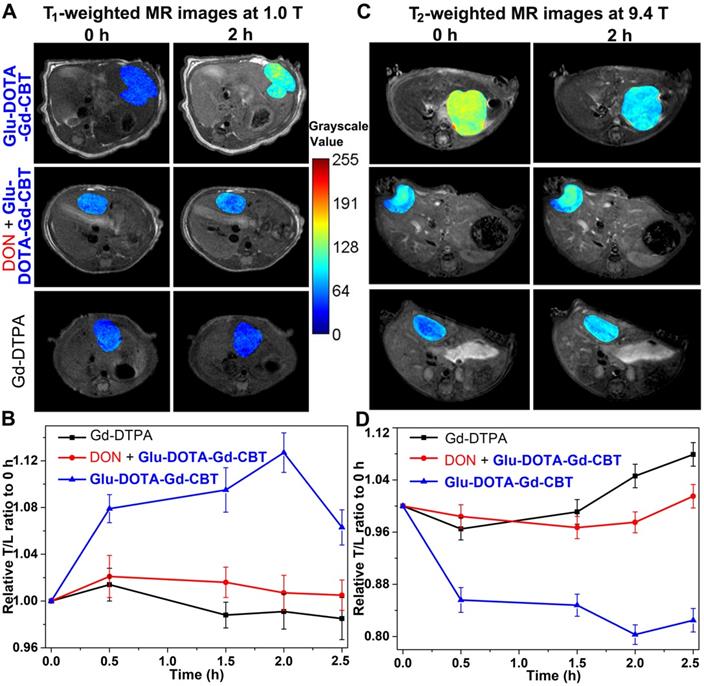
After cell study, we then investigated T1 and T2 MRI of liver tumor in vivo. Nude mice were transplanted with 1 mm3 HepG2 tumor tissue into the liver in situ. After the diameter of liver tumors to 1 cm, we tested the GGT activity (313.3 ± 45.3 U L-1, Table S3) of liver tumor lysates, which is at a high level. Then mice were randomly divided into three groups: mice in Group Glu-DOTA-Gd-CBT were treated with 0.08 mmol kg-1 Glu-DOTA-Gd-CBT through tail intravenous (i.v.) injection; mice in Group “DON + Glu-DOTA-Gd-CBT” were pre-administered with 0.25 mmol kg-1 DON for 0.5 h followed by injection of 0.08 mmol kg-1 Glu-DOTA-Gd-CBT; mice in Group Gd-DTPA received injections of Gd-DTPA at 0.08 mmol kg-1. Dynamic T1- and T2-weighted transverse MR images at low magnetic field (1.0 T) were conducted at first. T1 MR contrast of liver tumors in Group Glu-DOTA-Gd-CBT reached to its maximum at 2 h while that in Group DON + Glu-DOTA-Gd-CBT and Group Gd-DTPA increased slightly at 0.5 h (Figure S4). Typical T1 MR images of tumors were shown in Figure 4A. Tumor-to-liver (T/L) contrast ratios of their T1 values were displayed in Figure 4B. The T/L ratio of T1 values in Group Glu-DOTA-Gd-CBT at 2 h was 112.7% of that at 0 h while those in Group “DON + Glu-DOTA-Gd-CBT” and Group Gd-DTPA at 0.5 h were 102.1% and 101.4% of theirs at 0 h, respectively. T2 MR contrast of liver tumors in three groups showed slight decrease at 0.5 h (the T/M ratios were 96.0% for Group Glu-DOTA-Gd-CBT, 98.7% for Group “DON + Glu-DOTA-Gd-CBT”, and 98.3% for Group Gd-DTPA) (Figures S5-S6). Then we studied the dynamic T1 and T2 MR images of liver tumors at high magnetic field (9.4 T). T1-weighted MR contrast in three groups slightly enhanced at 0.5 h (the T/M ratios were 104.3% for Group Glu-DOTA-Gd-CBT, 102.9% for Group “DON + Glu-DOTA-Gd-CBT”, and 106.8% for Group Gd-DTPA to those at 0 h) (Figures S7-S8). As expected, T2-weighted MR contrast in Group Glu-DOTA-Gd-CBT decreased to its minimum at 2 h (the T/M ratio was 80.3% to that at 0 h). In contrast, neither Group “DON + Glu-DOTA-Gd-CBT” nor Group Gd-DTPA showed obvious T2 contrast change (the lowest T/M ratios were 98.4% and 96.5% to those at 0 h for Group “DON + Glu-DOTA-Gd-CBT” and Group Gd-DTPA at 0.5 h, respectively) (Figures 4C-4D, S9). These results indicated the GGT-instructed formation of DOTA-Gd-CBT-NP from Glu-DOTA-Gd-CBT could specifically increase the T1 MR imaging of liver tumor at 1.0 T and largely enhance T2 MR imaging of liver tumor at 9.4 T. After 2 h, T/L contrast ratio started to decrease which was consistent to our previous study [24]. At last, we measured gadolinium concentrations in liver tumors and other organs (hearts, livers, spleens, lungs, and kidneys) of these mice after MRI at 2.5 h. In addition to the organs involved in metabolism (livers and kidneys), tumors have the highest concentration of Gd (Figure S10, Table S4). Specifically, the average Gd content of tumors in Group Glu-DOTA-Gd-CBT (5.35 μg/g) was much higher than that in Group “DON + Glu-DOTA-Gd-CBT” (1.91 μg/g) or Group Gd-DTPA (1.22 μg/g). This result further indicated that DOTA-Gd-CBT-NP extended the retention time of Gd in liver tumors and thereafter largely enhanced the MRI contrast of liver tumors.
T1-weighted transverse MR images at 1.0 T (A) and T2-weighted transverse MR images at 9.4 T (C) of liver tumors in Group Glu-DOTA-Gd-CBT, Group “DON+Glu-DOTA-Gd-CBT” and Group Gd-DTPA at 0 h and 2 h. Normalized time course T/L contrast ratios of T1 values in Figure S4 (B) and of T2 values in Figure S9 (D).
Conclusions
In summary, we integrally studied the MR property of GGT-guided formation of Gd-nanoparticle for liver tumor imaging at both low and high magnetic fields. We found that DOTA-Gd-CBT-NP possesses low r2/r1 ratio 0.91 at 1.0 T which specifically enhanced T1 MR imaging of liver tumors (the T/L ratio of was 112.7%) at low magnetic field, and high r2/r1 ratio 11.8 at 9.4 T which largely enhanced T2 MR imaging of liver tumors (the T/M ratio was 80.3%) at high magnetic field. Therefore, we expect that our GGT-instructed Gd-nanoparticle formation could be applied for MRI diagnosis of early liver cancer in clinic at low or high magnetic field when the 9.4 T MR machine is clinically available in the future.
Supplementary Material
Supplementary figures and tables.
Acknowledgements
This work was supported by the National Natural Science Foundation of China (Grant 21725505, 21904002, and 22074016), the Natural Science Foundation of Anhui Province (Grant 2008085QB94) and the Clinical Research Incubation Program of the Second Hospital of Anhui Medical University (Grant 2020LCZD18).
Competing Interests
The authors have declared that no competing interest exists.
References
1. Terreno E, Delli Castelli D, Viale A, Aime S. Challenges for Molecular Magnetic Resonance Imaging. Chem Rev. 2010;110:3019-42
2. Weissleder R, Pittet MJ. Imaging in the era of molecular oncology. Nature. 2008;452:580-9
3. Cho IK, Moran SP, Paudyal R, Piotrowska-Nitsche K, Cheng PH, Zhang XD. et al. Longitudinal Monitoring of Stem Cell Grafts In Vivo Using Magnetic Resonance Imaging with Inducible Maga as a Genetic Reporter. Theranostics. 2014;4:972-89
4. Klippel S, Freund C, Schroder L. Multichannel MRI Labeling of Mammalian Cells by Switchable Nanocarriers for Hyperpolarized Xenon. Nano Lett. 2014;14:5721-6
5. Kim T, Cho EJ, Chae Y, Kim M, Oh A, Jin J. et al. Urchin-Shaped Manganese Oxide Nanoparticles as pH-Responsive Activatable T1 Contrast Agents for Magnetic Resonance Imaging. Angew Chem Int Ed. 2011;50:10589-93
6. Liang GL, Ronald J, Chen YX, Ye DJ, Pandit P, Ma ML. et al. Controlled Self-Assembling of Gadolinium Nanoparticles as Smart Molecular Magnetic Resonance Imaging Contrast Agents. Angew Chem Int Ed. 2011;50:6283-6
7. Yuan Y, Ding ZL, Qian JC, Zhang J, Xu JY, Dong XJ. et al. Casp3/7-Instructed Intracellular Aggregation of Fe3O4 Nanoparticles Enhances T2 MR Imaging of Tumor Apoptosis. Nano Lett. 2016;16:2686-91
8. Zhou ZJ, Bai RL, Munasinghe J, Shen ZY, Nie LM, Chen XY. T1-T2 Dual-Modal Magnetic Resonance Imaging: From Molecular Basis to Contrast Agents. ACS Nano. 2017;11:5227-32
9. Zhou ZJ, Zhao ZH, Zhang H, Wang ZY, Chen XY, Wang RF. et al. Interplay between Longitudinal and Transverse Contrasts in Fe3O4 Nanoplates with (111) Exposed Surfaces. ACS Nano. 2014;8:7976-85
10. Na HB, Song IC, Hyeon T. Inorganic Nanoparticles for MRI Contrast Agents. Adv Mater. 2009;21:2133-48
11. Kim BH, Lee N, Kim H, An K, Park YI, Choi Y. et al. Large-Scale Synthesis of Uniform and Extremely Small-Sized Iron Oxide Nanoparticles for High-Resolution T1 Magnetic Resonance Imaging Contrast Agents. J Am Chem Soc. 2011;133:12624-31
12. Ding ZL, Sun HB, Ge SC, Cai Y, Yuan Y, Hai ZJ. et al. Furin-Controlled Fe3O4 Nanoparticle Aggregation and F19 Signal "Turn-On" for Precise MR Imaging of Tumors. Adv Funct Mater. 2019;29:1903860
13. Li FF, Zhi DB, Luo YF, Zhang JQ, Nan X, Zhang YJ. et al. Core/shell Fe3O4/Gd2O3 nanocubes as T1-T2 dual modal MRI contrast agents. Nanoscale. 2016;8:12826-33
14. Wang LY, Huang J, Chen HB, Wu H, Xu YL. et al. Exerting Enhanced Permeability and Retention Effect Driven Delivery by Ultrafine Iron Oxide Nanoparticles with T1-T2 Switchable Magnetic Resonance Imaging Contrast. ACS Nano. 2017;11:4582-92
15. Zhou LJ, Yang T, Wang JX, Wang QL, Lv XY, Ke HT. et al. Size-Tunable Gd2O3@Albumin Nanoparticles Conjugating Chlorin e6 for Magnetic Resonance Imaging-Guided Photo-Induced Therapy. Theranostics. 2017;7:764-74
16. Li L, Gu P, Hao M, Xiang X, Feng Y, Zhu X. et al. Bacteria-Targeted MRI Probe-Based Imaging Bacterial Infection and Monitoring Antimicrobial Therapy In Vivo. Small. 2021 2103627
17. Chen W, Zhao J, Hou M, Yang M, Yi C, Gadolinium-porphyrin based polymer nanotheranostics for fluorescence/magnetic resonance imaging guided photodynamic therapy. Nanoscale. 2021; 13: 16197-206.
18. Hu YX, Zhang JY, Miao YX, Wen XD, Wang J, Sun YD. et al. Enzyme-Mediated In Situ Self-Assembly Promotes In Vivo Bioorthogonal Reaction for Pretargeted Multimodality Imaging. Angew Chem Int Ed. 2021;60:18082-93
19. Li H, Luo D, Yuan C, Wang X, Wang J, Basilion JP. et al. Magnetic Resonance Imaging of PSMA-Positive Prostate Cancer by a Targeted and Activatable Gd(III) MR Contrast Agent. J Am Chem Soc. 2021 DOI: 10.1021/jacs.1c07377
20. Frangville C, Li YC, Billotey C, Talham DR, Taleb J, Roux P. et al. Assembly of Double-Hydrophilic Block Copolymers Triggered by Gadolinium Ions: New Colloidal MRI Contrast Agents. Nano Lett. 2016;16:4069-73
21. Caravan P. Strategies for increasing the sensitivity of gadolinium based MRI contrast agents. Chem Soc Rev. 2006;35:512-23
22. Hu XM, Lu F, Chen L, Tang YF, Hu WB, Lu XM. et al. Perylene Diimide-Grafted Polymeric Nanoparticles Chelated with Gd3+ for Photoacoustic/T1-Weighted Magnetic Resonance Imaging-Guided Photothermal Therapy. ACS Appl Mater Interfaces. 2017;9:30458-69
23. Dong L, Qian JC, Hai ZJ, Xu JY, Du W, Zhong K. et al. Alkaline Phosphatase-Instructed Self-Assembly of Gadolinium Nanofibers for Enhanced T2-Weighted Magnetic Resonance Imaging of Tumor. Anal Chem. 2017;89:6922-5
24. Hai ZJ, Ni YH, Saimi D, Yang HY, Tong HY, Zhong K. et al. gamma-Glutamyltranspeptidase-Triggered Intracellular Gadolinium Nanoparticle Formation Enhances the T2-Weighted MR Contrast of Tumor. Nano Lett. 2019;19:2428-33
25. Bruix J, Sherman M. Management of Hepatocellular Carcinoma: An Update. Hepatology. 2011;53:1020-2
26. Chen QS, Shang WT, Zeng CT, Wang K, Liang XY, Chi CW. et al. Theranostic imaging of liver cancer using targeted optical/MRI dual-modal probes. Oncotarget. 2017;8:32741-51
27. Yang JD, Roberts LR. Hepatocellular carcinoma: a global view. Nat Rev Gastroenterol Hepatol. 2010;7:448-58
28. Hamilton W, Walter FM, Rubin G, Neal RD. Improving early diagnosis of symptomatic cancer. Nat Rev Clin Oncol. 2016;13:740-9
29. Fu SJ, Zhao Q, Ji F, Chen MG, Wu LW, Ren QQ. et al. Elevated Preoperative Serum Gamma-glutamyltranspeptidase Predicts Poor Prognosis for Hepatocellular Carcinoma after Liver Transplantation. Sci Rep. 2016;6:28835
30. Okada T, Suzuki H, Wada K, Kumagai H, Fukuyama K, Crystal structures of gamma-glutamyltranspeptidase from Escherichia coli, a key enzyme in glutathione metabolism, its reaction intermediate. Proc Nati Acad Sci. U S A. 2006;103:6471-6
31. Lencioni R, Cioni D, Crocetti L, Della Pina C, Bartolozzi C. Magnetic resonance imaging of liver tumors. J Hepatol. 2004;40:162-71
32. Cowger TA, Tang W, Zhen Z, Hu K, Rink DE, Todd TJ. et al. Casein-Coated Fe5C2 Nanoparticles with Superior r2 Relaxivity for Liver-Specific Magnetic Resonance Imaging. Theranostics. 2015;5:1225-32
33. Hagberga GE, Scheffler K, Effect of r1, r2 relaxivity of gadolinium-based contrast agents on the T1-weighted MR signal at increasing magnetic field strengths. Contrast Media Mol Imaging. 2013; 8: 456-65.
34. Caravan P, Farrar CT, Frullano L, Uppal R, Influence of molecular parameters, increasing magnetic field strength on relaxivity of gadolinium-, manganese-based T1 contrast agents. Contrast Media Mol Imaging. 2009; 4: 89-100.
35. Zhang YH, Zhang HY, Li BB, Zhang HL, Tan B, Deng ZW, Cell-assembled (Gd-DOTA)i-triphenylphosphonium (TPP) nanoclusters as a T2 contrast agent reveal in vivo fates of stem cell transplants. Nano Res. 2018; 11: 1625-41.
Author contact
![]() Corresponding authors: Longsheng Wang, Professor, Department of Radiology, the Second Hospital of Anhui Medical University, Hefei, Anhui 230601, China. E-mail: wanglongshengedu.cn. Gaolin Liang, Ph.D., Professor, State Key Laboratory of Bioelectronics, School of Biological Science and Medical Engineering, Southeast University, Nanjing, Jiangsu 210096, China. Tel: (+86)-25-83790632; fax: (+86)-25-83790632. E-mail: gliangedu.cn.
Corresponding authors: Longsheng Wang, Professor, Department of Radiology, the Second Hospital of Anhui Medical University, Hefei, Anhui 230601, China. E-mail: wanglongshengedu.cn. Gaolin Liang, Ph.D., Professor, State Key Laboratory of Bioelectronics, School of Biological Science and Medical Engineering, Southeast University, Nanjing, Jiangsu 210096, China. Tel: (+86)-25-83790632; fax: (+86)-25-83790632. E-mail: gliangedu.cn.