Impact Factor
- Issue 14; 2026
- Issue 13; 2026
- Issue 12; 2026
- Issue 11; 2026
- Issue 10; 2026
- Volume 16; 2026
- Advance Articles
- Past Issues
- Cover Images
- Cover Suggestion
- Index & Coverage
- Special Issues
Introduction
Materials and Methods
Results and Discussion
Conclusions
Supplementary Material
Acknowledgements
References
International Journal of Biological Sciences
International Journal of Medical Sciences
 Global reach, higher impact

Theranostics 2021; 11(20):9859-9872. doi:10.7150/thno.65771 This issue Cite
Research Paper
Estimating dynamic vascular perfusion based on Er-based lanthanide nanoprobes with enhanced down-conversion emission beyond 1500 nm
Qian Jia1#, Zheng Li1#, Mingli Bai1, Haohao Yan1, Ruili Zhang1,2 ![]() , Yu Ji1, Yanbin Feng1, Zuo Yang1, Zhongliang Wang1,2
, Yu Ji1, Yanbin Feng1, Zuo Yang1, Zhongliang Wang1,2 ![]() , Jianxiong Li3
, Jianxiong Li3 ![]()
1. Engineering Research Center of Molecular and Neuro-imaging of ministry of education, School of Life Science and Technology, Xidian University, Xi'an, Shaanxi, 710126 China.
2. Academy of Advanced Interdisciplinary Research, Xidian University, Xi'an, Shaanxi, 710071, China.
3. Department of Radiotherapy, Chinese PLA General Hospital, Beijing, 100071, China.
#These authors contributed equally to this work.
Received 2021-8-5; Accepted 2021-9-22; Published 2021-10-11
Abstract

Peripheral artery disease (PAD) is a common, yet serious, circulatory condition that can increase the risk of amputation, heart attack or stroke. Accurate identification of PAD and dynamic monitoring of the treatment efficacy of PAD in real time are crucial for optimizing therapeutic outcomes. However, current imaging techniques do not enable these requirements.
Methods: A lanthanide-based nanoprobe with emission in the second near-infrared window b (NIR-IIb, 1500-1700 nm), Er-DCNPs, was utilized for continuous imaging of dynamic vascular structures and hemodynamic alterations in real time using PAD-related mouse models. The NIR-IIb imaging capability, stability, and biocompatibility of Er-DCNPs were evaluated in vitro and in vivo.
Results: Owing to their high temporal-spatial resolution in the NIR-IIb imaging window, Er-DCNPs not only exhibited superior capability in visualizing anatomical and pathophysiological features of the vasculature of mice but also provided dynamic information on blood perfusion for quantitative assessment of blood recovery, thereby achieving the synergistic integration of diagnostic and therapeutic imaging functions, which is very meaningful for the successful management of PAD.
Conclusion: Our findings indicate that Er-DCNPs can serve as a promising system to facilitate the diagnosis and treatment of PAD as well as other vasculature-related diseases.
Keywords: Lanthanide based nanoparticles, NIR-IIb imaging, vascular imaging, peripheral artery disease, ischemic reperfusion
Introduction
Peripheral artery disease (PAD), a major manifestation of atherosclerosis, is defined by the narrowing or blockage of arteries that supply blood to the lower limbs [1,2]. Consequently, PAD is not only the leading cause of critical limb ischemia and amputation but is also associated with a significantly increased risk of coronary or cerebrovascular diseases, such as heart attacks and stroke, affecting more than 200 million people worldwide [3-5]. Despite its high prevalence and its effect on cardiovascular morbidity and mortality, PAD remains largely underdiagnosed and undertreated as it is often asymptomatic or discovered at an advanced stage, which markedly prevents patients from accessing effective treatment and leads to life-threatening conditions [6-9]. Therefore, accurate detection and timely treatment of PAD are very important for preventing the worsening of the disease.
Rapid developments in medical imaging techniques, including laser Doppler imaging (LDI), computed tomography angiography (CTA), magnetic resonance angiography (MRA), and positron emission tomography (PET), have provided opportunities to obtain insights into the pathophysiological and anatomical characterization of PAD [10-13]. However, most current techniques are limited by their low spatial resolution, unfavorable sensitivity, high cost, or ionizing radiation. Furthermore, in addition to the precise diagnosis of PAD, dynamic monitoring of treatment efficacy in real time plays a significant role in determining the final outcome of the treatment by maximizing treatment effectiveness while minimizing adverse effects [14-15]. In fact, there are an increasing number of therapeutic options that require the guidance of imaging tools. Unfortunately, almost none of the current imaging modalities used for PAD detection is particularly effective at providing quick real-time feedback to allow valuable non-invasive assessments during treatment [16-18]. Therefore, it is highly desirable to develop a robust approach that can integrate both diagnostic and therapeutic imaging functions to non-invasively assess the progression of PAD and the treatment response with higher sensitivity and resolution.
Fluorescence imaging in the second near-infrared (NIR-II) window (1000-1700 nm) holds great promise for diverse biomedical applications owing to its considerable advantages over traditional visible and first near-infrared (NIR-I, 700-900 nm) imaging, such as substantially reduced photon scattering and low tissue autofluorescence, which afford deeper tissue penetration and higher spatial resolution [19-29]. Although Mie theory indicates that imaging at longer wavelengths can achieve low background and high resolution, the absorption peak of water molecules in biological tissues near 1450 nm considerably attenuates luminescence at these wavelengths and reduces penetration depth [30]. Therefore, avoiding the water absorption wavelength and acquiring images in the 1500-1700 nm (referred to as NIR-IIb window) is more ideal for fluorescence imaging in vivo with a better signal-to-background ratio (SBR) due to nearly zero auto-fluorescence in this region [31,32]. In the past decades, several NIR-IIb probes, including single-walled carbon nanotubes (SWNTs), quantum dots (QDs), small molecular dyes, Er3+-doped rare earth nanoparticles (Er-RENPs), metal-based nanoparticles, and semiconducting polymer dots (Pdots) have been developed for in vivo bioimaging [33-37]. Despite significant advances, very limited inorganic NIR-IIb imaging probes beyond 1500 nm have been investigated for PAD visualization and treatment evaluation [38].
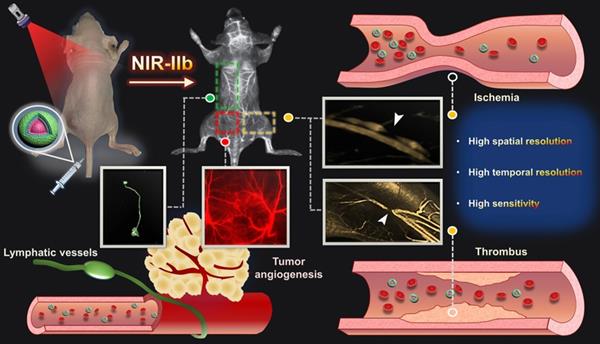
Herein, we present a multifunctional imaging strategy, which integrates the diagnostic and therapeutic imaging functions synergistically to enable real-time imaging of dynamic vascular structure changes and hemodynamic alterations in the PAD mouse models by using an NIR-IIb probe (Er-DCNPs) based on an Nd3+ sensitizing and Ce3+-doping system. Down-conversion (DC) luminescence of Er-DCNPs at 1530 nm was boosted by the Er3+/Ce3+ co-doped strategy, which highly suppressed the up-conversion (UC) pathway, induced by the electronic transition of 4I11/2 → 4I13/2 of Er3+, substantially enhancing the emission at 1530 nm [39]. Our results demonstrated that Er-DCNPs not only exhibited superior fluorescence imaging capability in visualizing the vasculature of mice with different degrees of hindlimb ischemia but also enabled the quantitative estimation of physiological indicators (heartbeats and respiratory rate) of mice based on an imaging frame rate. Most importantly, our Er-DCNPs probe can provide dynamic information on blood perfusion for the quantitative assessment of the degree of recovery from hindlimb ischemia, suggesting its potential for the diagnosis and treatment evaluation of PAD and other vasculature-related diseases.
Materials and Methods
Reagents and instrumentation
All chemical reagents, if not specified, were purchased from Alfa Aesar or Sigma-Aldrich and used without purification. Methoxy-polyethyleneglycol amine (mPEG-NH2, MW: 5000) was purchased from Xi'an Ruixi Biological Technology Co., Ltd. (Xi'an, China). Deionized water (DI water) was used in all experiments. Murine mammary carcinoma cell line 4T1 was obtained from Shanghai Zhong Qiao Xin Zhou Biotechnology Co., Ltd. (Shanghai, China). Penicillin streptomycin, RPMI 1640 Medium, bovine serum (FBS) and 0.25% (w/v) trypsin solution were purchased from Gibco Life Technologies (AG, Switzerland). Phosphate-Buffered Saline (PBS) was purchased from OpticsPlanet, Inc. (USA). C57BL/6 female mice and BALB/c female mice (6-7 weeks old and weighing 18-22 g) were supplied by the Animal Center of the Fourth Military Medical University (Xi'an, China). Animal protocols related to this study were reviewed and approved by the Institutional Animal Care and Use Committee of the Fourth Military Medical University (approval number: 20180304). Transmission electron microscopy (TEM) images were obtained using a JEM-2100F electron microscope. The absolute quantum yield was obtained using a Fluorolog-QM (HORIBA). NIR-II live animal imaging system (Series II 900/1700-H, China) and home-built small animal NIR-II imaging system by InGaAs-NIRvana640LN camera were applied for in vivo imaging.
Synthesis of NaYbF4:2%Er,2%Ce nanoparticles
In a typical synthetic procedure of NaYbF4:2%Er,2%Ce, 1 mmol of CF3COONa, 0.96 mmol of Yb(CF3COO)3, 0.02 mmol of Er(CF3COO)3 and 0.02 mmol of Ce(CF3COO)3 were mixed with oleic acid (10 mmol), oleylamine (10 mmol) and 1-octadecene (20 mmol) in a two-neck reaction flask. The slurry mixture was heated to 120 °C under vacuum for 30 min to remove water and oxygen. Then the solution was heated to 300 °C with a rate of 10 °C/min under dry argon flow, and then maintained at 300 °C for 60 min with stirring. After cooling to room temperature, an excess amount of ethanol was poured into the solution. The resultant nanoparticles were centrifuged at 5,000 r.p.m. for 20 min. After centrifugal washing with hexane/ethanol, NaYbF4:2%Er,2%Ce nanoparticles were re-dispersed in 5 mL of hexane for further coating.
Synthesis of NaYbF4:2%Er,2%Ce@NaYbF4 nanoparticles
Typically, 5.0 mL of as-prepared NaYbF4:2%Er,2%Ce solution, 1 mmol of CF3COONa, 1 mmol of Yb(CF3COO)3 were mixed with oleic acid (20 mmol) and 1-octadecene (20 mmol) in a two-neck reaction flask. Then the mixture was heated to 120 °C under vacuum for 30 min to remove hexane and water. The flask was then heated to 305 °C for 75 min with stirring. After cooling to room temperature, an excess amount of ethanol was poured into the solution. The resultant nanoparticles were centrifuged at 5,000 r.p.m. for 20 min. After centrifugal washing with hexane/ethanol, NaYbF4:2%Er,2%Ce@NaYbF4 nanoparticles were re-dispersed in 5 mL of hexane for further coating.
Synthesis of NaYbF4:2%Er,2%Ce@NaYbF4@NaNdF4:50%Yb nanoparticles
The synthetic procedure of NaYbF4:2%Er,2%Ce@NaYbF4@NaNdF4:50%Yb was the same as that used to synthesize NaYbF4:2%Er,2%Ce@NaYbF4 nanoparticles, except that 5 mL of as-prepared NaYbF4:2%Er,2%Ce@NaYbF4 solution, 1 mmol of CF3COONa, 0.5 mmol of Yb(CF3COO)3 and 0.5 mmol of Nd(CF3COO)3 were mixed with oleic acid (20 mmol) and 1-octadecene (20 mmol) in a two-neck reaction flask. The as-synthesized NaYbF4:2%Er,2%Ce@NaYbF4@NaNdF4:50%Yb nanoparticles were re-dispersed in 5 mL of hexane for further coating.
Synthesis of NaYbF4:2%Er,2%Ce@NaYbF4@NaNdF4:50%Yb@NaLuF4 nanoparticles
The synthetic procedure of NaYbF4:2%Er,2%Ce@NaYbF4@NaNdF4:50%Yb@NaLuF4 was the same as that used to synthesize NaYbF4:2%Er,2%Ce@NaYbF4@NaNdF4:50%Yb nanoparticles, except that 5 mL of as-prepared NaYbF4:2%Er,2%Ce@NaYbF4@NaNdF4:50%Yb solution, 1 mmol of CF3COONa, 1 mmol of Lu(CF3COO)3 were mixed with oleic acid (20 mmol) and 1-octadecene (20 mmol) in a two-neck reaction flask. The as-synthesized NaYbF4:2%Er,2%Ce@NaYbF4@NaNdF4:50%Yb@NaLuF4 nanoparticles were re-dispersed in 10 mL of chloroform for further modification.
NaYbF4:2%Er,2%Ce@NaYbF4@NaNdF4:50%Yb@NaLuF4@PMH-COOH preparation
80 mg of poly 1-octadecene-maleic anhydride (PMH) was dissolved in 1 mL of chloroform in 5 mL flask, and then 1 mL NaYbF4:2%Er,2%Ce@NaYbF4@NaNdF4:50%Yb@NaLuF4 in chloroform was added dropwise, followed by 12 h of stirring at room temperature. Subsequently, the round-bottomed flask was placed in a vacuum drying oven and maintained at 50 °C for 5 h. 2 mL of purified water and 80 mg of 4-Dimethylaminopyridine (DMAP) was then added to above flask under ultrasonic irradiation until the solution was clear and transparent. After centrifugation at 14,000 rpm for 1 h, the excess surfactant was removed to obtain hydrophilic nanoparticles NaYbF4:2%Er,2%Ce@NaYbF4@NaNdF4:50%Yb@NaLuF4@PMH-COOH, which were dissolved in 5 mL of 2-(N-morpholino)ethanesulfonic acid (MES) buffer (pH 8.5) for later use.
NaYbF4:2%Er,2%Ce@NaYbF4@NaNdF4:50%Yb@NaLuF4@PMH-mPEG5000 probe preparation
1 mL of NaYbF4:2%Er,2%Ce@NaYbF4@NaNdF4:50%Yb@NaLuF4@PMH-COOH solution was added into 2 mL of MES buffer (pH 8.5), and then 2 mg of mPEG5000-NH2 dissolved in 1 mL of MES buffer (pH 8.5), 2 mg EDC (1-(3-dimethylaminopropyl)-3-ethylcarbodiimide hydrochloride) dissolved in 1 mL MES buffer (pH 8.5) was slowly dropped into the above reaction solution, and reacted at 37 °C for 12 h. Then the reaction solution was extensively dialyzed against PBS for 3 h to remove excess reactants and by products. Finally, the reaction solution was centrifuged at 4000 r.p.m. for 10 min to remove the larger particles, and the upper solution was concentrated with an ultrafiltration tube to obtain the target probe, which is denoted as Er-DCNPs.
Fluorescence imaging of the mice
Before imaging, the hair of all the mice was removed by using hair clipper and depilatory cream. The mice were intravenously injected with 100 µL probes. Fluorescence images were acquired by Series II 900/1700-H. All the fluorescence photos were gathered by a 640 × 512 pixel InGaAs-NIRvana640LN camera. An 808 nm laser diode was decided to be the excitation laser for both of the contrast agents at a power density of 400 mW/cm2 (lower than the safe exposure limit of 1.0 W/cm2 determined by the International Commission on Nonionizing Radiation Protection). A 1500 nm long-pass filter, 1200 nm long-pass filter, 1100 nm long-pass filter, 1000 nm long-pass filter, 900 nm long-pass filter, or 850 nm band-pass filter were applied to collect the emission of the probes. Except the 1500 nm long-pass filter, other filters were used to collect the emission of the ICG. Exposure time was 100 ms for all images.
Dynamic imaging in the NIR-IIb window
In order to visualize the vascular dynamically, the mice were intravenously injected with 100 µL probes and a series of NIR-IIb photos were gathered by a 640 × 512 pixel InGaAs-NIRvana640LN camera. For recording the heartbeat and respiration, the mice were fixed in the supine position on a console. The probes were injected into the mice and the video began with the injection. The heart beats and breath rates were calculated by changes in the intensity of the heart and lung over time. As for observing the lymphatic system in the NIR-IIb windows, we opened the belly and fixed the skin in the sides. Next, the probes (10 µL) were injected into the subiliac lymph nodes and the video of this progress was recorded. Exposure time was 100 ms for all images.
Dynamic NIR-IIb imaging of the thrombolysis
For inducing the thrombus model successfully, we used the FeCl3 method according to the early literatures. First, we placed the mice as the supine position, and then, removed the skin of mice to expose the femoral artery or carotid artery. Next, we put the FeCl3-soaked filter paper (10 wt%) on the exposed vessels. After 5 min, we removed the filter paper and injected the probes (100 µL) into mice. Later, urokinase (100 U/mL) was injected into the mice for thrombolysis. All the NIR-IIb data were collected by the InGaAs-NIRvana640LN camera.
Dynamic NIR-IIb imaging of the ischemic reperfusion in hindlimbs
Ischemic mouse models were established by ligation of the femoral vein and artery using hemostatic clip for different durations (40 min or 1.5 h) to generate different degrees of ischemia. The probe was then intravenously injected into hindlimb ischemia mice. Later, we removed the clips to observe the ischemic reperfusion in limbs. The dynamic and static data were gathered with the InGaAs-NIRvana640LN camera. The exposure time was 300 ms for all the data. The blood flow velocity (BFV) was calculated by the time among the three regions of interest (ROI) and the distance among the three ROI.
NIR-IIb imaging of monitoring tumor growth
To establish the breast cancer model, approximately 5×10⁵ 4T1 cells in 25 µL PBS were injected to the right hindlimb of the BALB/c mice subcutaneously. To visualize the tumor growth, we injected the probes (75 µL) into the mice intravenously at 0, 3 and 5 days. All the NIR-IIb images were collected by InGaAs-NIRvana640LN camera and Series II 900/1700-H. For testing the biodistribution of the mice, BALB/c was injected the probes (100 µL) intravenously and imaged at different time with a 100 ms exposure time. The mice were placed as supine position and prone position, respectively.
Results and Discussion
Synthesis and characterization of the Er3+/Ce3+ co-doped core/shell nanoparticles with enhanced DC emission
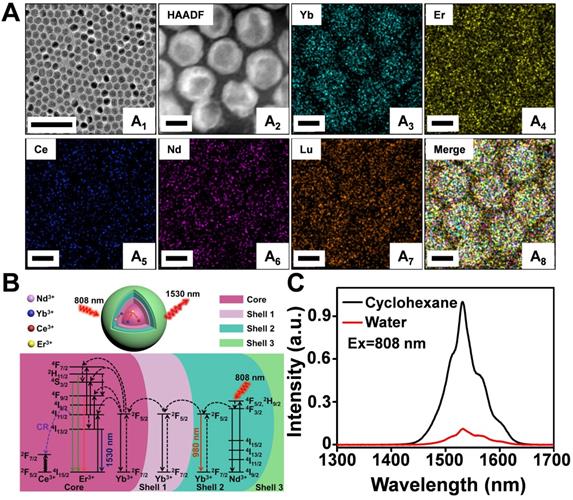
A modified layer-by-layer high-temperature co-precipitation method was used to synthesize a series of nanoparticles with varied interlayers and dopant concentration. Finally, the composition of nanoparticles was optimized to be NaYbF4:2%Er,2%Ce@NaYbF4@NaNdF4:50%Yb@NaLuF4 with a core/shell1/shell2/shell3 (C/S1/S2/S3) structure (Figure S1A-D and Figure S2A) based on corresponding optical properties (Figure S2B-F). A representative TEM image of NaYbF4:2%Er,2%Ce@NaYbF4@NaNdF4:50%Yb@NaLuF4 revealed uniform and monodispersed spherical particles with a diameter of 16.2 ± 1.7 nm (Figure 1A1). High-angle annular dark field-scanning TEM (HAADF-STEM) (Figure 1A2) and corresponding elemental mapping analysis of Er3+/Ce3+ co-doped nanoparticles (Figure 1A3-A8) confirmed the presence of Yb (green), Er (yellow), Ce (blue), Nd (pink), and Lu (orange) in the C/S1/S2/S3 nanoparticles. The energy transfer process of the Nd3+-Yb3+-Er3+-Ce3+ system is presented in Figure 1B. After light excitation at 808 nm, the Nd3+ ions in Shell 2 served as the sensitizer to reach the excited state of the 4F5/2 state of Nd3+ and transfer its energy to the adjacent Yb3+ ions, resulting in a population of the 2F5/2 state of Yb3+. The excited 2F5/2 state of Yb3+ then radiatively relaxed to its 2F7/2 energy level, emitting NIR luminescence at 980 nm. Some of the excitation energy migrated over the Yb3+ sublattice and was finally trapped by the activator ions of Er3+ in the core. Subsequently, the excited 4I11/2 state of Er3+ nonradiatively decayed into the 4I13/2 level and allowed NIR-IIb DC emission with a maximum at 1530 nm. However, the 4I11/2 state of Er3+ could also be excited to the higher 2H11/2 and 4S3/2 levels by further absorbing the excitation energy from Nd3+ to generate UC luminescence, competing with the DC process. Therefore, we doped the Ce3+ ions into the core of the particle to boost the DC pathway while suppressing the UC process, as the interionic cross-relaxation (CR) between Er3+ (4I11/2-4I13/2) and Ce3+ (2F5/2-2F7/2) accelerated the nonradiative relaxation of Er3+ from 4I11/2 to 4I13/2 [40-44]. Accordingly, the DC luminescence of Er3+/Ce3+ co-doped nanoparticles at 1530 nm was dramatically increased by Ce3+ doping (Figure 1C). The absolute quantum yield of NaYbF4:2%Er,2%Ce@NaYbF4@NaNdF4:50%Yb@NaLuF4 nanoparticles in cyclohexane was determined to be 35.6% under the laser excitation of 100 mW/cm2.
(A) Representative TEM image (A1), HAADF-STEM image (A2) and corresponding element mapping image of Er3+/Ce3+ co-doped nanoparticles, Yb (A3), Er (A4), Ce (A5), Nd (A6), Lu (A7) and Merge (A8). Scale bar: 100 nm (A1), Scale bar: 10 nm (A2-A8). (B) Luminescence mechanisms involved in the generation of the intense 1530 nm emission in Er3+/Ce3+ co-doped nanoparticles excited at 808 nm. (C) The NIR IIb emission spectra of Er3+/Ce3+ co-doped-RENPs dispersed in cyclohexane and Er-DCNPs dispersed in water under 808 nm light excitation.
Schematic illustration of NIR-IIb probe Er-DCNPs for multifunctional biomedical imaging in vivo with high temporal-spatial resolution and sensitivity.
For in vivo biomedical imaging, the hydrophobic NaYbF4:2%Er,2%Ce@NaYbF4@NaNdF4:50%Yb@NaLuF4 nanoparticles were further modified with mPEG5000 to produce a hydrophilic surface (named Er-DCNPs) [40]. As illustrated in Figure S3A-B, the hydrodynamic diameter of nanoparticels gradually increased and its surface charge shifted to more positive values, demonstrating the successful surface modification. As shown in Figure S3C, the hydrodynamic size of the hydrophilic nanoparticles remained nearly unchanged over 24 h in water, phosphate buffer solution (PBS), and medium solutions, respectively, indicating its excellent stability and dispersibility in the physiological environment. Moreover, Er-DCNPs showed great photostability under 808 nm laser irradiation (Figure S3D-E).
Evaluation of NIR-IIb fluorescence imaging performance of Er-DCNPs in tissue phantoms
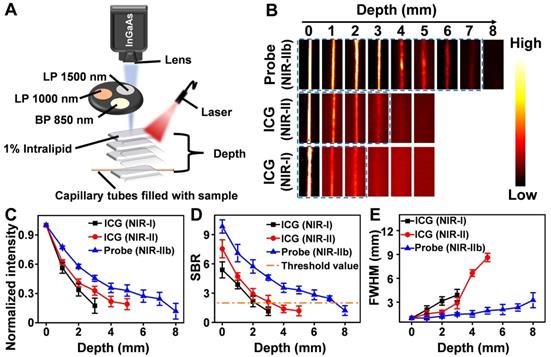
As mentioned above, fluorescence imaging in the NIR-IIb window benefits from its further reduced light scattering and tissue autofluorescence, which was expected to cause higher spatial resolution and deeper tissue penetration. Thus, before in vivo imaging, a tissue phantom study using Intralipid that mimics the optical properties of biological tissues was performed to compare the imaging performance of Er-DCNPs with that of indocyanine green (ICG), a clinically approved dye with NIR-I and NIR-II emission (Figure 2A). The capillary tubes filled with Er-DCNPs or ICG solutions were immersed in a 1% Intralipid solution at an increased phantom depth. To optimize the signal collection conditions, a 1500 nm long-pass filter (LP 1500), 1000 nm long-pass filter (LP 1000), or 850 nm band-pass filter (BP 850) was selected to acquire NIR-IIb imaging for Er-DCNPs and NIR-II or NIR-I imaging for ICG using a home-built InGaAs setup (Figure 2A). The Gaussian-fitted full width at half maximum (FWHM) and SBR were used to evaluate the resolution and clarity of the images. As shown in Figure 2B and C, with an increase in penetration depth from 0 to 3 mm, the images of capillary tubes taken in the NIR-I and NIR-II windows became blurry and even invisible [45]. In contrast, the NIR-IIb imaging results of Er-DCNPs could resolve sharp edges of the capillary at a depth of up to 7 mm with the SBR passing the threshold value of 2 (Figure 2D), which was defined as the minimum value required to resolve the capillary profile in vitro [46], suggesting a higher imaging resolution and contrast achieved by Er-DCNPs at longer emission wavelengths. This result was further supported by the FWHM measurements of capillary images at varying depths, which clearly showed that Er-DCNPs enabled better feature integrity than ICG imaging at the same position due to the low scattering and autofluorescence interference at 1530 nm (Figure 2E), ultimately indicating the great potential of Er-DCNPs for deep tissue imaging in vivo.
(A) A home-built fluorescence imaging setup for the tissue phantom study. (B) Fluorescence images of capillaries filled with the Er-DCNPs and ICG, immersed in 1% Intralipid at varying depths. Fluorescent signals of Er-DCNPs and ICG were collected using 1500 nm, 1000 nm long-pass filters, or an 850 nm band-pass filter. (C) The normalized intensity of the capillary images is shown in (B). (D) The SBR of the capillary images is shown in (B). (E) The full width at half maximum (FWHM) for the capillaries is shown in (B). The bars represent mean ± standard deviation derived from n = 3 lines tested at varying positions in the capillary images.
In vitro and in vivo biocompatibility of Er-DCNPs
The cytotoxicity of different concentrations of Er-DCNPs (0-500 μg/mL) against 4T1 cells was evaluated using the 3-(4,5-dimethyl-2-thiazolyl)-2,5-diphenyl-2-H-tetrazolium bromide (MTT) assay. As shown in Figure S4A, the viability of 4T1 cells remained over 80% after 24 h of incubation, even at a high Er-DCNPs concentration (500 μg/mL), indicating the low cytotoxicity of Er-DCNPs. To test the in vivo toxicity of Er-DCNPs, we performed a 7-day post-injection study. No abnormal behaviors or obvious body weight drop was observed in mice administered Er-DCNPs during the entire observation period (Figure S4B). Meanwhile, the blood biochemistry analysis of treated mice showed that all parameters were maintained within the normal range (Figure S5), revealing negligible side effects in mice. Additionally, the pharmacokinetic behavior of Er-DCNPs in vivo was evaluated after intravenous injection. As shown in Figure S6, the fluorescence signals gradually decreased after 2 h, and were mainly observed in the liver and spleen. These results suggest that Er-DCNPs can be safely utilized as excellent NIR-IIb fluorescence probe for in vivo bioimaging.
High-resolution NIR-IIb fluorescence imaging of vasculature with Er-DCNPs
Encouraged by the superior in vitro imaging performance and good biocompatibility of Er-DCNPs, we further explored the feasibility of applying Er-DCNPs for vasculature imaging in vivo. Acquiring accurate and detailed information on normal vascular anatomy is a prerequisite for real-time monitoring of dynamic changes in blood flow caused by PAD. Therefore, the blood vessels of the brain, hindlimb, and lymphatic system in healthy mice were detected with Er-DCNPs to assess the spatial resolution of Er-DCNPs for in vivo vascular imaging. ICG was used as a control.
For regional cerebral vasculature imaging in the mouse brain, C57BL/6 mice were intravenously injected with Er-DCNPs or ICG in PBS solution at the same dose. Different wavelength filters were selected to obtain optimal fluorescence images for Er-DCNPs and ICG at 1 min post-injection. As shown in Figure S7A, as the imaging window shifted toward longer wavelengths, the cerebral vessels were gradually illuminated with enhanced sharpness for both groups, mainly because of reduced light attenuation at longer wavelength. However, compared with smeared fluorescence images of mouse brains from the NIR-I and NIR-II windows with ICG, Er-DCNPs offered a markedly clearer delineation of cerebrovascular structures in the NIR-IIb window with suppressed background. Small cortical vessels could also be clearly identified, indicating the excellent spatial resolution of vessel imaging enabled by the Er-DCNPs. The cross-sectional fluorescence profile from selected vessels in the brain revealed a large difference in the FWHM of the fluorescence signals originating from Er-DCNPs and ICG (Figure S7B). Moreover, when the same filter (LP 1000 nm) was employed, the Er-DCNPs produced a sharper FWHM than that of ICG (115 µm vs. 282 µm). In particular, the cerebral vessel, which was as small as 63 μm, could be discerned beyond 1500 nm with Er-DCNPs administration, demonstrating the superior vessel imaging capacity of Er-DCNPs in the NIR-IIb region. Consistent results were obtained for NIR-IIb imaging of blood vessels in the hindlimb and back of mice after Er-DCNPs injection (Figure S8A-B), where the complex vascular network with many tiny capillary branches was finely delineated by NIR-IIb fluorescence signals from Er-DCNPs.
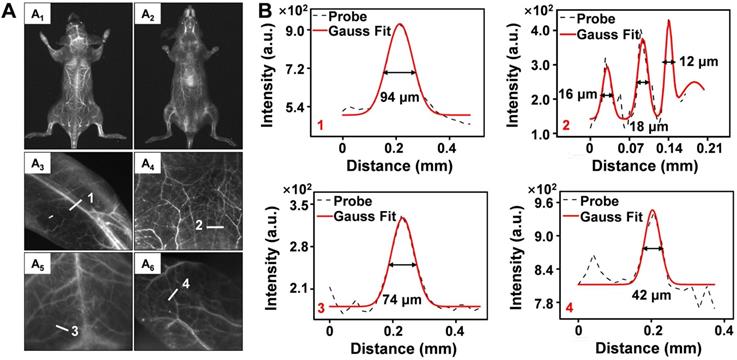
To further evaluate the performance of Er-DCNPs for deep tissue imaging, whole-body vascular imaging was conducted with normal mice in the supine and prone positions. As shown in Figure 3A1-A2, the whole-body vasculature could be distinguished from the background upon intravenous injection of Er-DCNPs under 808 nm excitation (1500 nm long-pass filter). Benefiting from the exceptional spatial resolution and improved penetration depth of Er-DCNPs, more detailed information about the blood vessels can be acquired from high-magnification images of the hindlimb, abdomen, brain, and ear (Figure 3A3-A6 and Figure 3B), demonstrating the great potential of Er-DCNPs for fluorescence angiography in vivo. Such outstanding bioimaging performance of Er-DCNPs in the NIR-IIb window also enabled the visualization of elaborate vasculature in the intestine and kidney with sharp FWHM (Figure S9A-E).
(A) NIR-IIb bioimaging of mice whole-body (A1-A2), hindlimb (A3), abdomen (A4), brain (A5) and ear (A6) after intravenous injection of Er-DCNPs (n = 3). (B) The fluorescence intensity profiles (dashed black line) and Gaussian fitting curve (solid red line) along white lines 1-4 in the NIR-IIb fluorescence image are shown in (A).
High-resolution NIR-IIb fluorescence imaging for tumor angiogenesis
In contrast to normal vasculature, tumor blood vessels are functionally abnormal, which facilitates tumor formation, progression, and metastasis. Therefore, accurate evaluation of tumor-associated blood vessels and microvascular networks could provide valuable insights into tumor growth [47,48]. For tumor vascular imaging, NIR-IIb images were acquired after 1-min injection of Er-DCNPs into the breast tumor-bearing BALB/c mice on days 3 and 5, respectively. As the tumor grew, new blood vessels were observed with intensified fluorescence signals (Figure S10A). Moreover, accompanied by an increase in major blood vessels, abundant small capillary networks gradually appeared. As depicted in Figure S10B-C, the density and diameter of the blood vessels markedly increased throughout tumor development, showing the great spatiotemporal resolution of Er-DCNPs that can be utilized to identify tumor-associated vasculatures.
Real-time monitoring of hemodynamic parameters using NIR-IIb fluorescence imaging
Encouraged by the superior static imaging capability of Er-DCNPs, we further explored its feasibility for real-time monitoring of the vascular changes, which could provide both anatomic and hemodynamic information to facilitate a quick and reliable identification of PAD as well as an accurate assessment of the therapeutic effects. Er-DCNPs solution was injected into a normal mouse, and whole-body fluorescence imaging was carried out at a resolution of 640 × 512 pixels. As shown in Figure 4A and Supplementary Movie 1, back vessels were distinctly visualized at 3.4 s after injection. Further, even small vessels with different diameters could be identified with high spatial resolution (Figure S11A and B) owing to the minimal tissue scattering and auto-fluorescence of NIR-IIb emission. Meanwhile, the injection site was gradually lit due to leakage of the tail-vein injected probe, indicating the great potential of the probe for intraoperative anastomosis assessment (Figure S12). Based on Supplementary Movie 1, NIR-IIb fluorescence signals in the brain blood vessels of the mouse were measured in the first 20 s immediately after intravenous injection of Er-DCNPs. As shown in Figure 4B, intense fluorescence could be detected at 2.4 s (as Tarrival) post-injection of Er-DCNPs and could gradually reach the maximum (as Imax) at 4.5 s (as Tmax). The intensity of signals stabilized after 7.1 s injection. Trising was obtained by subtracting Tarrival from Tmax to represent the status of the tissue blood supply, suggesting that Er-DCNPs could monitor hemodynamic changes in vivo. In addition, the cerebral vasculature imaging results in Figure 4C reconfirmed the superior imaging ability of Er-DCNPs.
(A) Real-time NIR-IIb fluorescence images of mouse back vessels. (B) Relative fluorescence intensity of the regions of interest (ROI, red circle in the brain) over time of injected Er-DCNPs. The arrival time (Tarrival) of Er-DCNPs and the time of the maximum intensity (Tmax) are indicated on the time axis. The rising time (Trising) was calculated as Tmax - Tarrival. (C) The fluorescence intensity profiles (dashed black line) and Gaussian fitting curve (solid red line) along the white line in the NIR-IIb fluorescence image are shown in the inset. The inset shows NIR-II bioimaging of mice brain after intravenous injection of Er-DCNPs. (D) Real-time NIR-IIb fluorescence images of an in situ dissected mouse after injection of Er-DCNPs. White circle indicates the ROI in the heart and yellow circle indicates the ROI in the lung. (E) Heartbeat of the mouse in (D); the heartbeat curves recorded by the intensity of ROI in the heart. (F) The respiratory rate of the mouse in (D); the vibration curves recorded by the intensity of ROI in the lung. (G) Real-time NIR-IIb fluorescence of lymphatic vessel after injecting Er-DCNPs at popliteal lymph nodes. (H) The fluorescence intensity profiles (dashed black line) and Gaussian fitting curve (solid red line) along the white line in the NIR-IIb fluorescence image are shown in (G). (I) The lymph flow rate from a to b in (G). The slope of the function was calculated as the lymph flow rate.
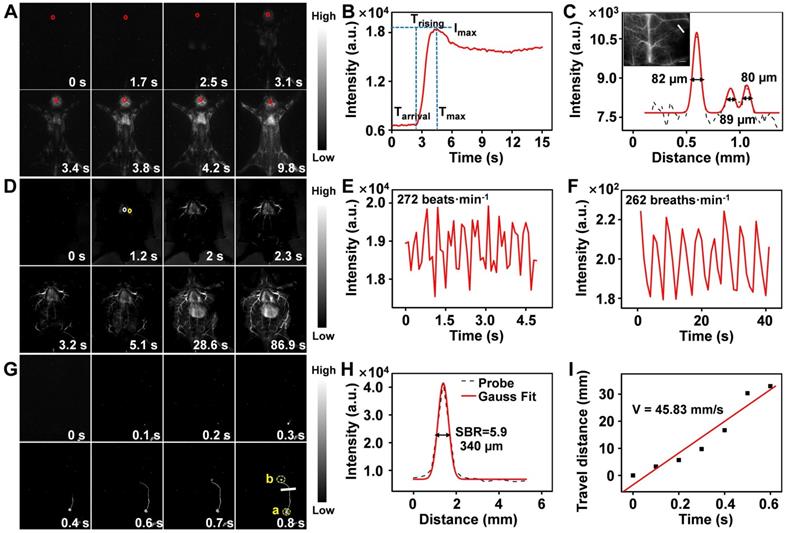
Furthermore, we performed a time series fluorescence imaging of an in situ dissected mouse. As Er-DCNPs circulated from larger vessels into smaller vessels, fluorescence signals from tiny vasculatures gradually intensified and reached a maximum at 86.9 s post-injection. The video (Supplementary Movie 2) showed that Er-DCNPs reached the heart first and then entered the pulmonary circulation before being pumped into the whole body. Owing to reduced light scattering and minimal autofluorescence interference in the NIR-IIb window, an extensive branched network of blood vessels was well outlined throughout the body with excellent spatial resolution (Figure 4D). The high-magnification image of blood vessels in Figure 4D clearly shows that our Er-DCNPs were preferentially distributed in the larger vessels and then throughout the smaller vessels. The SBR value and the blood flow velocity (BFV) of ROI could be easily calculated, facilitating a thorough understanding of blood flow features and their interaction with the adjacent vessels in vivo (Figure S13A-C).
In addition to blood vessels, the profiles of deeper organs, such as the heart, lung, and liver can be precisely delineated by Er-DCNPs, enabling real-time, contact-free monitoring of critical physiological parameters, such as heart and respiratory rate. The heart rate of the healthy mouse was 272 beats/min (Figure 4E), which was comparable to that of a previous report [49]. Meanwhile, the respiratory rate of the mouse was 262 breaths/min (Figure 4F) by extracting the fluorescence signals from a series of images of lung vibration [50]. Superb temporal and spatial resolution offered by Er-DCNPs were also well reflected in lymphatic vessel imaging in vivo (Figure 4G and Supplementary Movie 3), where an SBR of 5.9 was obtained, surpassing the Rose criterion (SBR 5), where lymphatic vessels can be resolved with high certainty (Figure 4H) [51]. We further tracked the flow of lymph fluid from the subiliac lymph nodes to the accessory axillary lymph nodes using Er-DCNPs, which yielded a fast lymph flow rate of 45.83 mm/s (Figure 4I). This result indicated that Er-DCNPs could be utilized for accurate visualization of lymphatic drainage, which is essential for evaluating the status of lymph nodes and tracing tumor metastasis via lymphatic vessels. These results indicate that Er-DCNPs could be very effective for real-time imaging of vascular structures and blood vessel-associated dynamic changes in vivo with higher temporal and spatial resolution.
Real-time monitoring of the thrombolysis processes in a mouse model
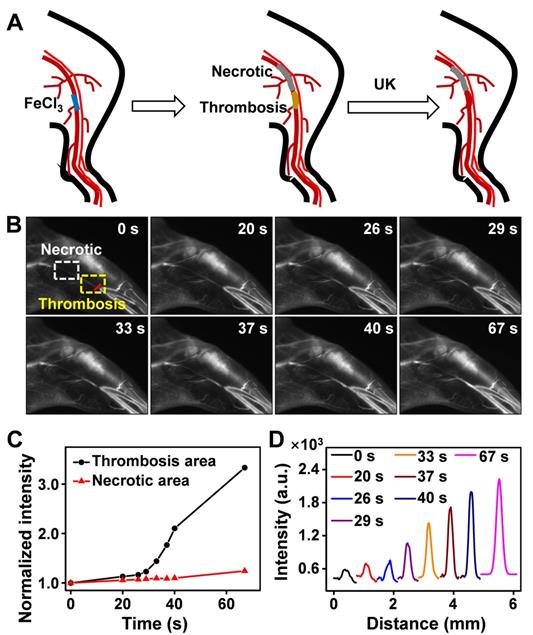
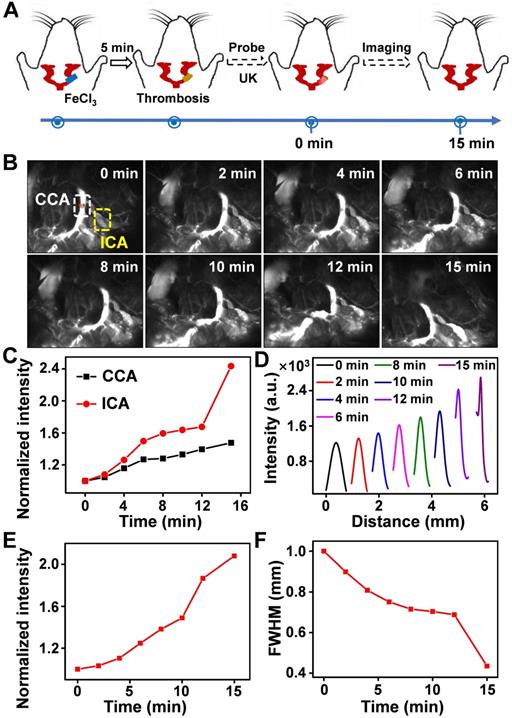
Thrombus is a blood clot that forms in blood vessels with high rates of acute mortality and long-term disability. Timely diagnosis and evaluation of the treatment efficacy of thrombosis are crucial for reducing morbidity and potential mortality [52‒55]. At present, urokinase (UK), a thrombolytic agent, has been widely used to treat thrombus in clinical practice [56‒59]. To evaluate the thrombolytic effect of UK clinically, however, four coagulation indicators must be monitored before and after its administration, which is tedious and exhausting. Moreover, an additional 2 h may be needed to obtain the results, thereby failing to provide fast feedback on treatment effectiveness. As Er-DCNPs exhibited remarkable capability for real-time detection of hemodynamic changes, we were inspired to validate the in vivo efficacy of Er-DCNPs for evaluating UK-facilitated thrombolysis. Common femoral artery (CFA) thrombosis was induced by the FeCl3 method, and the angionecrosis model was used for comparison (Figure 5A) [60]. Then Er-DCNPs or UK was intravenously injected into the CFA thrombotic mouse to observe the affected side. As shown in Figure 5B, blood vessels in the common femoral artery region can be clearly observed with high fidelity after injecting Er-DCNPs, whereas blood vessels in the affected area were invisible due to thrombosis and necrosis. Then, UK was injected into the mouse and dynamic fluorescence imaging of the thrombotic and necrotic areas of mice was performed to monitor the thrombolysis processes with a NIR-II InGaAs camera (Supplementary Movie 4). The video showed that blood vessels in the thrombotic area were gradually lit and the FWHM of fluorescence signals in this area significantly reduced with time, illustrating effective blood flow recovery due to fibrin degradation in blood clots caused by UK (Figure 5C-D and Figure S14A-D). This finding indicates that Er-DCNPs performed competently in evaluating the degree of thrombus and the efficacy of thrombolysis in real-time. In addition, we tracked thrombolysis and blood flow perfusion processes in the common carotid artery (CCA) thrombotic model using Er-DCNPs (Figure 6A). Interestingly, the thrombotic region was located exactly at the junction of the CCA and internal carotid artery (ICA), causing weak ICA signals due to the occlusion of the vasculature (0 min in Figure 6B). As shown in Figure 6B-C, after intravenous administration of UK, the fluorescence intensity of ICA increased by nearly 2.8-fold within 15 min, suggesting an effective blood recovery. Meanwhile, NIR-IIb signals in the thrombotic plaque were enhanced by 2.2-fold and FWHM significantly reduced over time (Figure 6D-F), indicating that the thrombotic plaque reduces in size before disappearing. Altogether, Er-DCNPs markedly benefited from their higher temporal and spatial resolution and could be successfully used for the rapid and accurate imaging of vascular-related diseases and real-time evaluation of therapeutic effectiveness.
(A) Schematic illustration of the thrombolysis process at the femoral artery. (B) Real-time NIR-IIb imaging of femoral artery by Er-DCNPs at different time points of urokinase (UK) injection. Thrombotic and necrotic areas were respectively marked in yellow and white (n = 3). (C) Changes in the intensity of the thrombotic and necrotic areas in (B) over time. (D) Thrombotic plaque decreased in size over time. Plaque size was calculated based on signals of red line marked in (B).
(A) Schematic illustration of the thrombolysis process at the carotid artery. (B) Real-time NIR-IIb imaging of CCA (white area) and ICA (yellow area) using Er-DCNPs at different time points of UK injection (n = 3). (C) Changes in the intensity of CCA and ICA in (B) at varying time points. (D) Thrombotic plaque of CCA decreased in size. Plaque size was calculated based on signals of dashed red line marked in (B). (E-F) Intensity and FWHM of the thrombotic plaque at varying time points, which were calculated from (D).
Real-time monitoring of the reperfusion processes of mouse in a PAD model
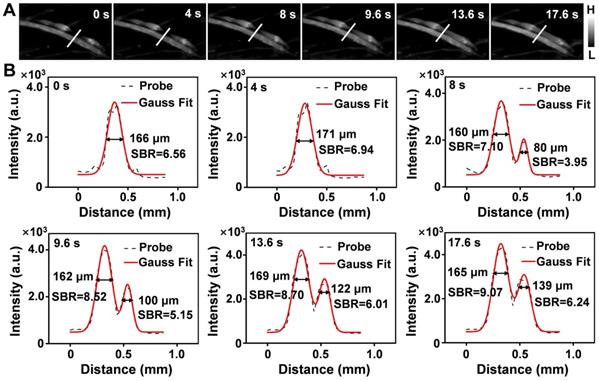
Limb ischemia is a common form of PAD. The dynamic assessment of the degree of ischemia and monitoring of vascular reperfusion are important for the diagnosis and treatment of PAD [16,61,62]; however, current clinical detection techniques cannot perform these tasks. To determine whether Er-DCNPs with 1530 nm emission could be adequate for the imaging of ischemic hindlimb, Er-DCNPs were intravenously injected into hindlimb ischemia mice to compare the normal and affected regions. The dynamic process of ischemic reperfusion was further monitored by NIR-II fluorescence imaging (Supplementary Movie 5). As shown in Figure 7A, NIR-IIb fluorescence imaging unambiguously resolved the normal femoral side, while fluorescence signals on the ischemic side were obviously interrupted by ligation of the femoral artery and vein, which resulted in the occlusion of blood flow. Importantly, real-time fluorescence imaging depicted the recovery of ischemic hindlimbs. Consistently, the cross-sectional fluorescent profile of representative vessels revealed changes in signal distribution (Figure 7B). As time progressed, the FWHM of the normal blood vessel remained almost unchanged, while the SBR increased gradually and all SBR values surpassed the Rose criterion to clearly distinguish vascular features from the background. In contrast, ischemic blood vessels showed increased FWHM and SBR. The SBR did not surpass the Rose criterion until the surgical suture thread was removed 9.6 s later. By measuring the FWHM of the cross-sectional signal profiles of the features, the blood width of the ischemic blood vessel was found to expand from 0 μm to 139 μm within 17.6 s, suggesting that ischemic blood vessels were gradually normalized. To further examine the utility of continuous monitoring of ischemic reperfusion in limbs with Er-DCNPs, mouse models with different degrees of hindlimb ischemia were established using hemostatic clips with various clipping durations. The probe was then injected intravenously into mice with hindlimb ischemia. For the 40-min clipping group, enhanced fluorescence signals could be quickly detected within 2 s after clip removal, indicating an almost complete reperfusion under mild ischemic conditions (Figure S15A and Supplementary Movie 6). However, when the clipping time was extended to 1.5 h, markedly delayed perfusion signals were observed in the ischemic hindlimbs of mice (Figure S15B and Supplementary Movie 7). After removal of the clip, the fluorescence signals from the affected blood vessels did not appear until 8 min later, which indicated that there might be incomplete reperfusion of the blood vessels in the mouse hindlimb. Furthermore, we selected four ROIs, called a, b, c, and d, to track the ischemic reperfusion process by dynamic NIR-IIb imaging enabled by Er-DCNPs (Figure S15B). After removing the clip, the BFV of the ROIs were calculated to be 0.51 mm/s, 0.065 mm/s, and 0.026 mm/s, respectively (Figure S15C). Accordingly, the average diameters of blood vessels (for a→b, b→c, c→d) were determined as 180.5 μm, 211.2 μm and 256.0 μm, respectively (Figure S16-S18 and Table S1), which is consistent with the fact that blood flow velocity is inversely proportional to the cross-sectional area of the blood vessels [63,64]. However, tiny capillaries around the ROIs failed to reperfuse. All these results indicate the superior capability of Er-DCNPs to dynamically monitor vascular perfusion recovery in the PAD model, making it highly favorable for evaluating the efficacy during PAD treatment.
(A) Real-time NIR-IIb imaging of the ischemic perfusion in the femoral vein of the affected region (upper) and the normal region (lower) (n = 3). (B) Fluorescence intensity profiles (dashed black line) and Gaussian fitting curve (solid red line) along the white line in the NIR-IIb fluorescence image are shown in (A).
Conclusions
In summary, we successfully validated the feasibility and utility of an NIR-IIb emissive probe, Er-DCNPs, for the real-time imaging of dynamic vascular structure and hemodynamic alterations related to PAD in vivo. Profiting from the high temporal and spatial resolution in NIR-IIb window, Er-DCNPs performed competently to provide quick and accurate information on vasculature-related physiological and pathological processes, such as thrombus and hindlimb ischemia, in a non-invasive and non-radioactive manner. Most importantly, the superior real-time imaging capability of Er-DCNPs greatly enabled a timely evaluation of treatment effectiveness by monitoring vascular recovery conditions, achieving the delicate integration of diagnostic and therapeutic imaging functions, which is particularly significant when dealing with PAD. Altogether, this study demonstrated the great potential of this multifunctional fluorescence imaging strategy for the effective detection and treatment of vasculature-related diseases.
Supplementary Material
Supplementary figures and table.
Supplementary movie 1.
Supplementary movie 2.
Supplementary movie 3.
Supplementary movie 4.
Supplementary movie 5.
Supplementary movie 6.
Supplementary movie 7.
Acknowledgements
This work was supported by the National Key Research and Development Program of China (Nos. 2017YFC1309100 and 2017YFA0205200), National Natural Science Foundation of China (Nos. 21804104, 91959124, 81671753, and 32071406), the Youth Innovation Team of Shaanxi Universities, Natural Science Foundation of Shaanxi Province of China (No. 2020PT-020), Natural Science Basic Research Plan in Shaanxi Province of China (No. 2021JM-147), the Fundamental Research Funds for the Central Universities (Nos. JB211201, JC2112, JB211202, JB211204).
Competing Interests
The authors have declared that no competing interest exists.
References
1. Criqui Aboyans. Epidemiology of peripheral artery disease. Circ Res. 2015;116:1509-1526
2. Kullo IJ, Rooke TW. Peripheral Artery Disease. N Engl J Med. 2016;374:861-871
3. Rachael L Morley, Anita Sharma, Alexander D Horsch, Robert J Hinchliffe. Peripheral artery disease. BMJ. 2018;360:j5842
4. Campia U, Gerhard-Herman M, Piazza G, Goldhaber SZ. Peripheral Artery Disease: Past, Present, and Future. Am J Med. 2019;132:1133-1141
5. Kochar A, Mulder H, Rockhold FW, Baumgartner I, Berger JS, Blomster JI, Fowkes FGR, Katona BG, Lopes RD, Al-Khalidi HR, Mahaffey KW, Norgren L, Hiatt WR, Patel MR, Jones WS. Cause of Death Among Patients With Peripheral Artery Disease: Insights From the EUCLID Trial. Circ Cardiovasc Qual Outcomes. 2020;13:e006550
6. Fowkes FGR, Aboyans V, Fowkes FJI, McDermott MM, Sampson UKA, Criqui MH. Peripheral artery disease: epidemiology and global perspectives. Nat Rev Cardiol. 2017;14:156-170
7. Jones DW, Farber A. Review of the Global Vascular Guidelines on the Management of Chronic Limb-Threatening Ischemia. JAMA Surg. 2020;155:161-162
8. Fowkes FGR, Rudan D, Rudan I, Aboyans V, Denenberg JO, McDermott MM, Norman PE, Sampson UKA, Williams LJ, Mensah GA, Criqui MH. Comparison of global estimates of prevalence and risk factors for peripheral artery disease in 2000 and 2010: a systematic review and analysis. Lancet. 2013;382:1329-1340
9. Morooka H, Tanaka A, Inaguma D, Maruyama S. Peripheral artery disease at the time of dialysis initiation and mortality: a prospective observational multicenter study. BMJ Open. 2020;10:e042315
10. Collins R. Duplex ultrasonography, magnetic resonance angiography, and computed tomography angiography for diagnosis and assessment of symptomatic, lower limb peripheral arterial disease: systematic review. BMJ. 2007;334:C1298
11. Li M, Li Z, Gao P, Jin L, Li L, Zhao W, Zhang W, Sun YL, Zhao Y, Cui JS. Quantitative evaluation of postintervention foot blood supply in patients with peripheral artery disease by computed tomography perfusion. J Vasc Surg. 2020;72:1035-1042
12. Cavallo AU, Koktzoglou I, Edelman RR, Gilkeson R, Mihai G, Shin T, Rajagopalan S. Noncontrast Magnetic Resonance Angiography for the Diagnosis of Peripheral Vascular Disease. Circ Cardiovasc Imaging. 2019;12:e008844
13. Divakaran S, Sobieszczyk PS, Di Carli MF. The Potential of PET in the Management of Peripheral Arterial Disease. JACC Cardiovasc Imaging. 2020;13:1018-1020
14. Aboyans V, Ricco JB, Bartelink MLEL, Bjorck M, Brodmann M, Cohnert T, Collet JP, Czerny M, De Carlo M, Debus S, Espinola-Klein C, Kahan T, Kownator S, Mazzolai L, Naylor AR, Roffi M, Röther J, Sprynger M, Tendera M, Tepe G, Venermo M, Vlachopoulos C, Desormais I. 2017 ESC Guidelines on the Diagnosis and Treatment of Peripheral Arterial Diseases, in collaboration with the European Society for Vascular Surgery (ESVS). Eur Heart J. 2018;39:763-816
15. Hong GS, Lee JC, Jha A, Diao S, Nakayama KH, Hou LQ, Doyle TC, Robinson JT, Antaris AL, Dai HJ, Cooke JP, Huang NF. Near-infrared II fluorescence for imaging hindlimb vessel regeneration with dynamic tissue perfusion measurement. Circ Cardiovasc Imaging. 2014;7:517-525
16. Kolte D, Parikh SA, Piazza G, Shishehbor MH, Beckman JA, White CJ, Jaff MR, Iribarne A, Nguyen TC, Froehlich JB, Rosenfield K, Aronow HD. Vascular Teams in Peripheral Vascular Disease. J Am Coll Cardiol. 2019;73:2477-2486
17. Mancusi C, de Simone G, Hitij JB, Sudano I, Mahfoud F, Parati G, Kahan T, Barbato E, Pierard LA, Garbi M, Flachskampf FA, Gerdts E. Management of patients with combined arterial hypertension and aortic valve stenosis: a consensus document from the Council on Hypertension and Council on Valvular Heart Disease of the European Society of Cardiology, the European Association of Cardiovascular Imaging (EACVI), and the European Association of Percutaneous Cardiovascular Interventions (EAPCI). Eur Heart J Cardiovasc Pharmacother. 2021;7:242-250
18. Hong GS, Lee JC, Robinson JT, Raaz U, Xie LM, Huang NF, Cooke JP, Dai HJ. Multifunctional in vivo vascular imaging using near-infrared II fluorescence. Nat Med. 2012;18:1841-1846
19. Hu ZH, Fang C, Li B, Zhang ZY, Cao CG, Cai MS, Su S, Sun XW, Shi XJ, Li C, Zhou TJ, Zhang YX, Chi CW, He P, Xia XM, Chen Y, Gambhir SS, Cheng Z, Tian J. First-in-human liver-tumour surgery guided by multispectral fluorescence imaging in the visible and near-infrared-I/II windows. Nat Biomed Eng. 2020;4:259-271
20. Fang Y, Shang JZ, Liu DK, Shi W, Li XH, Ma HM. Design, Synthesis, and Application of a Small Molecular NIR-II Fluorophore with Maximal Emission beyond 1200 nm. J Am Chem Soc. 2020;142:15271-15275
21. Li DF, He SQ, Wu YF, Liu JQ, Liu Q, Chang BS, Zhang Q, Xiang ZH, Yuan Y, Jian C, Yu AX, Cheng Z. Excretable Lanthanide Nanoparticle for Biomedical Imaging and Surgical Navigation in the Second Near-Infrared Window. Adv Sci. 2019;6:1902042
22. Liu HL, Hong GS, Luo ZT, Chen JC, Chang JL, Gong M, He H, Yang J, Yuan X, Li LL, Mu XY, Wang JY, Mi WB, Luo J, Xie JP, Zhang XD. Atomic-Precision Gold Clusters for NIR-II Imaging. Adv Mater. 2019;31:e1901015
23. Yang HC, Huang HY, Ma X, Zhang YJ, Yang XH, Yu MX, Sun ZQ, Li CY, Wu F, Wang QB. Au-Doped Ag2Te Quantum Dots with Bright NIR-IIb Fluorescence for In situ Monitoring of Angiogenesis and Arteriogenesis in a Hindlimb Ischemic Model. Adv Mater. 2021 e2103953
24. Zhu SJ, Yung BC, Chandra S, Niu G, Antaris AL, Chen XY. Near-Infrared-II (NIR-II) Bioimaging via Off-Peak NIR-I Fluorescence Emission. Theranostics. 2018;8:4141-4151
25. Lei XL, Li RF, Tu DT, Shang XY, Liu Y, You WW, Sun CX, Zhang F, Chen XY. Intense near-infrared-II luminescence from NaCeF4:Er/Yb nanoprobes for in vitro bioassay and in vivo bioimaging. Chem Sci. 2018;9:4682-4688
26. Liu SJ, Ou HL, Li YY, Zhang HK, Liu JK, Lu XF, Kwok RTK, Lam JWY, Ding D, Tang BZ. Planar and Twisted Molecular Structure Leads to the High Brightness of Semiconducting Polymer Nanoparticles for NIR-IIa Fluorescence Imaging. J Am Chem Soc. 2020;142:15146-15156
27. Li Y, Liu YF, Li QQ, Zeng XD, Tian T, Zhou WY, Cui Y, Wang XK, Cheng XD, Ding QH, Wang XF, Wu JZ, Deng H, Li YQ, Meng XL, Deng ZX, Hong XC, Xiao YL. Novel NIR-II organic fluorophores for bioimaging beyond 1550 nm. Chem Sci. 2020;11:2621-2626
28. Huang JG, Pu KY. Activatable Molecular Probes for Second Near-Infrared Fluorescence, Chemiluminescence, and Photoacoustic Imaging. Angew Chem Int Ed Engl. 2020;59:11717-11731
29. Zhang Z, Fang XF, Liu ZH, Liu HC, Chen DD, He SQ, Zheng J, Yang B, Qin WP, Zhang XJ, Wu CF. Semiconducting Polymer Dots with Dually Enhanced NIR-Iia Fluorescence for Through-Skull Mouse Brain Imaging. Angew Chem Int Ed Engl. 2020;59:3691-3698
30. Bashkatov AN, Genina EA, Kochubey VI, Tuchin VV. Optical properties of human skin, subcutaneous and mucous tissues in the wavelength range from 400 to 2000 nm. Journal of Physics D Applied Physics. 2005;38:2543
31. Li YB, Zeng SJ, Hao JH. Non-Invasive Optical Guided Tumor Metastasis/Vessel Imaging by Using Lanthanide Nanoprobe with Enhanced Down-Shifting Emission beyond 1500 nm. ACS Nano. 2019;13:248-259
32. Wang SF, Liu L, Fan Y, El-Toni AM, Alhoshan MS, Li DD, Zhang F. In vivo High-resolution Ratiometric Fluorescence Imaging of Inflammation Using NIR-II Nanoprobes with 1550 nm Emission. Nano Lett. 2019;19:2418-2427
33. Zhang MX, Yue JY, Cui R, Ma ZR, Wan H, Wang FF, Zhu SJ, Zhou Y, Kuang Y, Zhong YT, Pang DW, Dai HJ. Bright quantum dots emitting at ∼1,600 nm in the NIR-IIb window for deep tissue fluorescence imaging. Proc Natl Acad Sci USA. 2018;115:6590-6595
34. Diao S, Blackburn JL, Hong GS, Antaris AL, Chang JL, Wu JZ, Zhang B, Cheng K, Kuo CJ, Dai HJ. Fluorescence Imaging In vivo at Wavelengths beyond 1500 nm. Angew Chem Int Ed Engl. 2015;54:14758-14762
35. Li XL, Jiang MY, Zeng SJ, Liu HR. Polydopamine coated multifunctional lanthanide theranostic agent for vascular malformation and tumor vessel imaging beyond 1500 nm and imaging-guided photothermal therapy. Theranostics. 2019;9:3866-3878
36. Sun CX, Li BH, Zhao MY, Wang SF, Lei ZH, Lu LF, Zhang HX, Feng LS, Dou CR, Yin DR, Xu HX, Cheng YS, Zhang F. J-Aggregates of Cyanine Dye for NIR-II in vivo Dynamic Vascular Imaging beyond 1500 nm. J Am Chem Soc. 2019;141:19221-19225
37. Liu MH, Zhang Z, Yang YC, Chan YH. Polymethine-Based Semiconducting Polymer Dots with Narrow-Band Emission and Absorption/Emission Maxima at NIR-II for Bioimaging. Angew Chem Int Ed Engl. 2021;60:983-989
38. Ma ZR, Zhang MX, Yue JY, Alcazar C, Zhong YT, Doyle TC, Dai HJ, Huang NF. Near-Infrared IIb Fluorescence Imaging of Vascular Regeneration with Dynamic Tissue Perfusion Measurement and High Spatial Resolution. Adv Funct Mater. 2018;28:1803417
39. Zhong YT, Ma ZR, Zhu SJ, Yue JY, Zhang MX, Antaris AL, Yuan J, Cui R, Wan H, Zhou Y, Wang W, Huang NF, Luo J, Hu ZY, Dai HJ. Boosting the down-shifting luminescence of rare-earth nanocrystals for biological imaging beyond 1500 nm. Nat Commun. 2017;8:737
40. Xie XJ, Gao NY, Deng RR, Sun Q, Xu QH, Liu XG. Mechanistic investigation of photon upconversion in Nd(3+)-sensitized core-shell nanoparticles. J Am Chem Soc. 2013;135:12608-12611
41. Zhong YT, Ma ZR, Wang FF, Wang X, Yang YJ, Liu YL, Zhao X, Li JC, Du HT, Zhang MX, Cui QH, Zhu SJ, Sun QC, Wan H, Tian Y, Liu Q, Wang WZ, Garcia KC, Dai HJ. In vivo molecular imaging for immunotherapy using ultra-bright near-infrared-IIb rare-earth nanoparticles. Nat Biotechnol. 2019;37:1322-1331
42. Ren F, Liu HH, Zhang H, Jiang ZL, Xia B, Genevois C, He T, Allix M, Sun Q, Li Z, Gao MY. Engineering NIR-IIb fluorescence of Er-based lanthanide nanoparticles for through-skull targeted imaging and imaging-guided surgery of orthotopic glioma. Nano Today. 2020;34:100905
43. Cao C, Wu N, Yuan W, Gu YY, Ke JM, Feng W, Li FY. Ln3+-doped nanoparticles with enhanced NIR-II luminescence for lighting up blood vessels in mice. Nanoscale. 2020;12:8248-8254
44. Li YB, Jiang MY, Xue ZL, Zeng SJ. 808 nm light triggered lanthanide nanoprobes with enhanced down-shifting emission beyond 1500 nm for imaging-guided resection surgery of tumor and vascular visualization. Theranostics. 2020;10:6875-6885
45. Wu D, Xue DW, Zhou J, Wang YF, Feng Z, Xu JJ, Lin H, Qian J, Cai XJ. Extrahepatic cholangiography in near-infrared II window with the clinically approved fluorescence agent indocyanine green: a promising imaging technology for intraoperative diagnosis. Theranostics. 2020;10:3636-3651
46. Wang SF, Fan Y, Li DD, Sun CX, Lei ZH, Lu LF, Wang T, Zhang F. Anti-quenching NIR-II molecular fluorophores for in vivo high-contrast imaging and pH sensing. Nat Commun. 2019;10:1058
47. Hanahan D, Weinberg RA. Hallmarks of cancer: the next generation. Cell. 2011;144:646-674
48. De Palma M, Biziato D, Petrova TV. Microenvironmental regulation of tumour angiogenesis. Nat Rev Cancer. 2017;17:457-474
49. Erhardt W, Hebestedt A, Aschenbrenner G, Pichotka B, Blümel G. A comparative study with various anesthetics in mice (pentobarbitone, ketamine-xylazine, carfentanyl-etomidate). Res Exp Med. 1984;184:159-169
50. Cosco ED, Spearman AL, Ramakrishnan S, Lingg JGP, Saccomano M, Pengshung M, Arús BA, Wong KCY, Glasl S, Ntziachristos V, Warmer M, McLaughlin RR, Bruns OT, Sletten EM. Shortwave infrared polymethine fluorophores matched to excitation lasers enable non-invasive, multicolour in vivo imaging in real time. Nat Chem. 2020;12:1123-1130
51. Hong GS, Robinson JT, Zhang YJ, Diao S, Antaris AL, Wang QB, Dai HJ. In vivo fluorescence imaging with Ag2S quantum dots in the second near-infrared region. Angew Chem Int Ed Engl. 2012;51:9818-9821
52. Tritschler T, Kraaijpoel N, Le Gal G, Wells PS. Venous Thromboembolism: Advances in Diagnosis and Treatment. JAMA. 2018;320:1583-1594
53. Meissner MH, Gloviczki P, Comerota AJ, Dalsing MC, Eklof BG, Gillespie DL, Lohr JM, McLafferty RB, Murad MH, Padberg F, Pappas P, Raffetto JD, Wakefield TW. Early thrombus removal strategies for acute deep venous thrombosis: clinical practice guidelines of the Society for Vascular Surgery and the American Venous Forum. J Vasc Surg. 2012;55:1449-1462
54. Liang HY, Hong ZZ, Li SH, Song XR, Zhang D, Chen QS, Li J, Yang HH. An Activatable X-Ray Scintillating Luminescent Nanoprobe for Early Diagnosis and Progression Monitoring of Thrombosis in Live Rat. Adv Funct Mater. 2021;5:2006353
55. Sun B, Hettie KS, Zhu SJ. Near-infrared Fluorophores for Thrombosis Diagnosis and Therapy. Adv Ther. 2021;4:2000278
56. Wan MM, Wang Q, Wang RL, Wu R, Li T, Fang D, Huang YY, Yu YQ, Fang LY, Wang XW, Zhang YH, Miao ZY, Zhao B, Wang FH, Mao C, Jiang Q, Xu XQ, Shi DQ. Platelet-derived porous nanomotor for thrombus therapy. Sci Adv. 2020;6:eaaz9014
57. Yang PP, Zhang K, He PP, Fan Y, Gao XJ, Gao X, Chen ZM, Hou DY, Li Y, Yi Y, Cheng DB, Zhang JP, Shi L, Zhang XZ, Wang L, Wang H. A biomimetic platelet based on assembling peptides initiates artificial coagulation. Sci Adv. 2020;6:eaaz4107
58. Kadir RRA, Bayraktutan U. Urokinase Plasminogen Activator: A Potential Thrombolytic Agent for Ischaemic Stroke. Cell Mol Neurobiol. 2020;40:347-355
59. Kunamneni A, Ravuri BD, Saisha V, Ellaiah P, Prabhakhar T. Urokinase-a very popular cardiovascular agent. Recent Pat Cardiovasc Drug Discov. 2008;3:45-58
60. Bonnard T, Hagemeyer CE. Ferric Chloride-induced Thrombosis Mouse Model on Carotid Artery and Mesentery Vessel. J Vis Exp. 2015;100:e52838
61. Li DF, Qu CR, Liu Q, Wu YF, Hu X, Qian K, Chang BS, He SQ, Yuan Y, Li YZ, Ko T, Yu AX, Cheng Z. Monitoring the Real-Time Circulatory System-Related Physiological and Pathological Processes In vivo Using a Multifunctional NIR-II Probe. Adv Funct Mater. 2019;6:1906343
62. Misra S, Shishehbor MH, Takahashi EA, Aronow HD, Brewster LP, Bunte MC, Kim ESH, Lindner JR, Rich K. Perfusion Assessment in Critical Limb Ischemia: Principles for Understanding and the Development of Evidence and Evaluation of Devices: A Scientific Statement From the American Heart Association. Circulation. 2019;140:E657-E672
63. Kal A, Duman E, Sezenöz AS, Ulusoy MO, Kal Ö. Evaluation of retrobulbar blood flow and choroidal thickness in patients with rheumatoid arthritis. Int Ophthalmol. 2018;38:1825-1831
64. Akyürek O, Berkalp B, Sayin T, Kumbasar D, Kervancioğlu C, Oral D. Altered coronary flow properties in diffuse coronary artery ectasia. Am Heart J. 2003;145:66-72
Author contact
![]() Corresponding authors: Ruili Zhang, E-mail: rlzhangedu.cn; Zhongliang Wang, E-mail: wangzledu.cn; Jianxiong Li, E-mail: 301301ljxcom.
Corresponding authors: Ruili Zhang, E-mail: rlzhangedu.cn; Zhongliang Wang, E-mail: wangzledu.cn; Jianxiong Li, E-mail: 301301ljxcom.