Impact Factor
- Issue 14; 2026
- Issue 13; 2026
- Issue 12; 2026
- Issue 11; 2026
- Issue 10; 2026
- Volume 16; 2026
- Advance Articles
- Past Issues
- Cover Images
- Cover Suggestion
- Index & Coverage
- Special Issues
Introduction
Methods
Results
Discussion
Conclusions
Abbreviations
Supplementary Material
Acknowledgements
References
International Journal of Biological Sciences
International Journal of Medical Sciences
 Global reach, higher impact

Theranostics 2021; 11(17):8396-8411. doi:10.7150/thno.58140 This issue Cite
Research Paper
Establishment and prospective validation of an SUVmax cutoff value to discriminate clinically significant prostate cancer from benign prostate diseases in patients with suspected prostate cancer by 68Ga-PSMA PET/CT: a real-world study
Jianhua Jiao1#, Fei Kang2#, Jingliang Zhang1,3#, Zhiyong Quan2, Weihong Wen4, Xiaohu Zhao2, Shuaijun Ma1, Peng Wu1, Fa Yang1, Wei Guo1, Xiaojian Yang1, Jianlin Yuan1, Yongquan Shi5 ![]() , Jing Wang2
, Jing Wang2 ![]() , Weijun Qin1
, Weijun Qin1 ![]()
1. Department of Urology, Xijing Hospital, Fourth Military Medical University, Xi'an, Shaanxi, China
2. Department of Nuclear Medicine, Xijing Hospital, Fourth Military Medical University, Xi'an, Shaanxi, China
3. Department of Health Services, Health Service Training Base, Fourth Military Medical University, Xi'an 710032, China
4. Institute of Medical Research, Northwestern Polytechnical University, Xi'an, Shaanxi, China
5. State Key Laboratory of Cancer Biology, Xijing Hospital, Air Force Military Medical University, Xi'an 710032, China
# These authors contributed equally to this article.
Received 2021-1-13; Accepted 2021-6-20; Published 2021-7-25
Abstract

Background and Aims: The aims of this study were to establish a maximum standardized uptake value (SUVmax) cutoff to discriminate clinically significant prostate cancer (csPCa) from benign prostate disease (BPD) by 68Ga-labeled prostate-specific membrane antigen (68Ga-PSMA-11) positron emission tomography/computed tomography (PET/CT) in patients with suspected prostate cancer (PCa), and to perform a prospective real-world validation of this cutoff value.
Methods: The study included a training cohort to identify an SUVmax cutoff value and a prospective real-world cohort to validate it. A retrospective analysis assessed 135 patients with suspected PCa in a large tertiary care hospital in China who underwent 68Ga-PSMA-11 PET/CT. All patients were suspected of having PCa based on symptoms, digital rectal examination (DRE), total prostate-specific antigen (tPSA) level, and multiparameter magnetic resonance imaging (mpMRI). The 68Ga-PSMA PET/CT results were evaluated using histopathological results from transrectal ultrasound-guided 12-core biopsy with necessary targeted biopsy as references. Patients with Gleason scores (GS) ≥7 from the biopsy results were diagnosed with csPCa, and patients with negative biopsy and follow-up results were diagnosed with BPD. Receiver operating characteristic (ROC) curve analysis was used to identify the optimal SUVmax cutoff value. The cutoff value was prospectively validated in 58 patients with suspected PCa. The diagnostic benefits of the cutoff value for clinical decision making were also evaluated.
Results: According to ROC curve analysis, the most appropriate SUVmax cutoff value for discriminating csPCa from BPD was 5.30 (sensitivity, 85.85%; specificity, 86.21%; area under the curve [AUC], 0.893). The cutoff achieved a sensitivity of 83.33%, a specificity of 81.25%, a positive predictive value (PPV) of 92.11%, a negative predictive value (NPV) of 65.00%, and an accuracy of 82.76% in the prospective validation cohort. Metastases were used as an indicator to reduce false negative results in patients with SUVmax ≤ 5.30. In patients without metastases, an SUVmax value of 5.30 was also the best cutoff to diagnose localized csPCa (sensitivity, 80.43%; specificity, 86.21%; AUC, 0.852). The cutoff discriminated localized csPCa from BPD with a sensitivity of 76.19%, a specificity of 81.25%, a PPV of 84.21%, an NPV of 72.22%, and an accuracy of 78.38% in the prospective validation cohort. The cutoff, combined with metastases, achieved an accuracy of 89.12% in all patients, increasing accuracy by 8.29% and reducing equivocal results compared with manual reading. There was a strong correlation between SUVmax and PSMA expression (rs = 0.831, P < 0.001) and a moderate correlation between SUVmax and GS (rs = 0.509, P < 0.001). The PSMA expression and SUVmax values of patients with csPCa were significantly higher than those of patients with BPD (P < 0.001).
Conclusion: We established and prospectively validated the best SUVmax cutoff value (5.30) for discriminating csPCa from BPD with high accuracy in patients with suspected PCa. 5.30 is an effective cutoff to discriminate csPCa patients with or without metastases. The cutoff may provide a potential tool for the precise identification of csPCa by 68Ga-PSMA PET/CT, ensuring high accuracy and reducing equivocal results.
Keywords: SUVmax, cutoff, prostate cancer, benign prostate hypertrophy, PSMA PET/CT, immunohistochemistry
Introduction
With nearly 1.4 million new cases in 2020, prostate cancer (PCa) is the second most commonly diagnosed cancer and the fifth leading cause of cancer-associated death in males worldwide [1]. Unique from other tumors, prostate tumors require more than a malignant/benign classification. PCa can be divided according to Gleason score (GS) as clinically significant prostate cancer (csPCa, GS = 7-10) and clinically non-significant PCa (cnsPCa, GS = 6). Because the 10- and 15-year actuarial cause-specific survival rates of cnsPCa with active surveillance are as high as 98.1% and 94.3% [2], the recommend treatment strategy for cnsPCa is active surveillance, which is different from the recommended strategy for csPCa [3-5]. As a result, the identification of csPCa is a unique clinical need for decision making. 68Ga-labeled prostate-specific membrane antigen (68Ga-PSMA) positron emission tomography/computed tomography (PET/CT) is a relatively new molecular imaging technique that shows superior performance to conventional imaging techniques in diagnosing and staging PCa, providing us with an opportunity to discriminate patients with csPCa (GS ≥ 7) from those with benign prostate diseases (BPD) [6, 7]. Compared with conventional CT and bone scanning, 68Ga-PSMA PET/CT has higher sensitivity and specificity [8]. Therefore, 68Ga-PSMA PET/CT may accurately discriminate csPCa from BPD, which is currently difficult as patients with BPD exhibit similar results from traditional examinations as patients with csPCa. 68Ga-PSMA PET/CT could also provide more information for the primary staging of patients with PCa.
Currently, the evaluation of 68Ga-PSMA PET/CT results is still highly dependent on the experience of nuclear medicine experts, and quantitative standards for its parameters are still lacking. Consensus statements on PSMA PET/CT have demonstrated that a cutoff value for the maximum standardized uptake value (SUVmax) is urgently needed [9]. SUVmax is the highest signal within a volume of interest (VOI), which has high reproducibility between investigators as it is not dependent on the size of the selected VOI [10]. SUVmax is appropriate for diagnosing primary PCa because it correlates significantly with PSMA expression [11]. For primary PCa, patients with higher GS tend to have stronger PSMA expression [12]. Consistent with PSMA expression by immunohistochemistry (IHC), the SUVmax of 68Ga-PSMA PET/CT is also closely correlated with GS [13-16]. In a segment analysis of patients with PCa, 68Ga-PSMA PET/CT showed a high detection rate, and the SUVmax values of the segments with GS = 7-10 were significantly higher than those of their nearby normal prostate (PN) tissues [13]. In a patient analysis, there was a moderate positive correlation between SUVmax values and GS, and patients with higher GS had higher SUVmax values [14, 15].
However, the previous studies focused on either lesion-based studies to discriminate PCa from BPD or patient-based studies to discriminate patients with high-risk PCa within a PCa cohort [11, 13-17]. A large cohort patient-based analysis for the differential diagnosis of csPCa from BPD in patients with suspected PCa by SUVmax of 68Ga-PSMA PET/CT is essential. A threshold value for the SUVmax cutoff is urgently needed to discriminate patients with csPCa from those with BPD in clinical practice.
An appropriate SUVmax cutoff value to discriminate patients with csPCa from patients with BPD has not been described. A large cohort study with prospective real-world validation and histopathological results is still lacking. Therefore, the aim of this study was to select and prospectively validate an SUVmax cutoff value for discriminating patients with csPCa from those with BPD using pathological results as references. The additional diagnostic benefits of the established SUVmax cutoff value for clinical decision making were also evaluated.
Methods
Study population
A database from a large tertiary care hospital in China was retrospectively analyzed. All patients with suspected PCa based on symptoms and elevated prostate-specific antigen (PSA) underwent 68Ga-PSMA PET/CT from April 2017 to December 2019. Patients were included if they had suspected PCa based on the following examinations: 1) symptoms, 2) digital rectal examination (DRE), 3) total PSA (tPSA) levels, and 4) multiparameter magnetic resonance imaging (mpMRI). Specimens from biopsy were also needed for analysis. Patients with suspicious findings by mpMRI, as well as those with ongoing clinical concern despite a normal mpMRI, underwent 68Ga-PSMA PET/CT and biopsy. The exclusion criteria were as follows: 1) treatment, such as androgen deprivation therapy (ADT), radical prostatectomy (RP), radiotherapy, or chemotherapy, was received before 68Ga-PSMA PET/CT; 2) the interval between 68Ga-PSMA PET/CT and biopsy was longer than 30 days; or 3) GS = 6 (3 + 3). The patients in the prospective validation group were enrolled from the same center from January 2020 to October 2020. The study was approved by the Ethics Committee of Xijing Hospital (approval no. KY20162088-1), and all participating patients provided written informed consent. The research was conducted in adherence with the Declaration of Helsinki and national regulations.
Study design
Relevant clinical data were collected for patient charts, such as tPSA levels at scan time and GS. All tissues from biopsies were analyzed for PSMA expression by IHC. We recorded the SUVmax values and zonal anatomy of primary tumors in 68Ga-PSMA PET/CT-positive cases. Metastases, such as lymph node metastases (LNMs), bone metastases (BMs), and visceral metastases, were also recorded for analysis. Patients with cnsPCa (GS = 6) were excluded in the identification of the SUVmax cutoff value because they may receive active surveillance to treat indolent tumors [4, 5]. However, they were included in the analysis of the correlation between PSMA expression and GS.
Collection and evaluation of 68Ga-PSMA PET/CT images
Patients underwent 68Ga-PSMA PET imaging with a Biograph 40 system (Siemens Medical Solutions, Erlangen, Germany). The mean injection activity of 68Ga-PSMA PET was 139.72 ± 25.00 MBq. Details are given in the supplementary information. All 68Ga-PSMA PET/CT images were evaluated at a single center (Xijing Hospital, Fourth Military Medical University, Xi'an, Shaanxi, China). The 68Ga-PSMA PET/CT scans were evaluated by two board-certified nuclear medicine experts (Z.Q. and F.K.) with more than 10 years of experience in reading PET images and one board-certified radiation oncologist (J.W.). The scans were evaluated using a Siemens MIWP workstation (Syngo MIWP; Siemens Medical Solutions, Erlangen, Germany) according to the Joint European Association of Nuclear Medicine and Society of Nuclear Medicine and Molecular Imaging procedure guidelines (version 1.0) [18, 19]. The zonal anatomy analysis was based on a method from a previous study [20].
Histological examination
A transrectal ultrasound-guided 12-core biopsy with necessary additional target biopsy was performed for each patient. All tissues from biopsies were routinely fixed in formalin and processed for hematoxylin-eosin (HE) staining and IHC staining for PSMA. The GS (International Society of Urological Pathology grade) was considered to be the highest score on the biopsy specimens for each patient. As references, the histopathological results were stratified in accordance with the 7th edition of the American Joint Committee on Cancer staging system for PCa [21]. The pathological sections were scored according to the consensus of two board-certified genitourinary pathologists, as previously described [22]. The specialists were blinded to both the clinical evaluation of the samples from the surgeons and the 68Ga-PSMA PET/CT results.
IHC staining and evaluation
All tissues were fixed in formalin, embedded in paraffin, and routinely processed for IHC staining to evaluate PSMA expression with an anti-PSMA monoclonal antibody (clone 1D6, 1:100, MAB-0575, MXB Biotechnologies), as we previously described [23]. PSMA expression was assessed in a semiquantitative manner according to the modified H-score method, adapted from previous studies [24, 25]. The staining intensity categories (0 = negative, 1 = weak, 2 = moderate, 3 = strong, and 4 = extremely strong) are shown in Figure S1. A modified H-score ([% weak staining × 1] + [% moderate staining × 2] + [% strong staining × 3] + [% extremely strong staining × 4]) was given by the consensus of two experienced pathologists to determine the overall percentage of PSMA positivity across the entire stained specimen, yielding a score range from 0 to 400 [26]. Details are given in the supplementary information.
Intraclass correlation coefficient analysis
The SUVmax was measured by two nuclear medicine specialists (Z.Q. and F.K.) with more than ten years of experience in reading PET images. Intraclass correlation coefficient (ICC) analysis of the SUVmax values was used to evaluate interobserver reproducibility, as previously reported [27]. ICC results were determined to indicate very good agreement if greater than 0.80 [27]. Details are given in the supplementary information.
Follow-up
The patients were followed up every 6 months by imaging, biochemistry, and histopathology, consistent with guidelines and previous studies [8, 28]. In the follow-up, mpMRI, tPSA measurement, and necessary re-biopsy were performed. All patients were followed up at least once in this study.
Statistical analysis
Descriptive statistics were calculated and presented as the frequency (percentage) for categorical variables, the mean (standard deviation) for continuous variables with a normal distribution, and the median (quartile) for continuous variables with a skewed distribution. Two-sample t-tests were used to assess continuous variables with a normal distribution, and the Wilcoxon signed-rank test was used to assess continuous variables with a skewed distribution. The Mann-Whitney U test was used to compare means from two samples. The correlation between two samples was analyzed by Spearman's ρ test. The receiver operating characteristic (ROC) curve was used to determine the cutoff value of SUVmax for diagnosing patients with csPCa. The ICC analysis was performed by reliability analysis. All statistical analyses were conducted using IBM SPSS statistics software, version 23.0 (IBM, Inc., Chicago, IL, USA) and GraphPad Prism software, version 8.0 (GraphPad Software, Inc., La Jolla, CA, USA). All hypothesis tests were two-sided, and P < 0.05 was considered to indicate statistical significance.
Results
Patient characteristics
According to the inclusion and exclusion criteria, 135 patients were included in the training cohort and 58 patients were recruited for the prospective validation cohort. In the training cohort of 135 patients with suspected PCa, 106 patients were confirmed to have csPCa and the other 29 patients were pathologically diagnosed with BPD (Figure 1). The validation cohort of 58 patients with suspected PCa included 42 with csPCa and 16 with BPD (Figure 1). The patient characteristics are shown in Table 1. The detailed pathological diagnosis of patients with BPD is shown in Table S1. After excluding the patients with metastatic csPCa (mcsPCa; LNMs, BMs, or visceral metastases), the characteristics of the remaining patients are shown in Table S2. As shown Table S3, no significant differences were observed between the training and validation cohorts.
Study design.
Characteristics of patients with BPD or csPCa.
| Characteristic | Training cohort (n = 135) | Validation cohort (n = 58) | |||||||
|---|---|---|---|---|---|---|---|---|---|
| BPD | csPCa | χ/z | P | BPD | csPCa | χ/z | P | ||
| n (%) | 29 (21.5) | 106 (78.5) | —— | —— | 16 (27.6) | 42 (72.4) | —— | —— | |
| Mean age, y | 68.21 ± 9.37 | 70.16 ± 8.28 | —— | <0.001 | 64.56 ± 10.83 | 70.55 ± 9.72 | —— | 0.054 | |
| Mean acquisition time, min after injection | 61.79 ± 9.90 | 65.83 ± 13.30 | —— | 0.182 | 65.56 ± 12.64 | 65.62 ± 13.11 | —— | 0.896 | |
| Mean interval between biopsy and PSMA PET/CT, d | 10.04 ± 6.15 | 9.51 ± 6.38 | —— | 0.562 | 10.07 ± 6.64 | 10.81 ± 7.04 | —— | 0.972 | |
| Mean H-score | 41.44 ± 39.93 | 200.04 ± 102.37 | -6.874 | <0.001 | 59.25 ± 85.17 | 172.07 ± 101.77 | -3.845 | <0.001 | |
| Median tPSA, ng/mL (P25-P75) | 11.73 (7.10-14.90) | 32.92 (10.01-175.73) | -3.568 | <0.001 | 9.72 (7.46-13.56) | 40.84 (13.66-83.96) | -3.584 | <0.001 | |
| ≤4, n (%) | 4/135 (3.0) | 18/135 (13.3) | —— | —— | 1/58 (1.7) | 2/58 (3.4) | —— | —— | |
| 4-10, n (%) | 6/135 (4.4) | 9/135 (6.7) | —— | —— | 8/58 (13.8) | 5/58 (8.6) | —— | —— | |
| 10-20, n (%) | 14/135 (10.4) | 17/135 (12.6) | —— | —— | 5/58 (8.6) | 9/58 (15.5) | —— | —— | |
| >20, n (%) | 5/135 (3.7) | 62/135 (45.9) | —— | —— | 2/58 (3.4) | 26/58 (44.8) | —— | —— | |
| GS, n (%) | —— | 106 (100.0) | —— | —— | —— | 42 (100.0) | —— | —— | |
| 7 (3 + 4) | —— | 11/106 (10.4) | —— | —— | —— | 7/42 (16.7) | —— | —— | |
| 7 (4 + 3) | —— | 21/106 (19.8) | —— | —— | —— | 5/42 (11.9) | —— | —— | |
| 8 (4 + 4) | —— | 41/106 (38.7) | —— | —— | —— | 14/42 (33.3) | —— | —— | |
| 8 (5 + 3) | —— | 3/106 (2.8) | —— | —— | —— | 1/42 (2.4) | —— | —— | |
| 9 (4 + 5) | —— | 14/106 (13.2) | —— | —— | —— | 9/42 (21.4) | —— | —— | |
| 9 (5 + 4) | —— | 9/106 (8.5) | —— | —— | —— | 2/42 (4.8) | —— | —— | |
| 10 (5 + 5) | —— | 7/106 (6.6) | —— | —— | —— | 4/42 (9.5) | —— | —— | |
| lcsPCa, n (%) | —— | 46/106 (43.4) | —— | —— | —— | 21/42 (50.0) | —— | —— | |
| mcsPCa, n (%) | —— | 60/106 (56.6) | —— | —— | —— | 21/42 (50.0) | —— | —— | |
| Lymph node | —— | 44/106 (41.5) | —— | —— | —— | 13/42 (31.0) | —— | —— | |
| Bone | —— | 42/106 (39.6) | —— | —— | —— | 17/42 (40.5) | —— | —— | |
| Visceral | —— | 9/106 (8.5) | —— | —— | —— | 1/42 (2.4) | —— | —— | |
* Statistically significant; average age, acquisition time, and interval were compared using independent samples t-tests; average H-score and tPSA were compared using Wilcoxon W tests.
Mean values are presented as mean ± SD.
SUVmax is closely correlated with PSMA expression
As we know, PSMA expression on csPCa tissue is significantly higher than that on BPD tissue. To investigate the correlation between SUVmax and PSMA expression by IHC staining and to justify SUVmax in diagnosing patients with csPCa, we analyzed the distribution of SUVmax values according to PSMA expression. As shown in Figure 2A, the H-scores in primary tumors of mcsPCa (205.83 ± 103.43) were higher than those in localized csPCa (lcsPCa, 177.10 ± 98.56), followed by BPD (Table S4A, 45.51 ± 60.17, P < 0.001). Consistent with the H-score results, the SUVmax values in patients with mcsPCa were also higher than those in patients with BPD (Figure 2B, P < 0.001). The SUVmax values were positively correlated with H-score, PSMA staining intensity, and percentage of stained cells (Figure 2C-E, Table S4B). A high percentage of stained cells was observed in the group with high staining intensity (Figure 2F, Table S4C). The detailed data of the comparison in Figure 2 are shown in Table S4A-C. To show the close correlation between SUVmax and PSMA expression, the 68Ga-PSMA PET/CT and IHC results of five representative patients are presented in Figure 3. For all patients, including patients with csPCa or BPD, the SUVmax value in the primary tumor was significantly higher in patients with high H-scores and strong PSMA staining intensity and percentage of stained cells than in patients with low values (Table 2). Furthermore, Spearman's ρ test results suggested a strong correlation between SUVmax and H-score (Table 2, rs = 0.831, P < 0.001). False negative and false positive results of 68Ga-PSMA PET imaging were also observed (Figure S2). Thus, the SUVmax value of 68Ga-PSMA PET/CT was significantly positively correlated with PSMA expression, as validated by IHC staining. Next, in order to further prove the potential of SUVmax to diagnose patients with csPCa, we analyzed the correlation between SUVmax and GS to investigate the potential of an SUVmax cutoff to discriminate csPCa from BPD.
Scatter dot plots depicting H-score according to pathological diagnosis (A); SUVmax according to pathological diagnosis (B), H-score (C), intensity of PSMA staining (D), and percentage of PSMA-stained cells (E); and the percentage of stained cells according to intensity of staining (F). The vertical borders of the box represent the standard deviation, and the middle bar represents the mean value. The H-scores and SUVmax values of patients with lcsPCa and mcsPCa were significantly higher than those with BPD. The SUVmax values were higher in prostatic tissues with higher H-scores, intensities of PSMA staining, and percentages of stained cells than in tissues with lower values. The percentage of stained cells was higher in prostatic tissues with more intense PSMA staining. The detailed comparison data are shown in Tables S4A-C (*, P < 0.05; **, P < 0.01; ***, P < 0.001). SUVmax was closely positively correlated with PSMA expression, as validated by IHC staining (n = 193).
Example 68Ga-PSMA PET/CT images and corresponding IHC and HE staining results showing that SUVmax is significantly correlated with PSMA expression in prostatic tissues. 68Ga-PSMA PET/CT images (A, D, G, J, M), PSMA staining results (B, E, H, K, N), and HE staining results (C, F, I, L, O) of one patient with BPD (A-C) and four patients with PCa (D-O). The first patient (A, SUVmax = 2.90) was pathologically diagnosed with BPD (B, negative staining, 0% stained cells, tPSA = 19.09 ng/mL), while the remaining four patients (C, E, G, I; SUVmax = 3.00, 6.50, 14.50, 60.00, respectively) had pathologically proven PCa (D, F, H, J; GS = 6 (3 + 3), 6 (3 + 3), 7 (4 + 3), 8 (4 + 4); tPSA = 7.43, 19.09, 8.04, 936.10 ng/mL; percentage of stained cells = 15%, 35%, 57%, 95%; intensity of staining = 1, 2, 3, 4). The above representative patients were used to show the close correlation between PSMA expression and SUVmax. Detailed analysis of all patients is shown in Figure 2.
Correlations between SUVmax and H-score, tPSA, and GS.
| rs | P | |
|---|---|---|
| SUVmax vs. H-score | 0.831 | <0.001* |
| SUVmax vs. GS | 0.509 | <0.001* |
| SUVmax vs. tPSA level | 0.445 | <0.001* |
* Statistically significant; Spearman's ρ test.
SUVmax is closely correlated with GS
To investigate the correlation between SUVmax and GS, we analyzed the distribution of SUVmax, validated by H-score, according to GS. Spearman's ρ test results suggested a moderate correlation between SUVmax and GS (Table 3, rs = 0.509, P < 0.001). The H-scores and SUVmax values of patients with GS = 7 were significantly higher than those of patients with BPD and patients with GS = 6 PCa (Figure 4A-B, P < 0.001). In a detailed GS analysis, the H-scores and SUVmax values of patients with GS = 7 (3 + 4) were higher than those of patients with BPD and patients with GS = 6 PCa (Figure 4C-D, Table S5A-B, P < 0.001). Aside from the difference in SUVmax values between GS = 4 + 5 and GS = 5 + 4, no significant difference was found in other adjacent GS groups. In conclusion, the SUVmax value and H-score of primary tumors are closely correlated with GS. It is very feasible to generate a cutoff value for SUVmax, validated by H-score, to discriminate patients with csPCa from those with BPD because the SUVmax values of patients with csPCa (GS ≥ 7) were significantly higher than those of patients with BPD. Next, we identified and validated an SUVmax cutoff value to discriminate csPCa from BPD.
Sensitivity, specificity, PPV, NPV, and accuracy of 68Ga-PSMA PET/CT in detecting csPCa.
| Sensitivity (%) | Specificity (%) | PPV (%) | NPV (%) | Accuracy (%) | |
|---|---|---|---|---|---|
| All patients (BPD or csPCa, n = 193) | |||||
| Cutoff > 5.30 and metastases | 90.54 | 84.44 | 95.04 | 73.08 | 89.12 |
| Cutoff > 5.30 | 85.14 | 84.44 | 94.74 | 63.33 | 84.97 |
| Cutoff > 3.20 [11, 29] | 97.97 | 31.11 | 82.39 | 82.35 | 82.38 |
| Cutoff > 4.00 [14, 31] | 91.22 | 55.56 | 87.10 | 65.79 | 82.90 |
| Cutoff > 6.50 [30] | 77.70 | 84.44 | 94.26 | 53.52 | 79.27 |
| Cutoff > 6.70 [6] | 75.68 | 84.44 | 94.12 | 51.53 | 77.72 |
| Training cohort (n = 135) | |||||
| Cutoff > 5.30 and metastases | 91.51 | 86.21 | 96.04 | 73.53 | 90.37 |
| Cutoff > 5.30 | 85.85 | 86.21 | 95.79 | 62.50 | 85.93 |
| Cutoff > 3.20 [11, 29] | 97.17 | 27.93 | 85.12 | 78.57 | 84.44 |
| Cutoff > 4.00 [14, 31] | 91.51 | 56.82 | 88.99 | 65.38 | 84.44 |
| Cutoff > 6.50 [30] | 78.30 | 86.21 | 95.40 | 52.08 | 80.00 |
| Cutoff > 6.70 [6] | 77.36 | 86.21 | 95.35 | 51.02 | 79.26 |
| Validation cohort (n = 58) | |||||
| Cutoff > 5.30 and metastases | 88.10 | 81.25 | 92.50 | 72.22 | 86.21 |
| Cutoff > 5.30 | 83.33 | 81.25 | 92.11 | 65.00 | 82.76 |
| Cutoff > 3.20 [11, 29] | 100.0 | 18.75 | 72.41 | 100.00 | 77.59 |
| Cutoff > 4.00 [14, 31] | 90.47 | 50.00 | 82.61 | 66.67 | 79.31 |
| Cutoff > 6.50 [30] | 76.19 | 81.25 | 91.43 | 56.52 | 77.59 |
| Cutoff > 6.70 [6] | 71.42 | 81.25 | 90.91 | 52.00 | 74.14 |
Correlations between GS and H-score (A, C) and SUVmax (B, D). The H-scores and SUVmax values of patients with GS = 7 PCa were significantly higher than those with GS = 6 PCa or BPD (GS=0). (*, P < 0.05; **, P < 0.01; ***, P < 0.001).
An SUVmax cutoff value is established and validated to discriminate csPCa from BPD
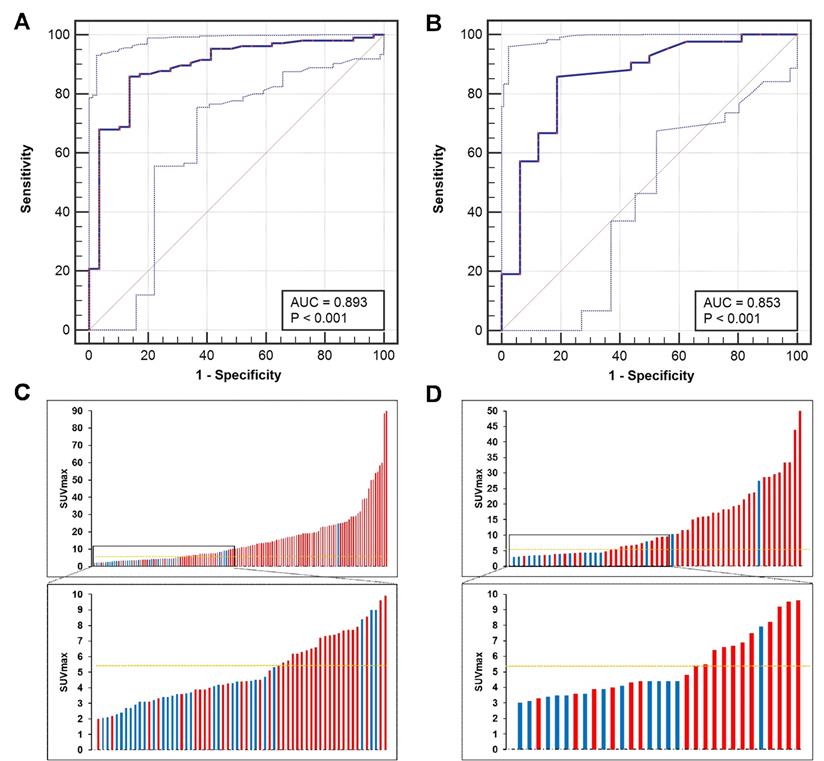
ROC curve analysis was used to identify the best SUVmax cutoff value to discriminate patients with csPCa from those with BPD using pathological results as references. In the training cohort, the ROC curve analysis showed that the best SUVmax cutoff value to discriminate csPCa from BPD was 5.30, and this value had a sensitivity of 85.85%, a specificity of 86.21%, a positive predictive value (PPV) of 95.79%, a negative predictive value (NPV) of 62.50% and an accuracy of 85.93% (Figure 5A, C, AUC = 0.893, P < 0.001). In the prospective validation cohort, the cutoff value of 5.30 achieved a sensitivity of 83.33%, a specificity of 81.25%, a PPV of 92.11%, an NPV of 65.00%, and an accuracy of 82.97% (Figure 5B, D, AUC = 0.853). Comparisons between 5.30 and other reported cutoff values are shown in Table 3 [6, 11, 14, 29-31]. The cutoff value of 5.30 achieved the highest accuracy in all patients of the training and validation cohorts to discriminate csPCa from BPD.
ROC curves for diagnosing patients with csPCa. (A, C) The SUVmax cutoff value of 5.30 yielded a sensitivity of 85.85% and a specificity of 86.21% in the training cohort (AUC = 0.893, Youden's index = 0.721). (B, D) The cutoff of 5.30 achieved a sensitivity of 83.33% and a specificity of 81.25% in the prospective validation cohort. The top and bottom ROC curves represent the upper and lower bounds of the 95% confidence interval of the middle bound, respectively.
The patients with SUVmax ≤ 5.30 is analyzed to reduce the false negative rate
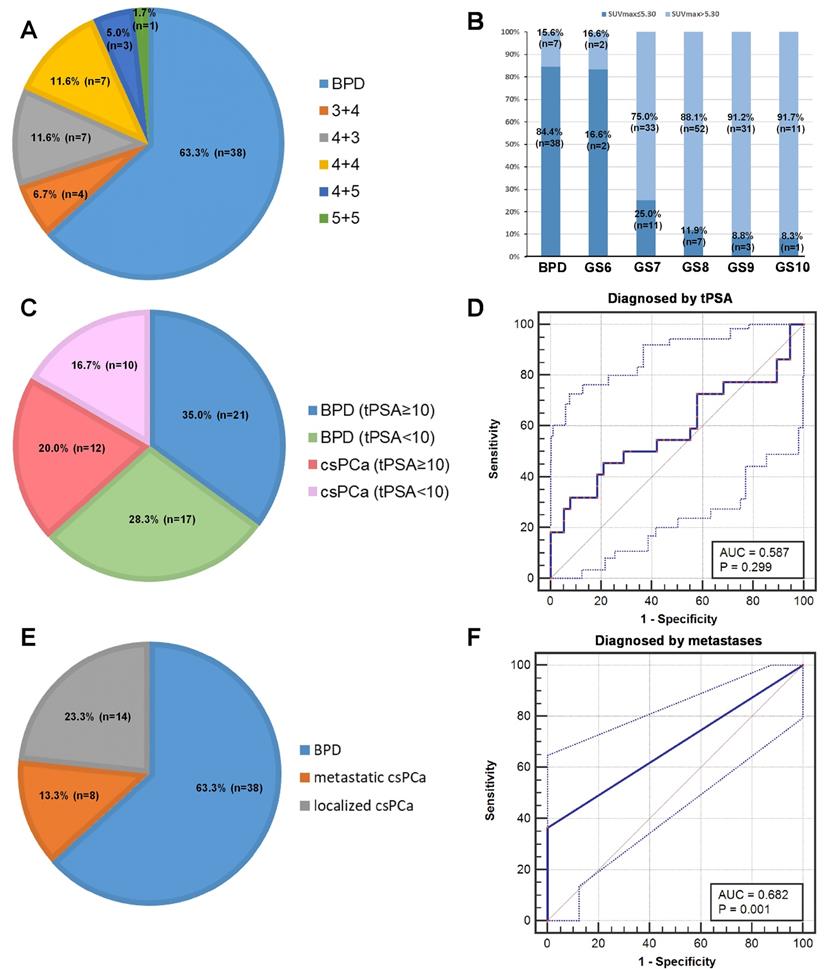
To investigate strategies to reduce the false negative rate, we further analyzed the patients with SUVmax ≤ 5.30 in detail. In the patients with SUVmax ≤ 5.30, 63.33% (38/60) of the patients were diagnosed pathologically with BPD, and 36.67% (22/60) of the patients were diagnosed with csPCa (Figure 6A). As shown in Figure 6B, patients with PCa and lower GS more frequently had SUVmax ≤ 5.30, i.e., a higher false negative rate, than patients with higher GS. We tried to use tPSA levels and metastases to further diagnose patients with csPCa and reduce false negative results. In 60 patients with false negative diagnoses, 54.55% (12/22) of patients with csPCa had tPSA ≥10 ng/mL, and 55.26% (21/38) of patients with BPD had tPSA ≥10 ng/mL. The ROC curve showed that tPSA level could not be used to discriminate patients with csPCa from those with BPD (Figure 6C-D, AUC = 0.587, P = 0.299). This is partly due to the moderate correlation between SUVmax and tPSA (Table 3, rs = 0.445, P < 0.001). For the metastases analysis, 8 patients with csPCa showed metastases, including LNMs, BMs, and visceral metastases, by 68Ga-PSMA PET/CT. The ROC curve showed that metastases can be used to decrease false negative results in patients with SUVmax ≤ 5.30 (Figure 6E-F, AUC = 0.682, P =0.001). Using metastases as references, 38.10% (8/21) of false negative results could be avoided (Figure 6E-F). Taking an SUVmax cutoff value of 5.30 and metastases into full consideration, the diagnostic accuracy achieved was 89.12% (172/193) in diagnosing patients with csPCa by 68Ga-PSMA PET/CT (Table 3). Thus, metastases can be used to reduce the false negative rate of using the cutoff alone for diagnosis. Next, we further investigated whether an SUVmax cutoff value can be identified to diagnose patients with lcsPCa.
Analysis of patients with SUVmax ≤ 5.30. (A) Pathological diagnoses of patients with SUVmax ≤ 5.30. (B) Percentage of patients with SUVmax ≤ 5.30 in each GS group. A higher percentage of patients with low GS had an SUVmax ≤ 5.30 than patients with high GS. (C) tPSA levels of patients with SUVmax ≤ 5.30. (D) ROC curves for diagnosing csPCa by tPSA. (E) Metastatic status of patients with SUVmax ≤ 5.30. (F) ROC curves for diagnosing patients with csPCa by metastatic status. The top and bottom ROC curves represent the upper and lower bounds of the 95% confidence interval of the middle bound, respectively.
An SUVmax cutoff value is established and validated to discriminate lcsPCa from BPD
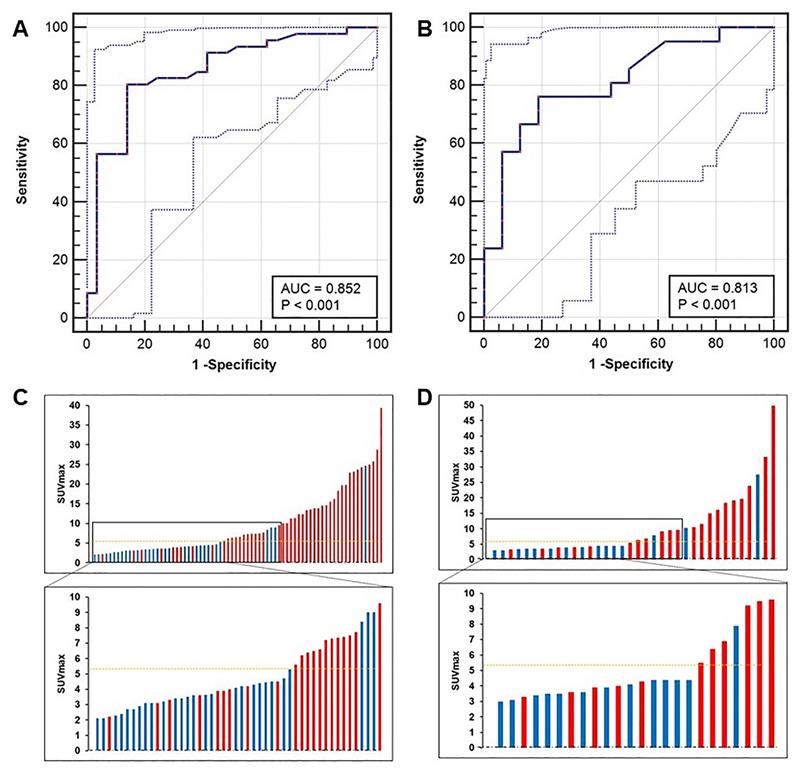
We next identified the best SUVmax cutoff value to diagnose patients with lcsPCa. By ROC curve analysis, the best SUVmax cutoff value to discriminate lcsPCa from BPD was also 5.30, and this value had a sensitivity of 80.43%, a specificity of 86.21%, a PPV of 90.24%, an NPV of 73.53%, and an accuracy of 82.67% (Figure 7A, C, AUC = 0.852, P < 0.001). In the prospective validation group, the cutoff value of 5.30 achieved a sensitivity of 76.19%, a specificity of 81.25%, a PPV of 84.21%, an NPV of 72.22%, and an accuracy of 78.38% (Figure 7B, D). Comparisons of the diagnostic efficiency of 5.30 with other reported cutoff values are shown in Table S6 [6, 11, 14, 29-31]. The SUVmax cutoff value of 5.30 achieved the highest accuracy for discriminating lcsPCa in both the training cohort and the validation cohort. Thus, consistent with the best cutoff value for diagnosing all patients with csPCa, 5.30 is also the most appropriate SUVmax cutoff value for discriminating patients with lcsPCa from those with BPD by 68Ga-PSMA PET/CT. Next, we investigated whether this cutoff can benefit clinical decision making.
ROC curves of patients with lcsPCa. (A, C) The SUVmax cutoff value of 5.30 yielded a sensitivity of 80.43% and a specificity of 86.21% in the training cohort (AUC = 0.852, Youden's index = 0.666). (B, D) The cutoff of 5.30 achieved a sensitivity of 76.19% and a specificity of 81.25% in the prospective validation cohort. The top and bottom ROC curves represent the upper and lower bounds of the 95% confidence interval of the middle bound, respectively.
The SUVmax cutoff may benefit clinical diagnosis by 68Ga-PSMA PET/CT
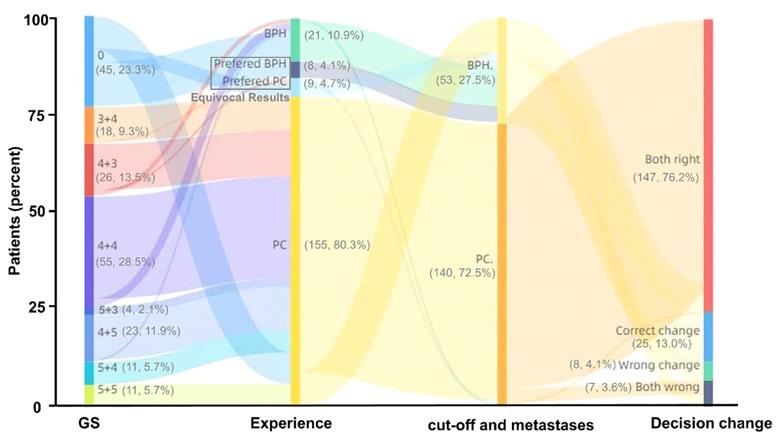
Diagnosis by 68Ga-PSMA PET/CT is highly dependent on the experience of nuclear medicine experts. Therefore, we next investigated whether the identified SUVmax cutoff value has the potential to benefit this diagnostic procedure. In all 193 patients, the diagnostic accuracy of the nuclear medicine expert decision was 80.83% (156/193), and 8.81% (17/193) of the results were relatively equivocal. Using the SUVmax cutoff value of 5.30 and metastases as references, the diagnostic accuracy reached 89.12% (172/193), and 8.29% (16/193) more patients in this group were diagnosed correctly by 68Ga-PSMA PET/CT compared with manual reading (Figure 8). Thus, the SUVmax cutoff can benefit clinical decision making by 68Ga-PSMA PET/CT, greatly reducing equivocal results and improving the accuracy of clinical diagnosis.
Changes in clinical diagnosis based on 68Ga-PSMA PET/CT between nuclear medicine expert experience and the combination of SUVmax cutoff and metastases. Compared with nuclear medicine expert experience, using the cutoff and metastases improved the diagnostic accuracy of clinical decision making with 68Ga-PSMA PET/CT by 8.81% (17/193).
Follow-up, ICC analysis, and zonal anatomy analysis
To avoid false negative biopsy results and interobserver differences in measuring SUVmax, follow-up and ICC analysis were also performed. Zonal anatomy analysis was also used to evaluate cutoffs in different segments of the prostate. In the follow-up of at least six months, no biopsy-negative BPD patients were confirmed to have PCa. In 48 patients who received RP, the GS in 81.25% (39/48) of the patients was unchanged, while 14.58% (7/48) of patients had upgraded GS and 4.17% (2/48) of patients had downgraded GS (Table S7). In the ICC analysis, two nuclear medicine experts achieved very good agreement on the measurement of SUVmax (ICC = 0.993, P < 0.001, Table S8). After considering the morphology and location of 68Ga-PSMA uptake, the patients were categorized as PSMA PET negative, csPCa with 68Ga-PSMA uptake in the peripheral segments alone, and csPCa with 68Ga-PSMA uptake in the central segments. The best SUVmax cutoff value to diagnose peripheral csPCa was 4.70, and the cutoff to recognize csPCa involved in the central segments was 9.0 (Figure S3). Follow-up showed that the biopsy GS was accurate enough for this study, and the ICC analysis showed excellent agreement between different observers in measuring SUVmax.
Discussion
This study represents the largest clinical study to identify and prospectively validate an SUVmax cutoff value for discriminating patients with csPCa from those with BPD, using pathological results as references. In this study, we identified and prospectively validated an SUVmax cutoff value to discriminate patients with csPCa from those with BPD in patients with suspected PCa based on conventional examinations. Compared with clinical diagnosis based on the experience of nuclear medicine experts, the diagnostic accuracy increased from 80.83% (156/193) to 89.12% (172/193) and relatively equivocal results (8.81%) were reduced.
PSMA, a type II membrane protein with folate hydrolase activity, is expressed at a significantly higher level in more than 90.00% of PCa tissues than BPD tissues [12, 32-34]. The SUVmax of 68Ga-PSMA is closely related to the expression of PSMA [11, 22]. The SUVmax value is higher in PCa tissues than in BPD tissues because of the higher expression of PSMA, as validated by IHC staining [11]. The mean SUVmax value of PCa tissues (14.10 ± 15.60) has been found to be significantly higher than that of PN tissues (2.40 ± 0.60, P < 0.001) [11]. In another study, the average SUVmax value was 11.00 ± 7.80 in PCa tissues and 2.70 ± 0.90 in PN tissues (P < 0.001) [29]. However, due to individual differences, low to moderate PSMA expression is also observed in BPD tissues [33], and these tissues may even have high PSMA expression [12]. Hence, relatively low SUVmax values in BPD tissues can also be measured by 68Ga-PSMA PET/CT. The SUVmax values of benign prostatic hyperplasia (BPH) tissues range from 3.20 to 5.80, and the SUVmax values of PN tissues range from 2.50 to 6.60 [15, 35]. Other studies demonstrated that the median SUVmax values in PN tissues range from 2.4 to 5.5, with a maximum value of 8.3 [10, 36, 37]. The subjects of the above studies were patients with PCa, but the differential diagnosis of BPD is also important. In our study, compared with patients with BPD, patients with csPCa had higher SUVmax values in their primary lesions, as measured by 68Ga-PSMA PET/CT and validated by IHC staining (Figure 2), which is in accordance with the results of previous studies [38, 39]. In summary, csPCa tissues are known to have higher SUVmax values than BPD tissues, but a cutoff to discriminate patients with csPCa from those with BPD was still unidentified.
In 68Ga-PSMA PET/CT imaging, an appropriate SUVmax cutoff value is important for the differential diagnosis of patients with csPCa from those with BPD [40]. In our study, the validated SUVmax cutoff value of 5.30 enabled the diagnosis of patients with csPCa with high sensitivity and specificity. Several previous studies generated SUVmax cutoff values to discriminate PCa tissues from their nearby PN tissues, but no cutoff value to discriminate patients with csPCa from those with BPD was previously identified. The first previous study identified an SUVmax value of 3.20 that demonstrated a high sensitivity of 94.3% and a high specificity of 100%, without histopathological results and IHC validation [29]. The same research group also reported the first pathologically validated cutoff of 3.15 for discriminating PCa tissues from nearby PN tissues, and this cutoff had a sensitivity of 97.0% and a specificity of 90.0% in 31 patients with PCa [11]. Another study indicated that an SUVmax cutoff value of 4.00 achieved a sensitivity of 88.0%, a specificity of 86.5%, and an accuracy of 87.5% [13]. However, this cutoff was identified from 132 segments in 6 patients with high-risk PCa [13]. Ferraro et al. also assessed PSMA-expressing tumors using a background-based threshold set to an SUVmax cutoff value of 4.00 [31]. Donato et al. identified an SUVmax cutoff value of 6.30 for the detection of csPCa lesions with 100.0% specificity and 60.1% sensitivity (AUC = 0.788) [17]. Furthermore, Fendler et al. identified an optimal SUVmax cutoff value of 6.50 for discriminating histopathologically positive and negative segments (AUC = 0.84, P < 0.001), which yielded a sensitivity of 67% and a specificity of 92% [30]. In discriminating patients with csPCa (GS ≥ 7) from patients with cnsPCa (GS = 6), an SUVmax cutoff of 3.95 achieved 94% sensitivity and 100% specificity [41]. The optimal SUVmax cutoff of 6.70 achieved a sensitivity of 88% and a specificity of 96% in discriminating patients with csPCa from those with cnsPCa by PSMA PET/MRI [6]. In comparison with the cutoffs generated in the above studies, 5.30 is still the best cutoff for discriminating patients with BPD from those with or without metastases, which is similar to a previous study conducted by Liu et al. [42] (Table 3, Table S6). We found that an SUVmax cutoff value could be identified to discriminate patients with csPCa (GS ≥ 7) from those with BPD because of their significant differences in PSMA expression and SUVmax values.
As shown in Figure 4, the differences in SUVmax values between different GS groups showed that it is feasible to select a cutoff to discriminate patients with csPCa from those with BPD, but it would be difficult to generate a cutoff to further discriminate patients with csPCa by GS. Although the SUVmax values in patients with GS = 9 (5 + 4) were higher than those in patients with GS = 9 (4 + 5), there were no significant differences between these patients and other GS groups among patients with csPCa (Figure 4D). In a correlation analysis between SUVmax and GS, our study showed that the SUVmax values in patients with csPCa (GS ≥ 7) were significantly higher than those in patients with BPD or cnsPCa (GS = 6), but no significant differences existed between other GS groups among patients with csPCa. This result is consistent with previous studies. A few previous studies demonstrated that 68Ga-PSMA PET could discriminate patients with high-risk and low-risk PCa. In an analysis of patients with PCa, the SUVmax values of patients with GS ≥ 7b (4 + 3) were significantly higher than those of patients with GS ≤ 7a (3 + 4) [14, 16]. Another study showed that SUVmax is significantly higher in tumors with GS > 7 (8, 9, 10) than in primary tumors with GS ≤ 7 (6, 7a, 7b) [15]. In this study, the SUVmax values of patients with high-risk PCa (GS ≥ 8) were higher than those of patients with low-to-intermediate-risk PCa (GS < 8) (Figure S4A-B). The SUVmax cutoff value to diagnose patients with high-risk PCa was 5.30 in all patients (AUC = 0.779, Figure S4C), while the cutoff was 6.50 in all patients with PCa (AUC = 0.685, Figure S4D). The AUCs of these cutoffs were lower than that of the cutoff to discriminate csPCa from BPD because the SUVmax difference mainly exists between the GS = 6 and GS = 7 groups (P < 0.001), rather than the GS = 7 and GS ≥ 8 groups (P = 0.025). In this study, the SUVmax of the GS ≥ 8 group was slightly higher than that of the GS = 7 group (P = 0.025, Figure S4B). This may further explain why there was no significant difference in 68Ga-PSMA PET positivity between patients with GS ≤ 7 and GS ≥ 8 PCa [43]. This may partly explain why a higher SUVmax value can be used for the prediction of pathological upgrading, especially for patients with a lower tumor grade at mpMRI targeted biopsy [44]. In summary, an SUVmax cutoff value can be identified to discriminate patients with csPCa from those with BPD because the jump in PSMA expression mainly exists between patients with GS = 7 csPCa and BPD. This may partly explain why the accuracy of cutoffs to diagnose patients with high-risk PCa (GS ≥ 8) were relatively low.
In our study, SUVmax > 5.30 was the most appropriate cutoff value to discriminate csPCa from BPD, facilitating a standardized approach for reporting findings from 68Ga-PSMA PET/CT imaging, which is urgently needed [45]. Furthermore, we validated the performance of this cutoff in a prospective validation cohort. For patients with SUVmax ≤ 5.30, patients with a lower GS had a higher false negative rate, but we found that metastases identified by 68Ga-PSMA PET/CT could be used to reduce false negative results, which is inconsistent with one previous study [15]. In this study, more patients with PCa in the later stages were included than in the previous study. The accuracy of SUVmax > 5.30 was 84.97% in all patients, and the accuracy reached 89.12% after incorporation of metastases (Table 3). The SUVmax cutoff value for patients with lcsPCa was 5.30, which was consistent with the cutoff value for discriminating all patients with csPCa from those with BPD. This result is because patients with LNMs or BMs tend to have SUVmax values far above 5.30. For patients with lcsPCa, SUVmax may predict adverse pathological outcomes and progression-free survival [16]. From zonal anatomy analysis, the cutoff for peripheral csPCa was 4.70, and that for csPCa involving the central segments was 9.00 (Figure S3). The peripheral and central segments of the prostate were divided by 68Ga-PSMA PET/CT, as previously reported [20]. The cutoff for csPCa involving the central segments was higher partly because most PCa originates from the peripheral segments and BPH usually occurs in the transitional zone, which is in the central and nearby central segments. Regarding morphology, Gao et al. reported that 68Ga-PSMA PET/CT can identify aggressive cribriform morphology in PCa, and an SUVmax cutoff value of 10.90 achieved a sensitivity of 76% and a specificity of 86% in a per-patient analysis [46]. In addition to SUVmax, the combination of morphology and location may further improve the diagnostic accuracy of 68Ga-PSMA PET/CT. In this study, no obvious significant differences were observed between the training and validation cohorts (Table S3), so we concluded that the cutoff value (5.30) was validated effectively in the validation cohort. In summary, metastases can be used to reduce false negative results from the SUVmax cutoff. The cutoff values in different segments of the prostate were different, and whether location and morphology can further increase diagnostic accuracy still needs to be investigated.
Currently, there is a shift from 68Ga- to 18F-labeled PSMA agents, and a cutoff to diagnose csPCa can also be established for 18F-labeled PSMA PET. Although all Glu-urea-based PSMA-targeted tracers share a similar distribution as physiological tracers, their cutoffs may be affected by their different distributions and excretions. The cutoffs for 68Ga-PSMA-11 and 18F-DCFPyL might be similar because they share a similar physiological uptake, and the aorta can be used as a benchmark to assess lesions based on SUVmax [47]. The cutoff for 18F-PSMA-1007 might be different from those of the above two tracers due to its hepatobiliary clearance [48]. The SUVmax cutoffs for several other PSMA ligands (e.g., 68Ga-PSMA I&T, 18F-rh-PSMA-7) available for PET imaging still need further investigation [47]. Although SUVmax is an important parameter, more parameters may facilitate a more accurate diagnosis. In quantitative PSMA PET analysis, machine learning-based analysis of quantitative 18F-DCFPyL PET can predict metastatic disease or high-risk PCa with GS ≥ 8 [49]. Radiomic features from PSMA PET images indicated that the texture feature quantization algorithm + short zones high gray-level emphasis (QSZHGE) can discriminate GS = 7 and GS ≥ 8 PCa tumors [50]. Furthermore, the lesion-to-background ratio of SUVmax in 68Ga-PSMA PET/MRI may improve clinical applicability compared with absolute SUVmax [51]. In summary, the cutoffs for different radiotracers still need further investigation due to their different distributions and excretions, and machine learning-based analysis can further help recognize more useful features.
Among BPD, BPH is the most common differential diagnosis. For the patients with BPD in this study, BPH was the most common pathological result, while other benign diseases, including prostatitis (chronic/acute), necrosis, calcification, and interstitial hypertrophy, were also observed (Table S7). One previous study reported that there was no correlation between tumor size and SUVmax [11]. In our study, the correlation between SUVmax and tumor size was insignificant (P = 0.061, Figure S5), but PCa tumors with larger diameters tended to have higher SUVmax values in the patients with PCa who received RP (Spearman's ρ, rs = 0.332, P < 0.001).
Our study has some limitations. The first limitation is that the data for this study came from a single center. However, the observed relationship between SUVmax and GS is consistent with previous studies. We also performed good quality control and ICC analysis of SUVmax to ensure the reliability of the study. Another limitation is possible selection bias. 68Ga-PSMA PET/CT was not used to screen patients with csPCa but for further accurate diagnosis after conventional examinations. However, 68Ga-PSMA PET/CT was used following mpMRI, the standard-of-care according to current guidelines, and the promising results here provide important data for future prospective clinical trials. The identified cutoff can greatly help clinical diagnosis, including increasing diagnostic accuracy and reducing equivocal results, if validated in multicenter studies. Additionally, the zonal anatomy analysis of different cutoffs was roughly based on CT images. A more detailed zonal anatomy analysis may be conducted using PSMA PET/MRI in a future study.
Conclusions
In conclusion, our study is the largest study with prospective real-world validation assessing the optimal SUVmax cutoff value, using pathological results as references, for discriminating patients with csPCa from those with BPD. We established and prospectively validated the best SUVmax cutoff value (5.30) for discriminating csPCa from BPD with high accuracy. 5.30 is also an effective cutoff for discriminating csPCa patients with or without metastases. The cutoff may provide a potential tool for the precise identification of csPCa by 68Ga-PSMA PET/CT, ensuring high accuracy and reducing equivocal results. If the cutoff value can be validated in a larger multicenter prospective study, it could be applied to diagnose patients with csPCa more accurately and efficiently than conventional examinations.
Abbreviations
SUVmax: Maximum standardized uptake value; csPCa: clinically significant prostate cancer; cnsPCa: clinically non-significant prostate cancer; BPD: benign prostatic diseases; BPH: benign prostate hypertrophy; PCa: prostate cancer; DRE: digital rectal examination; tPSA: total prostate-specific antigen; mpMRI: multi-parameter MRI; GS: Gleason score; ROC: Receiver operating characteristic; 68Ga-PSMA: 68Ga-labeled prostate-specific antigen; VOI: volume of interest; ADT: deprivation treatment; RP: radical prostatectomy; RT: radiotherapy; LNMs: lymph node metastases; BMs: bone metastases; cnsPCa: clinically non-significant PCa; EANM: the Joint European Association of Nuclear Medicine; SNMMI: Society of Nuclear Medicine and Molecular Imaging; TRUS: transrectal ultrasound; HE: hematoxylin-eosin; IHC: immunohistochemistry; AJCC: American Joint Committee on Cancer; ICC: Intraclass correlation co-efficient; lcsPCa: localised csPCa.
Supplementary Material
Supplementary methods, figures and tables.
Acknowledgements
The authors thank Mrs. Honglei Li (H.L.) and Yingmei Wang (Y.W.) (Department of Pathology, Xijing Hospital, Fourth Military Medical University, China) for their detailed pathological diagnosis.
Financial support
The study is funded by the National Natural Science foundation of China (grant nos. 81772734, 81971646, 91959208 and 81871379) and innovation Capability Support Program of Shaanxi (grant nos. 2020PT-021 and 2021TD-39).
Author Contributions
Conceptualization: Qin WJ, Wang J and Shi YQ; Methodology: Shi YQ, Wei WH and Zhao XH; Investigation: Wu P, Ma SJ, Guo W and Yang F; Writing-Original Draft: Jiao JH, Zhang JL and Quan ZY; Writing-Review and Editing: Qin WJ, Kang F, Shi YQ and Wang J; Funding Acquisition: Qin WJ, Kang F and Wang J; Supervision: Yuan JL, Yang XJ and Qin WJ.
Competing Interests
The authors have declared that no competing interest exists.
References
1. Sung H, Ferlay J, Siegel RL, Laversanne M, Soerjomataram I, Jemal A. et al. Global cancer statistics 2020: GLOBOCAN estimates of incidence and mortality worldwide for 36 cancers in 185 countries. CA Cancer J Clin. 2021;71:209-49
2. Klotz L, Vesprini D, Sethukavalan P, Jethava V, Zhang L, Jain S. et al. Long-term follow-up of a large active surveillance cohort of patients with prostate cancer. J Clin Oncol. 2015;33:272-7
3. Epstein JI, Egevad L, Amin MB, Delahunt B, Srigley JR, Humphrey PA. et al. The 2014 International Society of Urological Pathology (ISUP) Consensus Conference on Gleason Grading of Prostatic Carcinoma: Definition of Grading Patterns and Proposal for a New Grading System. Am J Surg Pathol. 2016;40:244-52
4. Mottet N, Bellmunt J, Bolla M, Briers E, Cumberbatch MG, De Santis M. et al. EAU-ESTRO-SIOG Guidelines on Prostate Cancer. Part 1: Screening, Diagnosis, and Local Treatment with Curative Intent. Eur Urol. 2017;71:618-29
5. Mohler JL, Antonarakis ES, Armstrong AJ, D'Amico AV, Davis BJ, Dorff T. et al. Prostate Cancer, Version 2.2019, NCCN Clinical Practice Guidelines in Oncology. J Natl Compr Canc Netw. 2019;17:479-505
6. Hicks RM, Simko JP, Westphalen AC, Nguyen HG, Greene KL, Zhang L. et al. Diagnostic Accuracy of (68)Ga-PSMA-11 PET/MRI Compared with Multiparametric MRI in the Detection of Prostate Cancer. Radiology. 2018;289:730-7
7. Giesel FL, Sterzing F, Schlemmer HP, Holland-Letz T, Mier W, Rius M. et al. Intra-individual comparison of (68)Ga-PSMA-11-PET/CT and multi-parametric MR for imaging of primary prostate cancer. Eur J Nucl Med Mol Imaging. 2016;43:1400-6
8. Hofman MS, Lawrentschuk N, Francis RJ, Tang C, Vela I, Thomas P. et al. Prostate-specific membrane antigen PET-CT in patients with high-risk prostate cancer before curative-intent surgery or radiotherapy (proPSMA): a prospective, randomised, multicentre study. Lancet. 2020;395:1208-16
9. Fanti S, Goffin K, Hadaschik BA, Herrmann K, Maurer T, MacLennan S. et al. Consensus statements on PSMA PET/CT response assessment criteria in prostate cancer. Eur J Nucl Med Mol Imaging. 2021;48:469-76
10. Afshar-Oromieh A, Malcher A, Eder M, Eisenhut M, Linhart HG, Hadaschik BA. et al. PET imaging with a [68Ga]gallium-labelled PSMA ligand for the diagnosis of prostate cancer: biodistribution in humans and first evaluation of tumour lesions. Eur J Nucl Med Mol Imaging. 2013;40:486-95
11. Woythal N, Arsenic R, Kempkensteffen C, Miller K, Janssen JC, Huang K. et al. Immunohistochemical Validation of PSMA Expression Measured by (68)Ga-PSMA PET/CT in Primary Prostate Cancer. Journal of nuclear medicine: official publication, Society of Nuclear Medicine. 2018;59:238-43
12. Bostwick DG, Pacelli A, Blute M, Roche P, Murphy GP. Prostate specific membrane antigen expression in prostatic intraepithelial neoplasia and adenocarcinoma: a study of 184 cases. Cancer. 1998;82:2256-61
13. Rahbar K, Weckesser M, Huss S, Semjonow A, Breyholz HJ, Schrader AJ. et al. Correlation of Intraprostatic Tumor Extent with (6)(8)Ga-PSMA Distribution in Patients with Prostate Cancer. Journal of nuclear medicine: official publication, Society of Nuclear Medicine. 2016;57:563-7
14. Demirci E, Kabasakal L, Sahin OE, Akgun E, Gultekin MH, Doganca T. et al. Can SUVmax values of Ga-68-PSMA PET/CT scan predict the clinically significant prostate cancer? Nucl Med Commun. 2019;40:86-91
15. Uprimny C, Kroiss AS, Decristoforo C, Fritz J, von Guggenberg E, Kendler D. et al. (68)Ga-PSMA-11 PET/CT in primary staging of prostate cancer: PSA and Gleason score predict the intensity of tracer accumulation in the primary tumour. Eur J Nucl Med Mol Imaging. 2017;44:941-9
16. Roberts MJ, Morton A, Donato P, Kyle S, Pattison DA, Thomas P. et al. (68)Ga-PSMA PET/CT tumour intensity pre-operatively predicts adverse pathological outcomes and progression-free survival in localised prostate cancer. Eur J Nucl Med Mol Imaging. 2021;48:477-82
17. Donato P, Roberts MJ, Morton A, Kyle S, Coughlin G, Esler R. et al. Improved specificity with (68)Ga PSMA PET/CT to detect clinically significant lesions "invisible" on multiparametric MRI of the prostate: a single institution comparative analysis with radical prostatectomy histology. Eur J Nucl Med Mol Imaging. 2019;46:20-30
18. Fendler WP, Eiber M, Beheshti M, Bomanji J, Ceci F, Cho S. et al. (68)Ga-PSMA PET/CT: Joint EANM and SNMMI procedure guideline for prostate cancer imaging: version 1.0. Eur J Nucl Med Mol Imaging. 2017;44:1014-24
19. Rauscher I, Maurer T, Fendler WP, Sommer WH, Schwaiger M, Eiber M. (68)Ga-PSMA ligand PET/CT in patients with prostate cancer: How we review and report. Cancer Imaging. 2016;16:14
20. Souvatzoglou M, Weirich G, Schwarzenboeck S, Maurer T, Schuster T, Bundschuh RA. et al. The sensitivity of [11C]choline PET/CT to localize prostate cancer depends on the tumor configuration. Clin Cancer Res. 2011;17:3751-9
21. Edge SB, Compton CC. The American Joint Committee on Cancer: the 7th edition of the AJCC cancer staging manual and the future of TNM. Ann Surg Oncol. 2010;17:1471-4
22. Zhang J, Shao S, Wu P, Liu D, Yang B, Han D. et al. Diagnostic performance of (68)Ga-PSMA PET/CT in the detection of prostate cancer prior to initial biopsy: comparison with cancer-predicting nomograms. Eur J Nucl Med Mol Imaging. 2019;46:908-20
23. Jiao D, Li Y, Yang F, Han D, Wu J, Shi S. et al. Expression of Prostate-Specific Membrane Antigen in Tumor-Associated Vasculature Predicts Poor Prognosis in Hepatocellular Carcinoma. Clin Transl Gastroenterol. 2019;10:1-7
24. Ferraro DA, Ruschoff JH, Muehlematter UJ, Kranzbuhler B, Muller J, Messerli M. et al. Immunohistochemical PSMA expression patterns of primary prostate cancer tissue are associated with the detection rate of biochemical recurrence with (68)Ga-PSMA-11-PET. Theranostics. 2020;10:6082-94
25. Paschalis A, Sheehan B, Riisnaes R, Rodrigues DN, Gurel B, Bertan C. et al. Prostate-specific Membrane Antigen Heterogeneity and DNA Repair Defects in Prostate Cancer. Eur Urol. 2019;76:469-78
26. Hirsch FR, Varella-Garcia M, Bunn PA Jr, Di Maria MV, Veve R, Bremmes RM. et al. Epidermal growth factor receptor in non-small-cell lung carcinomas: correlation between gene copy number and protein expression and impact on prognosis. J Clin Oncol. 2003;21:3798-807
27. Domachevsky L, Goldberg N, Bernstine H, Nidam M, Groshar D. Quantitative characterisation of clinically significant intra-prostatic cancer by prostate-specific membrane antigen (PSMA) expression and cell density on PSMA-11. Eur Radiol. 2018;28:5275-83
28. Mottet N, van den Bergh RCN, Briers E, Van den Broeck T, Cumberbatch MG, De Santis M. et al. EAU-EANM-ESTRO-ESUR-SIOG Guidelines on Prostate Cancer-2020 Update. Part 1: Screening, Diagnosis, and Local Treatment with Curative Intent. Eur Urol. 2021;79:243-62
29. Prasad V, Steffen IG, Diederichs G, Makowski MR, Wust P, Brenner W. Biodistribution of [(68)Ga]PSMA-HBED-CC in Patients with Prostate Cancer: Characterization of Uptake in Normal Organs and Tumour Lesions. Mol Imaging Biol. 2016;18:428-36
30. Fendler WP, Schmidt DF, Wenter V, Thierfelder KM, Zach C, Stief C. et al. 68Ga-PSMA PET/CT Detects the Location and Extent of Primary Prostate Cancer. Journal of nuclear medicine: official publication, Society of Nuclear Medicine. 2016;57:1720-5
31. Ferraro DA, Muehlematter UJ, Garcia Schuler HI, Rupp NJ, Huellner M, Messerli M. et al. (68)Ga-PSMA-11 PET has the potential to improve patient selection for extended pelvic lymph node dissection in intermediate to high-risk prostate cancer. Eur J Nucl Med Mol Imaging. 2019;47:147-59
32. Silver DA, Pellicer I, Fair WR, Heston WD, Cordon-Cardo C. Prostate-specific membrane antigen expression in normal and malignant human tissues. Clin Cancer Res. 1997;3:81-5
33. Wright GL Jr, Haley C, Beckett ML, Schellhammer PF. Expression of prostate-specific membrane antigen in normal, benign, and malignant prostate tissues. Urol Oncol. 1995;1:18-28
34. Sweat SD, Pacelli A, Murphy GP, Bostwick DG. Prostate-specific membrane antigen expression is greatest in prostate adenocarcinoma and lymph node metastases. Urology. 1998;52:637-40
35. Gupta M, Choudhury PS, Rawal S, Gupta G. Incremental value of 68-gallium-prostate-specific membrane antigen positron emission tomography/computed tomography in patients with abnormal prostate-specific antigen and benign transrectal ultrasound biopsy. Urol Ann. 2018;10:150-3
36. Demirci E, Sahin OE, Ocak M, Akovali B, Nematyazar J, Kabasakal L. Normal distribution pattern and physiological variants of 68Ga-PSMA-11 PET/CT imaging. Nucl Med Commun. 2016;37:1169-79
37. Sachpekidis C, Kopka K, Eder M, Hadaschik BA, Freitag MT, Pan L. et al. 68Ga-PSMA-11 Dynamic PET/CT Imaging in Primary Prostate Cancer. Clin Nucl Med. 2016;41:e473-e9
38. Murphy GP, Elgamal AA, Su SL, Bostwick DG, Holmes EH. Current evaluation of the tissue localization and diagnostic utility of prostate specific membrane antigen. Cancer. 1998;83:2259-69
39. Ghosh A, Heston WD. Tumor target prostate specific membrane antigen (PSMA) and its regulation in prostate cancer. J Cell Biochem. 2004;91:528-39
40. Ferraro DA, Rupp NJ, Donati OF, Messerli M, Eberli D, Burger IA. 68Ga-PSMA-11 PET/MR Can Be False Positive in Normal Prostatic Tissue. Clin Nucl Med. 2019;44:e291-e3
41. Scheltema MJ, Chang JI, Stricker PD, van Leeuwen PJ, Nguyen QA, Ho B. et al. Diagnostic accuracy of (68) Ga-prostate-specific membrane antigen (PSMA) positron-emission tomography (PET) and multiparametric (mp)MRI to detect intermediate-grade intra-prostatic prostate cancer using whole-mount pathology: impact of the addition of (68) Ga-PSMA PET to mpMRI. BJU Int. 2019;124(Suppl 1):42-9
42. Liu C, Liu T, Zhang Z, Zhang N, Du P, Yang Y. et al. (68)Ga-PSMA PET/CT Combined with PET/Ultrasound-Guided Prostate Biopsy Can Diagnose Clinically Significant Prostate Cancer in Men with Previous Negative Biopsy Results. Journal of nuclear medicine: official publication, Society of Nuclear Medicine. 2020;61:1314-9
43. Perera M, Papa N, Roberts M, Williams M, Udovicich C, Vela I. et al. Gallium-68 Prostate-specific Membrane Antigen Positron Emission Tomography in Advanced Prostate Cancer-Updated Diagnostic Utility, Sensitivity, Specificity, and Distribution of Prostate-specific Membrane Antigen-avid Lesions: A Systematic Review and Meta-analysis. Eur Urol. 2020;77:403-17
44. Yin H, Chen M, Qiu X, Qiu L, Gao J, Li D. et al. Can (68)Ga-PSMA-11 PET/CT predict pathological upgrading of prostate cancer from MRI-targeted biopsy to radical prostatectomy? Eur J Nucl Med Mol Imaging. 2021
45. Todenhofer T, Gratzke C. Re: Prostate-specific Membrane Antigen Heterogeneity and DNA Repair Defects in Prostate Cancer. Eur Urol. 2020;77:559-60
46. Gao J, Zhang C, Zhang Q, Fu Y, Zhao X, Chen M. et al. Diagnostic performance of (68)Ga-PSMA PET/CT for identification of aggressive cribriform morphology in prostate cancer with whole-mount sections. Eur J Nucl Med Mol Imaging. 2019;46:1531-41
47. Ceci F, Oprea-Lager DE, Emmett L, Adam JA, Bomanji J, Czernin J, et al. E-PSMA: the EANM standardized reporting guidelines v1.0 for PSMA-PET. Eur J Nucl Med Mol Imaging. 2021
48. Giesel FL, Hadaschik B, Cardinale J, Radtke J, Vinsensia M, Lehnert W. et al. F-18 labelled PSMA-1007: biodistribution, radiation dosimetry and histopathological validation of tumor lesions in prostate cancer patients. Eur J Nucl Med Mol Imaging. 2017;44:678-88
49. Cysouw MCF, Jansen BHE, van de Brug T, Oprea-Lager DE, Pfaehler E, de Vries BM. et al. Machine learning-based analysis of [(18)F]DCFPyL PET radiomics for risk stratification in primary prostate cancer. Eur J Nucl Med Mol Imaging. 2021;48:340-9
50. Zamboglou C, Carles M, Fechter T, Kiefer S, Reichel K, Fassbender TF. et al. Radiomic features from PSMA PET for non-invasive intraprostatic tumor discrimination and characterization in patients with intermediate- and high-risk prostate cancer - a comparison study with histology reference. Theranostics. 2019;9:2595-605
51. Zhao J, Hamm B, Brenner W, Makowski MR. Lesion-to-background ratio threshold value of SUVmax of simultaneous [(68)Ga]Ga-PSMA-11 PET/MRI imaging in patients with prostate cancer. Insights Imaging. 2020;11:137
Author contact
![]() Corresponding authors: Weijun Qin, MD. E-mail: qinwjedu.cn. Department of Urology, Xijing Hospital, Fourth Military Medical University, 127 West Changle Road, Xi'an, Shaanxi, China, 710032; Tel. +86-29-8477-1579, Fax. +86-29-8477-5321 (W. Qin). Jing Wang, MD. E-mail: wangjingedu.cn. Department of Nuclear Medicine, Xijing Hospital, Fourth Military Medical University, 127 West Changle Road, Xi'an, Shaanxi, China, 710032; Tel. +86-29-8477-1050 (J. Wang). Yongquan Shi, MD. E-mail: Shiyquanedu.cn. State Key Laboratory of Cancer Biology, Xijing Hospital, Fourth Military Medical University, Xi'an 710032, China. (Y. Shi).
Corresponding authors: Weijun Qin, MD. E-mail: qinwjedu.cn. Department of Urology, Xijing Hospital, Fourth Military Medical University, 127 West Changle Road, Xi'an, Shaanxi, China, 710032; Tel. +86-29-8477-1579, Fax. +86-29-8477-5321 (W. Qin). Jing Wang, MD. E-mail: wangjingedu.cn. Department of Nuclear Medicine, Xijing Hospital, Fourth Military Medical University, 127 West Changle Road, Xi'an, Shaanxi, China, 710032; Tel. +86-29-8477-1050 (J. Wang). Yongquan Shi, MD. E-mail: Shiyquanedu.cn. State Key Laboratory of Cancer Biology, Xijing Hospital, Fourth Military Medical University, Xi'an 710032, China. (Y. Shi).