Impact Factor
 Global reach, higher impact
Theranostics 2021; 11(15):7570-7588. doi:10.7150/thno.58380 This issue Cite
Research Paper
Lactate dehydrogenase B regulates macrophage metabolism in the tumor microenvironment
Ann-Christin Frank1, Rebecca Raue1, Dominik C. Fuhrmann1, Evelyn Sirait-Fischer1, Carsten Reuse2, Andreas Weigert1,5,6, Dieter Lütjohann3, Karsten Hiller2,4, Shahzad Nawaz Syed1 ![]() *, Bernhard Brüne1,5,6,7
*, Bernhard Brüne1,5,6,7 ![]() *
*
1. Institute of Biochemistry I, Faculty of Medicine, Goethe-University Frankfurt, 60590 Frankfurt, Germany.
2. Department for Bioinformatics and Biochemistry, BRICS, Technische Universität Braunschweig, Rebenring 56, 38106 Braunschweig, Germany.
3. Institute of Clinical Chemistry and Clinical Pharmacology, University Hospital Bonn, 53127 Bonn, Germany.
4. Helmholtz Centre for Infection Research, Inhoffenstraße 7, 38124 Braunschweig, Germany.
5. German Cancer Consortium (DKTK), Partner Site Frankfurt, 60590 Frankfurt, Germany.
6. Frankfurt Cancer Institute, Goethe-University Frankfurt, 60596 Frankfurt, Germany.
7. Fraunhofer Institute for Translational Medicine and Pharmacology ITMP, 60596 Frankfurt, Germany.
* These authors jointly supervised the work.
Received 2021-1-19; Accepted 2021-5-4; Published 2021-6-4
Abstract

Background: Glucose metabolism in the tumor-microenvironment is a fundamental hallmark for tumor growth and intervention therein remains an attractive option for anti-tumor therapy. Whether tumor-derived factors such as microRNAs (miRs) regulate glucose metabolism in stromal cells, especially in tumor-associated macrophages (TAMs), to hijack them for trophic support, remains elusive.
Methods: Ago-RIP-Seq identified macrophage lactate dehydrogenase B (LDHB) as a target of tumor-derived miR-375 in both 2D/3D cocultures and in murine TAMs from a xenograft mouse model. The prognostic value was analyzed by ISH and multiplex IHC of breast cancer patient tissues. Functional consequences of the miR-375-LDHB axis in TAMs were investigated upon mimic/antagomir treatment by live metabolic flux assays, GC/MS, qPCR, Western blot, lentiviral knockdown and FACS. The therapeutic potential of a combinatorial miR-375-decoy/simvastatin treatment was validated by live cell imaging.
Results: Macrophage LDHB decreased in murine and human breast carcinoma. LDHB downregulation increase aerobic glycolysis and lactagenesis in TAMs in response to tumor-derived miR-375. Lactagenesis reduced fatty acid synthesis but activated SREBP2, which enhanced cholesterol biosynthesis in macrophages. LDHB downregulation skewed TAMs to function as a lactate and sterol/oxysterol source for the proliferation of tumor cells. Restoring of LDHB expression potentiated inhibitory effects of simvastatin on tumor cell proliferation.
Conclusion: Our findings identified a crucial role of LDHB in macrophages and established tumor-derived miR-375 as a novel regulator of macrophage metabolism in breast cancer, which might pave the way for strategies of combinatorial cancer cell/stroma cell interventions.
Keywords: Breast cancer, LDHB, RNA therapeutics, metabolism, tumor-associated macrophages.
Introduction
Aerobic glucose metabolisms, besides glutamine consumption, are of major importance to harness energy for tumor growth [1, 2]. Despite steep nutrient and oxygen gradients in solid tumors, cancer cells favor aerobic glycolysis that causes lactate production, despite being less efficient in terms of ATP synthesis. It is plausible to assume that cancer cells may exploit stromal cells for their metabolic need. It has been shown that cancer-associated fibroblast serves as a lactate donor in the tumor microenvironment (TME), once they are activated by their direct contact with tumor cells [3]. Whether other stroma cells such as tumor-associated macrophages (TAM), which constitute up to 50% of the total tumor mass [4,5], also functioning as lactate donors in the TME is unknown. Whereas, tumor-derived lactate has been shown to be taken by macrophages, thereby adding to a pro-tumoral phenotype shift [6], it is not known if and how tumor cells hijack the glucose metabolizing machinery of TAMs to reprogram them as lactate producers.
TAMs are a dynamic and heterogeneous immune cell population, which is associated with immune-suppressive and trophic functions that support tumor progression, invasion, and metastasis [7, 8]. Thus, a high number of infiltrating TAMs often correlates with poor disease outcome [9]. In response to tumor-microenvironmental cues that comprises products of an altered tumor cell metabolism, TAMs adapt their metabolism, which is closely linked to their pro- (M1-like) or anti-inflammatory (M2-like) polarization. Understanding the intricate relationship between the TME and TAMs that governs these metabolic changes represents an essential step to progress towards a TAM-directed anti-tumor therapy.
One way of tumor cell-macrophage (MΦ) cross-talk is via microRNAs (miR), which are small non-coding RNAs that attenuate target gene expression at the post-transcriptional level [10]. Recently, we showed that breast tumor cells release miR-375 upon apoptosis, which are taken up by MΦ, thereby stimulating their migration and infiltration [11]. Here we provide evidence that tumor cell-derived miR-375 downregulates LDHB in macrophages, which is critical for their metabolic adaptation to become tumor supportive. Lactate dehydrogenase (LDH) is one of the key enzymes in glycolysis that catalyses the bidirectional conversion of pyruvate and lactate [12, 13]. The tetrameric enzyme is composed of different subunits, LDHA and LDHB. LDHA has higher affinity for pyruvate and preferentially converts pyruvate to lactate, and is overexpressed in many malignant tumors, including breast cancer [14]. In contrast, there is very limited information on LDHB, which transforms lactate to pyruvate in malignant cells [15] and TAMs. We discovered a non-redundant role of LDHB in macrophages and explored its pathophysiological relevance in breast cancer. We also provide evidence for the clinical relevance of the miR-375-LDHB axis in a pre-clinical combinatorial anti-tumor treatment model.
Methods
Reagents
Actinomycin D, lactate and simvastatin were purchased from Sigma-Aldrich (München, Germany). All reagents were dissolved according to the manufacturer's instructions.
Cell Culture
All cell lines were obtained from ATCC-LGC Standards GmbH (Wesel, Germany) and routinely tested for mycoplasma contamination. MCF-7, T47D and MDA-MB-231 cells were cultivated in RPMI 1640 containing 1% sodium pyruvate and 1% non-essential amino acids, 10% FCS, 100 U/mL penicillin, and 100 μg/mL streptomycin. Human MΦ were cultured in RPMI 1640 containing 5% AB-positive human serum (DRK Blutspendedienst Baden-Würtemberg-Hessen, Frankfurt, Germany), 100 U/mL penicillin, and 100 μg/mL streptomycin (MΦ media). If not stated otherwise, all cell culture supplements came from PAA Laboratories (Cölbe, Germany).
Generation of Human MΦ from Buffy Coats and Coculture with Tumor Cells
Primary human monocytes (peripheral blood mononuclear cells, PBMCs) were isolated from commercially obtained buffy coats from anonymous healthy donors (DRK-Blutspendedienst Baden-Württemberg-Hessen, Institut für Transfusionsmedizin und Immunhämatologie, Frankfurt, Germany) using Ficoll-Hypaque (PAA Laboratories) density centrifugation as previously described [11]. For coculture experiments, MΦ were cultured at a density of 5 × 10⁵ cells/mL. Tumor cells were detached from culture flasks using trypsin-EDTA, washed with PBS and resuspended in MΦ-media. Tumor cells were cocultured with MΦ at the same density. After times indicated, residual MCF-7, T47D or MDA-MB-231 cells were removed from plates using trypsin-EDTA for 3-5 min, which left adherence of MΦ unaltered.
MiR Mimic, Antagomir and siRNA Transfection
MiR mimic, antagomir, and siRNA transfections were performed using HiPerfect (Qiagen, Hilden, Germany) according to the manufacturer's instructions. For overexpression of miR-375, primary human MΦ in six-well plates were transfected with MISSION® hsa-miR-375 mimic or MISSION® miR negative control 2 from C. elegans (cel-miR-39a; both from Sigma-Aldrich). To inhibit miR-375, primary human MΦ or tumor cell lines were transfected with MISSION® has-miR-375 inhibitor (antagomir) or negative control 2 from C. elegans (cel-miR-243-3p; both from Sigma-Aldrich). Lactate secretion from MΦ was blocked by transfection of cells with ON-TARGETplus MCT4 siRNA or control siRNA (both from Dharmacon, Lafayette, Colorado, USA).
Ago Immunoprecipitation, Library Generation and AGO-RIP-Seq
To identify new targets of miR-375 in MΦ, 10 × 106 - 20 × 106 cells were transfected with synthetic miR-375 mimic (mimic) or with nonspecific cel-miR-39a (scramble) for 48 h. Ago immunoprecipitation (Ago-IP), library generation and AGO-RIP-Seq were performed as previously described [11, 16, 17].
GSEA Analysis
Differentially expressed genes between control and miR-375 containing macrophages (ACM treated, mimic transfected) were used as an input to analyze gene sets in the Molecular Signatures Database using GSEA 4.0.2 via the Gene Pattern Platform.
RNA Isolation, Reverse Transcription and Quantitative Real-time PCR
RNA isolation, reverse transcription and quantitative real-time PCR were performed as previously described [11]. Primers for hsa-miR-375 (MIRAP00360) and SNORD44 (MIRCP00005) were from Sigma-Aldrich. Primers for cel-miR-39a (MS00019789) and KI67 (249900) were purchased from Qiagen. All other primers were obtained from Biomers (Ulm, Germany) and sequences are presented in table S1. Relative mRNA/miR expression was calculated using the CFX-ManagerTM v3.2 software (Bio-Rad Laboratories) and the ΔΔCt method and normalized to the respective control RNAs indicated in figure legends.
Generation of Stable MCF-7 miR-375 Decoy and Control Cell Line
MCF-7 control and miR-375 decoy cells were generated as previously described [11]. In the MCF-7 miR-375 decoy cells, the endogenous mature miR-375 is inhibited by the stable transfection of a lentiviral vector encoding for the miR-375 decoy insert (Plasmid #46617; Addgene, Cambridge, USA), while control cells were transfected with an empty vector. Transduction efficiency was analyzed based on green fluorescent protein-expression, detected by flow cytometry using a LSRII/Fortessa flow cytometer (BD Bioscience, Heidelberg, Germany).
Generation of MCF-7 Tumor Spheroids and Coculture with Primary Human Monocytes
3D tumor spheroids from MCF-7 cells were generated by using the liquid-overlay technique as described [18]. For this, 5 × 10³ cells per well were seeded onto non-adherent 1% agarose-coated 96-well plates and allowed to form spheroids for 4 days. Primary human monocytes were isolated from human blood PBMCs by using CD14 MicroBeads (130-050-201; positive selection) and the AutoMACS Separator system (both from Miltenyi Biotec, Gladbach, Germany). 1 × 10⁵ monocytes were added per spheroid and cocultures were maintained for 3 days to allow monocyte infiltration and differentiation to MΦ.
Xenograft Transplantation Experiment
Mouse care and experiments involving mice were approved by and followed the guidelines of the Hessian animal care and use committee (approval number FU/1152). Xenograft transplantation was performed with 8 -12 week-old female NMRI-Foxn1nu mice and MCF-7 control or MCF-7 miR-375 decoy cells as previously described [11]. Tumors were collected for fluorescence activated cell sorting and immunohistochemistry.
Flow Cytometry and Cell Sorting
Single-cell suspensions were stained with fluorochrome conjugated antibodies and analyzed on a LSRII/Fortessa flow cytometer or sorted using a FACSAria III cell sorter (both from BD Biosciences) as previously described [11].
For cell sorting of MCF-7 tumors from xenograft transplantation experiments, single-cell suspensions were created using the Human Tumor Dissociation Kit and the GentleMACS Dissociator (Miltenyi Biotec). Non-specific binding was blocked with 2% of human and murine Fc receptor block (eBioscience, Frankfurt, Germany) in PBS for 15 min on ice. Cells were stained with an antibody mixture of CD11b-eFluor605 (BioLegend, San Diego, USA; #101257; 1:200 dilution), F4/80-Pe-Cy7 (BioLegend, #123114; 1:200 dilution), Ly-6G-APC-Cy7 (BioLegend, #127624; 1:100 dilution), CD326-PE (BioLegend, #324205; 1:100 dilution), CD11c-BV711 (BD Bioscience, #363048; 1:200 dilution), Ly-6c-PerCP-PE-Cy5.5 (BD Bioscience, #560525; 1:200 dilution), CD45-VioBlue (Miltenyi Biotec, #130102430; 1:50 dilution), and HLA-DR-APC (Miltenyi Biotec, #130102139; 1:50 dilution). Cell suspensions were filtered through 30 μm cell strainers and diluted to ideal concentrations for cell sorting.
Immunoblotting
Immunoblotting of MΦ protein lysates was performed as previously described [11]. The following antibodies were used at 4°C overnight: LDHB (Abcam, Cambridge, UK; #ab85319; 1:1000 dilution), LDHA (Abcam #ab101562; 1:1000 dilution), and actin (Santa Cruz Biotechnology, Heidelberg, Germany; #sc-8031; 1;3000 dilution) according to the manufacturer's instructions. Proteins were visualized by IRDye secondary antibodies using the Li-Cor Odyssey imaging system (all from LICOR Bioscience, Bad Homburg, Germany).
In Situ Hybridization and Multiplex Immunohistochemistry
Tumors from xenograft mouse experiments were fixed in 4% paraformaldehyde and paraffin-embedded. 4 µm thick sections were stained using the Opal staining system, imaged by the Vectra3 automated imaging software and analyzed with inForm2.0 software using the phenotyping tool according to the manufacturer's instructions (PerkinElmer, Rodgau, Germany). Tumor sections were stained with the following antibodies: LDHB (Santa Cruz, sc-100775; 1:300 dilution); CD163 (Abcam, ab182422; 1:250 dilution); spectral 4′,6-diamidino-2-phenylindole (DAPI; PerkinElmer).
Tissue microarrays (TMAs) of human normal breast and invasive breast cancer were provided by the Cooperative Human Tissue Network and the Cancer Diagnosis Program, which are funded by the National Cancer Institute. Other researchers may have received exemplars from the same subjects. In situ hybridization of double DIG-labeled miRCURY LNATM miRNA Detection Probe hsa-miR-375 (Qiagen, #YD00610232) and scamble-miR (Qiagen, #YD00699004) has been performed according to the miRCURY LNA® miRNA detection probes handbook with some modifications followed by staining with antibody against human LDHB (Santa Cruz, sc-100775; 1:300 dilution) and spectral DAPI (PerkinElmer) using the Opal staining system as previously described [11]. Slides were imaged using the Vectra3 automated imaging system and images were analyzed using InForm2.0 (Perkin Elmer) and ImageJ software.
Plasmid Construction
To generate a plasmid with miR-375-binding sites for human LDHB, psiCHECK 2TM-vector (Promega, Madison, USA) was digested using NotI and XhoI restriction enzymes (New England Biolabs, Frankfurt, Germany). The 3′-UTR of LDHB was amplified from human cDNA with primers sense 5′-TAGGCGATCGCTCGAGCTAGTGAGCTCTAGGCTG-3′ and antisense 5′-TTGCGGCCAGCGGCCGCCACACTACAATAGTTAATTTTAT-3′ (both from Biomers), and inserted into the linearized psiCHECK™-2 vector with the In-Fusion® HD Cloning Kit (Takara) according to the manufacturer's protocol.
Luciferase Reporter Assay
For luciferase activity assay, human MΦ were transiently cotransfected with 2 μg LDHB 3′-UTR reporter plasmid or an empty control plasmid with or without MISSION® hsa-miR-375 Mimic (Sigma-Aldrich) using ViromerRED transfection reagent (Lipocalyx, Halle, Germany) as previously described [11]. The activity in miR-375 cotransfected cells was expressed as fold change compared to the cells transfected with vectors only.
Measurement of Cellular Cholesterol, Non-cholesterol Sterols, and Oxysterols
In a first set of experiments the amount of non-cholesterol sterols and oxysterols was analyzed by gas chromatography- mass spectrometry- selected ion monitoring (GC-MS-SIM). For this, 1.5 - 2 × 10⁶ MΦ were washed once with ice-cold PBS, scraped and centrifuged at 1000×g for 5 min at 4°C. The supernatants were discarded, and macrophage cell pellets were spun in a SpeedVacTM concentrator (12 mbar; Savant AES 1000). Cholesterol, non-cholesterol sterols, and oxysterols were extracted using chloroform, followed by alkaline hydrolysis and the measurement of cholesterol precursor and oxysterol concentrations with GC-mass spectrometry-selected ion monitoring [19]. The trimethylsilylethers of the sterols were separated on a DB-XLB (30 m length × 0.25 mm internal diameter, 0.25 μm film) column (Agilent Technologies, Waldbronn, Germany) using the 6890N Network GC system (Agilent Technologies). Non-cholesterol sterols were measured on a 5973 Network MSD (Agilent Technologies) and Epicoprostanol (Steraloids, Newport, RI, USA) and deuterium labelled oxysterols were used as an internal standard for quantification. Total cholesterol was measured by GC-flame ionization detection on an HP 6890 GC system (Hewlett Packard, Waldbronn, Germany), equipped with a DB-XLB (30 m length × 0.25 mm internal diameter, 0.25 μm film) column (Agilent Technologies) using 5α-cholestane (Steraloids) as internal standard [20].
In a second set of experiments, total cholesterol was analyzed using the Amplex Red Cholesterol Assay Kit (Life Technologies, Carlsbad, USA) according to the manufacturer's recommendations. Fluorescence was measured in a TECAN SPARK® multimode microplate reader (TECAN, Männedorf, Switzerland) using excitation of 545 nm and emission of 590 nm. Protein concentrations were measured using the DC Protein Assay (Bio-Rad Laboratories) and cholesterol concentrations were reported per mg protein.
Extraction of Metabolites and Fatty Acids for Gas Chromatography-Mass Spectrometry (GC/MS)
To measure intra- and extracellular metabolites and fatty acid methyl esters (FAMEs), 1.5 - 2 × 10⁶ cells were harvested as previously described [21]. Briefly, cells were washed with sterile filtered 0.9% NaCl and quenched with 0.2 mL of -20°C methanol. An equal volume of ice-cold water containing 1 µg/mL glutaric acid (internal standard for metabolite measurement) was added and cells were collected with a cell scraper and transferred to tubes containing 0.2 mL -20°C chloroform containing 25 µM palmitate (internal standard for fatty acid measurement). Cell extracts were shaken at 1400 rpm for 20 min at 4°C (Thermomixer Eppendorf) followed by centrifugation at 16000×g for 5 min at 4°C. 0.2 mL of upper aqueous phase and 0.15 mL of lower non-polar phase were collected in specific glass vials with micro inserts.
For extraction of extracellular metabolites, 15 µL of cell supernatant was transferred to tubes containing 135 µL of a mixture of 1:9 methanol (-20°C)/Millipore water with 1 µg/mL glutaric acid as internal standard. Extracts were shaken at 2000 rpm for 10 min at 4°C and centrifuged at 17000×g for 10 min at 4°C. 60 µL of supernatant was transferred to glass vials with micro inserts. Extracted metabolites and fatty acids were evaporated under vacuum at -4°C using a CentriVap Concentrator (Labconco Corporation, Kansas City, USA).
Metabolite Measurement
Metabolite derivatization was performed using a Gerstel MPS. Dried polar metabolites were dissolved in 15 µL of 2% methoxyamine hydrochloride in pyridine and shaken for 60 min at 40°C. An equal volume of N-tert-butyldimethylslyl-N-methyltrifluoroacetamide (MTBSTFA) was added and held for 60 min at 40°C. 1 µL of sample was injected into an SSL injector at 270°C in splitless mode. GC/MS analysis was performed using an Agilent 7890A GC equipped with a 30-m DB-35MS 5-m Duraguard capillary column. As carrier gas helium was used at a flow rate of 1.0 mL/min. The GC oven temperature was held at 100 °C for 2 min and increased to 300 °C at 10 °C/min. After 3 min, the temperature was increased to 325 °C. The GC was connected to an Agilent 5975C inert XL MSD, operating under electron ionization at 70 eV. The MS source was held at 230 °C and the quadrupole at 150 °C. The MS was operated in selected ion monitoring. The total run time of one sample was 25.00 min. All GC/MS chromatograms were processed by using Metabolite Detector software [22]. Protein concentrations were determined using the DC Protein Assay (Bio-Rad Laboratories) and data were normalized to protein content of the respective sample.
FAME Measurement
Dried non-polar fatty acids were dissolved in 500 μl 2% (w/v) H2SO4 in methanol and incubated at 50°C for 90 min. Afterwards, 100 μl saturated NaCl solution and 200 μl hexane were added, followed by vigorously mixing and short centrifugation. The last steps were repeated three times and the upper phase was transferred to a GC-MS vial. The hexane was evaporated under vacuum and samples were re-dissolved in 50 μL hexane and vials were caped immediately. 1 μL of sample was injected into an SSL injector at 270 °C in splitless mode. GC/MS analysis was performed using an Agilent 7890A GC equipped with a 30-m DB-35MS 5-m Duraguard capillary column. Helium was used as carrier gas at a flow rate of 1.0 mL/min. The GC oven temperature was held at 55°C for 5 min and increased to 325 °C at 6 °C/min. The GC was connected to an Agilent 5975C inert XL MSD, operating under electron ionization at 70 eV. The MS source was held at 230 °C and the quadrupole at 150 °C. The MS was operated in scanning monitoring. The total run time of one sample was 60 min. All GC/MS chromatograms were processed by using Metabolite Detector software. Protein concentrations were determined using the DC Protein Assay (Bio-Rad Laboratories) and data were normalized to protein content of the respective sample.
Live Metabolic Flux Assays
The extracellular acidification rate (ECAR) and the cellular oxygen consumption rate (OCR) were analyzed using a Seahorse 96 extracellular flux analyzer (Agilent). 20,000 MCF-7 control or decoy cells or 30,000 human MΦ were seeded per well of a Seahorse 96-well cell culture plate at the day of measurement and equilibrated in Krebs Henseleit buffer (111 mM NaCl, 4.7 mM KCL, 1.25 mM CaCl2, 2 mM MgSO4, 1.2 mM Na2HPO4) supplemented with 3 mM L-glutamine 0.5 h before measurement. For ECAR measurement, Glycolysis Stress Test was performed: Cells were treated with 5 mM glucose (Sigma-Aldrich), 2.5 µM oligomycin (Oligo; Cayman Chemical) to block ATP-coupled respiration, and 50 µM 2-deoxyglucose (2-DG; Cayman Chemical) to inhibit glycolysis through competitive binding to glucose hexokinase. For OCR measurement, Mito Stress Test was performed: Cells were treated with 2.5 µM oligomycin, 1 µM carbonylcyanide m-chlorophenylhydrazone (CCCP; Sigma-Aldrich) to uncouple the respiratory chain, and 1 µg/mL antimycin A (AA; Sigma-Aldrich) together with 1 µM rotenone (Rot; Cayman Chemicals) to block mitochondrial respiration.
Lactate Assay
To measure intra- and extracellular lactate amounts the lactate assay from Sigma-Aldrich (MAK064) was used. Briefly, 0.5 - 1×10⁶ cells were homogenized in 200 µL Lactate Assay Buffer and centrifuged at 13,000×g for 10 min. 200 µL of cell supernatants were centrifuged at 1,000×g for 5 min to remove cells followed by another centrifugation at 2,000×g for 10 min to remove cells debris. Both, cell samples as well as cell media were deproteinized with a 10 kDa MWCO spin filter (Merck) to remove lactate dehydrogenase. Afterwards, the lactate assay was performed according to the manufacturer's guidelines. Protein concentrations were determined using the DC Protein Assay (Bio-Rad Laboratories) and lactate concentration was reported per mg protein.
Cell Proliferation Assays
In a first set of experiments, the Incucyte® S3 Live cell Analysis System (Essen Bioscience) and the Incucyte software were used to measure MCF-7 cell proliferation upon coculture with MΦ. Pictures of cocultures were taken every 6 h for a total of 162 h and cell number was determined based on the GFP signal intensity.
In a second set of experiments, fluorescence signal of MCF-7 cells was measured in a TECAN SPARK® multimode microplate reader (TECAN, Männedorf, Switzerland) every 24 h for a total of 144 h and cell proliferation was determined based on the GFP signal intensity.
Statistical Analysis
All data are presented as mean values ± SEM of at least three independent experiments. Before normalization, all data were pre-analyzed to determine normal distribution and equal variance with D'Agostino-Pearson omnibus normality test. Parametric versus non-parametric tests were applied accordingly, as indicated in the figure legends. Statistical analyses of non-normalized data were performed using two tailed Student's t-test, and or two-way analysis of variance with Bonferroni's correction. Normalized data was analyzed using one sample t test or Wilcoxon rank-sum test. Asterisks indicate significant differences between experimental groups (*p < 0.05; **p < 0.01; **p < 0.001).
Results
Regulation of LDHB in Primary Human MΦ by Tumor Cell-Derived MiR-375
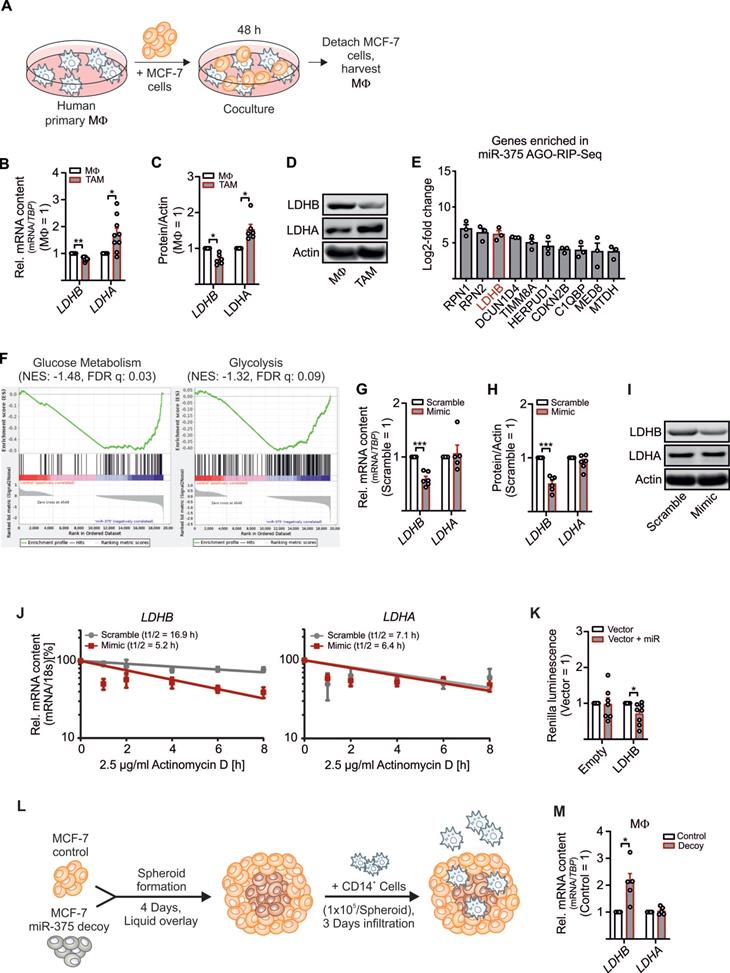
To explore how tumor-derived factors affect TAM metabolism, we set up a coculture of primary human MΦ with MCF-7 breast cancer cells. Upon their interactions, MΦ get polarized towards a TAM phenotype (Figure 1A). This allowed to investigate alternations in key glycolytic enzymes involved in lactate production in the TME. As expected, LDHA mRNA expression (Figure 1B) and protein amount (Figure 1C-D and S1A) increased, while the mRNA expression of LDHB significantly decreased in the TAM fraction upon 48 h of coculture (Figure 1B-D and S1A-C). LDHB is known as a direct target of miR-375 in certain cancer cells [23, 24]. We provided evidence that apoptotic MCF-7 cells release miR-375, which is taken up by MΦ via CD36 and accumulating intracellularly (Figure S1D) [11]. Whether miR-375 targets LDHB in stroma cells, particularly in MΦ, is unknown. To answer this question, we investigated the tumor-derived miR-375 targetome in primary human MΦ using AGO-RIP-Seq upon transfection with miR-375 mimic and immunoprecipitation with a pan-Ago antibody [11, 16]. LDHB was elevated in the AGO-RIP-Seq dataset (Figure 1E). Gene set enrichment analysis (GSEA) suggested that genes involved in glycolysis and glucose metabolism are overrepresented in miR-375 containing MΦ (Figure 1F). Overexpression of miR-375 with a synthetic miR-mimic (Figure S1E) decreased LDHB mRNA (Figure 1G) and protein expression (Figure 1H-I, and Figure S1A), while LDHA mRNA and protein amounts remained unaltered. MiRs regulate gene expression by degradation of target mRNAs and/or through translational inhibition [25]. Therefore, MΦ overexpressing miR-375 were treated with actinomycin-D to block transcription, which destabilized LDHB mRNA, while LDHA mRNA stability was unaffected. Suggestively miR-375 decreases LDHB mRNA stability in MΦ (Figure 1J). To verify these results MΦ were transfected with reporter vectors containing the 3'UTR sequence of LDHB behind a Renilla Luciferase coding region. Luciferase activity was reduced when MΦ were co-transfected with miR-375 mimic (Figure 1K). To confirm these results in a more pathophysiological setting, we generated tumor spheroids from MCF-7 control and MCF-7 miR-375 decoy cell lines [11] (Figure S1F) followed by infiltration with CD14+ human peripheral blood monocytes (Figure 1L). After 3 days, LDHB mRNA expression appeared higher in MΦ from MCF-7 decoy spheroid cocultures (Figure 1M), which correlated with reduced miR-375 transfer (Figure S1F). These results establish regulation of LDHB in human MΦ by tumor-derived miR-375.
Regulation of LDHB by tumor-derived miR-375 in human MΦ. Primary human MΦ were cocultured with MCF-7 cells for 48 h. (A) Experimental scheme. (B) mRNA expression of LDHB and LDHA in TAMs relative to control MΦ. (C) Protein expression of LDHB and LDHA in TAMs relative to control MΦ. Actin was used for normalization. (D) Representative Western blots of LDHB, LDHA and actin. (E, F) Primary human MΦ were transfected with synthetic miR-375 mimic or cel-miR-39a (scramble) for 48 h, followed by AGO-IP and RNA-Sequencing. (E) Genes enriched in miR-375 containing MΦ in AGO-RIP-Seq. (F) Representative gene set enrichment plots of gene sets enriched in miR-375 containing MΦ. (G - J) MΦ were transfected with synthetic miR-375 mimic or cel-miR-39a (scramble) for 48 h. (G) LDHB and LDHA mRNA expression and (H) protein expression of LDHB and LDHA relative to scramble transfected MΦ. Actin was used for normalization. (I) Representative Western blots of LDHB, LDHA and actin. (J) MΦ were treated with actinomycin D. LDHB and LDHA contents at 0 h treatment were set to 100%. mRNA half-life (t1/2) was calculated by exponential regression curve. (K) MΦ were transfected with LDHB 3'UTR reporter plasmid or empty control vector with or without synthetic miR-375 mimic for 48 h. Binding of miR-375 to LDHB was analyzed as the ratio of Renilla luciferase to firefly luciferase activity. (L, M) Coculture of MCF-7 tumor spheroids with human CD14+ monocytes for 3 days. (L) Experimental design. (M) Cocultures were harvested and MΦ were separated from MCF-7 cells via anti-CD14 microbeads. mRNA expression of LDHB and LDHA relative to MΦ from MCF-7 control spheroids is shown. Data are represented as mean ± SEM of n ≥ 3. p-values were calculated using Wilcoxon rank-sum test (B, C, K, M) and one-sample t test (G, H). *, p < 0.05; ***, p < 0.001.
LDHB regulates Aerobic Glycolysis and Lactate Production in MΦ and MCF-7 Cells
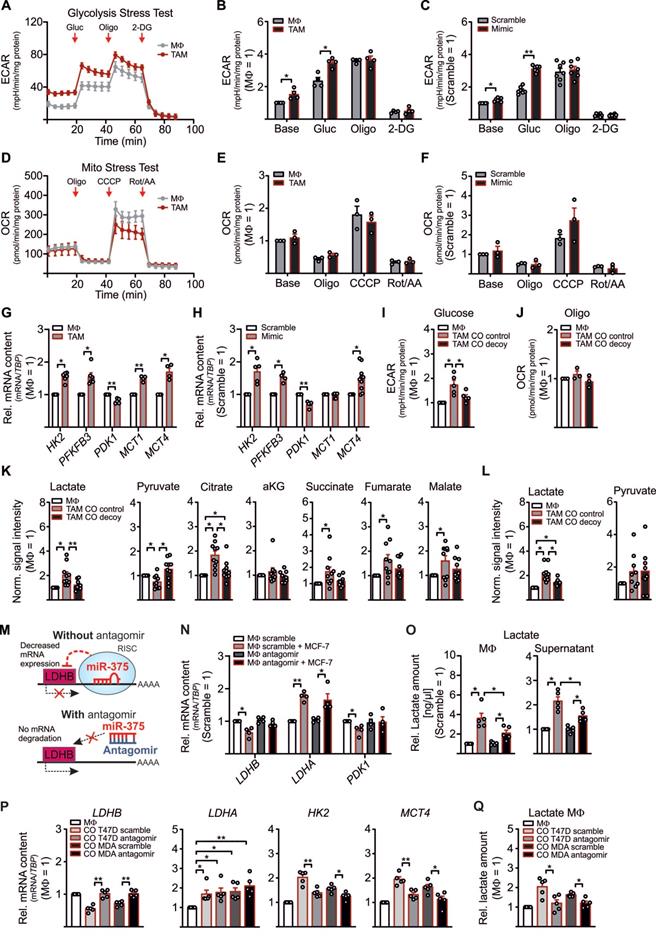
Although the role of LDHB in macrophages is underappreciated, in pancreatic cancer a low LDHB expression induces glycolysis [26]. There is also evidence for a robust shift from oxidative phosphorylation to glycolysis in murine and human TAMs [27-30]. To investigate whether downregulation of LDHB by miR-375 in MΦ might induce glycolysis, we performed metabolic flux assays with TAMs and miR-375 overexpressing MΦ. The extracellular acidification rate (ECAR) was enhanced in MCF-7 cocultured TAMs (Figure 2A-B) and mimic transfected MΦ (Figure 2C, Figure S2A), while the oxygen consumption rate (OCR) remained unaltered (Figure 2D-F, Figure S2B). Expression of key glycolytic enzymes, i.e. hexokinase 2 (HK2), 6-phosphofructo-2-kinase/fructose-2,6-biphosphatase (PFKFB3), and the monocarboxylate transporters 1 and 4 (MCT1, MCT4) increased in TAMs (Figure 2G) and mimic transfected MΦ (Figure 2H) (except for MCT1, which was unaffected in mimic transfected MΦ). As expected, the established miR-375 target pyruvate-dehydrogenase kinase 1 (PDK1) was downregulated [31]. We then verified these results in MΦ cocultured with control or decoy MCF-7 cells. An enhanced ECAR was corelated with enhanced mature miR-375, however, pre-miR-375 expression was unaffected in cocultured TAMs (Figure S2C), while decoy MCF-7 cells provoke no increase in TAM glycolysis (Figure 2I). OCR remained unaltered in TAMs from both cocultures (Figure 2J).
LDHB downregulation enhances glycolysis and lactate production in human MΦ. (A - H) MΦ were cocultured with MCF-7 cells (A, B, D, E, G) or treated with miR-375 mimic or cel-miR-39a (scramble) (C, F, H) for 48 h. Extracellular acidification rate (ECAR) and oxygen consumption rate (OCR) were measured by Glycolysis Stress Test and Mito Stress Test, respectively. (A) Representative line graphs of the mean ± SEM of ECAR. Cells were treated with 5 mM glucose (Gluc), 2.5 µM oligomycin (Oligo), and 50 µM 2-deoxyglucose (2-DG). (B) ECAR of TAMs relative to control MΦ. (C) ECAR of miR-375 mimic transfected MΦ relative to scramble transfection. (D) Representative line graphs of the mean ± SEM of OCR. Cells were treated with 2.5 µM Oligomycin (Oligo), 1 µM carbonyl cyanide m-chlorophenylhydrazone (CCCP) and 1 µg/mL antimycin A (AA) together with 1 µM rotenone (Rot). (E) OCR of TAMs relative to control MΦ. (F) OCR of miR-375 mimic transfected MΦ relative to scramble transfection. (G, H) mRNA expression of HK2, PFKFB3, PDK1, and MCT1/MCT4 in TAMs (G) and mimic transfected MΦ (H), relative to respective controls. (I, J) MΦ were cocultured with MCF-7 control or decoy cells for 48 h and ECAR upon glucose treatment (I), and OCR upon oligomycin treatment (J) was measured in TAMs. Data are relative to control MΦ. (K, L) MΦ were cocultured with MCF-7 control or MCF-7 decoy cells for 48 h. Intracellular (K) and extracellular (L) metabolites were extracted from MΦ and measured by GC/MS. Data are normalized to control MΦ. (M - O) MΦ were transfected with synthetic miR-375 antagomir or cel-miR-243-3p (scramble) for 24 h followed by coculture with MCF-7 cells for another 48 h. (M) Experimental scheme. (N) mRNA expression of LDHB, LDHA and PDK1 relative to scramble transfected MΦ. (O) MΦ intra- and extracellular lactate amount was measured by a lactate assay kit and normalized to scramble transfection. (P, Q) T47D or MDA-MB-231 cells were transfected with scramble or miR-375 antagomir for 24 h followed by coculture with MΦ. (P) mRNA expression of LDHB, LDHA, HK2, and MCT4 as well as lactate amount (Q) in TAMs was measured. Data are represented as mean ± SEM of n ≥ 3 and p-values were calculated using Wilcoxon rank-sum test *, p < 0.05; **, p < 0.01; ***, p < 0.001.
Based on metabolic flux assays data with MΦ, we expected similar findings in MCF-7 cells owing to their constitutive miR-375 expression and LDHB suppression. Indeed, ECAR was reduced in MCF-7 decoy cells at the basal level and upon glucose treatment (Figure S2D), which was in line with increased LDHB but reduced PFKFBR3 mRNA expression (Figure S2E). However, transcript expression of LDHA, MCT1, and MCT4 remained unaltered. Furthermore, PDK1 mRNA increased in decoy cells, pointing towards a direct role of miR-375 in PDK1 downregulation. These findings provide evidence for a miR-375-LDHB axis to enhance aerobic glycolysis in breast cancer cells and to provoke a glycolytic shift in TAMs.
Often, an increase in aerobic glycolysis results in excessive lactate formation [32]. Since we observed enhanced glycolysis in TAMs and increased expression of the lactate transporter MCT4, which is induced by high lactate amounts and oxidative stress [33, 34], we asked whether miR-375 induces lactate formation in TAMs. Therefore, MΦ were cocultured with control and decoy MCF-7 cells followed by qPCR and GC-MS based metabolome analysis. In contrast to increased LDHA, the mRNA expression of LDHB and PDK1 decreased in TAMs from control as compared to TAMs from decoy cocultures (Figure S2F). Correspondingly, there was a 2-fold increase of intracellular lactate in TAMs from control cocultures as compared to naïve MΦ (naïve MΦ lactate revealed a mean signal intensity of 0.07), while MCF-7 decoy cells did not stimulate lactate formation (Figure 2K). In addition, we observed reduced pyruvate but enhanced citrate, succinate, fumarate, and malate levels in TAMs from control cocultures (Figure 2K). TAMs share metabolic features with LPS/IFN‐γ‐activated M1-like MΦ, where an enhanced glycolytic flux along with an increased flux through PDH due to reduced PDK1 activity provokes citrate and succinate accumulation [35-39]. Besides reduced serine amounts in TAMs, we did not detect alterations in other selected intracellular metabolites (Figure S2G). Moreover, extracellular lactate significantly increased in control cocultures (in naïve MΦ lactate revealed a mean signal intensity of 3.43) (Figure 2L), while extracellular pyruvate remained the same. Interestingly, valine and serine levels were reduced in coculture supernatants (Figure S2H). Since lactate was low in the supernatants from decoy cocultures, we asked whether this might be due to diminished lactate release from MCF-7 decoy cells. Intracellular lactate was reduced by roughly 30% in MCF-7 decoy as compared to control cells (Figure S2I), while pyruvate increased. Nevertheless, the amount of extracellular lactate and pyruvate remained the same in control and miR-375 decoy cancer cells (Figure S2J), suggesting that miR-375-induced LDHB downregulation indeed fosters lactate production in TAMs.
To further substantiate these findings, MΦ were transfected with miR-375 antagomir prior to coculture. We hypothesized that in TAMs the presence of the antagomir should prevent tumor-derived miR-375 binding to LDHB, thereby enhancing LDHB expression and reducing lactate formation (Figure 2M). As to our expectation, antagomir treatment rescued downregulation of LDHB and PDK1 mRNA in TAMs, while LDHA mRNA expression was still evident (Figure 2N). Accordingly, intra- and extracellular lactate amounts were reduced in antagomir-transfected TAMs (Figure 2O). To rule out that these results are cell line specific, we cocultured MΦ with scramble or miR-375 antagomir transfected T47D or MDA-MB-231 breast cancer cells. In tumor cells, antagomir treatment significantly reduced the miR-375 amount in both cell lines (Figure S2K), which was in line with increased LDHB and reduced PFKFB3 mRNA expression, while LDHA remained unaltered (Figure S2L). Moreover, antagomir transfected tumor cells showed reduced intracellular lactate levels as compared to scramble transfected cells, while extracellular lactate remained constant upon antagomir transfection (Figure S2M). Accordingly, in tumor cell antagomir treatment decreased miR-375 amounts in TAMs upon coculture and lowered LDHB expression, enhanced glycolytic activity as indicated by the enhanced mRNA expression of HK2 and MCT4 (Figure 2P), as well as enhanced lactate synthesis (Figure 2Q). These findings suggest that tumor cells use miR-375 to hijack MΦ, thereby increasing lactate production and secretion.
LDHB Downregulation Drives MΦ Polarization and Subsequent Tumor Growth
With this set of experiments, we aimed to explore functional roles of increased lactate formation due to LDHB downregulation in TAMs. Tumor cell-derived lactate promotes MΦ polarization by inducing vascular endothelial growth factor (VEGF) and arginase 1 (ARG1) expression and fosters MΦ IL-23/IL-17 production [6, 40]. Corroborating these findings, treatment of MΦ with lactate increased mRNA expression of IL23, VEGFA, ARG1, and MCT4, but not IL10 or CLEC7A (dectin-1) (Figure S3A). Upregulation of these factors i.e. IL23, VEGFA, and ARG in TAMs was abolished in antagomir transfected TAMs (Figure 3A). IL10 and CLEC7A, increased in TAMs, but remained unaltered upon antagomir treatment. Apparently, miR-375 is important for the lactate-mediated phenotype switch, but not for the classical TAM polarization [11]. Next, we asked whether these effects can be further enhanced when lactate is accumulating in TAMs. Knockdown of the MCT4 lactate exporter in TAMs [41] (Figure 3B) increased intracellular lactate accumulation (Figure 3C), while extracellular lactate was reduced. In addition, lactate was apparently lower in TAMs from decoy cocultures as compared to TAMs from control cocultures, which correlated with decreased IL23, VEGFA, and ARG mRNA expression (Figure 3D). This could be rescued by a KD of MCT4 in TAMs from decoy cocultures.
Lactate drives MΦ polarization and enhances tumor cell proliferation. (A) MΦ were transfected with miR-375 antagomir or cel-miR-243-3p (scramble) for 24 h followed by coculture with MCF-7 cells for another 48 h. Quantitation of IL23, VEGFA, ARG1, IL10, and CLEC7A relative to scramble transfected MΦ is shown. (B - J) MΦ were transfected with non-specific siRNA or siRNA against MCT4 for 24 h followed by coculture with MCF-7 cells (B - E, K) or T47D cells (F, L) for 48 h or 168 h (F - H). (B) MCT4 expression relative to scramble transfected MΦ is shown. (C) Lactate amount in MΦ and in the media was measured by lactate assay kit and normalized to scramble transfected MΦ. (D) Quantitation of genes involved in MΦ polarization relative to scramble transfected MΦ is shown. (E, F) MCF-7 cells (E) or T47D cells (F) were harvested from cocultures and intracellular lactate amount was measured by a lactate assay kit. Data are normalized to MCF-7 control/T47D scramble cells from cocultures with scramble transfected MΦ. (G - I) MCF-7 cell proliferation upon MΦ coculture was analyzed by IncuCyte live cell imaging system. (G) Representative pictures. (H, I) The number of MCF-7 cells was determined. (J - L) Quantitation of proliferation marker KI67 (J, L) as well as MCT4, and GPR132 (K) relative to control MCF-7 cells from cocultures with scramble transfected MΦ is shown. Data are represented as mean ± SEM of n ≥ 3 and p-values were calculated Wilcoxon rank-sum test *, p < 0.05; **, p < 0.01; ***, p < 0.001.
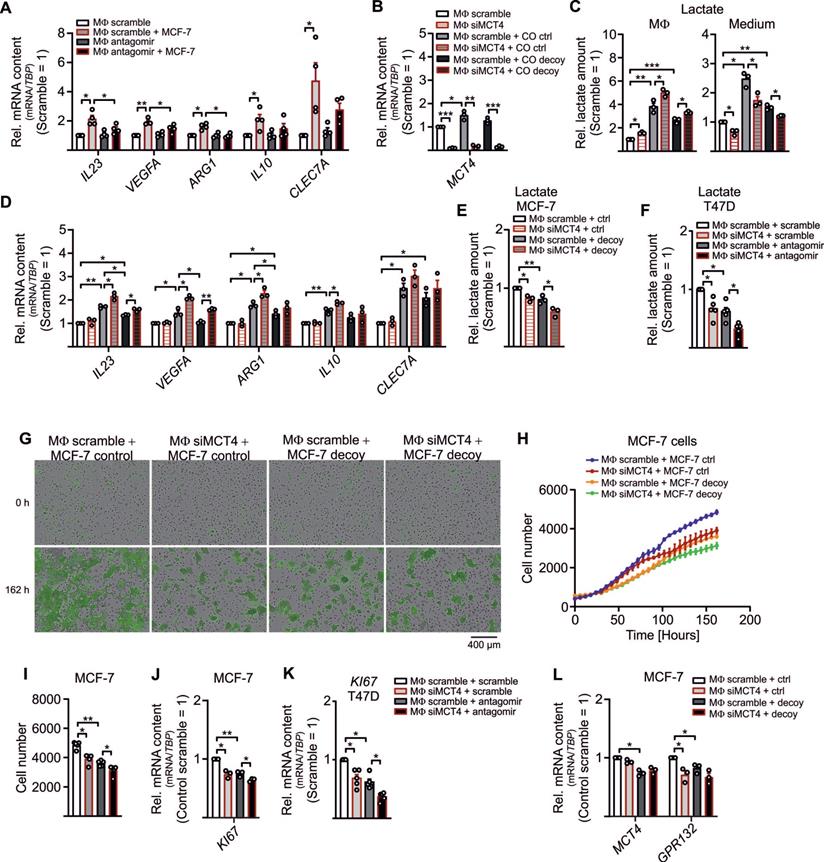
Since lactate was also released into the supernatant, we asked whether MΦ-derived lactate can be taken up by tumor cells to foster proliferation [42-44]. Intracellular lactate was diminished in MCF-7 as well as T47D cells isolated from MCT4 KD MΦ cocultures (Figure 3E, F), suggesting that MΦ-derived lactate is taken up by tumor cells. In MCF-7 decoy and T47D antagomir cells the lactate amount was low upon coculture, which was due to both, reduced lactate formation by decoy cells as well as reduced MΦ lactate secretion.
We then measured GFP+ tumor cell proliferation upon coculture with MΦ using the IncuCyteTM live cell imaging system. Proliferation of MCF-7 decoy cells was reduced as compared to MCF-7 controls (Figure 3G-I) and was further suppressed when MΦ lactate secretion was attenuated. This was supported by decreased mRNA expression of the proliferation marker KI67 (Figure 3J). These results were replicated in T47D cells, when T47D cells were transfected with antagomir and cocultured with MΦ in which lactate secretion was blocked, resulted in reduced KI67 mRNA expression (Figure 3K. Interestingly, expression of glycolytic enzymes HK2, PFKFBR3, and PDK1 decreased in cocultured MCF-7 cells when lactate release from MΦ was blocked (Figure S3B). Furthermore, mRNA expression of GPR132, which is the key lactate sensor in tumor cells and MΦ [45], decreased in cocultured tumor cells from MCT4 KD MΦ (Figure 3L), while MCT4 mRNA expression remained unaltered. Evidently, miR-375 downregulates LDHB in MΦ, which stimulates their lactate formation and secretion to foster tumor cell proliferation.
Downregulation of LDHB Activates SREBP2 and Cholesterol Biosynthesis in MΦ
Besides the notion that lactate is one factor that adds to tumor cell proliferation, other factors, such as stroma cell-derived cholesterol, might be of relevance as well [46, 47]. Since we noticed an inverse correlation between lactate and pyruvate (Figure 2L) and pyruvate serves as an indirect precursor for free fatty acids and sterol synthesis, we expected reduced free fatty acid and sterol production in LDHB downregulated TAMs. To follow this assumption, cell pellets and supernatants from miR-375 mimic transfected MΦ were harvested to measure and fatty acids, sterols and oxysterols by GC-MS. Palmitic acid, magaric acid, eicosenoic acid, and eisosatrienoic acid decreased in MΦ overexpressing miR-375, while the level of stearic acid was enhanced (Figure 4A). Whereas several other fatty acids measured remained unaltered (Figure S4A), we noticed an increase of intracellular (Figure 4B, C) and extracellular (Figure 4D, E) sterols and oxysterols upon miR-375 overexpression.
MiR-375-mediated LDHB downregulation induces SREBP2 activation and cholesterol biosynthesis in MΦ. (A - E) MΦ were treated with synthetic miR-375 mimic or cel-miR-39a (scramble) for 48 h. Data are normalized to scramble transfected MΦ. (A - E) Intracellular fatty acids (A), cholesterol, non-cholesterol sterols (B), and oxysterols (C) were measured by GC/MS. (D, E) Extracellular cholesterol and non-cholesterol sterols (D), and oxysterols (E) were measured by GC/MS. (F) Overview of SREBP2/SREBP1 mediated gene regulation and cholesterol as well as fatty acid synthesis. Key enzymes are highlighted in red. (G) MΦ were treated with 10 mM lactate for 24 h. Quantitation of SREBP1/SREBP2 mRNA and their target genes relative to untreated MΦ. (H, I) MΦ were transfected with synthetic miR-375 antagomir or cel-miR-243-3p (scramble) for 24 h followed by coculture with MCF-7 cells for another 48 h. mRNA expression of SREBP1/SREBP2 (H) and their target genes (I) relative to scramble transfected MΦ. (J) mRNA expression of SREBP2/SREBP1 and their targets. Data are represented as mean ± SEM of n ≥ 3 and p-values were calculated using Wilcoxon rank-sum test *, p < 0.05; **, p < 0.01.
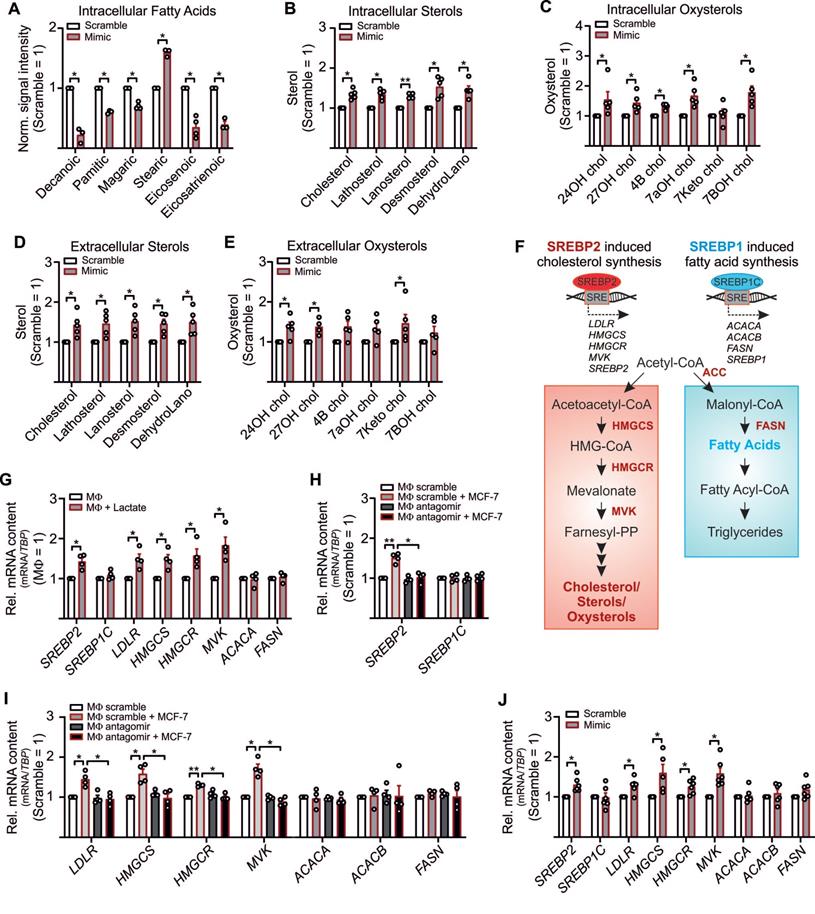
Higher levels of cholesterol/oxysterols besides lactate accumulation were unexpected. However, it has been demonstrated that an acidic pH, based on lactate accumulation, can trigger activation and nuclear translocation of the transcription factor SREBP2. SREBPs are key regulators of lipid homeostasis [48, 49] with three isoforms existing: SREBP1a activates fatty acid- and cholesterol synthesis, SREBP1c induces fatty acid synthesis, and SREBP2 provokes cholesterol synthesis [50] (Figure 4F). Since miR-375 caused lactate accumulation in TAMs we speculated whether this might trigger SREBP2 activation and the concomitant expression of cholesterol biosynthetic enzymes [51, 52]. Exposing MΦ to lactate indeed increases SREBP2, but not SREBP1C mRNA (Figure 4G). Also, mRNA expression of SREBP2 target genes low-density lipoprotein receptor (LDL), HMG CoA synthase (HMGCS), HMG Co A reductase (HMGCR), and mevalonate kinase (MVK) increased upon lactate treatment, while the SREBP1C target genes acetyl-CoA carboxylase A (ACACA) and fatty acid synthase (FASN) remained unaltered (Figure 4G). In TAMs, SREBP2 (Figure 4H) and SREBP2 target gene expression (Figure 4I) were enhanced, and these responses were ablated when miR-375-induced lactate formation was blocked by antagomir treatment. SREBP1C expression remained unaltered. Furthermore, SREBP2 mRNA expression was decreased in TAMs from miR-375 decoy cocultures (Figure S4B). The knockdown of MCT4 in TAMs did not enhance SREBP2 expression upon coculture with control or mR-375 decoy MCF-7 cells (Figure S4B), suggesting that interfering with lactate export cannot further induce SREBP2 activation. Supporting evidence came from experiments when SREBP2 and SREBP2 target gene expression was enhanced in miR-375 overexpressing MΦ (Figure 4J), while SREBP1C and its target genes as well as citrate synthase (CS), ATP citrate synthase (ACLY), and GPR132 mRNA expression remained unaltered (Figure S4C). To conclude, miR-375-induced lactate accumulation activates SREBP2, thereby enhancing cholesterol biosynthesis in TAMs.
LDHB Caused Cholesterol Production, Which Fostered Tumor Cell Proliferation
We now aimed to investigate the functional relevance of enhanced cholesterol biosynthesis and/or the increased sterol/oxysterol efflux in TAMs. Before setting up the coculture, lactate export from MΦ was blocked by MCT4 KD (Figure S5A), and MΦ were treated with the HMGCR inhibitor simvastatin for 2 h to block cholesterol biosynthesis [53] (Figure 5A, Figure S5B). Tumor cell-derived miR-375 enhanced cholesterol accumulation in TAMs, whereas the increase in lactate, due to the MCT4 KD, did not potentiate cholesterol synthesis (Figure 5B). The MCT4 KD enhanced ARG and IL23 mRNA expression in TAMs, while simvastatin left their mRNA expressions unaltered (Figure 5C). We concluded that downregulation of LDHB triggered lactate formation to stimulate TAM pro-tumor functions (Figure 3A, S3A, 5C), while enhanced cholesterol biosynthesis did not alter the TAM phenotype.
MΦ-derived cholesterol enhances breast tumor cell proliferation. (A - C) MΦ were transfected with non-specific siRNA or siRNA against MCT4 for 24 h followed by pre-treatment with 1 µM simvastatin (Sim) or DMSO for 2 h. MΦ were washed and cocultured with MCF-7 cells for another 48 h to 144 h. (A) Experimental scheme. (B) Total cholesterol was measured in MΦ using the AmplexRed cholesterol assay kit. (C) mRNA expression of ARG and IL23 in MΦ relative to DMSO treated scramble transfected MΦ. (D - G) MCF-7 control and decoy cells were treated with 1 µM simvastatin or 1 µM DMSO as control for 2 h followed by additional culture for up to 144 h. (D) Total cholesterol was measured in MCF-7 cells after 48 h. (E, F) GFP+ MCF-7 cell proliferation was measured using the TECAN reader. (E) Line graphs showing MCF-7 cell proliferation. (F) Mean fluorescence intensity at 144 h is shown and representative for the number of MCF-7 cells. (G) MCF-7 cells were harvested and mRNA expression of KI67 relative to untreated control MCF-7 cells is shown. (H - K) MCF-7 and T47D cells from the experiment displayed in A were analyzed. (H) Proliferation of GFP+ MCF-7 cells from cocultures was measured based on the mean fluorescence intensity of GFP. (I) mRNA expression of KI67 relative to untreated control MCF-7/scramble T47D cells. (J) Lactate amount in MCF-7 and T47D cells was quantified using the lactate assay kit. (K) Total cholesterol in MCF-7 and T47D cells was measured using the AmplexRed assay. Data are represented as mean ± SEM of n ≥ 3 and p-values were calculated using Wilcoxon rank-sum test (B, C, G) and two-way ANOVA with Bonferroni's correction (D, F, H - K). *, p < 0.05; **, p < 0.01.
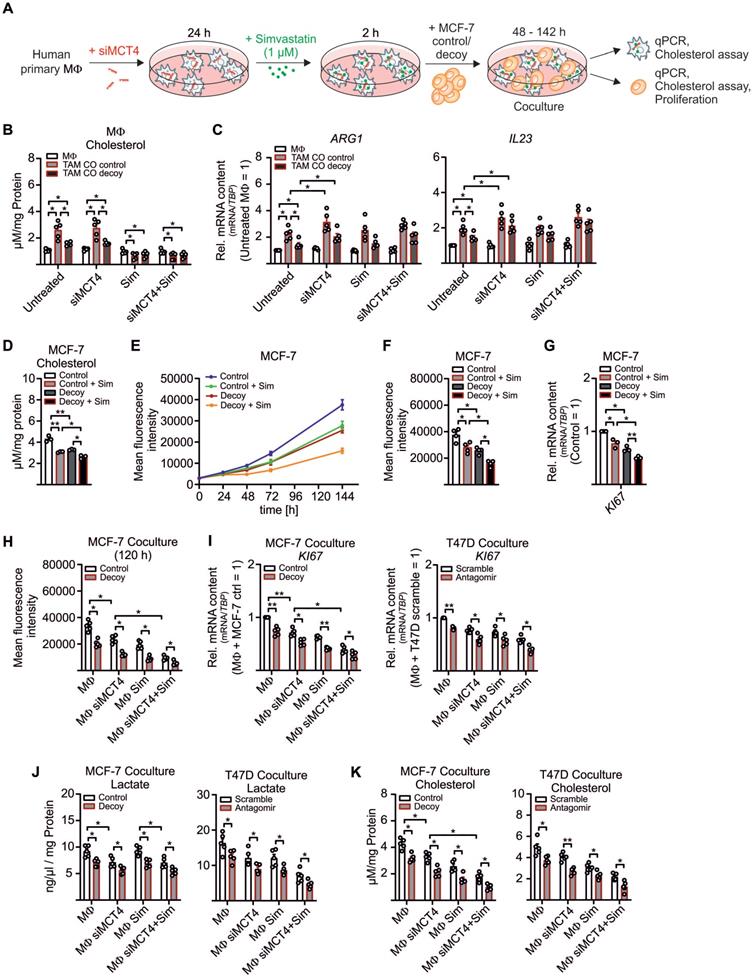
Since cholesterol accumulates in various cancers [54] and cholesterol-depleting agents reduce proliferation and apoptosis [55, 56], we hypothesized that MΦ-derived cholesterol might induce MCF-7 cell proliferation. First, we established that MCF-7 cell growth indeed correlated with the cholesterol content. Therefore, control and decoy MCF-7 cells were pre-treated with simvastatin and cultured for 48 h to 144 h. Cholesterol content was low in MCF-7 decoy as compared to control cells at 48 h and were further reduced by simvastatin (Figure 5D). We noticed a positive correlation between cholesterol content and proliferation at 144 h, starting from 48 h onwards (Figure 5E-F). These results were supported by reduced KI67 mRNA expression in MCF-7 decoy as well as in simvastatin treated cells (Figure 5G), implying that cholesterol is necessary for tumor growth. Accordingly, both, a KD of MCT4 in MΦ as well simvastatin treated MΦ reduced tumor cell proliferation (Figure 5H). Proliferation was further decreased when both MΦ lactate secretion and cholesterol biosynthesis were blocked. Again, this was supported by reduced KI67 mRNA expression in both MCF-7 cells as well as T47D cells (Figure 5I). As already shown in before, the MCT4 KD in MΦ reduced lactate amounts in MCF-7 control and decoy cells as well as in T47D scramble and antagomir transfected cells (Figure 5J). Interestingly, both the MCT4 KD in MΦ as well as simvastatin treatment of MΦ significantly reduced the cholesterol content in MCF-7 and T47D cells (Figure 5K). These findings provide evidence for a positive feedback loop where miR-375 hijacks TAM metabolism to change their phenotype to become lactate and cholesterol producers to fuel tumor cell lactate requirement and growth.
MiR-375 Decreased MΦ LDHB in Murine and Human Breast Carcinoma
In a final set of experiments, we asked whether LDHB is a target of miR-375 in vivo. Control or miR-375 decoy MCF-7 cells were injected into the flanks of female NMRI-Foxn1nu mice (Figure 6A). After 35 days, tumors were harvested and MΦ were FACS-sorted from tumors. In analogy to our in vitro findings, the miR-375 amount was low in MΦ from decoy tumors (Figure S6A). This correlated with higher LDHB expression relative to MΦ from control tumors (Figure 6B). Tumor sections were then stained for the MΦ marker CD163 and LDHB using the PhenOptics multispectral imaging system. LDHB protein expression increased in whole tissue sections from decoy tumors and in infiltrated TAMs (Figure 5C). Even though the number of infiltrating MΦ was low, we observed a colocalization of CD163 and LDHB in decoy tumors, suggesting the presence of LDHB protein in TAMs under conditions when tumor cells are low in miR-375 (Figure 6D).
MiR-375 decreased MΦ LDHB in mouse and human breast carcinoma. (A - D) Female NMRI-Foxn1nu mice were pre-treated with 17β-estradiol pellets followed by subcutaneous injection of 1 × 10⁷ MCF-7 control or decoy cells in the right and left flank. Tumors were harvested after 35 days or after a maximum tumor volume of 1.5 cm3 has been reached. (A) Experimental layout. (B) Infiltrating murine MΦ were FACS-sorted out of tumors and analyzed for Ldhb and Ldha mRNA expression. (C, D) Immunohistochemical staining of tumor sections. (C) LDHB protein expression in whole tumor tissue and in infiltrating MΦ. (D) Representative pictures of MCF-7 control and decoy tumor sections with arrowheads in magnification showing colocalization of CD163 and LDHB. (E - H) Human invasive mammary carcinoma TMA sections were analyzed for miR-375 abundance by in situ hybridization, followed by staining of CD163 and LDHB. Bright-field signal of miR-375 was converted to fluorescence image using InForm2.0. (E) Mean LDHB intensity in human invasive breast cancer sections compared with normal breast (n = 156 breast tumors; n = 49 normal breasts). (F) Mean LDHB intensity in human ductal carcinoma in situ (DCIS) sections compared with normal breast (n = 16 DCIS; n = 49 normal breasts). (G) Correlation between miR-375 mean intensity and LDHB expressing cells in invasive breast tumor sections (n = 155). (H) Representative pictures of invasive breast cancer section with arrowheads in magnification showing miR-375 colocalization with CD163 and LDHB. Data are represented as mean ± SEM of n ≥ 3 and p-values were calculated using Wilcoxon rank-sum test (B, C) and two-tailed Student's t-test (E, F). *, p < 0.05, ***, p < 0.001.
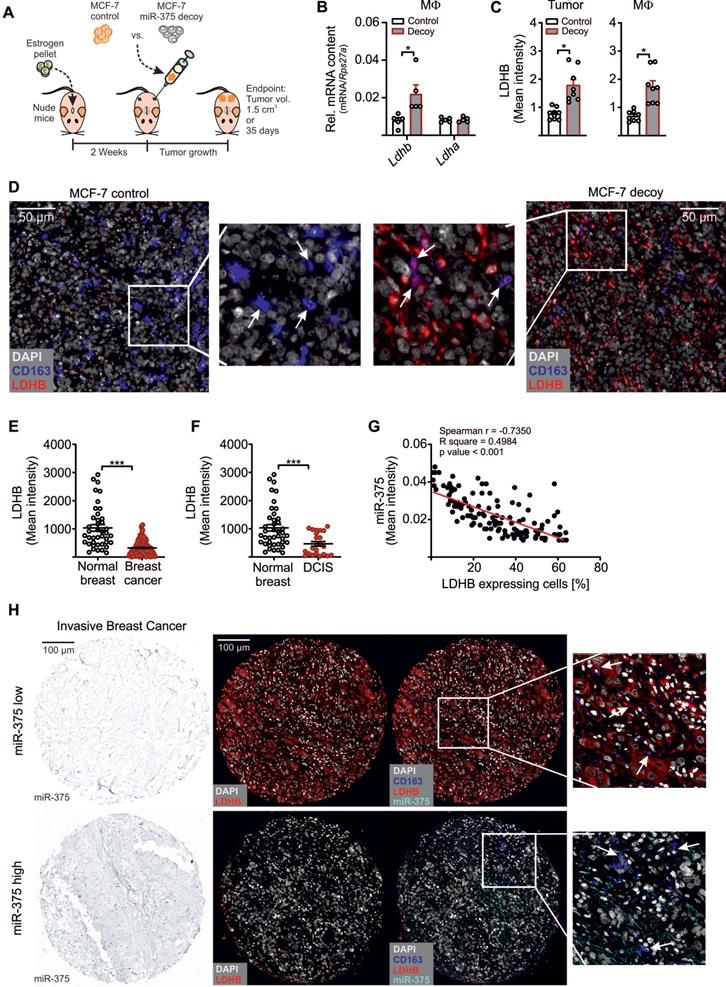
As an early event in cancer development and progression LDHB is downregulated in different cancers, including breast cancer [15, 57-59], which is linked with unfavourable patient survival [60, 61]. Since those studies unfortunately focussed on LDHB expression only in whole tumor tissues, we measured the TAM-specific miR-375 and LDHB content in tissue microarray slides of mammary carcinoma patients as previously described [11]. There was a more intense staining for miR-375 in invasive breast cancer (Figure S6B) and ductal carcinoma in situ sections (Figure S6C) compared with normal breast tissue. Higher miR-375 staining referred to a reduced LDHB content (Figure 6E-F). We also observed a negative correlation between miR-375 and LDHB in tumor sections with Pearson's r = -0.7350 and p < 0.001 (Figure 6G). Importantly, in tumor sections showing high miR-375 amounts, LDHB was barely expressed in TAMs and vice-versa (Figure 6H). These data substantiated a link between miR-375 and LDHB in TAMs and pointed to a clinical relevance of our findings.
Discussion
Our study adds to the molecular mechanism how breast tumor cells alter TAMs metabolism for trophic needs and homeostasis by downregulating LDHB in mouse and human breast cancer tissue. Since functional consequences of LDHB in MΦ are unknown, we expected that downregulating LDHB by miR-375 and subsequent lactagenesis may have consequences not only for TAMs but also tumor cells. Live metabolic flux assays as well as transcript analysis of glycolytic enzymes revealed that LDHB suppression via miR-375 increased aerobic glycolysis in tumor cells and TAMs, without changing OCR. This appears interesting since ECAR is a combined measure of glycolysis and the TCA cycle and lactate has been shown to be a primary source of energy for the TCA cycle [43]. We observed enhanced intra- and extracellular lactate in TAMs due to miR-375 accumulation, which was accompanied, enforced MCT4 expression. Both, MCT1 and MCT4 are upregulated in breast cancer [62]. While MCT1 is required for lactate import, MCT4 is induced by high lactate and oxidative stress, to facilitate lactate secretion and to enhance the glycolytic flux [33, 34, 63]. It has been shown that aerobic glycolysis enhanced by TAMs confers apoptosis resistance to breast cancer cells [64]. Furthermore, LDHB suppression due to promoter hypermethylation has already been shown to induce a glycolytic transition in pancreatic cancer [26]. LDHB is upregulated in triple-negative breast cancer cells and its knockdown reduced cell proliferation [15]. Unlike LDHA, LDHB is negligibly expressed in luminal breast cancer cells like MCF-7 and its knockdown had no major effect on cell proliferation [15]. In fact, MCF-7 have been reported to generate about 80% of their energy through mitochondrial respiration [65]. This disparity of glucose utilization by different breast cancer types and the differential expression of LDHB makes it an attractive target for anti-tumor treatment.
We provide evidence that in addition to tumor-derived lactate, tumor cells use miR-375 to enhance lactagenesis in TAMs for tumor-promoting functions. MΦ-derive lactate enhances tumor cell proliferation (Figure 5), which was in line with a previous study showing that in breast cancer cells reduced intracellular lactate was due to LDHA inhibition and diminished tumor growth [66]. High concentrations of lactate in biopsies of breast cancers are associated with an increased risk for developing metastasis, and a poor survival prognosis in cancer patients [67]. Since lactate can be taken up even in aerobic region of tumor [67] and can be used as an alternative energy supply to fuel the TCA-cycle [68,69], our results imply that tumor cells, via miR-375-LDHB, reprogram MΦ making them lactate producers to feed tumor cell energy requirements.
We found that the accumulation of lactate activates SREBP2 but not SREBP1 in TAMs. SREBP2 then induced the expression of cholesterol biosynthetic enzymes as well as its own transcription (Figure 6) [48], which was possibly due to increased SREBP2 processing or alternated vesicle targeting [70, 71]. While SREBP1 has already been shown to be critical for cancer progression [72], the role of SREBP2 in carcinogenesis, especially in TAMs, is unclear. Interestingly, SREBP2 is upregulated in breast and prostate cancer [73-75] and increases glycolysis [76], which is in line with enhanced glycolysis and SREBP2 expression in TAMs from our experiments. We found that enhanced sterol/oxysterol amounts in MΦ did not inhibit cholesterol biosynthesis in TAMs, which was in line with a study showing that in malignant cells the cholesterol feedback loop is non-functioning [77]. In a recent study, cholesterol efflux from TAMs, accompanied by reduced intracellular cholesterol levels, induced IL-4 signalling and pro-tumoral functions [46]. Accumulation of sterols and oxysterols together with their enhanced secretion did not affect the MΦ phenotype in our experiments. However, simvastatin treatment of TAMs reduced cholesterol levels in tumor cells and inhibited MCF-7 cell proliferation upon coculture, especially in miR-375 decoy tumor cells. Indeed, high levels of serum cholesterol are associated with increased breast cancer risk [78] and enhanced tumor growth and metastasis in a murine MMTV-PyMT model [79]. In addition, due to their high cholesterol content, breast cancer cell lines are more sensitive to statin induced apoptosis than their healthy counterparts [56, 80]. In our experiments, MΦ-derived lactate was taken up by tumor cells and added to increased tumor cell cholesterol content, suggesting that MΦ-derived lactate and cholesterol potentiated their effects to enhance tumor cell proliferation.
We measured intracellular fatty acids in TAMs with the assumption that reduced pyruvate may translate in reduced acetyl-CoA, which is an indirect precursor for fatty acid synthesis. Indeed, levels of intracellular fatty acid were low in TAMs because the level of pyruvate was reduced due to LDHB downregulation (Figure 2K, 6F). When pyruvate availability becomes limited, cells can use β-oxidation to produce acetyl-CoA [81], which was in line with enhanced citrate amount in TAMs from control cocultures. We observed a reciprocal regulation of lactate and pyruvate in TAMs. However, most of our mechanistic data focused on lactate but it is likely that some of the effects that we noticed might also be due to reduced levels of pyruvate. Furthermore, the preferential fate of acetyl-CoA towards fatty acid and/or sterol pathways (Figure 4F) is not established, especially since lactate can also be a substrate of the TCA cycle [43]. These intricate relationships between pyruvate - lactate - citrate - acetyl CoA needs further investigation to better understand the role of tumor-derived miR-375 in TAMs metabolism.
Metabolic reprogramming of cells of the TME is an attractive option to improve cancer therapy [82]. Despite carbohydrate-restricted diets demonstrated remarkable benefits in cancer patients [83], targeting glycolytic enzymes such as LDHA had limited success. Targeting stroma cells such as TAMs for the miR-375-LDHB axis, using RNA therapeutics, pose an interesting option since it has been demonstrated that targeting a TAM-specific long non-coding RNA inhibits glycolysis [64], and aptamers for cell surface proteins can be used to deliver siRNA into macrophages in vivo [84, 85]. Furthermore, it has been shown that the use of statin as adjuvant breast cancer therapy reduced cancer related mortality [86]. The MASTER Study (MAmmary Cancer STatin ER Positive Study) aimed at improving prognosis of ER+ breast cancer patients added statin to the current treatment regimen (ClinicalTrials.gov Identifier: NCT04601116). Similarly, there are about 43 registered clinical trials for the use of statins alone or as adjuvant therapy in breast cancer. However, there is no study that explores the role of statins with RNA therapeutics such as antagomirs. Furthermore, there are no registered trials for specifically targeting TAMs with statins despite a study clearly shows that macrophages are required for cholesterol metabolites to mediate metastasis of breast cancer [87]. Our study provides a rationale to target TAMs with RNA therapeutics in combinatorial therapy with statins for breast cancer treatment.
Supplementary Material
Supplementary figures and tables.
Acknowledgements
We thank Gudrun Bayer and Praveen Mathoor for excellent technical assistance. The authors acknowledge the support of Cardio-Pulmonary Institute (CPI), EXC 2026, Project ID: 390649896. The study is supported by Deutsche Forschungsgemeinschaft grants DFG SFB 1039 TP B04 (B.B.) and B06 (A.W.) and BR999/25-1 (BB).
Data availability
Ago-RIP-seq data are deposited in the ArrayExpress database at EMBL-EBI under the accession number E-MTAB-6943 [https://www.ebi.ac.uk/arrayexpress/experiments/E-MTAB-6943]. All relevant data are within the paper and its supplementary information files. Additional data that support the findings of this study are available from the corresponding authors upon reasonable request.
Study approval
Tissue microarrays (TMAs) of human normal breast and invasive breast cancer were provided by the Cooperative Human Tissue Network and the Cancer Diagnosis Program, which are funded by the National Cancer Institute. Mouse care and experiments involving mice were approved by and followed the guidelines of the Hessian animal care and use committee (approval number FU/1152).
Author Contributions
Conceptualization, A-C.F. and S.N.S.; Methodology, A-C.F., R.R., D.F., E.S-F., A.S., A.W., T.S., C.R., and S.N.S.; Formal analysis, A-C.F. and S.N.S.; Investigation, A-C.F., R.R., D.F., E.S-R., A.S., and S.N.S.; Resources, K.H., D.L., and B.B.; Writing - Original Draft, A-C.F. and S.N.S.; Writing - Review & Editing, all authors; Visualization, S.N.S. and B.B.; Supervision, S.N.S. and B.B.; Funding acquisition, B.B.
Competing Interests
The authors have declared that no competing interest exists.
References
1. Pavlova NN, Thompson CB. The Emerging Hallmarks of Cancer Metabolism. Cell Metab. 2016;23(1):27-47
2. DeBerardinis RJ, Chandel NS. Fundamentals of cancer metabolism. Sci Adv. 2016;2(5):e1600200
3. Fiaschi T, Marini A, Giannoni E, Taddei ML, Gandellini P, Donatis A de. et al. Reciprocal metabolic reprogramming through lactate shuttle coordinately influences tumor-stroma interplay. Cancer Res. 2012;72(19):5130-40
4. Bingle L, Brown NJ, Lewis CE. The role of tumour-associated macrophages in tumour progression: implications for new anticancer therapies. J Pathol. 2002;196(3):254-65
5. Mantovani A, Marchesi F, Malesci A, Laghi L, Allavena P. Tumour-associated macrophages as treatment targets in oncology. Nat Rev Clin Oncol. 2017;14(7):399-416
6. Colegio OR, Chu N-Q, Szabo AL, Chu T, Rhebergen AM, Jairam V. et al. Functional polarization of tumour-associated macrophages by tumour-derived lactic acid. Nature. 2014;513(7519):559-63
7. Komohara Y, Jinushi M, Takeya M. Clinical significance of macrophage heterogeneity in human malignant tumors. Cancer Sci. 2014;105(1):1-8
8. Pollard JW. Tumour-educated macrophages promote tumour progression and metastasis. Nat Rev Cancer. 2004;4(1):71-8
9. Lewis CE, Pollard JW. Distinct role of macrophages in different tumor microenvironments. Cancer Res. 2006;66(2):605-12
10. Syed SN, Frank A-C, Raue R, Brüne B. MicroRNA-A Tumor Trojan Horse for Tumor-Associated Macrophages. Cells. 2019 8(12)
11. Frank A-C, Ebersberger S, Fink AF, Lampe S, Weigert A, Schmid T. et al. Apoptotic tumor cell-derived microRNA-375 uses CD36 to alter the tumor-associated macrophage phenotype. Nat Commun. 2019;10(1):1135
12. Valvona CJ, Fillmore HL, Nunn PB, Pilkington GJ. The Regulation and Function of Lactate Dehydrogenase A: Therapeutic Potential in Brain Tumor. Brain Pathol. 2016;26(1):3-17
13. Burgner JW, Ray WJ. On the origin of the lactate dehydrogenase induced rate effect. Biochemistry. 1984;23(16):3636-48
14. Kurpińska A, Suraj J, Bonar E, Zakrzewska A, Stojak M, Sternak M. et al. Proteomic characterization of early lung response to breast cancer metastasis in mice. Exp Mol Pathol. 2019;107:129-40
15. McCleland ML, Adler AS, Shang Y, Hunsaker T, Truong T, Peterson D. et al. An integrated genomic screen identifies LDHB as an essential gene for triple-negative breast cancer. Cancer Res. 2012;72(22):5812-23
16. Pickl JMA, Tichy D, Kuryshev VY, Tolstov Y, Falkenstein M, Schüler J. et al. Ago-RIP-Seq identifies Polycomb repressive complex I member CBX7 as a major target of miR-375 in prostate cancer progression. Oncotarget. 2016;7(37):59589-603
17. Meier J, Hovestadt V, Zapatka M, Pscherer A, Lichter P, Seiffert M. Genome-wide identification of translationally inhibited and degraded miR-155 targets using RNA-interacting protein-IP. RNA Biol. 2013;10(6):1017-29
18. Brauß TF, Winslow S, Lampe S, Scholz A, Weigert A, Dehne N. et al. The RNA-binding protein HuR inhibits expression of CCL5 and limits recruitment of macrophages into tumors. Mol Carcinog. 2017;56(12):2620-9
19. Šošić-Jurjević B, Lütjohann D, Renko K, Filipović B, Radulović N, Ajdžanović V. et al. The isoflavones genistein and daidzein increase hepatic concentration of thyroid hormones and affect cholesterol metabolism in middle-aged male rats. J Steroid Biochem Mol Biol. 2019;190:1-10
20. Mackay DS, Jones PJH, Myrie SB, Plat J, Lütjohann D. Methodological considerations for the harmonization of non-cholesterol sterol bio-analysis. J Chromatogr B Analyt Technol Biomed Life Sci. 2014;957:116-22
21. Sapcariu SC, Kanashova T, Weindl D, Ghelfi J, Dittmar G, Hiller K. Simultaneous extraction of proteins and metabolites from cells in culture. MethodsX. 2014;1:74-80
22. Hiller K, Hangebrauk J, Jäger C, Spura J, Schreiber K, Schomburg D. MetaboliteDetector: comprehensive analysis tool for targeted and nontargeted GC/MS based metabolome analysis. Anal Chem. 2009;81(9):3429-39
23. Kumar S, Xie H, Scicluna P, Lee L, Björnhagen V, Höög A. et al. MiR-375 Regulation of LDHB Plays Distinct Roles in Polyomavirus-Positive and -Negative Merkel Cell Carcinoma. Cancers (Basel). 2018 10(11)
24. Kinoshita T, Nohata N, Yoshino H, Hanazawa T, Kikkawa N, Fujimura L. et al. Tumor suppressive microRNA-375 regulates lactate dehydrogenase B in maxillary sinus squamous cell carcinoma. Int J Oncol. 2012;40(1):185-93
25. Krol J, Loedige I, Filipowicz W. The widespread regulation of microRNA biogenesis, function and decay. Nat Rev Genet. 2010;11(9):597-610
26. Cui J, Quan M, Jiang W, Hu H, Jiao F, Li N. et al. Suppressed expression of LDHB promotes pancreatic cancer progression via inducing glycolytic phenotype. Med Oncol. 2015;32(5):143
27. Arts RJW, Plantinga TS, Tuit S, Ulas T, Heinhuis B, Tesselaar M. et al. Transcriptional and metabolic reprogramming induce an inflammatory phenotype in non-medullary thyroid carcinoma-induced macrophages. Oncoimmunology. 2016;5(12):e1229725
28. Di Liu, Chang C, Lu N, Wang X, Lu Q, Ren X. et al. Comprehensive Proteomics Analysis Reveals Metabolic Reprogramming of Tumor-Associated Macrophages Stimulated by the Tumor Microenvironment. J Proteome Res. 2017;16(1):288-97
29. Lin S, Sun L, Lyu X, Ai X, Du D, Su N. et al. Lactate-activated macrophages induced aerobic glycolysis and epithelial-mesenchymal transition in breast cancer by regulation of CCL5-CCR5 axis: a positive metabolic feedback loop. Oncotarget. 2017;8(66):110426-43
30. Penny HL, Sieow JL, Adriani G, Yeap WH, See Chi Ee P, San Luis B. et al. Warburg metabolism in tumor-conditioned macrophages promotes metastasis in human pancreatic ductal adenocarcinoma. Oncoimmunology. 2016;5(8):e1191731
31. Zhou J, Song S, He S, Zhu X, Zhang Y, Yi B. et al. MicroRNA-375 targets PDK1 in pancreatic carcinoma and suppresses cell growth through the Akt signaling pathway. Int J Mol Med. 2014;33(4):950-6
32. Vander Heiden MG, Cantley LC, Thompson CB. Understanding the Warburg effect: the metabolic requirements of cell proliferation. Science. 2009;324(5930):1029-33
33. Contreras-Baeza Y, Sandoval PY, Alarcón R, Galaz A, Cortés-Molina F, Alegría K. et al. Monocarboxylate transporter 4 (MCT4) is a high affinity transporter capable of exporting lactate in high-lactate microenvironments. J Biol Chem. 2019;294(52):20135-47
34. Halestrap AP, Wilson MC. The monocarboxylate transporter family-role and regulation. IUBMB Life. 2012;64(2):109-19
35. Jha AK, Huang SC-C, Sergushichev A, Lampropoulou V, Ivanova Y, Loginicheva E. et al. Network integration of parallel metabolic and transcriptional data reveals metabolic modules that regulate macrophage polarization. Immunity. 2015;42(3):419-30
36. Tannahill GM, Curtis AM, Adamik J, Palsson-McDermott EM, McGettrick AF, Goel G. et al. Succinate is an inflammatory signal that induces IL-1β through HIF-1α. Nature. 2013;496(7444):238-42
37. Rabold K, Netea MG, Adema GJ, Netea-Maier RT. Cellular metabolism of tumor-associated macrophages - functional impact and consequences. FEBS Lett. 2017;591(19):3022-41
38. Cordes T, Wallace M, Michelucci A, Divakaruni AS, Sapcariu SC, Sousa C. et al. Immunoresponsive Gene 1 and Itaconate Inhibit Succinate Dehydrogenase to Modulate Intracellular Succinate Levels. J Biol Chem. 2016;291(27):14274-84
39. Meiser J, Krämer L, Sapcariu SC, Battello N, Ghelfi J, D'Herouel AF. et al. Pro-inflammatory Macrophages Sustain Pyruvate Oxidation through Pyruvate Dehydrogenase for the Synthesis of Itaconate and to Enable Cytokine Expression. J Biol Chem. 2016;291(8):3932-46
40. Shime H, Yabu M, Akazawa T, Kodama K, Matsumoto M, Seya T. et al. Tumor-secreted lactic acid promotes IL-23/IL-17 proinflammatory pathway. J Immunol. 2008;180(11):7175-83
41. Dimmer KS, Friedrich B, Lang F, Deitmer JW, Bröer S. The low-affinity monocarboxylate transporter MCT4 is adapted to the export of lactate in highly glycolytic cells. Biochem J. 2000;350(Pt 1):219-27
42. Brooks GA. The Science and Translation of Lactate Shuttle Theory. Cell Metab. 2018;27(4):757-85
43. Hui S, Ghergurovich JM, Morscher RJ, Jang C, Teng X, Lu W. et al. Glucose feeds the TCA cycle via circulating lactate. Nature. 2017;551(7678):115-8
44. Sonveaux P, Végran F, Schroeder T, Wergin MC, Verrax J, Rabbani ZN. et al. Targeting lactate-fueled respiration selectively kills hypoxic tumor cells in mice. J Clin Invest. 2008;118(12):3930-42
45. Chen P, Zuo H, Xiong H, Kolar MJ, Chu Q, Saghatelian A. et al. Gpr132 sensing of lactate mediates tumor-macrophage interplay to promote breast cancer metastasis. Proc Natl Acad Sci U S A. 2017;114(3):580-5
46. Goossens P, Rodriguez-Vita J, Etzerodt A, Masse M, Rastoin O, Gouirand V. et al. Membrane Cholesterol Efflux Drives Tumor-Associated Macrophage Reprogramming and Tumor Progression. Cell Metab. 2019;29(6):1376-1389.e4
47. Guillaumond F, Bidaut G, Ouaissi M, Servais S, Gouirand V, Olivares O. et al. Cholesterol uptake disruption, in association with chemotherapy, is a promising combined metabolic therapy for pancreatic adenocarcinoma. Proc Natl Acad Sci U S A. 2015;112(8):2473-8
48. Kondo A, Yamamoto S, Nakaki R, Shimamura T, Hamakubo T, Sakai J. et al. Extracellular Acidic pH Activates the Sterol Regulatory Element-Binding Protein 2 to Promote Tumor Progression. Cell Rep. 2017;18(9):2228-42
49. Brown MS, Goldstein JL. The SREBP Pathway: Regulation of Cholesterol Metabolism by Proteolysis of a Membrane-Bound Transcription Factor. Cell. 1997;89(3):331-40
50. Horton JD, Goldstein JL, Brown MS. SREBPs: activators of the complete program of cholesterol and fatty acid synthesis in the liver. J Clin Invest. 2002;109(9):1125-31
51. Bengoechea-Alonso MT, Ericsson J. SREBP in signal transduction: cholesterol metabolism and beyond. Curr Opin Cell Biol. 2007;19(2):215-22
52. Goldstein JL, DeBose-Boyd RA, Brown MS. Protein sensors for membrane sterols. Cell. 2006;124(1):35-46
53. Alberts AW. Lovastatin and simvastatin-inhibitors of HMG CoA reductase and cholesterol biosynthesis. Cardiology. 1990;77(Suppl 4):14-21
54. Kuzu OF, Noory MA, Robertson GP. The Role of Cholesterol in Cancer. Cancer Res. 2016;76(8):2063-70
55. Badana AK, Chintala M, Gavara MM, Naik S, Kumari S, Kappala VR. et al. Lipid rafts disruption induces apoptosis by attenuating expression of LRP6 and survivin in triple negative breast cancer. Biomed Pharmacother. 2018;97:359-68
56. Li YC, Park MJ, Ye S-K, Kim C-W, Kim Y-N. Elevated levels of cholesterol-rich lipid rafts in cancer cells are correlated with apoptosis sensitivity induced by cholesterol-depleting agents. Am J Pathol. 2006;168(4):1107-18 quiz 1404-5
57. Leiblich A, Cross SS, Catto JWF, Phillips JT, Leung HY, Hamdy FC. et al. Lactate dehydrogenase-B is silenced by promoter hypermethylation in human prostate cancer. Oncogene. 2006;25(20):2953-60
58. Maekawa M, Taniguchi T, Ishikawa J, Sugimura H, Sugano K, Kanno T. Promoter hypermethylation in cancer silences LDHB, eliminating lactate dehydrogenase isoenzymes 1-4. Clin Chem. 2003;49(9):1518-20
59. Brown NJ, Higham SE, Perunovic B, Arafa M, Balasubramanian S, Rehman I. Lactate dehydrogenase-B is silenced by promoter methylation in a high frequency of human breast cancers. PLoS ONE. 2013;8(2):e57697
60. Chen R, Zhou X, Yu Z, Liu J, Huang G. Low Expression of LDHB Correlates With Unfavorable Survival in Hepatocellular Carcinoma: Strobe-Compliant Article. Medicine (Baltimore). 2015;94(39):e1583
61. Liao AC, Li C-F, Shen K-H, Chien L-H, Huang H-Y, Wu T-F. Loss of lactate dehydrogenase B subunit expression is correlated with tumour progression and independently predicts inferior disease-specific survival in urinary bladder urothelial carcinoma. Pathology. 2011;43(7):707-12
62. Pinheiro C, Reis RM, Ricardo S, Longatto-Filho A, Schmitt F, Baltazar F. Expression of monocarboxylate transporters 1, 2, and 4 in human tumours and their association with CD147 and CD44. J Biomed Biotechnol. 2010;2010:427694
63. Tanner LB, Goglia AG, Wei MH, Sehgal T, Parsons LR, Park JO. et al. Four Key Steps Control Glycolytic Flux in Mammalian Cells. Cell Syst. 2018;7(1):49-62.e8
64. Chen F, Chen J, Yang L, Liu J, Zhang X, Zhang Y. et al. Extracellular vesicle-packaged HIF-1α-stabilizing lncRNA from tumour-associated macrophages regulates aerobic glycolysis of breast cancer cells. Nat Cell Biol. 2019;21(4):498-510
65. Guppy M, Leedman P, Zu X, Russell V. Contribution by different fuels and metabolic pathways to the total ATP turnover of proliferating MCF-7 breast cancer cells. Biochem J. 2002;364(Pt 1):309-15
66. Cui B, Luo Y, Tian P, Peng F, Lu J, Yang Y. et al. Stress-induced epinephrine enhances lactate dehydrogenase A and promotes breast cancer stem-like cells. J Clin Invest. 2019;129(3):1030-46
67. Kennedy KM, Scarbrough PM, Ribeiro A, Richardson R, Yuan H, Sonveaux P. et al. Catabolism of exogenous lactate reveals it as a legitimate metabolic substrate in breast cancer. PLoS ONE. 2013;8(9):e75154
68. Park S, Chang C-Y, Safi R, Liu X, Baldi R, Jasper JS. et al. ERRα-Regulated Lactate Metabolism Contributes to Resistance to Targeted Therapies in Breast Cancer. Cell Rep. 2016;15(2):323-35
69. Leithner K, Hrzenjak A, Trötzmüller M, Moustafa T, Köfeler HC, Wohlkoenig C. et al. PCK2 activation mediates an adaptive response to glucose depletion in lung cancer. Oncogene. 2015;34(8):1044-50
70. Damaghi M, Wojtkowiak JW, Gillies RJ. pH sensing and regulation in cancer. Front Physiol. 2013;4:370
71. Srivastava J, Barber DL, Jacobson MP. Intracellular pH sensors: design principles and functional significance. Physiology (Bethesda). 2007;22:30-9
72. Kim J-G, Yoon S-K, Sohn Y, Kang J-G. Luminescence and crystal field parameters of the Na3[Eu(DPA)3]·12H2O complex in a single crystalline state. Journal of Alloys and Compounds. 1998;274(1-2):1-9
73. Haskins JW, Zhang S, Means RE, Kelleher JK, Cline GW, Canfrán-Duque A. et al. Neuregulin-activated ERBB4 induces the SREBP-2 cholesterol biosynthetic pathway and increases low-density lipoprotein uptake. Sci Signal. 2015;8(401):ra111
74. Jie Z, Xie Z, Xu W, Zhao X, Jin G, Sun X. et al. SREBP-2 aggravates breast cancer associated osteolysis by promoting osteoclastogenesis and breast cancer metastasis. Biochim Biophys Acta Mol Basis Dis. 2019;1865(1):115-25
75. Li X, Wu JB, Li Q, Shigemura K, Chung LWK, Huang W-C. SREBP-2 promotes stem cell-like properties and metastasis by transcriptional activation of c-Myc in prostate cancer. Oncotarget. 2016;7(11):12869-84
76. Wen Y-A, Xiong X, Zaytseva YY, Napier DL, Vallee E, Li AT. et al. Downregulation of SREBP inhibits tumor growth and initiation by altering cellular metabolism in colon cancer. Cell Death Dis. 2018;9(3):265
77. SIPERSTEIN MD, GUEST MJ. Studies on the site of the feedback control of cholesterol synthesis. J Clin Invest. 1960;39:642-52
78. Li C, Yang L, Zhang D, Jiang W. Systematic review and meta-analysis suggest that dietary cholesterol intake increases risk of breast cancer. Nutr Res. 2016;36(7):627-35
79. Llaverias G, Danilo C, Mercier I, Daumer K, Capozza F, Williams TM. et al. Role of cholesterol in the development and progression of breast cancer. Am J Pathol. 2011;178(1):402-12
80. Coogan PF, Rosenberg L, Palmer JR, Strom BL, Zauber AG, Shapiro S. Statin use and the risk of breast and prostate cancer. Epidemiology. 2002;13(3):262-7
81. O'Neill LAJ, Kishton RJ, Rathmell J. A guide to immunometabolism for immunologists. Nat Rev Immunol. 2016;16(9):553-65
82. Hay N. Reprogramming glucose metabolism in cancer: can it be exploited for cancer therapy? Nat Rev Cancer. 2016;16(10):635-49
83. Klement RJ, Kämmerer U. Is there a role for carbohydrate restriction in the treatment and prevention of cancer? Nutr Metab (Lond). 2011;8:75
84. Wheeler LA, Trifonova R, Vrbanac V, Basar E, McKernan S, Xu Z. et al. Inhibition of HIV transmission in human cervicovaginal explants and humanized mice using CD4 aptamer-siRNA chimeras. J Clin Invest. 2011;121(6):2401-12
85. Lieberman J. Manipulating the in vivo immune response by targeted gene knockdown. Curr Opin Immunol. 2015;35:63-72
86. Feng J-L, Qin X. Does adherence to lipid-lowering medications improve cancer survival? A nationwide study of breast and colorectal cancer, and melanoma. Br J Clin Pharmacol. 2020
87. Baek AE, Yu Y-RA, He S, Wardell SE, Chang C-Y, Kwon S. et al. The cholesterol metabolite 27 hydroxycholesterol facilitates breast cancer metastasis through its actions on immune cells. Nat Commun. 2017;8(1):864
Author contact
![]() Corresponding authors: b.brueneuni-frankfurt.de (B.B), Phone: +49-69-6301-7423; syeduni-frankfurt.de (S.N.S)
Corresponding authors: b.brueneuni-frankfurt.de (B.B), Phone: +49-69-6301-7423; syeduni-frankfurt.de (S.N.S)