Impact Factor
- Issue 14; 2026
- Issue 13; 2026
- Issue 12; 2026
- Issue 11; 2026
- Issue 10; 2026
- Volume 16; 2026
- Advance Articles
- Past Issues
- Cover Images
- Cover Suggestion
- Index & Coverage
- Special Issues
Introduction
Materials and Methods
Results
Discussion
Abbreviations
Supplementary Material
Acknowledgements
References
International Journal of Biological Sciences
International Journal of Medical Sciences
 Global reach, higher impact

Theranostics 2021; 11(13):6214-6224. doi:10.7150/thno.55676 This issue Cite
Research Paper
A panel of selected serum protein biomarkers for the detection of aggressive prostate cancer
Jin Song1*, Shiyong Ma1*, Lori J. Sokoll1,2,3, Rodrigo V. Eguez1, Naseruddin Höti1, Hui Zhang1,2, Phaedre Mohr1, Renu Dua1, Dattatraya Patil5, Kristen Douglas May5, Sierra Williams5, Rebecca Arnold5, Martin G. Sanda5, Daniel W. Chan1,2,3,4 ![]() , Zhen Zhang1,2
, Zhen Zhang1,2 ![]()
1. Center for Biomarker Discovery and Translation, Department of Pathology, Johns Hopkins University School of Medicine, Baltimore, MD, 21287, USA.
2. Department of Oncology, Johns Hopkins University School of Medicine, Baltimore, MD, 21287, USA.
3. Department of Urology, Johns Hopkins University School of Medicine, Baltimore, MD, 21287, USA.
4. Department of Radiology, Johns Hopkins University School of Medicine, Baltimore, MD, 21287, USA.
5. Department of Urology, Emory University School of Medicine, Atlanta, GA, 30322, USA.
*These authors contributed equally to this work.
Received 2020-11-9; Accepted 2021-2-5; Published 2021-4-15
Abstract

Background: Current PSA-based tests used to detect prostate cancer (PCa) lack sufficient specificity, leading to significant overdetection and overtreatment. Our previous studies showed that serum fucosylated PSA (Fuc-PSA) and soluble TEK receptor tyrosine kinase (Tie-2) had the ability to predict aggressive (AG) PCa. Additional biomarkers are needed to address this significant clinical problem.
Methods: A comprehensive Pubmed search followed by multiplex immunoassays identified candidate biomarkers associated with AG PCa. Subsequently, multiplex and lectin-based immunoassays were applied to a case-control set of sera from subjects with AG PCa, low risk PCa, and non-PCa (biopsy negative). These candidate biomarkers were further evaluated for their ability as panels to complement the prostate health index (phi) in detecting AG PCa.
Results: When combined through logistic regression, two panel of biomarkers achieved the best performance: 1) phi, Fuc-PSA, SDC1, and GDF-15 for the detection of AG from low risk PCa and 2) phi, Fuc-PSA, SDC1, and Tie-2 for the detection of AG from low risk PCa and non-PCa, with noticeable improvements in ROC analysis over phi alone (AUCs: 0.942 vs 0.872, and 0.934 vs 0.898, respectively). At a fixed sensitivity of 95%, the panels improved specificity with statistical significance in detecting AG from low risk PCa (76.0% vs 56%, p=0.029), and from low risk PCa and non-PCa (78.2% vs 65.5%, p=0.010).
Conclusions: Multivariate panels of serum biomarkers identified in this study demonstrated clinically meaningful improvement over the performance of phi, and warrant further clinical validation, which may contribute to the management of PCa.
Keywords: prostate, prostate neoplasms, prostate-specific antigen, biomarker, aggressive
Introduction
Prostate cancer (PCa) is the most common non-cutaneous solid tumor in men and has a high prevalence among men aged 50 years and above in the United States. In 2021, new cases are estimated at 248,530 with approximately 34,130 deaths [1]. The serum test for prostate-specific antigen (PSA) was developed and approved by the Food and Drug Administration (FDA) for prostate cancer over 30 years ago [2]. While PSA has become a routine clinical test, PSA screening has garnered substantial criticism in recent years due to the potential for overdetection and overtreatment of PCa. In particular, recommendations by the United States Preventive Services Task Force (USPSTF) [3] have generated significant debate regarding PSA-based screening. Biopsies trigged by a marginally elevated serum PSA level or other reason will likely result in a significant number of biopsy-positive cases for whom the majority will have low risk disease that may not require active clinical intervention. Overtreatment could be mitigated with a diagnostic test capable of identifying aggressive (AG) PCa prior to biopsy. While there is no consensus on the definition of “aggressiveness,” it is generally agreed that Gleason score (GS) is likely the best indicator. In general, higher GSs are associated with more aggressive PCa defined in terms of disease-free survival [4, 5]. The most widely accepted histological cutoff for PCa is GS 7. When the GS is 7 or higher, the tumor is considered “aggressive”.
The goal of this study was to identify and combine serum proteomic biomarkers into a panel for distinguishing AG PCa from low risk cancer. Two biomarkers, fucosylated PSA (Fuc-PSA) and soluble TEK receptor tyrosine kinase (Tie-2), were discovered in our previous Early Detection Research Network (EDRN) studies with demonstrated ability to predict AG PCa [6-8]. Fucosylated proteins have been found to be associated with cancer and potentially used as tumor markers [9-11]. An example is the fucosylated alpha-fetoprotein (AFP-L3), an FDA cleared diagnostic test for assessing the risk of developing hepatocellular carcinoma [12, 13]. We developed quantitative lectin-based immunoassays for serum Fuc-PSA and demonstrated that Fuc-PSA could be an effective biomarker to detect AG PCa [7, 8]. Serum angiogenic factors are potential candidates for prognostic biomarkers in PCa [14, 15]. Tie-2 is a transmembrane tyrosine kinase receptor for angiopoietins and is crucial for angiogenesis and vascular maintenance [16, 17]. We previously demonstrated that serum levels of Tie-2 were elevated in PCa patients with GS 8-10 [6]. In this study, we evaluated whether combinations of Fuc-PSA, Tie-2, and/or other selected biomarkers from an expanded list of candidates combined with current FDA approved PSA-based test modalities, specifically, prostate health index (phi) [18], could improve their diagnostic ability for the detection of AG PCa.
Materials and Methods
Study Design
We performed a comprehensive literature search and identified 22 additional candidate biomarkers reported to be associated with AG PCa. We tested these 22 candidates with multiplex immunoassays in a well-characterized in-house clinical sample set. Based on bootstrap area-under-curve (AUC) analysis, the list was reduced to the 10 best performing biomarkers with respect to the combined criteria of a relatively high AUC mean and a relatively low AUC standard deviation (STD) in separating low risk versus AG PCa. In this study, using a case-control sample set, we evaluated whether these 10 biomarkers as well as Tie-2 and Fuc-PSA in combined use with current FDA approved PSA-based test modalities, specifically, prostate health index (phi) [18], could further improve the detection of AG PCa.
Specimens
Specimens for this study were collected at Beth Israel Deaconess Hospital, Harvard Medical School from 2005 to 2008 as part of the prospective EDRN Clinical Validation Center cohort [19]. Eligibility for the EDRN cohort included patient age greater than 40 years, no prior prostate surgery, biopsy or history of PCa, availability of serum samples with corresponding clinical data, and completion of biopsy under transrectal ultrasound guidance using a standard template after enrolment. Serum samples were collected prior to initial biopsy and stored at -80 ºC until analysis. Serum samples obtained from 90 patients, including 60 patients with histologically diagnosed PCa and 30 biopsy negative controls were included in this study with institutional approval. For the current study, GS was used as a surrogate for PCa aggressiveness. Consistent with the majority view in the literature [4, 5, 20], a tumor with a GS 7 or greater was considered as AG PCa and GS 6 or less as low risk PCa.
Reagents
Human Magnetic Luminex Assays (LXSAHM-15, LXSAHM-08, and LXSAHM-02) were purchased from R&D Systems (Minneapolis, MN). Magnetic COOH beads, amine coupling kits, and Bio-Plex Pro Reagent kits were purchased from Bio-Rad Laboratories (Hercules, CA). NHS and Sulfo-NHS, EDC, EZ-LinkTM Sulfo-NHS-Biotin, and ZebaTM Spin Desalting Columns were purchased from Thermo Scientific (Rockford, IL). Agarose bound Aleuria Aurantia Lectin (AAL) was purchased from Vector Laboratories (Burlingame, CA). Pierce™ BCA Protein Assay Kit was purchased from Thermo Fisher Scientific (Waltham, MA).
Multiplex immunoassays
Human Magnetic Luminex Assays were performed following the manufacturer's protocols on the Bio-Plex 200 system. Samples were diluted 1:2 (the initial 15-plex and the finalized 8-plex assays) or 1:50 (2-plex assay) in the calibrator diluent. Calibration curves were established using 7 calibrators in a 3-fold dilution series in the calibrator diluent derived from a mixture of the highest standard points of multiple recombinant proteins. The highest standards were 215.8, 883.2, 4.8, 25.6, 63.4, 1977.9, 169.7, and 10.3 ng/mL for CD276 molecule (B7-H3), phospholipase A2 group VII (PLA2G7), growth differentiation factor 15 (GDF-15), interleukin-6 receptor subunit alpha (IL-6 R alpha), Syndecan-1 (SDC1), vascular cell adhesion molecule 1 (VCAM-1), TEK receptor tyrosine kinase (Tie-2), and interleukin 16 (IL-16), respectively (8-plex); 40 U/mL and 57.2 ng/mL for cancer antigen (CA 15-3) and matrix metallopeptidase (MMP-2), respectively (2-plex). Heat shock 27 kDa protein (HSP27) assay (1-plex) was carried out with the sample diluted 1:4 in the standard diluent, and the calibration curve was established using 7 calibrators in 2.5-fold dilution series in the standard diluent. The highest standard of the recombinant protein in the assay was 3.0 ng/mL. Immunoassays were performed in duplicate on 96-well Bio-Plex flat bottom plates. All samples were randomized with respect to their plate locations.
Calibration curves were constructed with Bio-Plex Manager Software version 6.1.1 using a 5-parametric (5-PL) nonlinear logistic regression curve fitting model. Assay sensitivity (limit of blank, LOB) was defined as the concentration of analyte corresponding to the median fluorescent intensity (MFI) of the background plus two STDs of the mean background MFI. Intra-assay precision was calculated as the coefficient of variance (%CV) on 4 replicates of pooled normal sera (S7023 from Sigma-Aldrich) on a single assay plate. Inter-assay precision was calculated as the %CV from 3 replicates. The assay working dynamic range was defined as the range between the lower limit of quantification (LLOQ) and the upper limit of quantification (ULOQ) in which an assay is both precise (intra-assay %CV ≤10% and inter-assay %CV ≤15%) and accurate (80-120% recovery).
Fucosylated PSA
Lectin-based immunoassays for Fuc-PSA to detect AG PCa were developed and described previously [8]. In this study, we used agarose bound AAL beads to enrich Fucosylated proteins from patient sera then tested PSA with the Hybritech PSA assay on the Access 2 Immunoassay Analyzer (Beckman Coulter, Inc.) [8, 18].
PSA and phi analysis
Serum samples were analyzed for total PSA, free PSA (fPSA), and [-2]proPSA (p2PSA) [18, 21] on the Access 2 Immunoassay Analyzer (Beckman Coulter, Inc). Prostate health index (phi) was calculated with the equation, (p2PSA/fPSA) × PSA1/2.
Statistical Analysis
Biomarker data were transformed prior to analysis (log-transformation followed by z-score). To correct for an observed batch-effect in Fuc-PSA measurement, z-scores of log-transformed Fuc-PSA data were computed separately for each of the two batches before being merged together. Scatterplots of the Fuc-PSA values before and after correction against total PSA, which was not affected by the batches, confirmed negligible residual differences (Figure S1). Furthermore, as shown in the same plots, with block-randomization of samples, the distribution of samples between the batches did not confound the sample clinical phenotype.
Diagnostic performance of individual biomarkers to differentiate AG from low risk PCa, and AG from low risk PCa and non-PCa were evaluated first by univariate analysis based on estimated AUCs from receiver-operating characteristic (ROC) curve analysis. To evaluate the statistical stability of results, bootstrap resampling (n = 1,000) [19, 22, 23] was used to estimate the mean and STD of AUCs of individual biomarkers.
Multivariate analyses were further carried out to evaluate the complementary values of biomarkers to established clinical test modalities with respect to the detection of AG PCa. With the limited number of available samples, we chose to evaluate only linear combinations using logistic regression of up to three novel markers with the clinical test phi and to identify panels of biomarkers with the greatest improvement in ROC/AUC over that of phi alone. This was done for both the detection of AG from low risk PCa, and from low risk PCa and non-PCa. In addition, we also specifically evaluated the value of Fuc-PSA in complementing phi as a two-marker panel. Bootstrap resampling was used to estimate 95% confidence intervals of ROC/AUCs.
Considering the potential clinical utility of a test to separate AG from low risk PCa (and/or non-PCa,), a very high sensitivity will likely be required to achieve a clinically acceptable negative predictive value for patient safety. For the identified multivariate panels, we therefore further assessed improvement in specificity at a fixed high level of sensitivity.
Differences between groups were assessed using the Mann-Whitney U test. Statistical significance was considered at p<0.05. Statistica 13 (StatSoft), GraphPad Prism 6 (GraphPad Software), MedCalc (MedCalc Software, Ostend, Belgium), and inhouse-developed Python scripts using library functions from matplotlib (2.2.3), NumPy (1.16.5), pandas (0.24.2), seaborn (0.9.0), scikit-learn (1.16.5) and SciPy (1.2.1) were used for statistical analyses. Other than specifically indicated, confidence intervals (CI) of AUCs and other performance measurement were based on bootstrap estimation.
Results
Patient characteristics
A total of 90 patients including 60 PCa cases and 30 non-PCa controls were included in this study. Among the PCa cases, 30 were biopsy GS ≤ 6 and the other 30 were GS ≥ 7. The non-PCa patients were biopsy negative controls. Among all the samples, one case was excluded due to a specimen quality issue. Of the remaining 89 samples, 7 had no PSA-related assay data and 2 had no Fuc-PSA data due to insufficient quantity for measurement. Consequently, other than the tabulated descriptive statistics and scatterplots of the individual biomarkers with the 89 samples, all statistical analyses were performed using 80 samples (25 AG and 25 low risk PCa, and 30 non-PCa) that had no missing data across all biomarkers.
Following an extended-pattern prostate biopsy schema [19], 98.8% of 80 patients underwent 12-core or greater biopsy with a median (range) number of 12 (8 to 20). Among 19 cases that went on to prostatectomy and had available pathologic GS, there were 3 cases with GS 6 upgraded to GS 7, and 3 with GS 8 and 1 with GS 9 downgraded to GS 7 on prostatectomy pathology. Detailed clinicopathologic characteristics of the study cohort, including diagnosis, age, race, family history of PCa, DRE (digital rectal examination), GS, clinical stage, PSA, %fPSA, and phi are shown in Table 1.
Clinicopathologic characteristics of the study cohort
| Non-PCa | Low Risk PCa (GS 6) | AG PCa (GS ≥7) | All PCa | AG PCa breakdown by GS | ||||
|---|---|---|---|---|---|---|---|---|
| GS 7 (3+4) | GS 7 (4+3) | GS 8 | GS 9 | |||||
| Subjects, n (%) | 30 (33.7) | 30 (50.8) | 29 (49.2)§ | 59 (66.3)§ | 4 (6.8) | 6 (10.2) | 9 (15.3)§ | 10 (16.9) |
| Age (y) | ||||||||
| mean ± SD | 63.2 ± 8.6 | 61.3 ± 8.3 | 67.8 ± 9.9 | 64.5 ± 9.6 | 61.3 ± 7.6 | 66.7 ± 8.2 | 70.6 ± 11.4 | 68.5 ± 10.3 |
| (range) | (43.0-80.0) | (46.0-77.0) | (51.0-93.0) | (46.0-93.0) | (51.0-69.0) | (56.0-77.0) | (51.0-93.0) | (55.0-87.0) |
| Race, n (%) | ||||||||
| White | 29 (96.7) | 25 (83.3) | 29 (100.0) | 54 (91.5) | 4 (100.0) | 6 (100.0) | 9 (100.0) | 10 (100.0) |
| Black | 0 (0.0) | 5 (16.7) | 0 (0.0) | 5 (8.5) | 0 (0.0) | 0 (0.0) | 0 (0.0) | 0 (0.0) |
| Asian | 1 (3.3) | 0 (0.0) | 0 (0.0) | 0 (0.0) | 0 (0.0) | 0 (0.0) | 0 (0.0) | 0 (0.0) |
| FHx of PCa, n (%) | ||||||||
| Yes | 8 (26.7) | 7 (23.3) | 11 (37.9) | 18 (30.5) | 3 (75.0) | 1 (16.7) | 3 (33.3) | 4 (40.0) |
| No | 22 (73.3) | 23 (76.7) | 18 (62.1) | 41 (69.55) | 1 (25.0) | 5 (83.3) | 6 (66.7) | 6 (60.0) |
| DRE, n (%) | ||||||||
| Abnormal | 14 (46.7) | 4 (13.3) | 11 (37.9) | 15 (25.4) | 0 (0.0) | 3 (50.0) | 2 (22.2) | 6 (60.0) |
| Enlarged | 0 (0.0) | 6 (20.0) | 4 (13.8) | 10 (17.0) | 0 (0.0) | 0 (0.0) | 2 (22.2) | 2 (20.0) |
| Normal | 16 (53.3) | 20 (66.7) | 14 (48.3) | 34 (57.6) | 4 (100.0) | 3 (50.0) | 5 (55.6) | 2 (20.0) |
| Clinical Stage (T) | ||||||||
| T1c/x | n/a | 27/0 (90.0) | 20/1 (72.4) | 47/1 (81.4) | 3/1 (100.0) | 2/0 (33.3) | 7/0 (77.8) | 8/0 (80.0) |
| T2a/b/c/x | n/a | 2/0/0/0 (6.7) | 4/1/1/1 (24.1) | 6/1/1/1 (15.3) | 0/0/0/0 (0.0) | 2/1/0/1 (66.7) | 2/0/0/0 (22.2) | 0/0/1/0 (10.0) |
| T3a | n/a | 1 (3.3) | 1 (3.5) | 2 (3.3) | 0 (0.0) | 0 (0.0) | 0 (0.0) | 1 (10.0) |
| PSA (ng/mL) | ||||||||
| mean ± SD | 5.58 ± 3.59 | 4.43 ± 1.92* | 9.15 ± 5.84†, # | 6.79 ± 4.92 | 7.43 ± 2.75 | 6.06 ± 2.11 | 12.48 ± 9.43† | 9.00 ± 2.02# |
| median | 4.97 | 4.58 | 7.98 | 5.79 | 6.67 | 5.99 | 11.35 | 9.17 |
| (range) | (0.47-18.44) | (0.41-9.01) | (0.85-30.98) | (0.41-30.98) | (5.14-11.24) | (3.59-9.70) | (0.85-30.98) | (6.24-12.14) |
| %fPSA | ||||||||
| mean ± SD | 20.19 ± 9.81 | 20.54 ± 8.56* | 14.69 ± 6.50†, # | 17.61 ± 8.08 | 15.91 ± 6.85 | 13.47 ± 5.89 | 16.00 ± 6.71† | 13.69 ± 7.46# |
| median | 17.7 | 18.56 | 15.68 | 17.1 | 16.25 | 13.26 | 16.4 | 12.57 |
| (range) | (5.66-43.80) | (8.64-51.34) | (3.63-25.52) | (3.63-51.34) | (7.21-23.93) | (6.34-21.46) | (5.34-23.86) | (3.63-25.52) |
| phi | ||||||||
| mean ± SD | 26.52 ± 11.23 | 31.30 ± 15.32* | 66.19 ± 41.59†, # | 48.74 ± 35.68 | 70.70 ± 49.18 | 52.35 ± 34.96 | 49.42 ± 9.61† | 91.08 ± 54.49# |
| median | 24.41 | 28.48 | 53.08 | 39.63 | 50.61 | 45.85 | 52.27 | 69.57 |
| (range) | (11.04-57.27) | (6.09-69.10) | (23.18-199.18) | (6.09-199.18) | (37.72-143.84) | (23.18-120.95) | (30.41-60.74) | (41.58-199.18) |
Note: PCa, prostate cancer. Non-PCa, biopsy negative; AG, aggressive; GS, Gleason score (biopsy); FHx, family history; DRE, digital rectal examination; phi, prostate health index. Median number of biopsy was 12 (range 8 to 20). PCa in 4 cases with GS 6 was upgraded on prostatectomy pathology. Original sample set n=90, one problematic sample with a specimen quality issue was omitted in estimation of descriptive analysis (§), additional missing data due to insufficient quantity for measurement were also indicated as *, #, and † for number of missing samples 4, 2, and 1, respectively.
Identification of biomarkers for multiplex immunoassay
In addition to evaluating two previously identified serum biomarkers (Fuc-PSA and Tie-2) [6-8], additional serum biomarkers with potential relevance to AG PCa were curated through a comprehensive literature search in PubMed. The inclusion of these biomarkers in our multiplex imunoassay panels took into consideration the reported clinically relevant performance characteristics and strength of evidence, biological feasibility supported by existing knowledge/databases such as results from large-scale genomic and proteomics analysis, ability to complement other biomarkers in the selection, their relative abundance in human serum samples, and the likelihood of available resources and constraints (antibodies, concentration in target specimens, etc.). Through in silico analysis, a total of 22 candidate biomarkers were selected to be assessed using a Bio-Plex 200 suspension array system (Bio-Rad) as described previously [24, 25] in 40 sera from patients diagnosed with AG or low risk PCa and benign prostate diseases, which were collected from JHH with institutional approval (data not shown). Ten candidate biomarkers (B7-H3, PLA2G7, GDF-15, IL-6 R alpha, SDC1, VCAM-1, IL-16, CA15-3, MMP-2 and HSP27) and one previously reported biomarker (Tie-2) were further evaluated using multiplex immunoassays in the 90 patient sera collected from Beth Israel Deaconess Hospital. The multiplex immunoassays had acceptable analytical performance with recoveries of 98% to 104%, intra-assay precision of 0.8% to 4.8%, inter-assay precision of 0.8% to 4.2%, wide dynamic concentration ranges (> 2 logs) defined by LLOQ and ULOQ, and low LOBs for target protein quantification (data not shown).
Univariate evaluation of biomarker selection
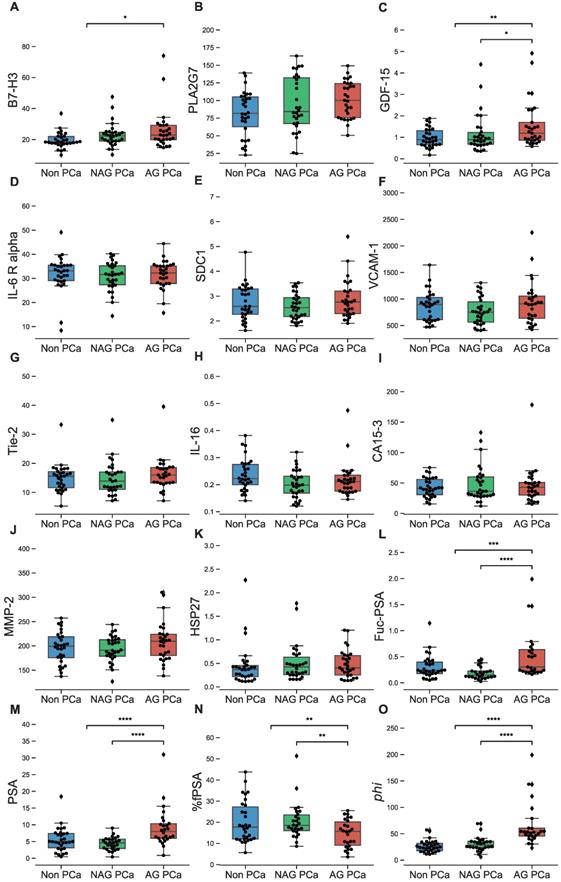
Serum concentrations of individual biomarkers were compared among AG and low risk PCa patients as well as non-PCa controls (Figure 1A-O and Table S1). Biomarkers that individually showed a statistically significant difference in serum levels between AG and low risk PCa patients included GDF-15 (p<0.01), %fPSA (p<0.05, lower in AG), and Fuc-PSA, PSA, and phi (all at p<0.0001). When comparing AG PCa to the combined group of low risk PCa and non-PCa, biomarkers with significant differences included B7-H3 (p<0.05), %fPSA (p<0.05, lower in AG), GDF-15 (p<0.01), Fuc-PSA (p<0.001), and PSA and phi (both at p<0.0001).
Analysis of biomarkers in sera from NAG (low risk/non-aggressive) and AG PCa patients as well as biopsy negative controls. A-O, B7-H3, PLA2G7, GDF-15, IL-6 R alpha, SDC1, VCAM-1, Tie-2, IL-16, CA15-3, MMP-2, HSP27, Fuc-PSA, PSA, %fPSA, and phi in NAG and AG PCa patients as well as biopsy negative controls (non-PCa) are demonstrated in overlaid scatterplots and boxplots. Only biomarkers demonstrating significant differences between AG and NAG PCa (or between AG and NAG + non-PCa) are shown with asterisks (Mann-Whitney U test). Bars in the boxes median value. *, P < 0.05; **, P < 0.01; ***, P < 0.001; ****, P < 0.0001.
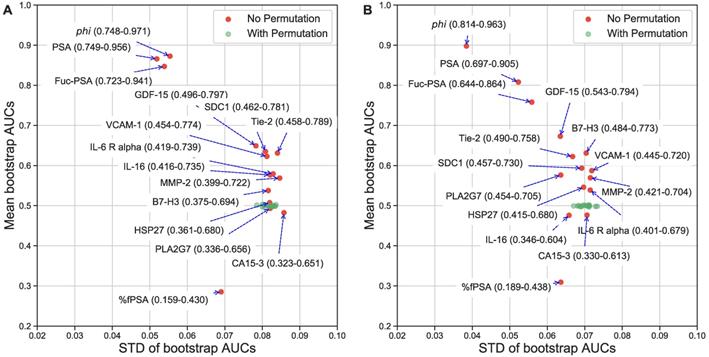
To provide a more clinically relevant comparison, the AUCs from ROC analysis were also estimated. The best biomarkers to separate AG from low risk PCa were phi (AUC=0.872), PSA (0.866), Fuc-PSA (0.848), %fPSA (0.714]), GDF-15 (0.651), SDC1 (0.637), Tie-2 (0.635), and VCAM-1 (0.626), and to separate AG from low risk PCa and non-PCa were phi (AUC=0.898), PSA (0.807), Fuc-PSA (0.757), %fPSA (0.691), GDF-15 (0.673), B7-H3 (0.630), Tie-2 (0.620), and SDC1 (0.593). To further evaluate the statistical stability of biomarker performance within this sample set, Figures 2A and 2B show the bootstrap estimated mean and STDs for the AUCs of individual biomarkers. PSA related assays, including phi, had the best and most stable diagnostic performance in this specific cohort of patient samples.
Univariate evaluation of serum biomarkers. Label permutation and bootstrap methods were used to evaluate statistical stability of the diagnostic performance of individual biomarkers in separating AG from NAG (low risk/non-aggressive) PCa (A) or NAG PCa and non-PCa (B). AUC means (95% CI) and STDs are presented.
Multivariate evaluation of biomarker complementarity
In order to depict the strengths and relative relationships among the multiple biomarkers with respect to their ability to separate AG from either low risk PCa only or from low risk PCa and non-PCa, the biomarker data were used unsupervised through principal component analysis (PCA) to generate biplots [26] (Figure S2) in which the contributions (loadings) of individual biomarkers to the first and second principal components (PCs) were represented as vectors superimposed on the PCA plot of individual patient samples. As expected, when PSA, %fPSA, Fuc-PSA, and phi were included with the other candidate biomarkers in PCA analysis, the AG samples were reasonably well separated from either low risk PCa only (Figure S2A) or from low risk PCa and non-PCa (Figure S2B). Interestingly, for this particular sample set, there was no obvious separation between the low risk PCa and non-PCa samples. In the bioplots, the loading vectors of several non-PSA related candidate biomarkers, such as Tie-2, GDF-15, SDC1, B7-H7, VCAM-1 as a cluster, were at angles to those of the PSA-based biomarkers yet still pointed to the direction that would complement the PSA-based biomarkers in separating AG PCa and low risk PCa or non-PCa samples, indicating potential complementary value to the PSA-related tests. When a similar analysis was performed without the PSA-related assays, the clinical groups overlapped significantly (Figures S2C-D), with B7-H3, SDC1, GDF-15, Tie-2, and VCAM-1 retaining some level of contribution towards the separation of AG PCa samples. Tabulated pair-wise scatterplots (Figure S3A-B) of these biomarkers and the PSA-related biomarkers (nine in total) offer visualization of potential pair-wise complementary relations or the lack thereof among them.
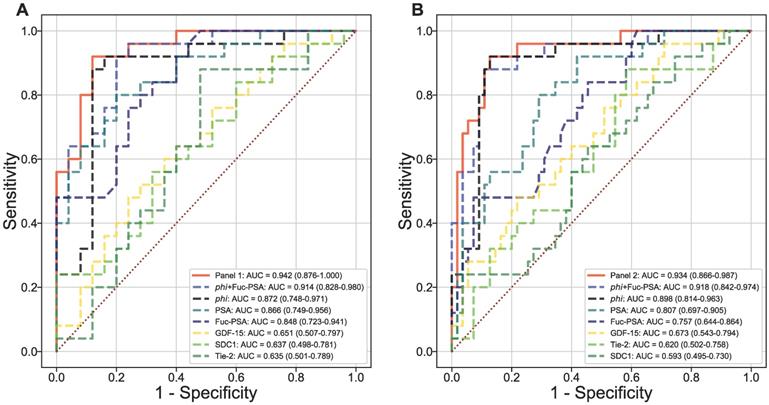
Using logistic regression, two panels were identified among all panels of up to 4 markers (including phi but excluding PSA and %fPSA) to offer the most improvement in ROC/AUC over that of phi alone in separating AG from low risk PCa (AUCphi+Fuc-PSA+SDC1+GDF-15 = 0.942 vs AUCphi = 0.872) or from low risk PCa and non-PCa (AUCphi+Fuc-PSA+SDC1+Tie-2 = 0.934 vs AUCphi = 0.898) (Figures 3A and 3B). In addition, the combination of phi and Fuc-PSA also improved the performance of phi in separating AG from low risk PCa (AUCphi+Fuc-PSA = 0.914) or from low risk and non-PCa (AUCphi+Fuc-PSA = 0.918). The improvement from these panels over phi were statistically significant comparing the means of bootstrap estimated AUCs (AUCphi+Fuc-PSA+SDC1+GDF-15 = 0.945 or AUCphi+Fuc-PSA = 0.916 vs AUCphi = 0.873, both p<0.0001 for AG vs low risk PCa; and AUCphi+Fuc-PSA+SDC1+Tie-2 = 0.936 or AUCphi+Fuc-PSA = 0.919 vs AUCphi = 0.898, both p<0.0001 for AG vs low risk PCa and non-PCa).
Multivariate evaluation of serum biomarkers. Diagnostic performance of combined serum biomarkers in separating AG from NAG (low risk/non-aggressive) PCa (A) or NAG PCa and non-PCa (B). ROC curves with AUCs are presented.
The biomarker panels improved the specificity of AG PCa detection
For clinical applications, a very high sensitivity is required for the detection of AG PCa. In Table 2, to detect AG PCa from low risk PCa at a fixed sensitivity of 95.0%, the specificity of the four-marker panel of phi, Fuc-PSA, SDC1, and GDF-15, and the combination of phi and Fuc-PSA both had a specificity of 76.0% in comparison to that of 56.0% for phi (p=0.029, and 0.013, respectively) and 44.0% for PSA alone. Similarly, to detect AG PCa from low risk PCa and non-PCa at the same 95.0% sensitivity, the specificity for the four-marker panel of phi, Fuc-PSA, SDC1, and Tie-2, and the same phi, Fuc-PSA combinations had a specificity of 78.2% and 69.1%, respectively vs 65.5% for phi (p=0.010, and 0.207, respectively) and 36.4% for PSA alone.
Biomarker panels improving the specificity of AG PCa detection
| AUC (95% CI) | SN (%) | SP (%) (p-value*) | True-Neg | True-Pos | False-Neg | False-Pos | |
|---|---|---|---|---|---|---|---|
| AG vs Low Risk PCa | |||||||
| Panel-1 | 0.942 (0.876-1.000) | 95.0 | 76.0 (0.029) | 19 | 24 | 1 | 6 |
| phi + Fuc-PSA | 0.914 (0.828-0.980) | 95.0 | 76.0 (0.013) | 19 | 24 | 1 | 6 |
| phi | 0.872 (0.748-0.971) | 95.0 | 56.0 | 14 | 24 | 1 | 11 |
| PSA | 0.866 (0.749-0.956) | 95.0 | 44.0 | 11 | 24 | 1 | 14 |
| AG vs Low Risk PCa & Non-PCa | |||||||
| Panel-2 | 0.934 (0.866-0.987) | 95.0 | 78.2 (0.010) | 43 | 24 | 1 | 12 |
| phi + Fuc-PSA | 0.918 (0.842-0.974) | 95.0 | 69.1 (0.207) | 38 | 24 | 1 | 17 |
| phi | 0.898 (0.814-0.963) | 95.0 | 65.5 | 36 | 24 | 1 | 19 |
| PSA | 0.807 (0.697-0.905) | 95.0 | 36.4 | 20 | 24 | 1 | 35 |
Note: PCa, prostate cancer; AG, aggressive PCa; Non-PCa, biopsy negative; Panel-1, phi + Fuc-PSA + SDC1 + GDF-15; Panel-2, phi + Fuc-PSA + SDC1 + Tie-2; AUC, area under curve; CI, confidence interval; SN, sensitivity; SP, specificity; Neg, negative; Pos, positive. *, one-sided paired test comparing specificity against phi.
Discussion
Serum PSA has been used as a sensitive marker for the detection of PCa, but it is not confined to PCa, elevated serum PSA levels have also been observed in benign prostatic hyperplasia (BPH) and prostatitis [27, 28]. Due to the potential for overdetection and overtreatment, PSA screening has caused controversy, posing a major challenge to the management of low-grade or low risk PCa [4]. Overdetection associated with PSA screening highlights the urgent need to identify more efficient biomarkers with improved specificity. Such novel biomarkers or sophisticated PSA derivative tests may address the clinical dilemma of differentiating AG from clinically indolent low risk PCa, and help physicians to select patients for biopsy. phi is one of tools approved by the FDA to improve the detection of PCa. Compared with PSA, phi, which incorporates PSA, p2PSA and fPSA in the equation, enhances the specificity of PCa detection [19, 29] and has also shown to be associated with AG PCa. In this study, consistent with our previous studies [7, 8], Fuc-PSA confirmed its ability to separate AG from either low risk PCa only or low risk PCa and non-PCa. Combining Fuc-PSA with phi improved the detection of AG PCa from either low risk PCa or low risk PCa and non-PCa, both with statistical significance in a bootstrap comparison of AUCs. Furthermore, two four-marker panels of phi, Fuc-PSA, SDC1, and GDF-15 or phi, Fuc-PSA, SDC1, and Tie-2 were identified with an even greater improved performance over phi individually to separate AG from either low risk PCa or low risk PCa and non-PCa with statistical significance. Clinically more relevant, compared with phi alone, the four-marker panels significantly improved the specificity of AG PCa detection. Improvement in specificity at a fixed 95% sensitivity was also observed comparing the combination of phi and Fuc-PSA with phi alone.
In this study, we further validated two serum biomarkers previously discovered from our EDRN BRL studies [6-8], Fuc-PSA and Tie-2, as effective biomarkers for the detection AG PCa either as individual biomarkers or used in combination with other biomarkers. In addition, we also demonstrated the potential diagnostic value of two serum biomarkers, SDC1 and GDF15, in two four-marker panels that separate AG from either low risk PCa only or low risk PCa and non-PCa patients. Compared with our previous studies [6-8], we expanded the evaluation of the diagnostic value of candidate biomarkers in detecting AG not only from low risk PCa only but also from low risk PCa and non-PCa cases. Our results, if validated in patient cohorts representative of intended populations, could have the potential as an in vitro diagnostic multivariate index assay (IVDMIA) to provide valuable clinical information to help detect AG PCa.
There are limitations to our analysis, as the sample size of the current study was not sufficient for separate independent evaluation. However, within this sample set, bootstrap resampling provides evidence of statistical stability of the observed improvement. Additional studies will be needed for validation and to test the generalizability of the improvement in performance in independent samples.
The results observed in this study are consistent with other reports showing that specific glycoforms of PSA can potentially be used as biomarkers, not only to improve the diagnostic accuracy of PCa, but also to detect AG tumors [30-33]. Changes in serum PSA sialylation have been reported in several studies [34-39], and specific increases in α2,3-sialic acid were observed in serum PSA in PCa patients compared with BPH and/or controls. In addition, increased core fucosylation of glycans has been detected in the serum of patients with PCa compared with healthy individuals or BPH [40, 41]. Previously, we developed multiplex immunoassays, based on AAL lectin affinity capturing and protein-antibody immunoreactivity, to analyze serum fucosylated glycoproteins in PCa patients [7]. Our data showed that Fuc-PSA was elevated and correlated with GS. Compared with total PSA, Fuc-PSA had better predictive ability to separate AG from low risk PCa. In addition, we previously developed two lectin-based immunoassays for the selection of glycoproteins containing fucosylated glycans using AAL and Lens culinaris agglutinin (LCA) followed by a clinical PSA immunoassay to analyze serum Fuc-PSA in PCa patients [8]. Our data suggested that Fuc-PSA-AAL, and Fuc-PSA-LCA levels may be effective biomarkers to separate AG [particularaly for GS ≥ 7 (4+3)] from low risk PCa. AAL binds both core fucosylation and terminal fucosylation (α1-2/α1-3 fucosylation). In this study, we used agarose bound AAL beads to enrich Fuc-PSA from patient sera, therefore, the observed diagnostic value of serum Fuc-PSA in the detection of AG PCa could be attributed to both core fucosylation and terminal fucosylation of PSA, even though it has been reported that PSA fucosylation mainly occurs in the core glycan structure [42-44]. Contrary to these results, Llop, et al reported that the core fucosylation level of serum PSA in high-risk PCa was significantly reduced compared to BPH and low-risk PCa, with an Enzyme-linked Lectin Assay (ELLA) including a double immunoprecipitation of serum PSA followed by Phliota squarrosa lectin (PhoSL) detection, which recognizes only core fucosylation [38]. Contradictory reports on the glycosylation patterns of serum PSA may be attributed to a number of reasons. First, compared with antibodies, the binding affinity of lectins are much lower, and the concentration of PSA in patients's sera is very low, which makes the analysis of serum PSA glycosylation patterns very challenging, thus limiting the development of reliable assays with enough sensitivity for its detection in a large number of patient samples. Second, the analysis of serum PSA glycosylation patterns may be influenced by the glycosylated component present in complexed as opposed to free PSA forms. Lectins can bind not only to glycans on the target glycoproteins, but also to glycans on background glycoproteins (including antibodies), resulting in high background signals. Third, target and background glycoproteins might not be equally fucosylated, and multi-step sample preparation for glycan analysis could reduce quantitative accuracy and limit the analysis of a large number of patient samples in clinical studies to generate statistically significant data [31, 45].
Tie-2 is a transmembrane tyrosine kinase receptor for angiopoietins and plays a critical role in vascular development. It has been found to regulate the stemness and metastatic properties of PCa cells [17], and inhibiting angiopoietin-2 activity impedes angiogenesis and growth of LuCaP 23.1 PCa xenografts [16]. Our previous study showed that the soluble Tie-2 levels in sera of PCa patients with GS of 8-10 were significantly increased, indicating that Tie-2 shedding might be related to the aggressiveness of PCa [6].
SDC1 is one of four structurally related cell surface heparan sulfate proteoglycans and plays a pivotal role in cell-cell and cell-extracellular matrix interactions [46]. A significant increase in soluble SDC1 serum levels has been observed in advanced PCa cases, suggesting that SDC1 shedding might be related to PCa progression [47]. In addition, elevated serum SDC1 was shown to be an independent factor in adverse overall and disease-specific survival in a multivariable pre-operative model, making evaluation of serum SDC1 levels a promising tool for pre-operative risk-stratification and/or therapy monitoring.
GDF-15, also known as macrophage inhibitory cytokine 1 (MIC-1), is a member of the transforming growth factor beta (TGF-ß) superfamily. It is synthesized as a 60-kDa dimer which is cleaved by furinlike proconvertases from its propeptide to release a 25-kDa mature protein [48]. Only processed mature GDF-15 diffuses into the circulation, while the unprocessed, propeptide-containing form is frequently secreted from tumor cells and remains localized in tissues due to strong matrix binding mediated by its propeptide [48]. Elevated serum GDF-15 levels have been found in many cancers, and shown to be a potentially valuable biomarker for cancer diagnosis and prognosis [25, 49, 50]. The diagnostic complementarity between serum GDF-15 and PSA and/or %fPSA in the detection of PCa from BPH has also been reported [49, 51, 52]. In this study, a significant increase in GDF-15 serum levels was observed in AG PCa cases compared with either low risk PCa or low risk PCa and non-PCa cases, which is consistent with the reports of elevated serum GDF15 in many cancers, including PCa [25, 49, 50]. Stephan et al, has found that the levels of serum GDF-15 in benign disease was higher than that in PCa [52], but increased serum GDF-15 concentration was strongly associated with advanced disease and progression of PCa [50]. Serum GDF-15 was found to be an independent marker of the presence of higher-grade (GS ≥ 7) tumors, which was not solely due to tumor burden. This observation is likely due to differences in processed GDF-15 or changed extracellular matrix properties [52].
Although the serum Tie-2 and SDC1 levels in patients with AG PCa were found to be elevated as compared to those with low risk PCa or low risk PCa and non-PCa, these differences were not statistically significant, likely due to the limited sample size. A logistic regression model was constructed to evaluate the ability of Fuc-PSA to further improve performance of phi. We then identified other contributing factors including SDC1, GDF-15, and/or Tie-2, and further evaluated the diagnostic performance of serum biomarker combinations in separating AG from low risk PCa only or low risk PCa and non-PCa cases. Compared with phi and PSA analysis, the multivariate panels showed clinically meaningful improvements. The selection of optimal panels through multivariate logistic regression allowed us to identify markers that are complementary in detecting AG PCa. However, to use these panels of serum protein biomarkers clinically as an IVDMIA assay, additional large-scale independent validation studies of these panels combined with other clinical and analytical parameters will be required. Recently, there has been an increased interest in the detection of tumor-specific molecular alternations by high-throughput screening - “omic” technologies. There are many promising biomarkers, including various tumor and serum proteins, microRNAs, as well as genetic markers that may be combined as diagnostic or prognostic indices [53].
In conclusion, through systematic proteomics analysis of multivariate combinations of serum biomarkers, we have identified panels of biomarkers that are potentially capable of detecting AG PCa, and demonstrated clinically meaningful improvement on the diagnostic performance of phi. It would be valuable to validate these panels in a large cohort of patient samples, because confounding factors such as age, body mass index (BMI), diabetes, and race may also affect the results. The multivariate combinations of serum biomarkers identified in this study warrant further clinical validation in a different and larger patient population, which could contribute to the clinical management of prostate cancer.
Abbreviations
AG: aggressive; CA15-3: cancer antigen 15-3; B7-H3: CD276 molecule; DRE: digital rectal examination; EDRN: Early Detection Research Network; fPSA: free PSA; Fuc-PSA: fucosylated PSA; GS: Gleason score; GDF-15: growth differentiation factor 15; HSP27: heat shock 27 kDa protein; IL-16: interleukin 16; IL-6 R alpha: interleukin-6 receptor subunit alpha; MMP-2: matrix metallopeptidase 2; NIH/NCI: National Institutes of Health/National Cancer Institute; NAG: non-aggressive; PLA2G7: phospholipase A2 group VII; PCa: prostate cancer; phi: Prostate Health Index; PSA: prostate-specific antigen; p2PSA: [-2]proPSA; SDC1: Syndecan-1; Tie-2: TEK receptor tyrosine kinase; VCAM-1: vascular cell adhesion molecule 1.
Supplementary Material
Supplementary figures and tables.
Acknowledgements
This research was partially supported by funding from the NIH/NCI Early Detection Research Network, U24 CA115102 (DWC), U01 CA113913 (MGS), U01 CA200469 (ZZ), and U01 CA152813 (HZ).
Competing Interests
The authors have declared that no competing interest exists.
References
1. Siegel RL, Miller KD, Fuchs HE, Jemal A. Cancer Statistics, 2021. CA Cancer J Clin. 2021;71:7-33
2. Chan DW, Bruzek DJ, Oesterling JE, Rock RC, Walsh PC. Prostate-specific antigen as a marker for prostatic cancer: a monoclonal and a polyclonal immunoassay compared. Clin Chem. 1987;33:1916-20
3. USPSTF Grossman DC, Curry SJ Owens DK, Bibbins-Domingo K Caughey AB. et al. Screening for Prostate Cancer: US Preventive Services Task Force Recommendation Statement. JAMA. 2018;319:1901-13
4. Berman DM, Epstein JI. When is prostate cancer really cancer? Urol Clin North Am. 2014;41:339-46
5. Pierorazio PM, Walsh PC, Partin AW, Epstein JI. Prognostic Gleason grade grouping: data based on the modified Gleason scoring system. BJU Int. 2013;111:753-60
6. Li D, Chiu H, Gupta V, Chan DW. Validation of a multiplex immunoassay for serum angiogenic factors as biomarkers for aggressive prostate cancer. Clin Chim Acta. 2012;413:1506-11
7. Li QK, Chen L, Ao MH, Chiu JH, Zhang Z, Zhang H. et al. Serum fucosylated prostate-specific antigen (PSA) improves the differentiation of aggressive from non-aggressive prostate cancers. Theranostics. 2015;5:267-76
8. Wang C, Hoti N, Lih TM, Sokoll LJ, Zhang R, Zhang Z. et al. Development of a glycoproteomic strategy to detect more aggressive prostate cancer using lectin-immunoassays for serum fucosylated PSA. Clin Proteomics. 2019;16:13
9. Hoti N, Lih TS, Pan J, Zhou Y, Yang G, Deng A. et al. A Comprehensive Analysis of FUT8 Overexpressing Prostate Cancer Cells Reveals the Role of EGFR in Castration Resistance. Cancers (Basel). 2020 12
10. Hoti N, Yang S, Hu Y, Shah P, Haffner MC, Zhang H. Overexpression of alpha (1,6) fucosyltransferase in the development of castration-resistant prostate cancer cells. Prostate Cancer Prostatic Dis. 2018;21:137-46
11. Wang X, Chen J, Li QK, Peskoe SB, Zhang B, Choi C. et al. Overexpression of alpha (1,6) fucosyltransferase associated with aggressive prostate cancer. Glycobiology. 2014;24:935-44
12. Li D, Satomura S. Biomarkers for Hepatocellular Carcinoma (HCC): An Update. Adv Exp Med Biol. 2015;867:179-93
13. Li D, Mallory T, Satomura S. AFP-L3: a new generation of tumor marker for hepatocellular carcinoma. Clin Chim Acta. 2001;313:15-9
14. Huss WJ, Hanrahan CF, Barrios RJ, Simons JW, Greenberg NM. Angiogenesis and prostate cancer: identification of a molecular progression switch. Cancer Res. 2001;61:2736-43
15. Strohmeyer D, Rossing C, Strauss F, Bauerfeind A, Kaufmann O, Loening S. Tumor angiogenesis is associated with progression after radical prostatectomy in pT2/pT3 prostate cancer. Prostate. 2000;42:26-33
16. Morrissey C, Dowell A, Koreckij TD, Nguyen H, Lakely B, Fanslow WC. et al. Inhibition of angiopoietin-2 in LuCaP 23.1 prostate cancer tumors decreases tumor growth and viability. Prostate. 2010;70:1799-808
17. Tang KD, Holzapfel BM, Liu J, Lee TK, Ma S, Jovanovic L. et al. Tie-2 regulates the stemness and metastatic properties of prostate cancer cells. Oncotarget. 2016;7:2572-84
18. Sokoll LJ, Sanda MG, Feng Z, Kagan J, Mizrahi IA, Broyles DL. et al. A prospective, multicenter, National Cancer Institute Early Detection Research Network study of [-2]proPSA: improving prostate cancer detection and correlating with cancer aggressiveness. Cancer Epidemiol Biomarkers Prev. 2010;19:1193-200
19. de la Calle C, Patil D, Wei JT, Scherr DS, Sokoll L, Chan DW. et al. Multicenter Evaluation of the Prostate Health Index to Detect Aggressive Prostate Cancer in Biopsy Naive Men. J Urol. 2015;194:65-72
20. Alford AV, Brito JM, Yadav KK, Yadav SS, Tewari AK, Renzulli J. The Use of Biomarkers in Prostate Cancer Screening and Treatment. Rev Urol. 2017;19:221-34
21. Sokoll LJ, Wang Y, Feng Z, Kagan J, Partin AW, Sanda MG. et al. [-2]proenzyme prostate specific antigen for prostate cancer detection: a national cancer institute early detection research network validation study. J Urol. 2008;180:539-43 discussion 43
22. Platt RW, Hanley JA, Yang H. Bootstrap confidence intervals for the sensitivity of a quantitative diagnostic test. Stat Med. 2000;19:313-22
23. Qin G, Hsu YS, Zhou XH. New confidence intervals for the difference between two sensitivities at a fixed level of specificity. Stat Med. 2006;25:3487-502
24. Song J, Merbs SL, Sokoll LJ, Chan DW, Zhang Z. A multiplex immunoassay of serum biomarkers for the detection of uveal melanoma. Clin Proteomics. 2019;16:10
25. Song J, Sokoll LJ, Pasay JJ, Rubin AL, Li H, Bach DM. et al. Identification of Serum Biomarker Panels for the Early Detection of Pancreatic Cancer. Cancer Epidemiol Biomarkers Prev. 2019;28:174-82
26. Gabriel KR. The Biplot Graphic Display of Matrices with Application to Principal Component Analysis. Biometrika. 1971;58:453-67
27. Hasui Y, Marutsuka K, Asada Y, Ide H, Nishi S, Osada Y. Relationship between serum prostate specific antigen and histological prostatitis in patients with benign prostatic hyperplasia. Prostate. 1994;25:91-6
28. Nadler RB, Humphrey PA, Smith DS, Catalona WJ, Ratliff TL. Effect of inflammation and benign prostatic hyperplasia on elevated serum prostate specific antigen levels. J Urol. 1995;154:407-13
29. Catalona WJ, Partin AW, Sanda MG, Wei JT, Klee GG, Bangma CH. et al. A multicenter study of [-2]pro-prostate specific antigen combined with prostate specific antigen and free prostate specific antigen for prostate cancer detection in the 2.0 to 10.0 ng/ml prostate specific antigen range. J Urol. 2011;185:1650-5
30. Munkley J, Mills IG, Elliott DJ. The role of glycans in the development and progression of prostate cancer. Nat Rev Urol. 2016;13:324-33
31. Vermassen T, Speeckaert MM, Lumen N, Rottey S, Delanghe JR. Glycosylation of prostate specific antigen and its potential diagnostic applications. Clin Chim Acta. 2012;413:1500-5
32. Drake RR, Jones EE, Powers TW, Nyalwidhe JO. Altered glycosylation in prostate cancer. Adv Cancer Res. 2015;126:345-82
33. Gilgunn S, Conroy PJ, Saldova R, Rudd PM, O'Kennedy RJ. Aberrant PSA glycosylation-a sweet predictor of prostate cancer. Nat Rev Urol. 2013;10:99-107
34. Yoneyama T, Ohyama C, Hatakeyama S, Narita S, Habuchi T, Koie T. et al. Measurement of aberrant glycosylation of prostate specific antigen can improve specificity in early detection of prostate cancer. Biochem Biophys Res Commun. 2014;448:390-6
35. Sarrats A, Saldova R, Comet J, O'Donoghue N, de Llorens R, Rudd PM. et al. Glycan characterization of PSA 2-DE subforms from serum and seminal plasma. OMICS. 2010;14:465-74
36. Ohyama C, Hosono M, Nitta K, Oh-eda M, Yoshikawa K, Habuchi T. et al. Carbohydrate structure and differential binding of prostate specific antigen to Maackia amurensis lectin between prostate cancer and benign prostate hypertrophy. Glycobiology. 2004;14:671-9
37. Meany DL, Zhang Z, Sokoll LJ, Zhang H, Chan DW. Glycoproteomics for prostate cancer detection: changes in serum PSA glycosylation patterns. J Proteome Res. 2009;8:613-9
38. Llop E, Ferrer-Batalle M, Barrabes S, Guerrero PE, Ramirez M, Saldova R. et al. Improvement of Prostate Cancer Diagnosis by Detecting PSA Glycosylation-Specific Changes. Theranostics. 2016;6:1190-204
39. Ferrer-Batalle M, Llop E, Ramirez M, Aleixandre RN, Saez M, Comet J. et al. Comparative Study of Blood-Based Biomarkers, alpha2,3-Sialic Acid PSA and PHI, for High-Risk Prostate Cancer Detection. Int J Mol Sci. 2017 18
40. Kyselova Z, Mechref Y, Al Bataineh MM, Dobrolecki LE, Hickey RJ, Vinson J. et al. Alterations in the serum glycome due to metastatic prostate cancer. J Proteome Res. 2007;6:1822-32
41. Saldova R, Fan Y, Fitzpatrick JM, Watson RW, Rudd PM. Core fucosylation and alpha2-3 sialylation in serum N-glycome is significantly increased in prostate cancer comparing to benign prostate hyperplasia. Glycobiology. 2011;21:195-205
42. Behnken HN, Ruthenbeck A, Schulz JM, Meyer B. Glycan analysis of Prostate Specific Antigen (PSA) directly from the intact glycoprotein by HR-ESI/TOF-MS. J Proteome Res. 2014;13:997-1001
43. Tabares G, Radcliffe CM, Barrabes S, Ramirez M, Aleixandre RN, Hoesel W. et al. Different glycan structures in prostate-specific antigen from prostate cancer sera in relation to seminal plasma PSA. Glycobiology. 2006;16:132-45
44. Peracaula R, Tabares G, Royle L, Harvey DJ, Dwek RA, Rudd PM. et al. Altered glycosylation pattern allows the distinction between prostate-specific antigen (PSA) from normal and tumor origins. Glycobiology. 2003;13:457-70
45. Li Y, Tian Y, Rezai T, Prakash A, Lopez MF, Chan DW. et al. Simultaneous analysis of glycosylated and sialylated prostate-specific antigen revealing differential distribution of glycosylated prostate-specific antigen isoforms in prostate cancer tissues. Anal Chem. 2011;83:240-5
46. Gharbaran R. Advances in the molecular functions of syndecan-1 (SDC1/CD138) in the pathogenesis of malignancies. Crit Rev Oncol Hematol. 2015;94:1-17
47. Szarvas T, Reis H, Vom Dorp F, Tschirdewahn S, Niedworok C, Nyirady P. et al. Soluble syndecan-1 (SDC1) serum level as an independent pre-operative predictor of cancer-specific survival in prostate cancer. Prostate. 2016;76:977-85
48. Bauskin AR, Brown DA, Junankar S, Rasiah KK, Eggleton S, Hunter M. et al. The propeptide mediates formation of stromal stores of PROMIC-1: role in determining prostate cancer outcome. Cancer Res. 2005;65:2330-6
49. Bansal N, Kumar D, Gupta A, Chandra D, Sankhwar SN, Mandhani A. Relevance of MIC-1 in the Era of PSA as a Serum Based Predictor of Prostate Cancer: A Critical Evaluation. Sci Rep. 2017;7:16824
50. Brown DA, Lindmark F, Stattin P, Balter K, Adami HO, Zheng SL. et al. Macrophage inhibitory cytokine 1: a new prognostic marker in prostate cancer. Clin Cancer Res. 2009;15:6658-64
51. Stephan C, Xu C, Brown DA, Breit SN, Michael A, Nakamura T. et al. Three new serum markers for prostate cancer detection within a percent free PSA-based artificial neural network. Prostate. 2006;66:651-9
52. Brown DA, Stephan C, Ward RL, Law M, Hunter M, Bauskin AR. et al. Measurement of serum levels of macrophage inhibitory cytokine 1 combined with prostate-specific antigen improves prostate cancer diagnosis. Clin Cancer Res. 2006;12:89-96
53. Cohen JD, Li L, Wang Y, Thoburn C, Afsari B, Danilova L. et al. Detection and localization of surgically resectable cancers with a multi-analyte blood test. Science. 2018;359:926-30
Author contact
![]() Corresponding authors: contributed equally to this work. Daniel W. Chan, Department of Pathology, Johns Hopkins University School of Medicine, 1550 Orleans Street, Baltimore, MD 21231, USA. Tel: 410-955-2674; Fax: 443-287-6388; E-mail: dchanedu. Zhen Zhang, Department of Pathology, Johns Hopkins University School of Medicine, 1550 Orleans Street, Baltimore, MD 21231, USA. Tel: 410-502-7871; Fax: 443-287-6388; E-mail: zzhang7edu.
Corresponding authors: contributed equally to this work. Daniel W. Chan, Department of Pathology, Johns Hopkins University School of Medicine, 1550 Orleans Street, Baltimore, MD 21231, USA. Tel: 410-955-2674; Fax: 443-287-6388; E-mail: dchanedu. Zhen Zhang, Department of Pathology, Johns Hopkins University School of Medicine, 1550 Orleans Street, Baltimore, MD 21231, USA. Tel: 410-502-7871; Fax: 443-287-6388; E-mail: zzhang7edu.