Impact Factor
- Issue 14; 2026
- Issue 13; 2026
- Issue 12; 2026
- Issue 11; 2026
- Issue 10; 2026
- Volume 16; 2026
- Advance Articles
- Past Issues
- Cover Images
- Cover Suggestion
- Index & Coverage
- Special Issues
Introduction
Results
Discussion
Methods
Abbreviations
Supplementary Material
Acknowledgements
References
International Journal of Biological Sciences
International Journal of Medical Sciences
 Global reach, higher impact

Theranostics 2021; 11(2):506-521. doi:10.7150/thno.49812 This issue Cite
Research Paper
Highly sensitive magnetic particle imaging of vulnerable atherosclerotic plaque with active myeloperoxidase-targeted nanoparticles
Wei Tong1,2,3,#, Hui Hui3,4,#, ![]() , Wenting Shang3,4,#, Yingqian Zhang2,#, Feng Tian2, Qiang Ma2, Xin Yang3,4, Jie Tian3,4,5,
, Wenting Shang3,4,#, Yingqian Zhang2,#, Feng Tian2, Qiang Ma2, Xin Yang3,4, Jie Tian3,4,5, ![]() , Yundai Chen1,2,
, Yundai Chen1,2, ![]()
1. Medical School of Chinese PLA, Chinese PLA General Hospital, Beijing, 100853, China.
2. Department of Cardiology, the Sixth Medical Centre, Chinese PLA General Hospital, Beijing, 100853, China.
3. CAS Key Laboratory of Molecular Imaging, Institute of Automation, Chinese Academy of Sciences, Beijing, 100190, China.
4. University of Chinese Academy of Sciences, Beijing, China.
5. Beijing Advanced Innovation Center for Big Data-Based Precision Medicine, School of Medicine, Beihang University, Beijing, 100083, China.
#These authors contributed equally to this work.
Received 2020-6-22; Accepted 2020-9-28; Published 2021-1-1
Abstract

Inflammation is a pivotal driver of atherosclerotic plaque progression and rupture and is a target for identifying vulnerable plaques. However, challenges arise with the current in vivo imaging modalities for differentiating vulnerable atherosclerotic plaques from stable plaques due to their low specificity and sensitivity. Herein, we aimed to develop a novel multimodal imaging platform that specifically targets and identifies high-risk plaques in vivo by detecting active myeloperoxidase (MPO), a potential inflammatory marker of vulnerable atherosclerotic plaque.
Methods: A novel multimodal imaging agent, 5-HT-Fe3O4-Cy7 nanoparticles (5HFeC NPs), used for active MPO targeting, was designed by conjugating superparamagnetic iron oxide nanoparticles (SPIONs) with 5-hydroxytryptamine and cyanine 7 N-hydroxysuccinimide ester. The specificity and sensitivity of 5HFeC NPs were evaluated using magnetic particle imaging (MPI), fluorescence imaging (FLI), and computed tomographic angiography (CTA) in an ApoE-/- atherosclerosis mouse model. Treatment with 4-ABAH, an MPO inhibitor, was used to assess the monitoring ability of 5HFeC NPs.
Results: 5HFeC NPs can sensitively differentiate and accurately localize vulnerable atherosclerotic plaques in ApoE-/- mice via MPI/FLI/CTA. High MPI and FLI signals were observed in atherosclerotic plaques within the abdominal aorta, which were histologically confirmed by multiple high-risk features of macrophage infiltration, neovascularization, and microcalcification. Inhibition of active MPO reduced accumulation of 5HFeC NPs in the abdominal aorta. Accumulation of 5HFeC NPs in plaques enabled quantitative evaluation of the severity of inflammation and monitoring of MPO activity.
Conclusions: This multimodal MPI approach revealed that active MPO-targeted nanoparticles might serve as a method for detecting vulnerable atherosclerotic plaques and monitoring MPO activity.
Keywords: myeloperoxidase, vulnerable plaque, magnetic particle imaging, fluorescence imaging, computed tomographic angiography
Introduction
Atherosclerosis is a systematic, progressive, inflammatory disease that causes significant morbidity and mortality worldwide [1]. Complications related to atherosclerosis, such as ischemic stroke and myocardial infarction (MI), the latter of which is the leading cause of death in developed countries, are primarily initiated by inflammation-driven rupture of vulnerable atherosclerotic plaques [2]. Imaging techniques, particularly in vivo molecular imaging techniques, play an important role in risk stratification of atherosclerotic plaques [3].
Currently, advanced molecular imaging techniques, such as ultrasound, positron emission tomography (PET), and magnetic resonance imaging (MRI), are being used for imaging vulnerable plaques, particularly since the development of novel imaging probes targeting inflammation and microcalcification [4-6]. However, each imaging modality has limitations. Ultrasound has the advantage of low cost and real-time imaging; however, it also suffers from limited tissue penetration [7]. Meanwhile, MRI techniques are limited by motion effects associated with the cardiac cycle and diaphragmatic movements when utilized for coronary plaque imaging [8]. Although PET offers high sensitivity, it is impaired by radiation exposure and low spatial resolution [9, 10]. Furthermore, both MRI and PET require a long acquisition time. An ideal atherosclerosis imaging platform uses high sensitivity imaging techniques and a specific targeting marker to identify vulnerable plaques [11]. Therefore, multiple imaging modalities integrated with multimodal imaging tracers are urgently needed to identify high-risk plaques.
Magnetic particle imaging (MPI) is an emerging tomographic method that uses superparamagnetic iron oxide nanoparticles (SPIONs) as imaging agents [12-14]. Since its first introduction in 2005 [15], high mass sensitivity (Fe nanograms), high spatial resolution (sub-mm), zero tissue depth signal attenuation, and lack of ionizing radiation have been reported as advantages of MPI [16]. Furthermore, iron oxide nanoparticles have been approved for clinical applications [17-19]. Computed tomographic angiography (CTA) can provide anatomical information for the vessel and directly assess luminal stenosis severity. These advantages make MPI/CTA a promising imaging modality to identify vulnerable plaques in arteries. Furthermore, in vivo fluorescence imaging (FLI) has distinct advantages, such as high sensitivity, no ionization, and relatively simple operation [11]. Thus, FLI/MPI/CTA may serve as a promising multimodality technique for accurately identifying vulnerable plaques with high sensitivity and spatial resolution.
Myeloperoxidase (MPO), an inflammatory protein, is secreted as an active enzyme by neutrophils and macrophages during inflammation in atherosclerotic plaques [20, 21]. Plasma MPO protein is positively associated with the presence and severity of coronary artery disease [22, 23] as well as with patient prognosis [24]. In fact, an autopsy study revealed that MPO is abundantly expressed in ruptured coronary plaques among patients who died of acute MI [25]. Moreover, advanced human atheromas exhibit higher levels of MPO-expressing macrophages than early-stage atherosclerotic lesions [21]. Recent animal studies have reported that inhibition of MPO activity can stabilize vulnerable plaques by reducing intraplaque hemorrhage and increasing fibrous cap thickness [26]. Therefore, MPO is increasingly becoming recognized as a potential target for the identification of vulnerable atherosclerotic plaques. Moreover, imaging agents composed of 5-hydroxytryptamine (5-HT) can reportedly self-oligomerize or bind proteins when catalyzed by active MPO in inflamed tissues [27], suggesting that it has potential for application as an imaging biomarker of vulnerable plaques.
In this study, we aimed to develop a novel multimodal atherosclerotic plaque-imaging platform that specifically targets and identifies high-risk plaques in vivo by detecting the distribution of active MPO during inflammation in atherosclerotic plaques (Figure S1). A novel multimodal imaging agent, 5-HT- Fe3O4-Cy7 nanoparticles (5HFeC NPs), used for active MPO targeting, was designed by conjugating 5-HT and Fe3O4@PEG-COOH with cyanine 7 N-hydroxysuccinimide ester (Cy7-NHS). The in vivo-specific targeting ability of 5HFeC NPs was evaluated in an established MPO-implanted mouse model using FLI and MPI. FLI and MPI/CTA imaging of active MPO in atherosclerotic plaques was performed in the atherosclerotic ApoE-/- mouse model, in which 5HFeC NPs showed high contrast enhancement in plaques of the abdominal aorta with histologically confirmed high-risk features of macrophage infiltration, neovascularization, and microcalcification. FLI and MPI were further used to confirm the targeting ability of 5HFeC NPs after inhibition of MPO activity in atherosclerotic ApoE-/- mice.
Results
Characterization of 5HFeC NPs
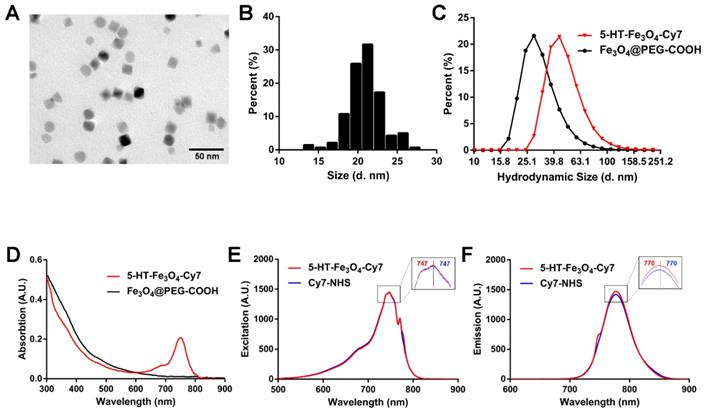
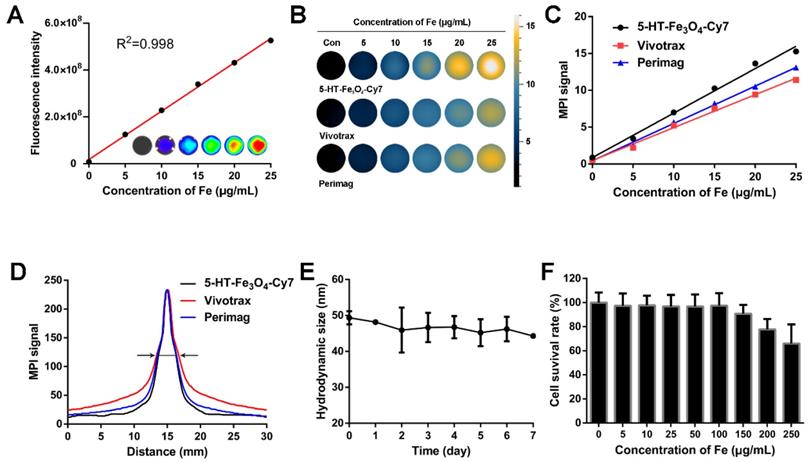
To synthesize an active MPO-specific imaging probe, 5HFeC NPs were first prepared and characterized. A transmission electron microscopy (TEM) image of 5HFeC NPs is shown in Figure 1A; the nanoparticles were mono-dispersed and had an average size of 20.97 ± 2.23 nm in the dry state (Figure 1B). The powder X-ray diffraction (XRD) patterns in Figure S2A reveal that 5HFeC NPs are cubic nanocrystals, with the space group of Fd-3m. Figure 1C shows that the average hydrodynamic size of Fe3O4@PEG-COOH was 32.94 ± 12.65 nm, whereas that of 5HFeC NPs was 50.27 ± 18.96 nm. Moreover, Fe3O4@PEG-COOH had a negative zeta potential of -24.5 ± 8.5 mV. After coating with 5-HT and Cy7-NHS, the zeta potential of 5HFeC NPs was reduced to -31.8 ± 8.9 mV. Fourier transform infrared (FT-IR) spectroscopy was performed to ensure the conjugation of Fe3O4@PEG-COOH with 5-HT and Cy7-NHS. The absorption peak of 5-HT-Fe3O4 at 1737 cm-1 was lower than that of Fe3O4 @PEG-COOH (Figure S2B), which is the characteristic peak of C=O (COOH). However, at 1654 cm-1 (the characteristic peak of C=O (CONH)), the absorption peak of 5-HT-Fe3O4 NPs was higher than that of Fe3O4 @PEG-COOH. These results indicate that 5-HT was successfully conjugated with Fe3O4 @PEG-COOH. When 5-HT-Fe3O4 NPs and Cy7-NHS were further connected, no noticeable stretching vibration peaks were observed in the corresponding bands since the bound agents occupy the amino group. Optical absorption spectra analysis showed that the 5HFeC NPs had an absorption peak at 749 nm (Figure 1D). To select a suitable fluorescent filter, the excitation (747 nm) and emission (770 nm) spectra of 5HFeC NPs were analyzed and were consistent with the spectra of free Cy7 (Figure 1E and 1F). Fluorescence intensity and MPI signal at different concentrations of 5HFeC NPs were recorded (Figure 2A-2C). In the range of 0-25 μg/mL, both the fluorescence intensity (Y = 2.07 × 10⁷ X + 1.79 × 10⁷, R2 = 0.998, P < 0.001) and MPI signal (Y = 0.60X + 0.87, R2 = 0.992, P < 0.001) of 5HFeC NPs showed a linear correlation with the concentration of Fe. Moreover, MPI signals of Vivotrax (Magnetic Insight Inc., USA) and Perimag (Micromod Partikeltechnologie GmbH, Germany) at concentrations equal to that of Fe were lower than the MPI signal of 5HFeC NPs (Figure 2B and 2C). Figure 2D shows the point spread function (PSF) curves of 5HFeC NPs, Vivotrax, and Perimag; the spatial resolutions of 5HFeC NPs, Vivotrax, and Perimag were 2.76, 3.45, and 2.97 mm, respectively.
Characterization of 5HFeC NPs. TEM image (A) and size distribution (B) of 5HFeC NPs. Hydrodynamic sizes (C) and UV-VIS-NIR spectra (D) of 5HFeC NPs and Fe3O4@PEG-COOH. Excitation spectra (E) and emission spectra (F) of 5HFeC NPs and Cy7-NHS.
5HFeC NPs characterization, stability, and toxicity tests. Standard curve generated by quantifying fluorescence intensity of various concentrations of 5HFeC NPs (A). MPI images of 5HFeC NPs, Vivotrax, and Perimag at various concentrations (B). Standard curve generated by quantifying MPI signal of various concentrations of 5HFeC NPs, Vivotrax, and Perimag (C). Point spread function curve of 5HFeC NPs, Vivotrax, and Perimag (D). Spatial resolutions of the 5HFeC NPs, Vivotrax, and Perimag were analytically estimated as the full width at half-maximum 2.76 mm, 3.45 mm, and 2.97 mm, respectively. Hydrodynamic size of 5HFeC NPs at room temperature over 7 days (E). In vitro cytotoxicity of RAW 264.7 cells incubated with various concentrations of 5HFeC NPs (F).
In vitro stability, biocompatibility, and specificity of 5HFeC NPs
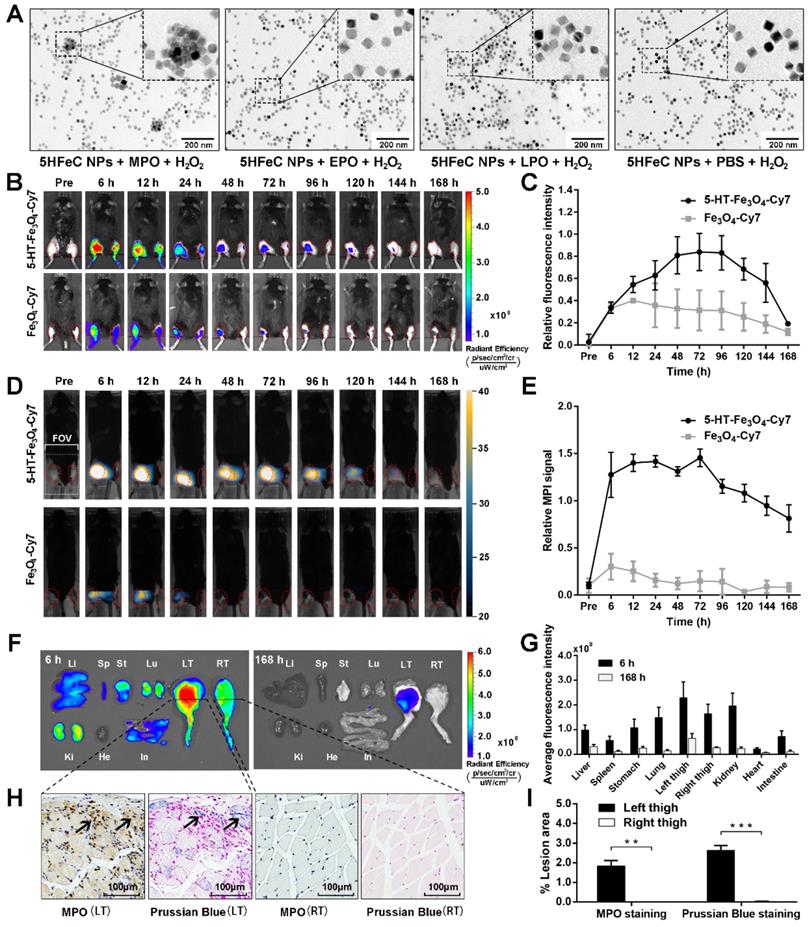
To determine the stability of 5HFeC NPs, the nanoparticle solution was dissolved in phosphate-buffered saline (PBS) for one week at room temperature (20 ℃). The hydrodynamic size of the nanoparticles did not exhibit significant differences over one week, demonstrating that their sizes remained stable in PBS (Figure 2E). The cell counting kit-8 (CCK-8) assay was performed to examine the toxic effects of 5HFeC NPs on RAW 264.7 cells. The viability of RAW 264.7 cells incubated with 5HFeC NPs (0-250 μg/mL) is shown in Figure 2F. No noticeable cytotoxicity (< 100 μg/mL) was observed in these cells. Furthermore, in vitro assessment of specificity against oxidases, including MPO, EPO, LPO, and PBS, as a control, was performed (Figure 3A). Following incubation of 5HFeC NPs with MPO and H2O2 for 1 h at 37 °C, TEM analysis revealed that 5HFeC NPs clustered together to form larger nanoparticles. However, when incubated with H2O2, and EPO, LPO or PBS, 5HFeC NPs did not aggregate into larger nanoparticles.
In vitro and in vivo MPO-targeting specificity of 5HFeC NPs. TEM images of 5HFeC NPs after incubation with H2O2 and MPO, EPO, LPO, or PBS (A). In vivo FLI over 168 h of MPO-implanted mice intravenously administered 5HFeC NPs or Fe3O4-Cy7 (B). Red ellipse refers to the region of interest (ROI) in thighs. Relative fluorescence intensity of left thigh to right thigh (C). MPI imaging over 168 h of mice intravenously administered 5HFeC NPs or Fe3O4-Cy7 (D). MPI field of view (6 × 4 cm) is noted in the figure. Red ellipse denotes ROI in the thighs. Relative MPI signal of left thigh to right thigh (E). Ex vivo imaging of major organs at 6 and 168 h post-injection (F). Li, liver; Sp, spleen; St, stomach; Lu, lung; LT, left thigh; RT, right thigh; Ki, kidney; He, heart; In, intestine. Average fluorescence intensity of different tissues (G). MPO immunohistochemical and Prussian blue staining of muscle tissues from mouse thighs implanted with MPO plus glucose oxidase (left) or PBS (right) at 6 h post-injection of 5HFeC NPs (H). Quantification analysis of MPO immunohistochemical and Prussian blue staining (I). (n = 3 for the MPO-implanted mice; **: P < 0.005; ***: P < 0.001).
FLI/MPI/CT imaging of MPO-implanted mice to confirm the specificity and biodistribution of 5HFeC NPs in vivo and ex vivo
To determine the specificity of 5HFeC NPs to target active MPO in vivo, MPO and glucose oxidase were embedded in the left thigh of C57BL/6J mice, while the right thigh only received PBS. For the MPO-implanted mice injected with 5HFeC NPs (Figure 3B), fluorescence intensity continuously increased in the left thigh (implanted with MPO) compared to that in the right thigh from 6 to 168 h after nanoparticle injection. The amount of 5HFeC NPs accumulated in the left thigh began increasing 6 h post-injection and gradually reached a peak (0.84-fold increase compared to the right thigh) at 72 h post-injection (Figure 3C). Similarly, the injection of Fe3O4-Cy7 also resulted in an increase in fluorescence intensity in the left thigh compared with that in the right thigh from 6 to 168 h (Figure 3B). However, the relative fluorescence intensity in the mice injected with Fe3O4-Cy7 was lower than that in mice injected with 5HFeC NPs, with a maximum relative fluorescence intensity of 0.40 at 12 h post-injection in mice injected with Fe3O4-Cy7 (Figure 3C). MPI signal was continuously detected in the left thigh from 6 to 168 h post-injection of 5HFeC NPs (Figure 3D). At 6 h post-injection, the MPI signal was clearly detected in the left thigh (Figure 3E) and a 1.45-fold increase was observed at 72 h post-injection, after which point the signal began to decrease. Therefore, 6 h to 72 h post-injection was the optimal window to visualize active MPO via MPI imaging. Additionally, three-dimensional (3D) co-registration of the MPI and CT images enabled the visualization of 5HFeC NP distribution in the MPO-implanted thigh (Supplementary movie 1). For the mice injected with Fe3O4-Cy7, MPI signal was detected in the left thigh only at 6, 12 and 24 h post-injection (Figure 3D). The relative MPI signal was also lower at the same time points in mice injected with 5HFeC NPs. A 0.30-fold increase in the MPI signal was recorded at 6 h post-injection, after which point the signal began to decrease (Figure 3E).
The distribution of 5HFeC NPs was further examined in harvested tissues at 6 and 168 h post-injection (Figure 3F). The left thigh showed the highest fluorescence intensity among all tissues both at 6 and 168 h, confirming the specificity of 5HFeC NPs for MPO (Figure 3G). As shown in Figure 3H and 3I, immunohistochemical staining of MPO revealed abundant MPO in the left thigh, but not in the right thigh (P < 0.005). Prussian blue staining further confirmed that more 5HFeC NPs accumulated in the muscle tissues of the left thigh than in those of the right thigh (P < 0.001). Moreover, fluorescence was detected in the kidney, lung, stomach, liver, and spleen at 6 h post-injection. Prussian blue staining of the main organs at 6 h post-injection indicated that 5HFeC NPs were primarily deposited in the liver and spleen, and not in the kidney, lung, or heart (Figure S3).
FLI/MPI/CTA imaging of active MPO to identify aortic plaque in atherosclerotic ApoE-/- mice
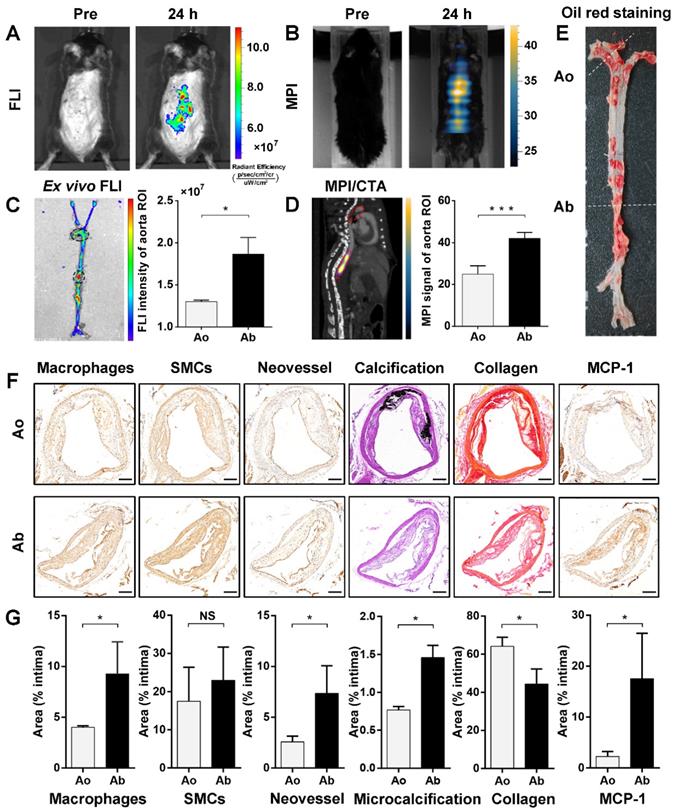
Eight-week-old male ApoE-/- mice were used for imaging after 40‒42 weeks of a high-fat and high-cholesterol diet (HFD). Fluorescence images in vivo were acquired before, and at 24 h after, intravenous injection of 5HFeC NPs (Figure 4A). MPI images were also acquired before, and at 24 h post-injection (Time window of MPI imaging: 6 h to 72 h post-injection; Figure 4B). The biodistribution of 5HFeC NPs in harvested tissues from the atherosclerotic mice was analyzed at 24 h post-injection (Figure S4A). Aside from the kidney, the highest fluorescence intensity was detected in the aorta (Figure S4B). Further ex vivo fluorescence images of the aorta revealed fluorescent nanoparticle-derived intensity primarily at the abdominal aorta (Figure 4C). To image the 3D distribution of 5HFeC NPs in the aorta of mice, whole-body 3D MPI was performed and co-registered with CTA (Figure S5 and Supplementary movie 2). MPI/CTA images showed that an Fe3O4-derived MPI signal was mainly detected at the abdominal aorta (Figure 4D). Quantitative analysis of the region of interest (ROI) revealed that both fluorescence intensity (1.87 ± 0.11 × 10⁷ vs. 1.30 ± 0.01 × 10⁷, P < 0.05, respectively) and the MPI signal (42.04 ± 1.26 vs. 24.95 ± 2.27, P < 0.001, respectively) were higher in the abdominal aorta than in the aortic arch.
Identification of vulnerable plaque located in abdominal aorta of atherosclerotic mice via FLI/MPI/CTA imaging after intravenous injection of 5HFeC NPs. In vivo FLI of active MPO in aorta atheroma of ApoE-/- mice before, and 24 h post, injection of 5HFeC NPs (A). MPI imaging of active MPO in aorta atheroma of ApoE-/- mice before and 24 h post-injection of 5HFeC NPs (B). Ex vivo FLI of active MPO in the aorta of atherosclerotic mice and quantification of fluorescence intensity in aortic arch and abdominal aorta (C). Black ellipse indicates ROI in the aorta. MPI/CTA imaging of active MPO in the aorta of atherosclerotic mice and quantification of MPI signal in aortic arch and abdominal aorta (D). Red ellipse represents ROI in the mouse. Oil Red O staining images of the aorta from atherosclerotic mice (E). Cross-sections of plaque segments collected from aortic arch and abdominal aorta of atherosclerotic mouse and stained for macrophages (CD68), SMCs (ɑ-SMA), neovessel (CD31), calcification (von Kossa), collagen (picrosirius red), and MCP-1. SMCs, smooth muscle cells; MCP-1, monocyte chemoattractant protein-1-positive cells (F). Quantification of macrophages, SMCs, neovessel, microcalcification, collagen, and MCP-1 in the intimal area of plaque segments collected from aortic arch and abdominal aorta (G). Ao, aortic arch; Ab, abdominal aorta; scale bar in (F), 200 μm. (n = 3 for the atherosclerotic mice; NS: non-significant differences; *: P < 0.05; ***: P < 0.001).
Component and vulnerability analysis of plaques in the aorta
Oil O Red staining of the aorta showed that the atherosclerotic plaque was primarily observed in both the aortic arch and abdominal aorta (Figure 4E). The immunohistochemical, von Kossa and picrosirius red staining were performed to investigate the plaque components and vulnerability of the aortic arch and abdominal aorta, including macrophages, smooth muscle cells, neovessels, microcalcification, and MCP-1. As shown in Figure 4F and 4G, lesions in the abdominal aorta contained more macrophages (9.28 ± 3.15% vs. 4.02 ± 0.14%, P < 0.05, respectively) and neovessels (7.36 ± 2.71% vs. 2.58 ± 0.57%, P < 0.05, respectively), but had less collagen (44.37 ± 7.84% vs. 64.17 ± 4.71%, P < 0.05, respectively) than did those in the aortic arch. Meanwhile, smooth muscle cells showed no relative difference between lesions in the abdominal aorta and aortic arch (22.98 ± 8.69% vs. 17.48 ± 8.90%, P > 0.05, respectively). Moreover, the amount of calcification was significantly higher in aortic arch lesions than in those of the abdominal aorta (16.18 ± 0.63% vs. 1.80 ± 0.51%, P < 0.001, respectively). CTA images of atherosclerotic mice also showed calcification in the aortic arch (Figure S6A), but not in the abdominal aorta (Figure S6B). Arterial calcification has been shown to correlate with cardiovascular events [28]. Moreover, larger calcifications (>200 μm) may contribute to plaque stabilization, whereas microcalcifications (1-30 μm) may destabilize atherosclerotic plaques [29, 30]. Therefore, the distribution of large calcification and microcalcification was analyzed in calcified areas in the aortic arch and abdominal aorta. Despite the abundance of calcification in the aortic arch, large calcifications (> 200 μm) accounted for 95.25 ± 0.05% of the calcified area in lesions of the aortic arch. Quantitative analysis revealed that microcalcification (1-30 μm) had a smaller distribution in the aortic arch than in the abdominal aorta (0.77 ± 0.03% vs. 1.46 ± 0.16%, P < 0.05, respectively). The expression of monocyte chemoattractant protein-1 (MCP-1), a predicted mediator of human plaque vulnerability [31], was further examined to confirm the vulnerability of plaques. MCP-1 was significantly higher in lesions in the abdominal aorta than in those of the aortic arch (17.57 ± 8.86% vs. 2.27 ± 0.98%, P < 0.05, respectively).
FLI/MPI imaging to monitor MPO activity in atherosclerotic plaques
Eight-week-old male ApoE-/- mice were administered the specific irreversible MPO inhibitor 4-aminobenzoic acid hydrazide (4-ABAH; 40 mg/kg) by intraperitoneal injection twice per day in addition to being fed HFD (HFD + 4-ABAH group). Eight-week-old male C57BL/6J mice were fed the standard laboratory chow diet as a control group (Con group). After 40‒42 weeks, the carotid arteries and aorta were isolated and analyzed by Oil O Red staining (Figure S7A). The plaque area was significantly higher in the HFD group than in the Con group (ratio of plaque area to whole aorta area: 55.52 ± 5.80% in HFD group vs. 20.83 ± 1.73% in Con group, P < 0.001; Figure S7B). However, administration of the MPO inhibitor 4-ABAH resulted in no differences in the plaque area (HFD group: 55.52 ± 5.80% vs. HFD + 4-ABAH group: 48.51 ± 3.37%, P > 0.05). Hematoxylin and eosin (H&E) staining of the abdominal aorta confirmed similar thickness of plaques between the HFD group and HFD + 4-ABAH group (Figure S7C).
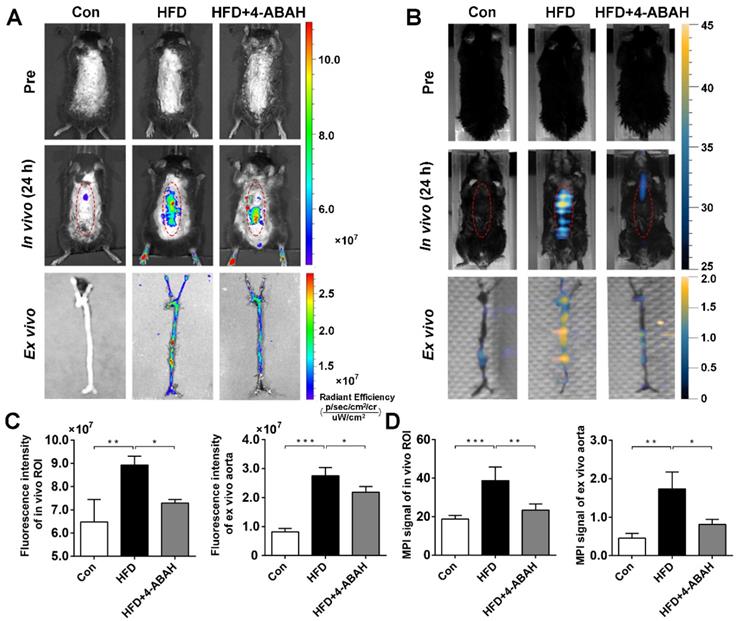
After intravenous injection of 5HFeC NPs, in vivo fluorescence images at 24 h post-injection (Figure 5A) revealed that fluorescence intensity was significantly higher in the HFD group than in the Con group (8.93 ± 0.22 × 10⁷ vs. 6.48 ± 0.56 × 10⁷, P < 0.005, respectively) and the HFD + 4-ABAH group (8.93 ± 0.22 × 10⁷ vs. 7.29 ± 0.09 × 10⁷, P < 0.05, respectively; Figure 5C). After extracting the carotid arteries and aorta, ex vivo fluorescence images of the vessels were acquired and analyzed (Figure 5A). Ex vivo fluorescence intensity in the aorta was significantly higher in the HFD group than in the Con group (2.75 ± 0.28 × 10⁷ vs. 0.82 ± 0.12 × 10⁷, P < 0.001, respectively; Figure 5C). 4-ABAH significantly reduced the fluorescence intensity of the aorta in the HFD + 4-ABAH group (2.75 ± 0.28 × 10⁷ vs. 2.19 ± 0.19 × 10⁷, P < 0.05, respectively). As revealed in Figure 5B and 5D, the MPI signal in the HFD group was significantly higher than that in the Con group (38.72 ± 6.99 vs. 18.77 ± 1.97, P < 0.001, respectively) and HFD + 4-ABAH group (38.72 ± 6.99 vs. 25.07 ± 3.72, P < 0.005, respectively). Ex vivo MPI signal in the aorta was significantly higher in the HFD group than in the Con group (1.74 ± 0.25 vs. 0.46 ± 0.07, P < 0.005, respectively) and HFD + 4-ABAH group (1.74 ± 0.25 vs. 0.81 ± 0.08, P < 0.05, respectively; Figure 5B and 5D).
FLI/MPI imaging of active MPO in aorta atheroma from mice in different groups after intravenous injection of 5HFeC NPs. In vivo and ex vivo FLI of active MPO in aorta atheroma of ApoE-/- mice before, and 24 h post, injection of 5HFeC NPs (A). In vivo and ex vivo MPI imaging of active MPO in aorta atheroma of ApoE-/- mice before, and 24 h post, injection of 5HFeC NPs (B). Quantitative analysis of fluorescence intensity of in vivo ROI and ex vivo aorta (C). Quantitative analysis of MPI signal of in vivo ROI and ex vivo aorta (D). Red ellipse represents the ROI in mice. (n = 3 per group; *: P < 0.05; **: P < 0.005; ***: P < 0.001)
Histological analysis
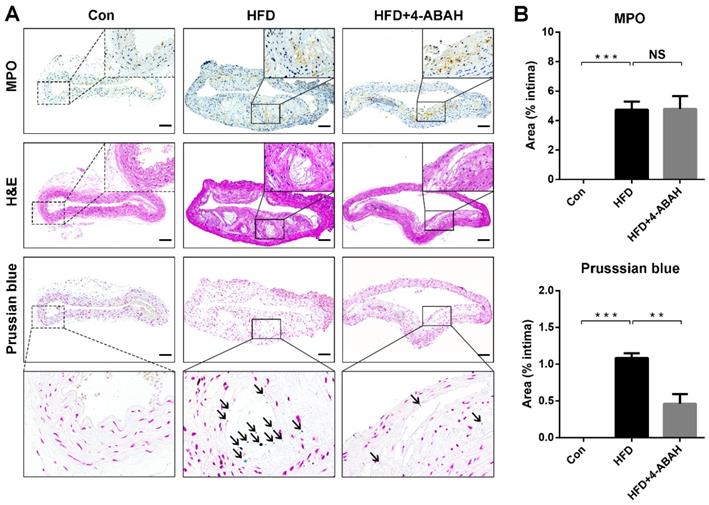
Figure 6A shows the results of immunohistochemical staining of MPO, H&E and Prussian blue staining of atherosclerotic plaques from the abdominal aorta. Immunohistochemical staining revealed that MPO was expressed in the atherosclerotic plaques of the HFD and HFD + 4-ABAH groups, but not in the control group. The histology analysis showed that 5HFeC NPs were preferentially accumulated in the MPO-positive area of the HFD group but not in the HFD + 4-ABAH group. Further quantitative analysis (Figure 6B) indicated that the expression of MPO showed no difference between plaques in the HFD and HFD + 4-ABAH groups (4.74 ± 0.32% vs. 4.80 ± 0.50%, P > 0.05, respectively). 5HFeC NPs, stained by Prussian blue, accumulated more in the HFD group than in the HFD + 4-ABAH group (1.09 ± 0.04% vs. 0.46 ± 0.08%, P < 0.005, respectively). The Con group showed no expression of MPO or Fe accumulation in the intima.
MPO immunohistochemical, H&E, and Prussian blue staining of abdominal aorta tissues extracted from mice in different groups. The black solid square in the MPO immunohistochemical staining image indicates the MPO-positive area in the atherosclerotic plaque from the HFD and HFD + 4-ABAH groups (A). The black solid square in the H&E staining image indicates the same area as the MPO immunohistochemical staining image and exhibits no evidence of intraplaque hemorrhage. The black solid square in the Prussian blue staining image indicates the same area as the black dashed square and shows the accumulation of 5HFeC NPs. The black arrow indicates the 5HFeC NPs (Prussian blue staining-positive area). The control (Con) group developed no atherosclerotic plaques in the intima, in which MPO immunohistochemical and Prussian blue staining showed almost no positive area. Quantification of MPO immunohistochemical and Prussian blue staining in the intima collected from the Con, HFD, and HFD + 4-ABAH groups (B). L, lumen; Scale bar, 100 μm. (n = 3 per group; NS: non-significant differences; **: P < 0.005; ***: P < 0.001).
To confirm the effect of MPO activity inhibition on the vulnerability of abdominal aorta plaques, the components of abdominal aorta plaques were further investigated in the HFD and HFD + 4-ABAH groups (Figure S8A and S8B). The plaques in the HFD + 4-ABAH group contained fewer macrophages (5.40 ± 1.28% vs. 12.11 ± 0.42%, P < 0.05, respectively) and smooth muscle cells (4.96 ± 1.24% vs. 9.46 ± 1.03%, P < 0.05, respectively) than did those in the HFD group. Neovessel (2.60 ± 0.60% vs. 3.10 ± 0.29%, P > 0.05, respectively), collagen (39.86 ± 3.67% vs. 41.59 ± 2.57%, P > 0.05, respectively), and microcalcification (1.58 ± 0.16% vs. 1.90 ± 0.20%, P > 0.05, respectively) showed no significant difference between plaques in the HFD + 4-ABAH and HFD groups. Moreover, MCP-1 was significantly lower in plaques of the HFD + 4-ABAH group than in those of the HFD group (5.14 ± 1.01% vs. 10.99 ± 0.85%, P < 0.05, respectively).
Discussion
Globally, rupture of vulnerable plaques is the main cause of death in patients with atherosclerosis [1]. The lack of an imaging technique capable of accurately identifying vulnerable atherosclerotic plaques is a major limitation in contemporary cardiovascular medicine [8]. In this study, 5HFeC NPs were developed as novel imaging probes for detecting vulnerable plaques by targeting active MPO via FLI/MPI/CTA multimodality imaging.
Vulnerable plaques tend to have large lipid cores, abundant inflammatory cells, few smooth muscle cells, a thin fibrous cap, microcalcification, intraplaque hemorrhage, neovessels, and a necrotic core [32, 33]. Molecular imaging tracers have been established to noninvasively visualize atherosclerotic plaques [8, 34]. 18F-fluorodeoxyglucose is a commonly used radiotracer that can be taken up by activated inflammatory cells, leading to its use as a surrogate of vascular inflammation in atherosclerosis [4]. Moreover, Qiao et al. [35] reported a novel osteopontin-targeted nanoprobe, which was applied in both MRI and FLI of macrophages in atherosclerosis in vivo. Jenkins et al. [36] used the PET radiotracer 18F-fluciclatide to target the αvβ3-integrin receptor, which was upregulated in angiogenesis and inflammation under atherosclerosis conditions in vivo. Due to their low positive predictive values, these imaging tracers require further evidence to confirm their role in discriminating vulnerable from stable plaques [37]. In our study, both FLI and MPI/CTA imaging demonstrated that 5HFeC NPs can target active MPO in atherosclerosis. Furthermore, the fluorescence intensity and MPI signal were primarily detected in the abdominal aorta rather than the aortic arch, indicating higher expression of active MPO in plaques in the abdominal aorta. Furthermore, histological analysis showed that atheroma in the abdominal aorta exhibited characteristics of vulnerability, including higher expression of macrophages, as well as more neovessels and microcalcification, and less collagen, than atheroma in the abdominal aorta. Moreover, MCP-1, a direct mediator of plaque instability that induces expression of metalloproteinases, cytokines, and adhesion molecules [38], was elevated in the atheroma of the abdominal aorta. These results suggest that 5HFeC NPs are useful for identifying vulnerable atherosclerotic plaques. Moreover, inhibition of MPO activity had no significant effect on the plaque size, but did reduce the fluorescence intensity and MPI signal of the 5HFeC NPs in the abdominal aorta. Histological analysis confirmed the reduced targeting by 5HFeC NPs of active MPO. Component analysis of plaques further demonstrated that inhibition of MPO activity stabilized the plaques in the abdominal aorta by reducing macrophages, smooth muscle cells, and expression of MCP-1. Thus, 5HFeC NPs with FLI/MPI/CTA can also be used to monitor MPO activity in vivo.
Molecular imaging probes should have low toxicity and should be biocompatible, stable, and specifically targeted for clinical application. Here, the hydrodynamic sizes of 5HFeC NPs were relatively stable after storage in PBS solution for one week, demonstrating good stability. Cell counting kit-8 assays demonstrated that 5HFeC NPs are not toxic to macrophages below a certain threshold (100 μg/mL). According to pathological examination of major organs extracted from MPO-implanted mice, no marked damage was detected in the liver, spleen, or other organs. In vitro oligomerization confirmed the specificity of 5HFeC NPs to MPO. Notably, 5-HT-based NPs were highly sensitive to MPO in vivo, with MPO-implanted thighs showing 0.84- and 1.45-fold higher fluorescence intensity and MPI signal than PBS-implanted thighs at 72 h in FLI and MPI, respectively. Injection of Fe3O4-Cy7 also resulted in an increase of fluorescence intensity and MPI signal in the MPO-implanted thigh. This may be due to the embedded Matrigel as exogenous implantation may activate acute inflammation and cause localized edema in the left thigh. The enhanced vascular permeability may then contribute to accumulation of a small amount of Fe3O4-Cy7 in the left thighs. Therefore, the relative fluorescence intensity and MPI signal were both lower than those in mice injected with 5HFeC NPs. Meanwhile, 72 h post-injection was determined to be the optimal time point for FLI imaging; however, 5-HT-based NPs clearly visualized active MPO via MPI imaging from 6 to 72 h post-injection.
Previous studies have also reported that Fe3O4 NPs typically accumulate in the liver and spleen [39]. In this study, Prussian blue staining of the main organs confirmed the accumulation of 5HFeC NPs in the liver and spleen. However, the liver and spleen were removed during the MPI imaging process to reduce their effects on visualizing active MPO in the aorta plaque. However, ex vivo FLI revealed fluorescence signals in the kidney, lung, stomach, liver, and spleen, which may have been caused by the 5HFeC NP solution being mixed with a very small amount of Cy7-NHS after centrifugation. Meanwhile, Cy7-NHS accumulated in the kidney, lung, and stomach due to its small size. Despite the fact that the biggest challenge MPI faces is the poor spatial resolution of current MPI scanners, the 5HFeC NPs developed in our study showed a better resolution of 2.76 mm than did the other MPI tracers, such as Vivotrax (3.45 mm, Magnetic Insight Inc, USA) and Perimag (2.97 mm, Micromod Partikeltechnologie GmbH, Germany). Moreover, the MPI signal of 5HFeC NPs was higher than that of Vivotrax and Perimag at the same Fe concentration. Indeed, contrast agents have been combined with molecular imaging to visualize MPO activity in atherosclerotic plaques. For instance, Gd-bis-5-HT-diethylene triamine pentaacetic acid (Gd-bis-5-HT-DTPA) was used to noninvasively track MPO activity in atherosclerotic plaques in the thoracic aorta of a rabbit model via MRI [40]. However, due to the low sensitivity of MRI, large doses of contrast agents are required to detect focal lesions, reducing their biological safety. Another study used 111In-bis-5HT-DTPA to image MPO-expressed atherosclerotic plaques in the murine aorta by single-photon emission computerized tomography (SPECT)/CT imaging [41]. Despite the high sensitivity of SPECT, ionizing radiation creates challenges in nuclear imaging. Further, sulfonaphthoaminophenyl fluorescein (SNAPF), a fluorescent probe, was developed to detect MPO-expressing macrophages in frozen sections of human atherosclerotic carotid arteries [42]. However, the excitation and emission wavelengths required limit its application for in vivo imaging.
Multimodality molecular imaging is a promising approach for non-invasively observing the atherosclerotic plaque composition, disease progression, and severity in vivo [8]. Here, based on a multimodality probe, FLI and MPI/CTA were applied to visualize active MPO for vulnerable plaque identification. Although FLI has certain disadvantages, including autofluorescence perturbation and limited tissue penetration, its high sensitivity enables imaging of atherosclerotic plaques in superficial arteries, including the abdominal aorta and carotid artery [11]. Furthermore, MPI can overcome the disadvantages of FLI due to its zero tissue depth signal attenuation, high sensitivity, and no ionizing radiation [12]. CTA can assess the degree of luminal stenosis, image calcification, and provide anatomical information to achieve 3D imaging. The aortic diameter in the ApoE-/- mouse imaged by MPI/CTA was approximately 1.5 mm, which is significantly smaller than that of the human coronary artery (3.5‒4 mm) and common carotid artery (6‒7.5 mm). Hence, the sizes of atherosclerotic plaques and vessels have limited effects on MPI/CTA imaging to detect human vulnerable plaques in patients with MI or stroke. Moreover, 5HFeC NPs in the atherosclerotic mice can be detected by MPI/CTA and FLI at 24 and 72 h post-injection. Long periods of circulation for MPI tracers have been reported previously. For instance, Zheng et al. used MPI to track SPIONs-labeled mesenchymal stem cells in lung tissues over 12 days [43]. Another study monitored SPION-labeled neural progenitor cells in brain diseases via MPI imaging over 3 months [44]. For the MPO-implanted mouse model in this study, metabolism of 5HFeC NPs in the MPO-implanted thigh can be monitored for 7 days. These results indicate the high sensitivity of FLI and MPI to detect active MPO. MPI has been utilized in various biomedical studies, including in cancer detection [39], stem cell imaging [43], exosome tracking [45], lung perfusion imaging [46, 47], and guidance of hyperthermia therapy [48, 49]. However, ours is the first report on the use of multimodality FLI/MPI/CTA imaging for identifying vulnerable plaques.
To successfully predict the outcome of cardiovascular diseases, an ideal clinical imaging modality is required to image plaque composition and disease severity to differentiate stable from vulnerable plaques in the arteries. Several clinical approaches to atherosclerosis imaging have been well explored, such as coronary CTA, MRI, and nuclear imaging. However, no single modality offers a perfect solution to the imaging challenge, and each has its own disadvantages. Clinical coronary CTA can image the entire coronary artery tree with high temporal resolution; however, it is associated with radiation exposure and limited spatial resolution to adequately identify plaque characteristics [50]. Although MRI has been used to detect neovessels [51], intraplaque hemorrhage [52], and plaque inflammation [5] in carotid arteries, plaque imaging of coronary arteries has proven challenging due to their small diameter, low spatial and temporal resolution and motion effects associated with the cardiac cycle and diaphragmatic movements [53]. Meanwhile, PET combined with targeted radiotracers has been applied to assess vascular inflammation [4] and microcalcification [54] in clinical practice; however, it has been limited by its associated radiation exposure. In this study, MPI/CTA was shown to not only image the entire artery tree, but also sensitively identify vulnerable plaques located in the abdominal aorta through 3D whole-body imaging. Furthermore, it can be used to monitor inhibition of active MPO. This suggests that MPI/CTA is a promising imaging technique with great potential for detection of vulnerable atherosclerotic plaques, as well as monitoring MPO activity.
There are several limitations in our study. First, the liver and spleen must be removed when performing MPI imaging of active MPO in aortic plaques as histological analysis revealed that 5HFeC NPs were primarily localized in the liver and spleen, which was similar to the locations of other Fe3O4-based contrast agents [39]. While signals from Fe-accumulating organs is an issue in mice due to proximity of the aorta to the liver (< 1 cm), this distance is significantly greater in humans and, thus, 6 T/m MPI imaging with 2.76 mm resolution can be expected to clearly detect atherosclerotic plaques in the aorta separate from any Fe accumulation in the liver. Moreover, the neck can be designated as the scanning area to detect vulnerable plaques in the carotid artery, the field of view for which is located away from the liver and spleen. Hence, the effects of these Fe-accumulating organs on MPI imaging in humans can be minimized. Moreover, 5HFeC NPs will be further optimized to accelerate their excretion from the liver and increase accumulation of MPO-targeting nanoparticles in atherosclerotic plaque, which can help enhance early detection of high-risk plaques and reduce the latency between nanoparticle administration and imaging. Second, MPI remains a preclinical imaging modality, which requires combination with CT to provide anatomical information. Recently, Graeser et al. reported a human-sized MPI brain scanner designed for monitoring cerebral perfusion in stroke patients in intensive care units [55]. A hybrid MPI/MRI system was developed by Franke et al. [56] for non-invasive cardiovascular assessment as a preclinical investigation, which suggested that MPI combined with MRI can eliminate ionizing radiation in future studies. Thus, advanced MPI imaging for clinical use should be designed, which may open up a variety of medical applications in cardiovascular diseases and cancers. Finally, 5HFeC NPs with MPI/CTA imaging in the current study were tested only in mouse models. With the wide applications of SPIONs as MPI and MRI contrast agents, ferumoxytol [57], and ferucarbotran [17] have been approved for use in clinical practice. The SPIONs used in our study were tested in mice, but not in humans. Moreover, nanoparticles conjugated with Cy7-NHS, and 5-HT should be studied to confirm their biological safety in humans.
In conclusion, we successfully developed a specific nanoprobe (5HFeC NPs) that can be applied in FLI/MPI/CTA multimodality imaging of active MPO in atherosclerosis with high sensitivity. Furthermore, 5HFeC NPs may be useful for identifying vulnerable plaques and monitoring MPO activity.
Methods
Materials
The following materials were obtained from Sigma-Aldrich (St. Louis, MO, USA): 5-HT, N-(3-dimethylaminopropyl)-Nʹ-ethylcarbodiimide hydrochloride (EDC), and N-hydroxysuccinimide (NHS), lactoperoxidase (LPO). Fe3O4@PEG-COOH was purchased from Nanjing Nanoeast Biotech Co., Ltd. (Nanjing, China). Vivotrax and Perimag were purchased from Magnetic Insight Inc (Alameda, USA) and Micromod Partikeltechnologie GmbH (Rostock, Germany), respectively. Cy7-NHS was obtained from AAT Bioquest (Sunnyvale, CA, USA). RAW 264.7 cells (Otwo Biotech Inc., Shenzhen, China), Dulbecco's modified Eagle's medium (DMEM; Sigma-Aldrich), fetal bovine serum (FBS; Gibco, Grand Island, NY, USA), and cell counting kit-8 (CCK-8; Beyotime Institute of Biotechnology, Shanghai, China) were obtained for cell experiments. Myeloperoxidase (Abcam, Cambridge, UK), glucose oxidase (Dalian Meilun Biotechnology Co., Ltd., Dalian, China), Matrigel (Corning, Inc., Corning, NY, USA), 4-ABAH (Sigma-Aldrich), and ExiTron (TM) nano 12000 CT contrast agent (Miltenyi Biotec, Bergisch Gladbach, Germany) were purchased for animal experiments. Erythropoietin protein (EPO), rabbit anti-mouse MPO, rabbit anti-mouse CD68, rabbit anti-mouse anti-ɑ-smooth muscle actin (SMA), rabbit anti-mouse CD31, and rabbit anti-mouse MCP-1 antibodies were obtained from Abcam.
Synthesis of 5-HT-Fe3O4-Cy7 and Fe3O4-Cy7
Fe3O4 NPs with active MPO targeting ability were synthesized as previously described [11]. Fe3O4@PEG-COOH solution was dissolved in deionized water with pH 6 and activated with EDC and NHS. Subsequently, 5-HT was added to deionized water with pH 8.2 and dissolved in the mixed solution at a 3:1 molar ratio of 5-HT to carboxyl. The mixture was left to react overnight under continuous stirring at 20 °C and then centrifuged (5,580 × g, 30 min) to remove uncoupled 5-HT. The obtained 5-HT-Fe3O4 was dissolved in deionized water with pH 8.2. Cy7-NHS was added to react with the 5-HT-Fe3O4 solution in a 5:1 ratio of dye to carboxyl overnight at 20 °C with continuous stirring. The mixture was centrifuged (5,580 × g, 30 min) to remove uncoupled Cy7-NHS. Fe3O4-Cy7 was constructed by conjugating Cy7-NHS to the surface of Fe3O4@PEG-COOH. Cy7-NHS was added to react with the Fe3O4@PEG-COOH solution (pH = 8.2) in a 5:1 ratio of dye to carboxyl overnight at 20 °C with continuous stirring. The mixture was centrifuged (5,580 × g, 30 min) to remove uncoupled Cy7-NHS. All reactions were conducted in the dark by wrapping the centrifuge tube with aluminum foil.
Characterization of 5-HT-Fe3O4-Cy7
5-HT-Fe3O4-Cy7 NPs were first prepared in deionized water. The iron oxide core size of 5HFeC NPs was measured by TEM (JEM-1200EX, JEOL, Tokyo, Japan). The average hydrodynamic particle size and zeta potential value of the nanoparticles were characterized using a Zetasizer Nano ZS90 (Malvern Instruments, Malvern, UK) at room temperature. Optical absorption spectra of the 5HFeC NPs and Fe3O4@PEG-COOH were obtained on an UV-Vis-NIR spectrophotometer (UV-3600 Plus, Shimadzu, Kumamoto, Japan). Both fluorescence emission spectra and excitation spectra of 5HFeC NPs and Cy7-NHS were recorded at room temperature with a fluorescence spectrofluorometer (F-7000, Hitachi, Tokyo, Japan). The PSF curves of 5HFeC NPs, Vivotrax, and Perimag were obtained with an MPI scanner (MOMENTUM, Magnetic Insight, Inc., Alameda, CA, USA), and the full width at half-maximum values were calculated with ImageJ software (1.8.0 version, National Institutes of Health, Bethesda, MD, USA). The fluorescence intensity and MPI signal of 5HFeC NPs were analyzed at various concentrations using IVIS spectrum (Caliper Life Sciences, PerkinElmer, Waltham, MA, USA) and an MPI scanner. Moreover, the MPI signals of Vivotrax and Perimag were obtained at the same Fe concentrations of 5HFeC NPs using the same MPI scanner. The hydrodynamic particle size of 5HFeC NPs was monitored daily for 7 days. The Powder XRD patterns of 5HFeC NPs were recorded on an X-ray Powder diffractometer (D8 ADVANCE, BRUCKER, Germany). The FT-IR analysis of Fe3O4 @PEG-COOH, 5-HT-Fe3O4, and 5HFeC NPs was performed using a Fourier infrared spectrometer (Nicolet IS10, Thermo Scientific, USA).
Cell culture and cytotoxicity studies
RAW 264.7 cells were cultured in DMEM containing 10% FBS. Cytotoxicity was evaluated using CCK-8. Cells were seeded into 96-well plates (2000 cells/well) and incubated at 37 °C and 5% CO2 in an incubator (Heracell, Thermo Fisher Scientific, Waltham, MA, USA) for 24 h. The 5HFeC NPs were dissolved in DMEM containing 10% FBS at Fe concentrations of 0, 5, 10, 25, 50, 100, 150, 200 and 250 μg/mL. Next, the cells were treated with the nanoparticles and controlled medium (0 μg/mL Fe). After 24 h, the cells were washed with PBS three times and incubated in 100 μL DMEM containing 10 μL CCK-8 solution for 2 h. Optical density was measured at 450 nm and the values were expressed as a percentage of the control well values (Synergy HT Multi-Mode Microplate Reader, Biotek, Winooski, VT, USA).
In vitro specific targeting ability
5HFeC NPs (1 mg/mL Fe concentration) in PBS (100 μL of total volume) with 30% H2O2 (10 μL) were incubated with MPO (8 μg, 1 mg/mL), EPO (5.2 μg, 1 mg/mL) or LPO (11.4 μg, 2 mg/mL) for 1 h at 37 °C, and with PBS without enzyme added as control. Subsequently, 5HFeC NPs from different groups were imaged using TEM.
Animal experiments
All mice used in this study were purchased from Beijing Vital River Laboratory Animal Technology Co., Ltd. (Beijing, China). All animal studies and procedures were performed according to a protocol approved by the Chinese PLA General Hospital Animal Care and Use Committee in accordance with the National Institutes of Health Guideline on the Care and Use of Laboratory Animals.
Animal model of MPO embedded in Matrigel implants
A 200-μL mixture of basement membrane Matrigel was slowly injected into the thighs of 8-week-old male C57BL/6J mice (n = 3) as previously described [58]. Briefly, the mixture containing MPO (10 units) and glucose oxidase (5 units) was injected into the left thigh, whereas the mixture containing a similar volume of PBS was injected into the right thigh and served as a control. Matrigel was used to immobilize MPO and glucose oxidase, which supplies an environment of oxidative stress for oligomer formation or specific protein binding of 5HFeC NPs. At 1 h post-injection of Matrigel implants, the mice were intravenously administered 5HFeC NPs or Fe3O4-Cy7 (7.5 mg Fe per kg weight) for in vivo imaging.
Animal model of atherosclerosis fed with HFD
Eight-week-old male ApoE-/- mice (C57BL/6J background) were first fed a standard laboratory chow diet for one week. Next, 16 animals were randomly assigned to two groups: HFD group (n = 8) and HFD with MPO inhibitor (HFD + 4-ABAH) group (n = 8). Mice in the HFD group were fed a high-fat and high-cholesterol diet (containing 15% fat and 1.25% cholesterol by weight). Mice in the HFD + 4-ABAH group were administered the specific irreversible MPO inhibitor 4-ABAH (40 mg/kg) by intraperitoneal injection twice per day in addition to being fed the high-fat and high-cholesterol diet. Administration of 4-ABAH was performed for the duration of the experiment (40-42 weeks). Eight-week-old male C57BL/6J mice (n = 8) were fed the standard laboratory chow diet as a control group. After 40-42 weeks, the mice were intravenously administered 5HFeC NPs (7.5 mg Fe per kg weight) for imaging experiments. The mice were fasted for 24 h before the imaging experiments.
Fluorescence imaging
To confirm the in vivo specificity of 5HFeC NPs and monitor their metabolism in MPO-implanted mice, FLI was performed by determining the IVIS spectrum after intravenous injection of 5HFeC NPs or Fe3O4-Cy7. Mice were first anesthetized with 1.5% isoflurane and FLI was conducted pre-injection as well as after 6, 12, 24, 48, 72, 96, 120, 144, and 168 h. The excitation and emission wavelengths were set to 724 and 788 nm, respectively. At 6 and 168 h post-injection, the mice were deeply anesthetized and euthanized to harvest the liver, spleen, stomach, lung, kidney, heart, intestine, left thigh, and right thigh for ex vivo imaging. In vivo FLI of atherosclerotic mice was performed before intravenous injection of 5HFeC NPs, as well as after 24 h and 72 h. At 72 h post-injection, the carotid arteries and aorta of mice were carefully excised and washed with PBS for ex vivo imaging. Quantitative analyses of in vivo and ex vivo imaging results were performed using Living Image Software (Caliper Life Sciences). MPO-implanted mice were analyzed by quantifying the relative fluorescence intensity (RFI) as follows: RFI = (LAFI - RAFI)/RAFI, where LAFI is the average fluorescence intensity within the ROI of the left thigh and RAFI is the average fluorescence intensity within the ROI of the right thigh.
MPI imaging
MPI imaging of the mice was performed using an MPI scanner (MOMENTUM, Magnetic Insight, Inc., Alameda, CA, USA) with a magnetic field gradient strength of 6 T/m. Mice were scanned along the z-axis of the scanner, with the excitation field (45kHz, 20mT peak amplitude) along the z-axis. MPO-implanted mice were anesthetized with a mixture of ketamine (100 mg/kg) and xylazine (10 mg/kg) before imaging. Subsequently, two-dimensional (2D) MPI imaging was performed at pre-injection, as well as after 6, 12, 24, 48, 72, 96, 120, 144, and 168 h. The scanner parameters were as follows: field of view (FOV): 6 × 4 cm; scan mode: isotropic; total time: 3 min. For 3D MPI imaging, images were captured with a FOV of 6 × 6 × 4 cm, scan mode: isotropic, number of projections = 35, total time: 30 min. MPO-implanted mice were analyzed by quantifying the relative MPI signal (RMS) as follows: RMS = (LAMS - RAMS)/RAMS, where LAMS is the average MPI signal within the ROI of the left thigh and RAMS is the average MPI signal within the ROI of the right thigh. To observe the MPI images of atherosclerotic plaques, atherosclerotic mice were sacrificed at 24 h post-injection and the liver and spleen were removed for examination as these organs exhibit high uptake of nanoparticles. 2D MPI imaging was immediately performed using the following parameters: FOV: 6 × 10 cm; scan mode: isotropic; total time: 5 min. For 3D MPI imaging, the parameters were as follows: FOV: 6 × 6 × 10 cm, scan mode: isotropic, number of projections = 35, total time: 55 min. VivoQuant software (VivoQuant 4.0, Invicro, Boston, MA, USA) was used to analyze the MPI images.
CT imaging
CT imaging was performed using a home-made micro-CT scanner. For MPO-implanted mice, the CT scan parameters were as follows: numbers of projections = 288; voltage: 90 kV; current: 88 μA, FOV: 100 mm; voxel size: 144 μm; scan time: 7 min. CT angiography was performed using a micro-CT (Quantum GX μCT System, PerkinElmer, Waltham, MA, USA) scanner. Atherosclerotic mice were intravenously injected with 100 µL ExiTron (TM) nano 12000 CT contrast agents 1 h prior to CT angiography. The CT scanner parameters were as follows: voltage: 90 kV; current: 88 μA, FOV: 45 mm; voxel size: 90 μm; scan mode: high-resolution; scan time: 14 min.
MPI/CT co-registration
Fiducial markers (2 µL of 5HFeC NPs at a concentration of 1 mg Fe/mL) were sealed in a plastic tube and fixed on the animal bed, and used for 2D and 3D registration of the MPI images with CT images. 3D MPI/CT was rigidly co-registered by VivoQuant software.
Histological analysis and immunohistochemistry
To assess the accumulation of 5HFeC NPs in the MPO-implanted area, the thighs and organs (heart, liver, spleen, lung, and kidney) of the MPO-implanted mice were extracted and embedded in 4% paraformaldehyde for histological sectioning. Prussian blue staining was performed to assess the accumulation of 5HFeC NPs in these tissues. Immunohistochemistry staining was performed to further confirm the expression of MPO in the thighs. Briefly, the thighs were embedded in optimal cutting temperature compound, frozen in liquid nitrogen, and stored at -20 °C until sectioning. Cryosections (5-µm-thick) were prepared, fixed in 4 °C acetone, and stained with anti-MPO antibody. To verify the formation of atherosclerotic plaques, the carotid arteries and aorta were isolated, embedded in 4% paraformaldehyde for 20 min, and stained with pre-warmed Oil Red O solution for 10 min. Bright-field images were acquired after washing with 60% isopropanol. To assess the atherosclerotic plaques, sections from the aortic arch and abdominal aorta were stained with H&E, Prussian blue, von Kossa, and picrosirius red stains. Immunohistochemical staining was performed to verify the expression of MPO, CD68, ɑ-SMA, CD31, and MCP-1 in the atherosclerotic plaques. Briefly, the vessel segments were embedded in OCT and snap frozen. Transverse cryosections were collected (5-µm-thick), fixed in 4 °C acetone, and stained with anti-MPO (1:200 dilution; catalog number: ab208670; Abcam, Cambridge, UK), anti-CD68 (1:200 dilution; catalog number: ab125212; Abcam, Cambridge, UK), anti- -SMA (1:200 dilution; catalog number: ab5831; Abcam, Cambridge, UK), anti-CD31 (1:1000 dilution; catalog number: ab182981; Abcam, Cambridge, UK), and anti-MCP-1 (1:100 dilution; catalog number: ab8101; Abcam, Cambridge, UK) antibodies. Tissue slices were imaged using a slice scanning system (Zeiss Axio Scan. Z1, Carl Zeiss AG, Germany). For plaque assessment, the percentage of the various plaque components was quantified as the positive area in the intima for each specific parameter divided by the total intimal plaque area. For quantification of calcification, microcalcification was defined as the positive area with a diameter of 1-30 μm in the intima [59]. ImageJ software (1.8.0 version) was used to perform quantitative analyses.
Statistical analysis
Statistical analysis was performed using SPSS 23.0 statistical software (SPSS, Inc., Chicago, IL, USA). Data are presented as the means ± standard deviations. Comparisons between two groups were performed using Student's t-test. One-way analysis of variance was conducted among multi-groups followed by post hoc analysis using Dunnet's test. P < 0.05 was regarded as statistically significant.
Abbreviations
3D: three-dimensional; 4-ABAH: 4-aminobenzoic acid hydrazide; 5HFeC NPs: 5-HT- Fe3O4-Cy7 nanoparticles; 5-HT: 5-hydroxytryptamine; CCK-8: cell counting kit-8; CTA: computed tomographic angiography; Cy7-NHS: cyanine 7 N-hydroxysuccinimide ester; DMEM: Dulbecco's modified Eagle's medium; EDC: N-(3-dimethylaminopropyl)-N'-ethylcarbodiimide hydrochloride; FBS: fetal bovine serum; FLI: fluorescence imaging; FOV: field of view; Gd-bis-5-HT-DTPA: Gd-bis-5-HT-diethylene triamine pentaacetic acid; H&E: hematoxylin and eosin; HFD: high-fat and high-cholesterol diet; MCP-1: monocyte chemoattractant protein-1; MI: myocardial infarction; MPI: magnetic particle imaging; MPO: myeloperoxidase; MRI: magnetic resonance imaging; NHS: N-hydroxysuccinimide; PBS: phosphate-buffered saline; PET: positron emission tomography; PSF: point spread function; RFI: relative fluorescence intensity; RMS: relative MPI signal; ROI: region of interest; SNAPF: sulfonaphthoaminophenyl fluorescein; SPECT: single-photon emission computerized tomography; SPIONs: superparamagnetic iron oxide nanoparticles; TEM: transmission electron microscopy.
Supplementary Material
Supplementary figures.
Supplementary figures. Supplementary movie 1: 3D reconstruction of MPI/CT imaging of the 5H-Fe3O4-Cy7 nanoparticles in the MPO-implanted mouse.
Supplementary movie 2: 3D reconstruction of MPI/CTA imaging of the 5H-Fe3O4-Cy7 nanoparticles deposited in the aorta of the atherosclerotic mouse.
Acknowledgements
The authors would like to acknowledge the instrumental and technical support of Multimodal biomedical imaging experimental platform, Institute of Automation, Chinese Academy of Sciences and Beijing Key Laboratory of Chronic Heart Failure Precision Medicine for the support during CT imaging of animals.
Funding
This work was supported in part by the National Key Research and Development Program of China under Grant 2017YFA0700401, 2016YFC0103803, and 2017YFA0205200; the National Natural Science Foundation of China under Grant 81671851, 81827808, 81870178, 81527805, 81971680, 81800221, 81671731 and 81227901; the CAS Strategic Priority Research Program under Grant XDB32030200, the Youth Innovation Promotion Association under Grant 2018167, and the CAS Scientific Instrument R&D Program under Grant YJKYYQ20170075 of the Chinese Academy of Sciences.
Author Contributions
The manuscript was written through contributions of all authors. W.T. and H.H. wrote the manuscript, designed, performed, and analyzed all the experiments. W.S. designed the nanoparticles. W.T. synthesized and characterized the nanoparticles. H.H. assisted with multimodality imaging, collected and analyzed data. Y.Z. helped with animal experiments and histology analysis. F.T., Q.M., and X.Y. assisted with the data analysis. J.T. and Y.C. conceived the project and supervised and coordinated all the work. All authors have given approval to the final version of the manuscript.
Competing Interests
The authors have declared that no competing interest exists.
References
1. Anderson JL, Morrow DA. Acute myocardial infarction. N Engl J Med. 2017;376:2053-64
2. Crea F, Libby P. Acute coronary syndromes: the way forward from mechanisms to precision treatment. Circulation. 2017;136:1155-66
3. Wildgruber M, Swirski FK, Zernecke A. Molecular imaging of inflammation in atherosclerosis. Theranostics. 2013;3:865-84
4. Tarkin JM, Joshi FR, Evans NR, Chowdhury MM, Figg NL, Shah AV. et al. Detection of atherosclerotic inflammation by (68)Ga-DOTATATE PET compared to [(18)F]FDG PET imaging. J Am Coll Cardiol. 2017;69:1774-91
5. Smits LP, Tiessens F, Zheng KH, Stroes ES, Nederveen AJ, Coolen BF. Evaluation of ultrasmall superparamagnetic iron-oxide (USPIO) enhanced MRI with ferumoxytol to quantify arterial wall inflammation. Atherosclerosis. 2017;263:211-8
6. Guo S, Shen S, Wang J, Wang H, Li M, Liu Y. et al. Detection of high-risk atherosclerotic plaques with ultrasound molecular imaging of glycoprotein IIb/IIIa receptor on activated platelets. Theranostics. 2015;5:418-30
7. Li S, Gou T, Wang Q, Chen M, Chen Z, Xu M. et al. Ultrasound/optical dual-modality imaging for evaluation of vulnerable atherosclerotic plaques with osteopontin targeted nanoparticles. Macromol Biosci. 2020;20:e1900279
8. Daghem M, Bing R, Fayad ZA, Dweck MR. Noninvasive imaging to assess atherosclerotic plaque composition and disease activity: coronary and carotid applications. JACC Cardiovasc Imaging. 2019
9. Signore A, Mather SJ, Piaggio G, Malviya G, Dierckx RA. Molecular imaging of inflammation/infection: nuclear medicine and optical imaging agents and methods. Chem Rev. 2010;110:3112-45
10. Su T, Wang YB, Han D, Wang J, Qi S, Gao L. et al. Multimodality imaging of angiogenesis in a rabbit atherosclerotic model by GEBP11 peptide targeted nanoparticles. Theranostics. 2017;7:4791-804
11. Wang Y, Chen J, Yang B, Qiao H, Gao L, Su T. et al. In vivo MR and fluorescence dual-modality imaging of atherosclerosis characteristics in mice using profilin-1 targeted magnetic nanoparticles. Theranostics. 2016;6:272-86
12. Saritas EU, Goodwill PW, Croft LR, Konkle JJ, Lu K, Zheng B. et al. Magnetic particle imaging (MPI) for NMR and MRI researchers. J Magn Reson. 2013;229:116-26
13. Khandhar AP, Ferguson RM, Arami H, Krishnan KM. Monodisperse magnetite nanoparticle tracers for in vivo magnetic particle imaging. Biomaterials. 2013;34:3837-45
14. Wegner F, Buzug TM, Barkhausen J. Take a deep breath - monitoring of inhaled nanoparticles with magnetic particle imaging. Theranostics. 2018;8:3691-2
15. Gleich B, Weizenecker J. Tomographic imaging using the nonlinear response of magnetic particles. Nature. 2005;435:1214-7
16. Ferguson RM, Khandhar AP, Kemp SJ, Arami H, Saritas EU, Croft LR. et al. Magnetic particle imaging with tailored iron oxide nanoparticle tracers. IEEE Trans Med Imaging. 2015;34:1077-84
17. Reimer P, Rummeny EJ, Daldrup HE, Balzer T, Tombach B, Berns T. et al. Clinical results with Resovist: a phase 2 clinical trial. Radiology. 1995;195:489-96
18. Tang Y, Yamashita Y, Arakawa A, Namimoto T, Mitsuzaki K, Abe Y. et al. Detection of hepatocellular carcinoma arising in cirrhotic livers: comparison of gadolinium- and ferumoxides-enhanced MR imaging. AJR Am J Roentgenol. 1999;172:1547-54
19. Bulte JWM. Superparamagnetic iron oxides as MPI tracers: a primer and review of early applications. Adv Drug Deliv Rev. 2019;138:293-301
20. Rausch PG, Pryzwansky KB, Spitznagel JK. Immunocytochemical identification of azurophilic and specific granule markers in the giant granules of Chediak-Higashi neutrophils. N Engl J Med. 1978;298:693-8
21. Sugiyama S, Okada Y, Sukhova GK, Virmani R, Heinecke JW, Libby P. Macrophage myeloperoxidase regulation by granulocyte macrophage colony-stimulating factor in human atherosclerosis and implications in acute coronary syndromes. Am J Pathol. 2001;158:879-91
22. Meuwese MC, Stroes ES, Hazen SL, van Miert JN, Kuivenhoven JA, Schaub RG. et al. Serum myeloperoxidase levels are associated with the future risk of coronary artery disease in apparently healthy individuals: the EPIC-Norfolk prospective population study. J Am Coll Cardiol. 2007;50:159-65
23. Ndrepepa G, Braun S, Mehilli J, von Beckerath N, Schomig A, Kastrati A. Myeloperoxidase level in patients with stable coronary artery disease and acute coronary syndromes. Eur J Clin Invest. 2008;38:90-6
24. Heslop CL, Frohlich JJ, Hill JS. Myeloperoxidase and C-reactive protein have combined utility for long-term prediction of cardiovascular mortality after coronary angiography. J Am Coll Cardiol. 2010;55:1102-9
25. Naruko T, Ueda M, Haze K, van der Wal AC, van der Loos CM, Itoh A. et al. Neutrophil infiltration of culprit lesions in acute coronary syndromes. Circulation. 2002;106:2894-900
26. Rashid I, Maghzal GJ, Chen YC, Cheng D, Talib J, Newington D. et al. Myeloperoxidase is a potential molecular imaging and therapeutic target for the identification and stabilization of high-risk atherosclerotic plaque. Eur Heart J. 2018;39:3301-10
27. Rodriguez E, Nilges M, Weissleder R, Chen JW. Activatable magnetic resonance imaging agents for myeloperoxidase sensing: mechanism of activation, stability, and toxicity. J Am Chem Soc. 2010;132:168-77
28. Criqui MH, Denenberg JO, Ix JH, McClelland RL, Wassel CL, Rifkin DE. et al. Calcium density of coronary artery plaque and risk of incident cardiovascular events. JAMA. 2014;311:271-8
29. Nakahara T, Dweck MR, Narula N, Pisapia D, Narula J, Strauss HW. Coronary artery calcification: from mechanism to molecular imaging. JACC Cardiovasc Imaging. 2017;10:582-93
30. Hutcheson JD, Goettsch C, Bertazzo S, Maldonado N, Ruiz JL, Goh W. et al. Genesis and growth of extracellular-vesicle-derived microcalcification in atherosclerotic plaques. Nat Mater. 2016;15:335-43
31. Htun NM, Chen YC, Lim B, Schiller T, Maghzal GJ, Huang AL. et al. Near-infrared autofluorescence induced by intraplaque hemorrhage and heme degradation as marker for high-risk atherosclerotic plaques. Nat Commun. 2017;8:75
32. Libby P. Mechanisms of acute coronary syndromes and their implications for therapy. N Engl J Med. 2013;368:2004-13
33. Li X, Guo S, Xu T, He X, Sun Y, Chen X. et al. Therapeutic ultrasound combined with microbubbles improves atherosclerotic plaque stability by selectively destroying the intraplaque neovasculature. Theranostics. 2020;10:2522-37
34. Ma S, Motevalli SM, Chen J, Xu MQ, Wang Y, Feng J. et al. Precise theranostic nanomedicines for inhibiting vulnerable atherosclerotic plaque progression through regulation of vascular smooth muscle cell phenotype switching. Theranostics. 2018;8:3693-706
35. Qiao H, Wang Y, Zhang R, Gao Q, Liang X, Gao L. et al. MRI/optical dual-modality imaging of vulnerable atherosclerotic plaque with an osteopontin-targeted probe based on Fe3O4 nanoparticles. Biomaterials. 2017;112:336-45
36. Jenkins WS, Vesey AT, Vickers A, Neale A, Moles C, Connell M. et al. In vivo alpha-V beta-3 integrin expression in human aortic atherosclerosis. Heart. 2019;105:1868-75
37. Strauss HW, Narula J. Imaging vulnerable plaque: a medical necessity or a scientific curiosity? J Am Coll Cardiol. 2017;69:1792-4
38. Inoue S, Egashira K, Ni W, Kitamoto S, Usui M, Otani K. et al. Anti-monocyte chemoattractant protein-1 gene therapy limits progression and destabilization of established atherosclerosis in apolipoprotein E-knockout mice. Circulation. 2002;106:2700-6
39. You H, Shang W, Min X, Weinreb J, Li Q, Leapman M. et al. Sight and switch off: nerve density visualization for interventions targeting nerves in prostate cancer. Sci Adv. 2020;6:eaax6040
40. Ronald JA, Chen JW, Chen Y, Hamilton AM, Rodriguez E, Reynolds F. et al. Enzyme-sensitive magnetic resonance imaging targeting myeloperoxidase identifies active inflammation in experimental rabbit atherosclerotic plaques. Circulation. 2009;120:592-9
41. Wu MC, Ho HI, Lee TW, Wu HL, Lo JM. In vivo examination of 111In-bis-5HT-DTPA to target myeloperoxidase in atherosclerotic ApoE knockout mice. J Drug Target. 2012;20:605-14
42. Shepherd J, Hilderbrand SA, Waterman P, Heinecke JW, Weissleder R, Libby P. A fluorescent probe for the detection of myeloperoxidase activity in atherosclerosis-associated macrophages. Chem Biol. 2007;14:1221-31
43. Zheng B, von See MP, Yu E, Gunel B, Lu K, Vazin T. et al. Quantitative magnetic particle imaging monitors the transplantation, biodistribution, and clearance of stem cells in vivo. Theranostics. 2016;6:291-301
44. Zheng B, Vazin T, Goodwill PW, Conway A, Verma A, Saritas EU. et al. Magnetic particle imaging tracks the long-term fate of in vivo neural cell implants with high image contrast. Sci Rep. 2015;5:14055
45. Jung KO, Jo H, Yu JH, Gambhir SS, Pratx G. Development and MPI tracking of novel hypoxia-targeted theranostic exosomes. Biomaterials. 2018;177:139-48
46. Zhou XY, Jeffris KE, Yu EY, Zheng B, Goodwill PW, Nahid P. et al. First in vivo magnetic particle imaging of lung perfusion in rats. Phys Med Biol. 2017;62:3510-22
47. Tay ZW, Chandrasekharan P, Zhou XY, Yu E, Zheng B, Conolly S. In vivo tracking and quantification of inhaled aerosol using magnetic particle imaging towards inhaled therapeutic monitoring. Theranostics. 2018;8:3676-87
48. Tay ZW, Chandrasekharan P, Chiu-Lam A, Hensley DW, Dhavalikar R, Zhou XY. et al. Magnetic particle imaging-guided heating in vivo using gradient fields for arbitrary localization of magnetic hyperthermia therapy. ACS Nano. 2018;12:3699-713
49. Chandrasekharan P, Tay ZW, Hensley D, Zhou XY, Fung BK, Colson C. et al. Using magnetic particle imaging systems to localize and guide magnetic hyperthermia treatment: tracers, hardware, and future medical applications. Theranostics. 2020;10:2965-81
50. Nissen SE. Vulnerable plaque and Einstein's definition of insanity. J Am Coll Cardiol. 2020;75:1383-5
51. den Hartog AG, Bovens SM, Koning W, Hendrikse J, Luijten PR, Moll FL. et al. Current status of clinical magnetic resonance imaging for plaque characterisation in patients with carotid artery stenosis. Eur J Vasc Endovasc Surg. 2013;45:7-21
52. Saam T, Hetterich H, Hoffmann V, Yuan C, Dichgans M, Poppert H. et al. Meta-analysis and systematic review of the predictive value of carotid plaque hemorrhage on cerebrovascular events by magnetic resonance imaging. J Am Coll Cardiol. 2013;62:1081-91
53. Ferrari VA, Wilensky RL. Intravascular magnetic resonance imaging. Top Magn Reson Imaging. 2007;18:401-8
54. Irkle A, Vesey AT, Lewis DY, Skepper JN, Bird JL, Dweck MR. et al. Identifying active vascular microcalcification by (18)F-sodium fluoride positron emission tomography. Nat Commun. 2015;6:7495
55. Graeser M, Thieben F, Szwargulski P, Werner F, Gdaniec N, Boberg M. et al. Human-sized magnetic particle imaging for brain applications. Nat Commun. 2019;10:1936
56. Franke J, Baxan N, Lehr H, Heinen U, Reinartz S, Schnorr J. et al. Hybrid MPI-MRI system for dual-modal in situ cardiovascular assessments of real-time 3D blood flow quantification - a pre-clinical in vivo feasibility investigation. IEEE Trans Med Imaging. 2020 PP
57. Spinowitz BS, Kausz AT, Baptista J, Noble SD, Sothinathan R, Bernardo MV. et al. Ferumoxytol for treating iron deficiency anemia in CKD. J Am Soc Nephrol. 2008;19:1599-605
58. Chen JW, Querol Sans M, Bogdanov A Jr, Weissleder R. Imaging of myeloperoxidase in mice by using novel amplifiable paramagnetic substrates. Radiology. 2006;240:473-81
59. Hutcheson JD, Goettsch C, Bertazzo S, Maldonado N, Ruiz JL, Goh W. et al. Genesis and growth of extracellular-vesicle-derived microcalcification in atherosclerotic plaques. Nat Mater. 2016;15:335-43
Author contact
![]() Corresponding authors: Email address: hui.huiac.cn (Hui Hui), jie.tianac.cn (Jie Tian), cyundai163.com (Yundai Chen, Tel: +86‐10‐55499009, Fax: +86‐10‐55499209)
Corresponding authors: Email address: hui.huiac.cn (Hui Hui), jie.tianac.cn (Jie Tian), cyundai163.com (Yundai Chen, Tel: +86‐10‐55499009, Fax: +86‐10‐55499209)