Impact Factor
- Issue 14; 2026
- Issue 13; 2026
- Issue 12; 2026
- Issue 11; 2026
- Issue 10; 2026
- Volume 16; 2026
- Advance Articles
- Past Issues
- Cover Images
- Cover Suggestion
- Index & Coverage
- Special Issues
Introduction
Methods
Results
Discussion
Conclusions
Abbreviations
Supplementary Material
Acknowledgements
References
International Journal of Biological Sciences
International Journal of Medical Sciences
 Global reach, higher impact

Theranostics 2021; 11(10):4957-4974. doi:10.7150/thno.55075 This issue Cite
Research Paper
Single-cell transcriptome analysis of the heterogeneous effects of differential expression of tumor PD-L1 on responding TCR-T cells
Renpeng Ding1,2*, Shang Liu1,2*, Shanshan Wang1,2*, Huanyi Chen1, Fei Wang1,2, Qumiao Xu1,3, Linnan Zhu1,5, Xuan Dong1,3, Ying Gu1,4, Xiuqing Zhang1,3, Cheng-Chi Chao1 ![]() , Qianqian Gao1,3,5
, Qianqian Gao1,3,5 ![]()
1. BGI-Shenzhen, Shenzhen 518083, China.
2. BGI Education Center, University of Chinese Academy of Sciences, Shenzhen 518083, China.
3. Guangdong Provincial Key Laboratory of Human Disease Genomics, Shenzhen Key Laboratory of Genomics.
4. Guangdong Provincial Key Laboratory of Genome Read and Write, BGI-Shenzhen, Shenzhen 518083, China.
5. Shenzhen Bay Laboratory, Shenzhen 518132, China.
*These authors contributed equally to this work.
Received 2020-10-26; Accepted 2021-1-26; Published 2021-3-5
Abstract

Rationale: TCR-T cell therapy plays a critical role in the treatment of malignant cancers. However, it is unclear how TCR-T cells are affected by PD-L1 molecule in the tumor environment. We performed an in-depth evaluation on how differential expressions of tumor PD-L1 can affect the functionality of T cells.
Methods: We used MART-1-specific TCR-T cells (TCR-TMART-1), stimulated with MART-127-35 peptide-loaded MEL-526 tumor cells, expressing different proportions of PD-L1, to perform cellular assays and high-throughput single-cell RNA sequencing.
Results: Different clusters of activated or cytotoxic TCR-TMART-1 responded divergently when stimulated with tumor cells expressing different percentages of PD-L1 expression. Compared to control T cells, TCR-TMART-1 were more sensitive to exhaustion, and secreted not only pro-inflammatory cytokines but also anti-inflammatory cytokines with increasing proportions of PD-L1+ tumor cells. The gene profiles of chemokines were modified by increased expression of tumor PD-L1, which concurrently downregulated pro-inflammatory and anti-inflammatory transcription factors. Furthermore, increased expression of tumor PD-L1 showed distinct effects on different inhibitory checkpoint molecules (ICMs). In addition, there was a limited correlation between the enrichment of cell death signaling in tumor cells and T cells and increased tumor PD-L1 expression.
Conclusion: Overall, though the effector functionality of TCR-T cells was suppressed by increased expression percentages of tumor PD-L1 in vitro, scRNA-seq profiles revealed that both the anti-inflammatory and pro-inflammatory responses were triggered by a higher expression of tumor PD-L1. This suggests that the sole blockade of tumor PD-L1 might inhibit not only the anti-inflammatory response but also the pro-inflammatory response in the complicated tumor microenvironment. Thus, the outcome of PD-L1 intervention may depend on the final balance among the highly dynamic and heterogeneous immune regulatory circuits.
Keywords: TCR-T, PD-L1, differential expression, single-cell RNA sequencing, melanoma
Introduction
Programmed cell death-ligand-1 (PD-L1) is the ligand of programmed death-1 (PD-1). They are encoded by CD274 and PDCD1, respectively. PD-L1 is expressed in many cancer tissues such as melanoma [1], a widely recognized immunogenic neoplasm. Expression of PD-L1 is undetectable in most normal tissues, but can be induced by inflammatory cytokines, especially interferon-γ (IFN-γ) in various cell types [2-4]. As a strategy to evade immune responses and impair T cell response, PD-L1 is often up-regulated on tumor cells and induces T cell anergy, exhaustion, or apoptosis upon engagement with PD-1 expressed on tumor infiltrating lymphocytes (TILs) [1, 5]. Expression of PD-L1 is not restricted to tumor cells; PD-L1 is also expressed on TILs and this expression correlates with aggressive tumors, demonstrating the immunosuppressive role of PD-L1 [6, 7]. Binding of PD-1 and PD-L1 impairs T cell activation by interfering with the Ras-Raf-MEK-ERK and PI3K-AKT signaling pathways that promote T cell proliferation and differentiation [8]. In addition to binding PD-1, PD-L1 has been reported to interact with CD80 in cis to modulate T cell function and the tumor microenvironment [9, 10].
The PD-1/PD-L1 signaling pathway plays an important role in tumor evasion from host immune responses [11]. Inhibitors of PD-1 and PD-L1 have been studied in various tumor types and have now been approved for treating many malignancies, including melanoma, non-small-cell lung cancer (NSCLC), and bladder cancer [12-16]. PD-L1 expression on tumor cells and tumor infiltrating antigen presenting cells (APCs) has been approved as a companion biomarker to aid clinicians in determining whether to use these inhibitors as therapies [17-22]. With these treatments, a positive correlation between higher levels of PD-L1 expression and higher response rates in melanoma has also been demonstrated [23-25]. Yet, some studies show that PD-L1 expression is insufficient in predicting a beneficial response from immune checkpoint inhibitor (CPI) therapy and PD-L1 expression level alone is a poor predictive biomarker of overall survival [26, 27].
While the role of PD-L1 has been studied in many literatures [4-6, 22, 28], elucidating the exact relationship between PD-L1 expression and T cell function in bulk T-cell populations has remained difficult. Furthermore, while T cell receptor-engineered T (TCR-T) cell therapy has shown promising results in treating solid tumors [29], few studies have systemically investigated how tumor PD-L1 can affect the functionality of tumor antigen-specific TCR-T cells. Thus, it is important to understand how PD-L1 and its expression levels on tumor cells at a single-cell level affects the efficacy of T-cell immunotherapy.
In this study, we conducted multiplex cytokine and cell cytotoxicity assays in conjugation with high-throughput single-cell mRNA sequencing (scRNA-seq) to investigate the immunoregulatory effect of tumor PD-L1 on responding TCR-T cells. Increased expression of tumor PD-L1 suppressed cell cytotoxicity and cytokine secretion of TCR-T cells in vitro, while the diverse capabilities of scRNA transcriptome analysis revealed that both anti-inflammatory and pro-inflammatory responses were triggered by the increased expression of tumor PD-L1, providing possible explanations for the contradicting results of using tumor PD-L1 expression to predict clinical efficacy of anti-PD-1/PD-L1 therapies. Our research is the first at the single-cell level to analyze the transcriptional features, as well as the cytokine and cytotoxic signatures, of antigen-specific TCR-T cells responding to different tumor PD-L1 ratios.
Methods
Cell lines and cell culture
HEK293T (ATCC, CRL-11268) and T2 (174×CEM.T2, CRL-1992) cell lines were purchased from ATCC, and MEL-526 (BNCC340404) cell line was purchased from BNCC. HEK293T and MEL-526 cells were cultured in DMEM (Gibco, 21063029) supplemented with 10% fetal bovine serum (Hyclone, SH30084.03HI), penicillin (100 IU/mL), and streptomycin (50 μg/mL). T2 cells were cultured in IMDM (Gibco, 12440053) supplemented with 20% fetal bovine serum (Hyclone, SH30084.03HI), penicillin (100 IU/mL), and streptomycin (50 μg/mL). CD8+ T cells were cultured in HIPP-T009 (Bioengine, RG0101302) supplemented with 2% fetal bovine serum (Hyclone, SH30084.03HI) containing IL-2 (20 ng/ml), IL-7 (10 ng/ml), and IL-15 (10 ng/ml).
Plasmid construction
TCRMART-1 sequence was identified from our previous work (data unpublished), and its constant regions were replaced by mouse TCR constant regions α and β, respectively, to prevent mispairing with endogenous TCR. TCR α chains and β chains were linked by a P2A self-cleaving peptide. The recombinant DNA encoding TCRMART-1 was synthesized by GeneScript (Nanjing, China) and ligated into pRRLSIN.cPPT.PGK vector (Addgene, 12252).
PD-L1 cDNA ORF Clone in Cloning Vector was purchased from Sino Biological (HG10084). PD-L1 cDNA was cloned into pRRLSIN.cPPT.PGK vector (Addgene, 12252) with ClonExpress II One Step Cloning Kit (Vazyme, C112) according to the user manual.
Lentivirus production
293T cells were transfected with a mixture of plasmids and packaging constructs of interest (PsPAX2 and PMD2G), as previously described [30]. The culture supernatants were collected 72 h after transfection and filtered through a 0.45 µM filter. Subsequently, the supernatants were concentrated by ultracentrifugation at 35,000 rpm for 90 min. The pellet was suspended and stored at -80 °C.
Generation of tumor cells expressing PD-L1
After lentivirus infection of PD-L1 lentivirus into MEL-526 cells for 2 days, PD-L1+ cells were sorted by FACS. Different proportions of PD-L1+ tumor cells were obtained by mixing wildtype and PD-L1+ MEL-526 cells.
Generation of MART-1-specific T cells
Human Peripheral Blood Mononuclear Cells (PBMCs) were isolated from the blood of HLA-A*0201-restricted healthy donors with informed consent. CD8+ T cells were purified from PBMC via human CD8 MicroBeads (Miltenyi Biotec, 130-045-201) and activated with T Cell TransAct (Miltenyi Biotec, 130-111-160). After 36-48 h, CD8+ T cells were transduced with TCRMART-1 lentivirus at MOI = 25 in a 6-well or 12-well plate. Simultaneously, polybrene was added to the culture at a final concentration of 2 μg/ml to promote infection efficiency. The well plate was then centrifuged at 800 g at room temperature for 30 min.
Peptide synthesis
MART-1 originated peptide ELAGIGILTV (HLA-A*0201) was synthesized by GenScript (Nanjing, China) with a purity of ≥ 99.0%. Peptides were dissolved with 100% dimethyl sulfoxide (DMSO; Sigma-Aldrich, D5879-500ML) to 10 mg/ml, and were stored at -20 °C.
TCR-T cell stimulation with target tumor cell
TCR-T cells and MEL-526 cells (5×10^5 cells/ml concentration, in 200 μl), either pulsed with peptide (final concentration 10 μg/mL) or not, were incubated for 24 h in a round bottom 96-well plate. Afterwards, the co-culture was subjected to scRNA-seq. Unstimulated TCR-T cells (5×10^5 cells/ml) were incubated for 6 h alone before being subjected to scRNA-seq.
Intracellular staining
Cells were perforated and fixed using Cytofix/Cytoperm kit (BD Pharmingen, 554715). The following antibodies were used: Allophycocyanin (APC)-anti-HLA-A2 antibody (eBioscience, 17-9876-42), Phycoerythrin (PE)-anti-human CD8a antibody (eBioscience, 12-0086-42), APC-anti-human CD274 (PD-L1) antibody (BD Pharmingen, 563741), PE-anti-human CD279 (PD-1) antibody (Biolegend, 367404), PE anti-mouse TCR β chain Antibody (Biolegend, 109207), APC anti-human IFN γ (eBioscience, 502512), PE-anti-human Granzyme B (BD Pharmingen, 561142), APC anti-human CD107a (Biolegend, 328620), PE-anti-Ki67 antibody (Abcam, ab270650).
Detection and quantification of surface and mRNA expression of PD-L1
PD-L1 expression on T cells was quantified at both protein and RNA levels. For the detection of surface PD-L1 molecules, Tnull and TCR-TMART-1 were co-cultured with MEL-526 cells at an effector-to-target ratio of 1:1 for 24 h. The mixed cells were subsequently harvested and stained with anti-mouse TCR β chain-PE, anti-CD3-FITC, and anti-PD-L1-APC antibodies, and then detected by BD FACS AriaIII. For the mRNA quantification, CD274 in each cell was normalized and calculated according to the data generated from the scRNA sequencing. T cells containing reads that mapped to the CD274 locus were considered as PD-L1 positive cells.
Cell cytotoxicity assays
Target cells were labeled with Carboxyfluorescein succinimidyl ester (CFSE; Invitrogen) and co-cultured with 50% TCR-T cells at an E:T ratio of 1:2. After 24 h, cells were collected and stained with PI and subsequently detected by FACS.
Cytokine secretion measurement
The secretion of TNF-α, granzyme A, and granzyme B by T cell were evaluated using a BDTM cytometric bead array (CBA) system. Tnull or TCR-TMART-1 cells were co-cultured with MEL-526 cells either pulsed with or without peptide and supernatants were collected 24 h later. CBA assay was performed according to the instruction manual.
Statistical analysis
Data analysis was performed using PRISM 6 (GraphPad Software) and RStudio. *P < 0.05, **P < 0.01, ***P < 0.001. Values are presented as mean standard deviation (SD). Error bars represent the SD.
ScRNA-seq
Single-cell 3' mRNA transcriptome profiling was performed using a negative pressure orchestrated DNBelab C4 system according to the workflow [31].
ScRNA-seq data preprocessing
For all the samples, the iDrop Software Suite (v.1.0.0) was used to perform sample de-multiplexing, barcode processing, and single-cell 3' unique molecular identifier (UMI) counting with default parameters. Processed reads were then aligned onto the complete UCSC hg38 human genome by splicing-aware aligner STAR with default parameters. Valid cells were automatically identified based on the UMI number distribution of each cell. The following filtering criteria was used to obtain high-quality single cells: the number of genes in each cell in the range of 400 to 6000, the ratio of mitochondrial genes less than 0.05, and the number of UMI greater than 1000.
Unsupervised clustering
The expression matrix obtained in the above steps was used as input to Seurat v. 3 to perform batch effect correction, standardization, dimensionality reduction, and clustering. First, the “LogNormalize” function was applied to normalize the data. Next, the “vst” method in the “FindVariableFeatures” function was used to detect variable genes, and the top 3000 variable genes were selected for downstream analysis. Then, the “FindIntegrationAnchors” and “IntegrateData” functions were used to correct batch effects. Finally, the top 3000 variable genes were applied for PCA dimensionality reduction. The UMAP was performed on the top 20 principal components for visualizing these cells. At the same time, graph-based clustering was performed on the PCA-reduced data for clustering analysis with Seurat v.3. The resolution was set to one to obtain the most representative result.
Differential gene expression analysis
We applied the FindMarkers to differential gene expression analysis. For each cluster of T cells and tumor cells, DEGs were generated relative to all of the other cells. A gene was considered significant with adjusted P < 0.05 and logFC > 0.25. To compare DEGs across CD8+ T cells and tumor cells under different experimental conditions, the limma method was used with the parameters recommended in the user guide for analysis. DEGs were identified when they met the following criteria: FDR adjusted p value of F test < 0.01.
Developmental trajectory inference
The Monocle (version 2) algorithm with the signature genes of different functional clusters was applied to order CD8+ T cells excluding clusters expressing proliferating or mitochondrial genes in pseudo time. UMI value was first converted into normalized mRNA counts by the “relative2abs” function in monocle and created an object with parameter “expressionFamily = negbinomial.size” according to the Monocle tutorial. The batch effect was regressed out using the “reduceDimension” function with default parameters. The CD8+ T cell differentiation trajectory was determined by the default parameters of Monocle.
Next, the BEAM function was used to detect genes which separate cells into the calculated states. We used the plot_multiple_branches_heatmap function to separate the above gene set with a q-value less than or equal to 10e-300 with hierarchical clustering using num_clusters = 3 and“branches” set to the terminal branchpoints for each respective sample.
Gene set enrichment analysis
Gene Ontology (GO) enrichment analysis was performed on the differential genes of each cluster, and the results were used for cell type definition. The “enrichGO” function in the “clusterProfiler” package was used to perform GO analysis using the corresponding default parameters. Pathways with the q value < 0.05 corrected by FDR were used for analysis.
GSVA
GSVA was used to identify the molecular phenotype of each cluster with the normalized UMI data. The average normalized expression across T cell clusters was first obtained. Then, GSVA scores of gene sets for different clusters were calculated. GSVA values were plotted as a heatmap using R package “pheatmap”.
Data sets and processing
The expression profiles and clinical information of human metastatic melanoma was downloaded from GEO website (GSE78220). The patients on-treatment or with previous MAPKi treatment were discarded. These samples were split into two groups (PDL1high and PDL1low) according to the expression levels of CD274 in tumor cells (cutoff = 0.003). To correct for the effect of cancer cell levels within each sample, the expression of CD274 in tumor was divided by that of the geometric mean of cancer marker genes (HSPB1 and KRT18). The cutoff of relative expression was determined by the distribution of the relative expression and median value. The samples with relative expression below the cutoff were categorized as the PDL1low group and those with relative expression above the cutoff were classified as the PDL1high group. Next, the relative expression of selected genes in CD8+ T cell was calculated as above. The expression of selected genes was divided by the geometric mean of CD8+ T cell marker genes (CD3D, CD3E, CD3G, CD8A and CD8B) for the effect of different levels of tumor PD-L1. The relative expression of selected genes was compared between PDL1low and PDL1high groups. The p value was determined by Permutation test.
Data availability
The data that support the findings of this study have been deposited into CNGB Sequence Archive (CNSA: https://db.cngb.org/cnsa/) of CNGBdb with accession number CNP0001109.
Ethics approval and consent to participate
The study was approved by the Institutional Review Board on Bioethics and Biosafety of BGI. A written informed consent was regularly obtained from all donors.
Results
Increased tumor PD-L1 expression suppressed cytotoxicity and cytokine secretion of TCR-TMART-1
Cytotoxicity and cytokine secretion assays, along with scRNA-seq, were conducted to evaluate TCR-T cells stimulated by MEL-526 melanoma cells with different proportions of PD-L1 expression (Figure 1A). This approach made it possible to quantitatively analyze the T-cell activation state in relation to their subtypes and gene expression. HLA-A*0201/Melan-A-specific TCR sequence (designated as TCRMART-1) was obtained from T cells stimulated with Melan-A (aa27-35, LAGIGILTV) peptide (data unpublished). Melan-A, also known as MART-1, is a melanocytic marker [32]. Human TCRα and TCRβ sequences fused with the murine TCR constant region were synthesized and cloned into a lentiviral vector (Figure S1A). T cells that either expressed or did not express TCRMART-1 were designated as TCR-TMART-1 and Tnull, respectively. After lentiviral transduction into CD8+ T cells, 17.5% of T cells was TCR-TMART-1, which reached 97.2% after fluorescence-activated cell sorting (FACS) (Figure S1B). To verify the cytolytic capacity [33-35], TCR-TMART-1 were stimulated by peptide-loaded MEL-526 cells or a mock control at an effector-to-target (E:T) ratio of 1:1. Compared to Tnull, TCR-TMART-1 killed MEL-526 cells more efficiently when MEL-526 cells were loaded with the MART-127-35 peptide (Figure 1B). TCR-TMART-1 similarly killed T2 cells, another target cell line (Figure S1C).
PD-L1 expression on melanoma MEL-526 cells pulsed with MART-126-35 peptide inhibited cytotoxicity and cytokine secretion of TCR-TMART-1. (A) Overview of the study design. Tnull, control T cells; TCR-TMART-1, MART-1 specific TCR-T cells. (B) TCR-TMART-1 cytotoxicity against MEL-526 cells loaded with or without MART-126-35 peptide at an E:T ratio of 1:1. (C) Flow cytometric analysis of PD-L1 expression on PD-L1low, PD-L1int, and PD-L1high MEL-526 cells. (D) TCR-TMART-1 cytotoxicity was inhibited by tumor PD-L1 in a dose dependent manner. T and TCR-T cells were incubated with different proportions of PD-L1+ MEL-526 cells for 24 h. (E) Secretion of Granzyme A and Granzyme B by TCR-TMART-1 was inhibited by increased tumor PD-L1. Tnull and TCR-TMART-1 were co-cultured with MART-126-35 peptide loaded-MEL526 cells with different proportions of PD-L1 expression at an E:T ratio of 1:1, and the secretion was detected by the Cytometric Bead Array (CBA) system. (F) Secretion of TNF-α by TCR-TMART-1 was inhibited by an increased proportion of PD-L1 expression among MEL-526 cells. (G) Secretion of IFN-γ and IL-2 by TCR-TMART-1 was inhibited by an increased percentage of PD-L1 expression among MEL-526 cells. Error bars represent S.E.M. (N = 3). (∗) 0.01 < P < 0.05, (∗∗) 0.001 < P < 0.01, (∗∗∗) P < 0.001. NS, not significant. N = 3.
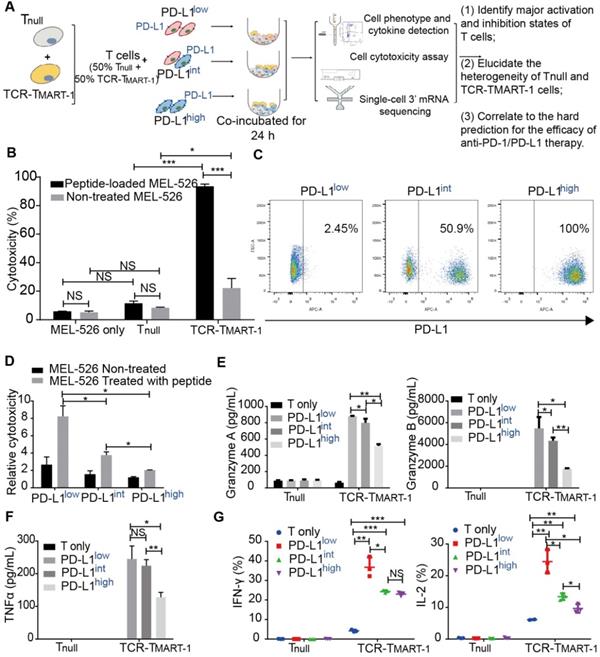
To investigate the immunosuppressive role of tumor PD-L1, PD-L1 was overexpressed (OE) on MEL-526 cells (Figure S1D). Different percentages of PD-L1+ tumor cells were obtained by mixing OE with wild-type (WT) MEL-526 cells based on the clinical PD-L1 expression ratio [36, 37]. Three tumor cell populations with different percentages of MEL-526 expressing PD-L1 were used in the study: PD-L1low (without exogenous PD-L1, 2.45%), PD-L1int (intermediate, 50.9%), and PD-L1high (high, 100%) (Figure 1C). The cytolytic activity of TCR-TMART-1 was inhibited by increasing the percentage of tumor cells expressing PD-L1 (Figure 1D), affecting the secretion of Granzymes (Figure 1E) and pro-inflammatory cytokines in Tnull and TCR-TMART-1, including TNFα (Figure 1F), IFNγ, and IL2 (Figure 1G).
Distinct clusters of different cell subpopulations were identified by single-cell transcriptome analysis
To investigate the effect of increased percentages of tumor PD-L1 on gene expression, single-cell transcriptome profiling was performed using a negative pressure orchestrated DNBelab C4 system [31]. Transcriptome profiling of a total of 20,888 cells from four conditions was obtained after filtering out cells of low quality (Figure 2A). To investigate the intrinsic T cell heterogeneity, unsupervised clustering was performed (Figure 2B) after adjusting for the batch effect between these groups (Figure S2A). T and tumor cells were identified by the expression of classic cell type markers, including PTPRC, CD3G, CD3E, TRBC1, and CD8B for T cells and MAGEA 4 for MEL-526 cells (Figure 2C). Based on the expression of signature genes, T cells were composed of clusters 1, 2, 5, 6, 7, 8, 9, 11, 12, and 14 (Figure 2B). Exogenous TCRMART-1 was detected in clusters 1, 8, 12, 2, 6, and 11, with especially strong signals in the last three clusters (Figure S2B). Furthermore, differentially expressed genes (DEGs) and known functional markers indicated clusters of naïve, activated, cytotoxic, and proliferating CD8+ T cells (Figure 2B, 2D). Tumor cell clusters 0, 3, 4, 10, 13, 15, 16, and 17 were further identified as well (Figure S2C).
Single-cell level analysis revealed distinct cell subpopulations. (A) Cell number of Tnull, TCR-TMART-1, MEL-526 (nonPD-L1), and MEL-526 (PD-L1 OE) of four experiment groups. (B) The UMAP projection of T cells and tumor cells, showing 18 main clusters in different colors. The phenotype description of each cluster is determined by marker gene expression of T cells and tumor cells. (C) Violin plots showing the expression profile of marker genes of T cells and tumor cells in the 18 clusters. (D) Heatmap of T cell clusters with unique signature genes. (E) The ordering of T cells along pseudotime in a two-dimensional state-space defined by Monocle2. Cell orders were inferred from the expression of most dispersed genes across T cell populations. Each point corresponds to a single cell, and each color represents a T cell cluster. (F) Heat map showing the gene expression that separated cells into the specialized states detected by BEAM.
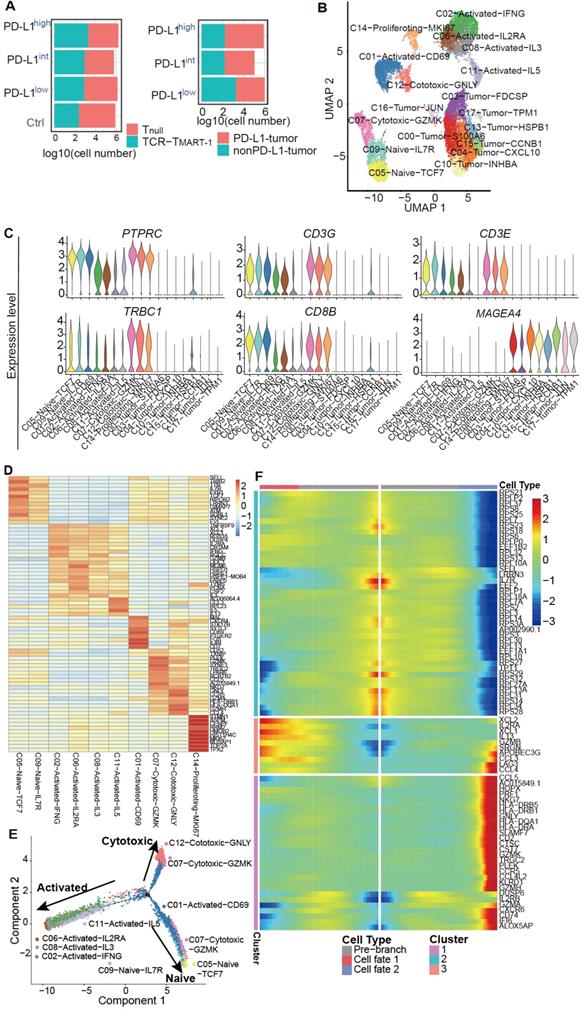
To understand T cell state transitions, an unsupervised inference method Monocle 2 [38] was applied to construct the potential development trajectories of nine T cell clusters (cluster 14 was excluded due to its distinct expression of MKI67). Cells from all clusters were aggregated according to expression similarities to form a relative process in pseudotime (Figure S2D), which began with clusters 5 and 9 naïve cells, followed by C07-Cytotoxic-GZMK and C01-Activated-CD69 (Figure 2E). C06, C08, C02, and C11 activated cells were located in opposite directions with C12 and C07 cytotoxic cells in the pseudotime trajectory plot, demonstrating the diverse functions of these cells. Continuous transcriptome changes following the two different differentiation directions were analyzed (Figure 2F). The expression of XCL2, IL2RA, XCL1, IL13, and GZMB etc. was increased when differentiating towards the cell-activated direction (cell fate 1), while the expression of CCL5, NKG7, GNLY, CST7, and GZMK etc. was upregulated when following the cell-cytotoxic direction (cell fate 2) (Figure 2F). In addition, the expression of genes encoding ribosome proteins was downregulated in both directions, as were the naïve marker genes SELL and IL7R (Figure 2F). Taken together, while T cells differentiated into activated and cytotoxic populations, the expression of genes related to T cell activation and cytotoxicity was upregulated respectively, and the expression of naïve marker genes was downregulated, reflecting the differentiation directions.
T cell clusters responded divergently to the increased expression of tumor PD-L1
To reveal the structure of the overall T cell population, T cells were classified into Tnull and TCR-TMART-1, and their cluster compositions were investigated. Cluster composition of the control (Ctrl) group was different than that of groups stimulated by tumor cells (Figure 3A). After stimulation, the percentage of C02-Activated-IFNG and C06-Activated-IL2RA of TCR-TMART-1 was downregulated, while the fragment of C01-Activated-CD69, C11-Activated-IL15, and C12-Cytotoxic-GNLY was upregulated with increased tumor PD-L1 levels (Figure 3B). Though these cell clusters were all activated or cytotoxic, their percentages were paradoxically modified upon stimulation with tumor cells expressing different ratios of PD-L1. Since not all the activated or cytotoxic T cells were suppressed by a high expression of tumor PD-L1, blocking PD-L1 might downregulate some anti-tumor T cell subpopulation contributing to the complicated possibilities. On the other hand, clusters of Tnull were not dramatically changed compared to TCR-TMART-1 clusters, except C11 which was upregulated with increased tumor PD-L1 (Figure 3B). These results implied that TCR-TMART-1 was more sensitive than Tnull to increasing levels of tumor PD-L1.
Various responses between T cell clusters, and Tnull and TCR-TMART-1 to different levels of tumor PD-L1. (A) Cluster composition of Tnull and TCR-TMART-1. (B) The proportion distribution of T cell clusters with the increased tumor PD-L1. (C) The bar plot shows the proportion distribution of cells expressing CTLA4, HAVCR2 (TIM3), LAG3, PDCD1, TIGIT, and VSIR among the five T cell clusters, respectively (cutoff: UMI of the gene > 0). (D) The bubble plot shows the proportion distribution of T cells expressing BCL2L11, CASP3, CASP8, CASP9, MKI67, and TP53 in TCR-TMART-1 responding to differential proportions of PD-L1+ tumor, among the five clusters respectively. The size of the point shows the mean expression of genes in the corresponding T cell population. The violin shows the expression distribution of BCL2L11 among the five clusters. (E) Differentially expressed genes in TCR-TMART-1 responding to differential proportions of PD-L1+ tumor. (F) The expression distribution of XCL1, TNFRSF9, DUSP4, and MIF in TCR-TMART-1 responding to differential proportions of PD-L1+ tumor. (G) Bubble plot showing the top 10 pathways in Tnull (left) and TCR-TMART-1 (right) compared to the control group, respectively. The color represents pvalue and the size represents gene ratio.
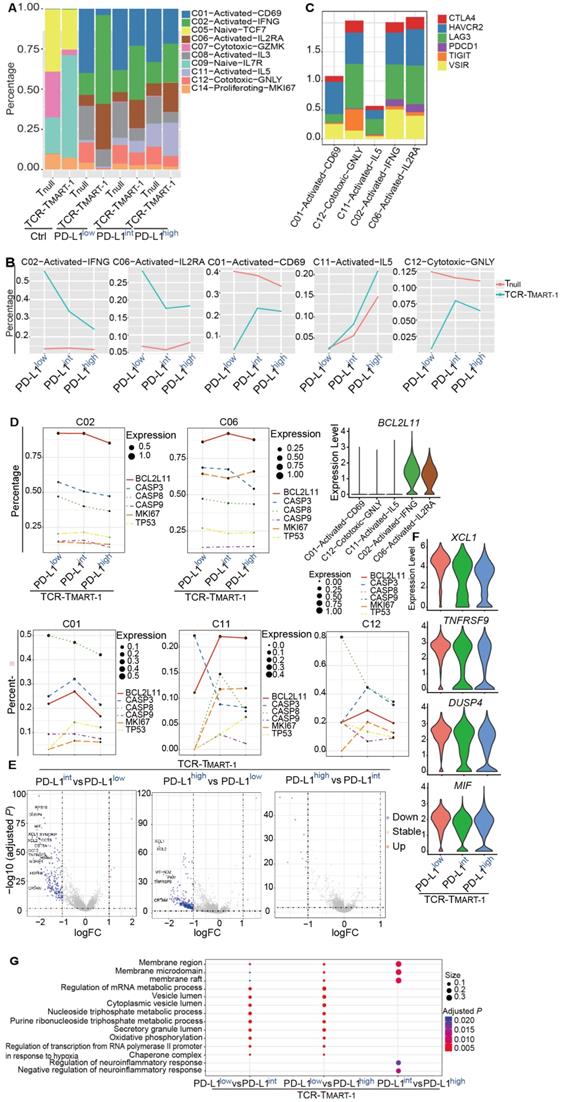
Next, the heterogeneity of these five clusters was examined and the top 10 DEGs found were quite distinct (Figure S3A). In addition, cell cytokines, including IFNG, IL2, and TNFA, or cytotoxic genes such as GNLY, PRF1, GZMA, and GZMB were not found regularly expressed in these clusters (Figure S3B). Similar to the exhaustion markers, expression of PDCD1 was rarely found in C01, C12, or C11, but was uniquely detected in C02 and C06, the percentages of which were decreased with higher expression of tumor PD-L1 (Figure 3C). Furthermore, higher expression of VSIR was discovered in C02 and C06 as well (Figure 3C), indicating clusters with higher expression of PDCD1 and VSIR may tend to be downregulated by increased expression levels of tumor PD-L1.
Changes in percentages of different T cell clusters with increased tumor PD-L1 might be caused by reduced proliferation or elevated cell death. To clarify the role of cell proliferation and cell death in this process, the expression of the key genes associated with increased tumor PD-L1 was analyzed. Expression of proliferation gene MKI67 and apoptotic genes, including TP53, BCL2L11, CASP3, CASP 9, and CASP 8 was not dramatically changed in C02 and C06 (Figure 3D), demonstrating that the downregulation of C02 and C06 might not be due to the reduced proliferation or upregulated cell apoptosis. However, C02 and C06 continually expressed higher levels of BCL2L11 compared to C01, C11, and C12 (Figure 3D). Moreover, the expression of MKI67 increased with higher levels of tumor PD-L1 in C01, C11, and C12, while the expression of certain apoptotic genes, such as CASP8 in C01 and C12, and CASP3 in C11, was downregulated (Figure 3D). Thus, the increased percentages of C01, C11, and C12 with increasing tumor PD-L1 levels might be caused by upregulated cell proliferation and reduced cell death.
In addition to T cell clusters, Tnull and TCR-TMART-1 responded differently to increased levels of tumor PD-L1. TCR-TMART-1 was affected more than Tnull by increased tumor PD-L1 levels (Figure 3E, S3C), and TCR-TMART-1 targeting PD-L1low tumors expressed higher levels of not only activation genes, such as XCL and TNFRSF9, but also anti-inflammatory genes, such as DUSP4 [39] and MIF [40], compared to the TCR-TMART-1 targeting PD-L1int and PD-L1high tumors (Figure 3E, 3F). Enriched signaling pathways were then analyzed. Different signaling pathways were enriched in Tnull and TCR-TMART-1 after encountering tumor cells (Figure S3D). Compared to TCR-TMART-1 targeting PD-L1int and PD-L1high, TCR-TMART-1 targeting PD-L1low enriched metabolic and vesicle lumen related signaling pathways (Figure 3G). However, distinct pathways including the membrane region, membrane microdomain, and raft were enriched in TCR-TMART-1 targeting PD-L1int compared to that targeting PD-L1high (Figure 3G), though there was no clear evidence as to why these signaling pathways were most affected by different percentages of tumor PD-L1.
Differential PD-L1 expression heterogeneously regulated the genes associated with TCR-TMART-1 functionality
The expression of cytokines, chemokines, and transcription factors was analyzed to further study the heterogeneity of T cell populations. With increased tumor PD-L1, expression of activation and cytotoxicity marker genes, including IFNG, TNFSF9, TNFSF14, CSF2, and IL2, were downregulated in both Tnull and TCR-TMART-1 (Figure 4A), consistent with results of cytokine secretion assays (Figure 1F-G). In addition, in TCR-TMART-1 stimulated with PD-L1high, not only was the expression of anti-inflammatory cytokines, such as IL10, IL13, and IL19, upregulated, but the expression of pro-inflammatory cytokines, such as IL12A, IL5, IL1A, and IL1b, was also upregulated (Figure 4A). Moreover, anti-inflammatory IL13 was generally expressed by C02, C06, C08, C11, C12, and C14 of Tnull and TCR-TMART-1, while pro-inflammatory IL5 was expressed by C11 and C06 of Tnull, and C11 and C08 of TCR-TMART-1 (Figure 4B). Little anti-inflammatory IL10 and IL19, or pro-inflammatory IL12A, IL1A, and IL1B was expressed (Figure S4A). These results implied that both anti-inflammatory and pro-inflammatory cytokines could be upregulated by increased tumor PD-L1, and secreted by the same cluster. This further suggested that PD-L1 blockade might downregulate certain pro-inflammatory cytokines in some subsets of immune cells, leading to mixed efficacy results in clinical applications.
Influences of increased tumor PD-L1 on cellular and molecular responses of T cells. (A) The expression profile of cytokines in Tnull and TCR-TMART-1. (B) The expression distribution of IL13 and IL5 in Tnull and TCR-TMART-1 responding to PD-L1high. (C) The expression profile of chemokines in Tnull and TCR-TMART-1. (D) The expression distribution of CCL4 and CCR5 in T cell clusters of Tnull and TCR-TMART-1 responding to differential proportions of PD-L1+ tumor. (E) The expression profile of transcription factors in Tnull and TCR-TMART-1. (F) The expression distribution of NKFB1, GATA3, HIF1A, STAT4, TBX21, IRF8, and STAT1 in TCR-TMART-1 responding to differential proportions of PD-L1+ tumor. (G) The violin showing the expression levels of STAT3, IRF4, CEBPB, and AHR in TCR-TMART-1 responding to differential proportions of PD-L1+ tumor.
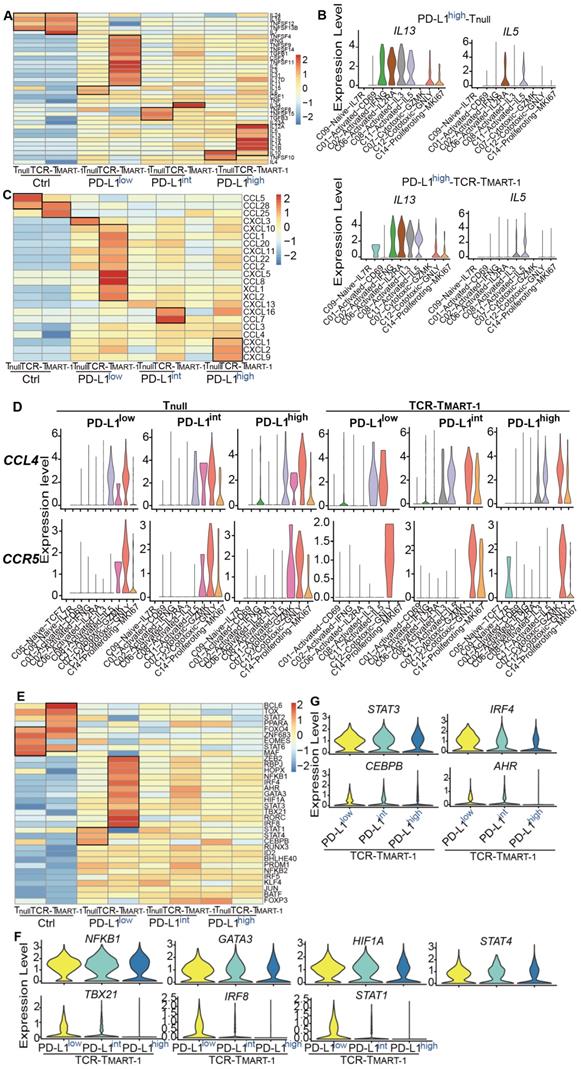
Chemokines were expressed higher in TCR-TMART-1 than Tnull after antigen stimulation (Figure 4C). Since tumor PD-L1 may affect chemokine secretion and cell recruitment, the expression of CCL4, which was expressed similarly between Tnull and TCR-TMART-1 targeting PD-L1low-, PD-L1int-, and PD-L1high-expressing tumor cells, was chosen for analysis. Differential expression patterns of CCL4 and its receptor gene CCR5 between Tnull and TCR-TMART-1 were discovered (Figure 4D). In Tnull, the common clusters expressing CCL4 were C11, C07, C12, and C14, except the additional cluster C02 targeting PD-L1high tumor cells. CCL4 in Tnull all recruited C07, C12 and C14 cell clusters by expressing CCR5 (Figure 4D). The expression of CCL4 and CCR5 was more diverse in TCR-TMART-1 than in Tnull, and CCL4 might recruit different cell clusters with the increasing tumor PD-L1 (Figure 4D). Specifically, CCL4 expressed in TCR-TMART-1 targeting PD-L1high tumors could recruit C05-Naïve-IL7R cells by expressing CCR5, which might result in a difference from other groups (Figure 4D). In conclusion, the chemokine expression and cell recruitment regulated by increased percentages of tumor PD-L1 might result in the mixed predictions seen in evaluating the efficacy of anti-PD-1/PD-L1 therapies using tumor PD-L1 as the sole biomarker.
Unique expression patterns of transcription factors (TFs) was also discovered in Tnull and TCR-TMART-1 populations. The expression of ZEB2, RBPJ, NFKB1, GATA3, IRF4, and STAT3, which are important for T cell activation and differentiation [41] [42], were higher in TCR-TMART-1 cultured with PD-L1low tumors (Figure 4E). With increasing levels of tumor PD-L1, the expression of transcription factors for Th1, Th2, or M1 macrophages, including NFKB1, GATA3, HIF1A, STAT4, TBX21, IRF8, and STAT1, was downregulated (Figure 4F). However, the expression of transcription factors including STAT3, IRF4, CEBPB, and AHR for suppressive cell subsets such as regulatory T (Treg) cells and M2 macrophages was also decreased (Figure 4G). Therefore, increased tumor PD-L1 expression causes downregulation of both pro-inflammatory and anti-inflammatory transcription factors, which might partially explain the complicated effects brought on by increasing percentages of tumor PD-L1 and why standalone PD-L1inhibition might not always result in an efficacious anti-tumor response in patients.
Increased tumor PD-L1 modulated both inhibitory and stimulatory checkpoint molecules in T cells
Blockade of PD-1 has been reported to lead to a compensatory upregulation of other checkpoint pathways [43]. Thus, we analyzed whether increased tumor PD-L1 affected other checkpoint molecules. With increased tumor PD-L1, the expression of inhibitory checkpoint molecules (ICMs), including ADORA2A, BTLA, CD160, and PDCD1, was downregulated while the expression of IDO1 was upregulated (Figure 5A). ADORA2A and IDO1 were expressed more in TCR-TMART-1 than in Tnull, while HAVCR2 and LAG3 were generally expressed in Tnull and TCR-TMART-1 (Figure 5B). Taken together, the contrary influences on different ICMs might lead to the heterogeneous response to tumor PD-L1, resulting in the mixed predictions on the efficacy of anti-PD-1/PD-L1 therapies based on tumor PD-L1 levels.
Increased tumor PD-L1 influenced both inhibitory and stimulatory checkpoint molecules in T cells. (A) Expression of inhibitory checkpoint molecules (ICMs) in Tnull and TCR-TMART-1 with increased ratios of PD-L1+ tumor cells. (B) The bar plot shows the proportion distribution of cells expressing different ICMs in Tnull and TCR-TMART-1 targeting different ratios of PD-L1+ tumor cells (cutoff: UMI of the gene > 0). (C) Expression of stimulatory checkpoint molecules (SCMs) in Tnull and TCR-TMART-1. (D) The bar plot shows the proportion distribution of cells expressing different SCMs in Tnull and TCR-TMART-1 targeting different ratios of PD-L1+ tumor cells (cutoff: UMI of the gene > 0). (E) The expression distribution of ICOS in cell clusters of Tnull and TCR-TMART-1 responding to differential proportions of PD-L1+ tumor.
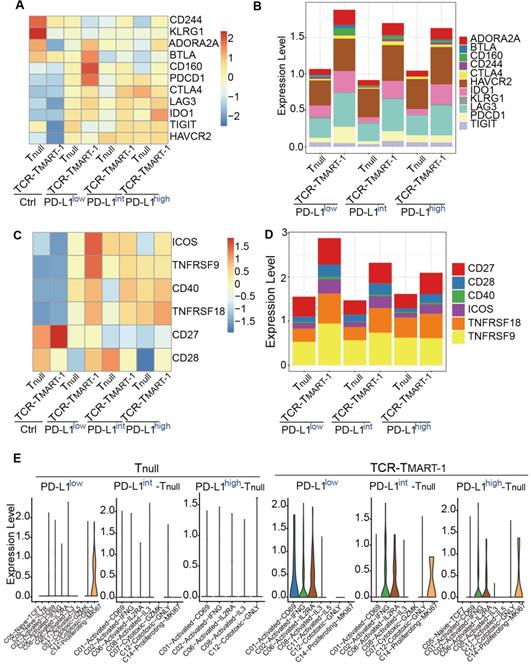
Simultaneously, the expression of stimulatory checkpoint molecules (SCMs) such as ICOS and TNFRSF9 was highest in TCR-TMART-1 targeting PD-L1low (Figure 5C), consistent with its greatest cytotoxicity. CD27, TNFRSF18, and TNFRSF9 was generally expressed in Tnull and TCR-TMART-1, while CD28 and ICOS were expressed more in TCR-TMART-1 than in Tnull (Figure 5D). The percentages of SCMs was not affected much by increased tumor PD-L1; however, the expression patterns of these SCMs in T cell clusters were modified (Figure 5E, Figure S5A). In Tnull, ICOS was only expressed in C14-Proliferating-MKI67 targeting PD-L1low, while in TCR-TMART-1, ICOS was commonly expressed in C02, C06, and additionally in C01 targeting PD-L1low and C14 targeting PD-L1int and PD-L1high tumors (Figure 5F). Overall, percentages of ICMs and expression patterns of SCMs varied with the increased ratios of tumor PD-L1, which may contribute to the complicated responses caused by tumor PD-L1.
Increased expression of tumor PD-L1 affected death of tumor cells and T cells with limited correlation
To detect the impact of PD-L1 expression on tumor and immune cell death, gene sets of cell death pathways, including apoptosis, necrosis, autophagy, pyroptosis, and ferroptosis, were used for GSVA analysis. We first analyzed tumor cells after they were cocultured with T cells for 24 h. Cell death pathways, especially necrosis and autophagy, were most enriched in PD-L1int (Figure 6A), suggesting a non-linear correlation between PD-L1 expression and tumor cell death at the transcriptional level. When tumor populations were separated into PD-L1-expressing or PD-L1-non-expressing (nonPD-L1) subsets, cell death pathways were most enriched in PD-L1-expressing cells of PD-L1int tumors (Figure 6B). After further analysis, C10-Tumor-INHBA and C04-Tumor-CXCL10 had enriched the highest level of cell death signaling (Figure 6C), while the highest expression of CD274 (encoding PD-L1) was in C10 and C00 (Figure 6D), implying a limited correlation between tumor CD274 expression and tumor cell death.
Increased expression of tumor PD-L1 affected death of tumor cells and T cells without direct correlation. (A) GSVA analysis of cell death pathways in tumor cells (top) and violin plot showing the expression level of PD-L1 in tumor cells (bottom). (B) GSVA analysis of cell death pathways in tumor cells either expressing PD-L1 or not. (C) GSVA analysis of cell death pathways in different tumor clusters. (D) The expression levels of PDL1 among cancer clusters. (E) GSVA analysis of cell death pathways in different subsets of T cells. (F) The expression of CD274 in Tnull and TCR-TMART-1 responding to differential proportions of PD-L1+ tumor. (G) The percentage (left) and intensity (right) of PD-L1 expression on tumor cells after incubation with MEL-526 cells for 24 h. (H) The expression distribution of apoptotic genes in T cell clusters of TCR-TMART-1 responding to differential proportions of PD-L1+ tumor.
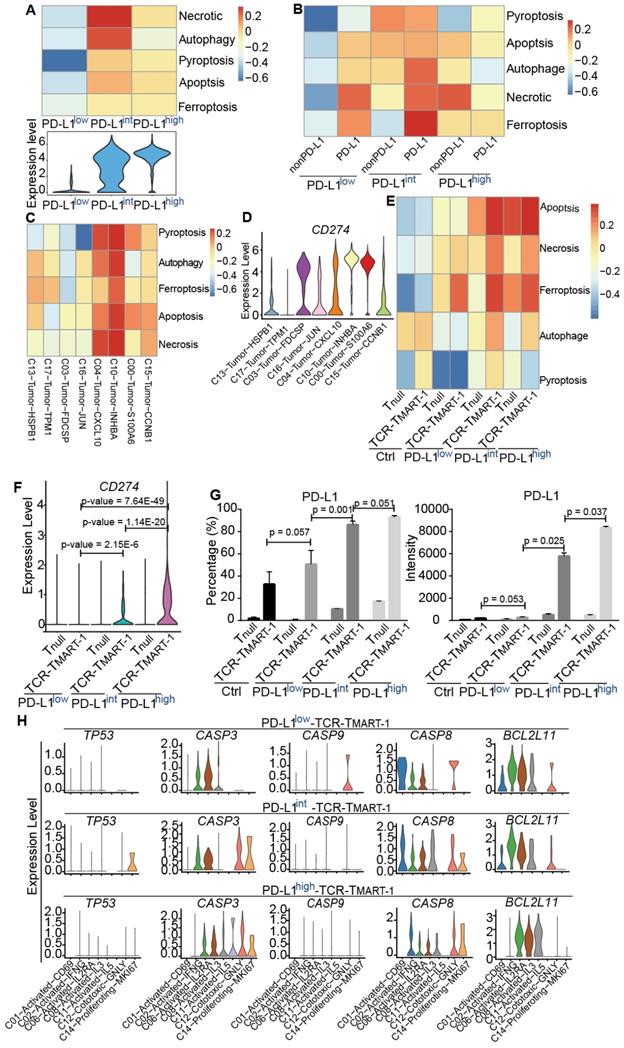
To gain insight into whether immune cell death would be affected by tumor PD-L1, cell death pathways (Figure 6E) and gene expression (Figure S6A) were analyzed in Tnull and TCR-TMART-1. Cell death pathways were more enriched in TCR-TMART-1 than in Tnull in each group (Figure 6E). Amazingly, the expression of CD274/PD-L1 but not PDCD1 (Figure S6B), was found to be gradually upregulated in TCR-TMART-1 targeting PD-L1int and PD-L1high tumors, both bioinformatically (Figure 6F) and experimentally (Figure 6G). Though the expression of CD274/PD-L1 was gradually elevated in TCR-TMART-1 with increased tumor PD-L1, there was limited correlation between CD274 expression in T cells and T cell death (data not shown). The expression of apoptotic genes, including TP53, CASP3, CASP9, CASP8, and BCL2L11, was further analyzed in all the clusters of TCR-TMART-1. The expression of CASP3 became more enriched in TCR-TMART-1 clusters with increased tumor PD-L1 (Figure 6H), implying that CASP3 might play an important role in cell death enrichment. Overall, the non-direct correlation between PD-L1 expression and death of tumor cells or T cells demonstrated the complexity of the influences caused by tumor PD-L1.
Consistency in the effect of tumor PD-L1 expression in melanoma patients
Various levels of tumor PD-L1 are expressed in cancer patients. To determine whether tumor PD-L1 worked in vivo in the same way as that in vitro, various data sets were analyzed. However, it is hard to find proper single-cell sequencing data in melanoma patients, either due to the lack of sequencing information of malignant cells [44] or clinical treatment information [45], or the limitation of cell numbers from anti-PD-1/PD-L1-treated melanoma patients [46]. ScRNA-seq profiles from one recently published paper [47] was evaluated (data not shown), but because of the low cell number of each sample (Table S1), the result was not reliable. We decided to examine the bulk data from melanoma patients [48] due to the lack of proper single-cell data. 16 samples remained after excluding patients with prior MAPK inhibitor treatment or patients who were on-treatment (Table S2). HSPB1 and KRT18 were the tumor marker genes investigated, and patients were classified into PD-L1low and PD-L1high groups based on the relative expression of CD274 (Cutoff = 0.003, described in Methods) (Table S2). No correlation was discovered between the relative expression of CD274 and the patient response to Pembrolizumab treatment (odds ratio = 0.9413123, p value = 1). The expression of anti-inflammatory IL13 and pro-inflammatory IL5 was higher in PD-L1high patients than PD-L1low patients (Figure 7A, 7B), consistent with our in vitro results (Figure 4A), while there was no dramatic difference in the expression of IL10, IL19 (Figure 7A), IL12A, IL1A, and IL1B (Figure 7B) between PD-L1high and PD-L1low patients.
The clinical relevance of the effect of PD-L1 expression on gene expression in melanoma patients. (A) The expression of IL10, IL13, and IL19 in PD-L1low (n = 9) and PD-L1high (n = 7) patients (Cutoff = 0.003). (B) The expression of IL12A, IL1A, IL5, and IL1B in PD-L1low (n = 9) and PD-L1high (n = 7) patients. (C) The expression of NFKB1, GATA3, HIF1A, STAT4, TBX21, IRF8, and STAT1 in PD-L1low (n = 9) and PD-L1high (n = 7) patients. (D) The expression of STAT3, IRF4, CEBPB, and AHR in PD-L1low (n = 9) and PD-L1high (n = 7) patients. (E) The expression of PDCD1, IDO1, TIGIT, CTLA4, ADORA2A, LAG3, HAVCR2, and BTLA in PD-L1low (n = 9) and PD-L1high (n = 7) patients. The p value was all determined by permutation test.
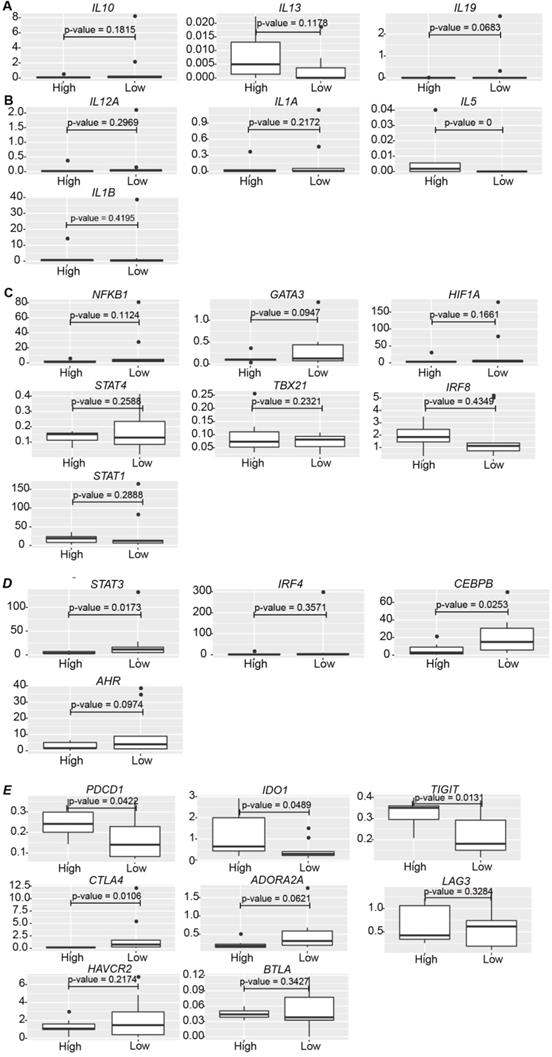
No significant change was found in the expression of transcription regulators for the pro-inflammatory immune cells, such as NFKB1, GATA3, HIF1A, etc. between PD-L1high and PD-L1low patients (Figure 7C). However, in line with TCR-TMART-1 responding to tumor PD-L1 (Figure 4G), CD8+ T cells in PD-L1low patients had higher expression of STAT3 and CEBPB (Figure 7D), which are transcription factors for immune-suppressive cell subsets. Immune checkpoint molecules were also differently expressed in PD-L1high and PD-L1low patients as well (Figure 7E). The expression of PDCD1, IDO1, and TIGIT was much higher in PD-L1high patients than PD-L1low patients, while CTLA4 and ADORA2A had a contrary expression pattern (Figure 7E). However, there was no dramatic difference in the expression of LAG3, HAVCR2, and BTLA between PD-L1high and PD-L1low patients. In summary, consistent with our in vitro results, higher levels of tumor PD-L1 in melanoma patients was not only representative of higher anti-inflammatory characteristics, such as higher expression of IL13, PDCD1, IDO1, and TIGIT, but also brought up pro-inflammatory features, such as higher expression of IL5, lower expression of STAT3, CEBPB, and AHR, and suppressive immune checkpoint molecules CTLA4 and ADORA2A. Thus, it is likely that the blockade of tumor PD-L1 would not only suppress the anti-inflammatory characteristics but also the pro-inflammatory features triggered by tumor PD-L1, causing a complex situation in predicting the efficacy of PD-1/PD-L1 blockade based only on the expression level of tumor PD-L1.
Discussion
It has been well documented that the efficacy of CPI for cancer treatment is affected by PD-L1 expression levels, its interaction with tumors, and the relative amounts of PD-1 [9]. However, the molecular mechanism by which different levels of tumor PD-L1 expression affects the therapeutic efficacy of TCR-T cell therapy remains unclear.
Few studies have reported the effects of PD-L1 expression levels on TCR-T cell function. Our study provides an insight on TCR-T cell response to different proportions of tumor cells expressing PD-L1 at the single-cell level. The results of cell-based assays revealed that higher proportions of PD-L1+ tumor cells more strongly inhibited T-cell function than lower proportions of PD-L1+ tumor cells (Figure 1D-G). More importantly, single-cell transcriptome profiling demonstrated a comprehensive landscape of the modifications caused by the differential expression of tumor PD-L1, including cluster features (Figure 2), responses of clusters and T cell populations (Figure 3), expression of cytokines, chemokines, transcription factors (Figure 4), and checkpoint molecules (Figure 5), as well as tumor and immune cell death (Figure 6).
Activated or cytotoxic cells from different clusters reacted differently to the increased ratios of tumor PD-L1 (Figure 3B, C02&C06 vs. C01&C11&C12), indicating that tumor PD-L1 might promote certain, but not all, T cell subsets that are capable of killing tumor cells. This discovery indicated that blocking PD-L1 might decrease the percentage of some activated or cytotoxic T cell subpopulations and this might be one of the reasons why the expression of tumor PD-L1 may not accurately predict the outcome of anti-PD-1/PD-L1 therapies.
TCR-TMART-1 were more vulnerable than Tnull when targeting increasing proportions of PD-L1-bearing tumor cells (Figure 3B, 3E). This indicates that TCR-T therapy could be co-administrated with PD-L1/PD-1 interference to obtain better anti-tumor efficacies. Clinical trials with TCR-T cells armed with a PD-1 antagonist are ongoing (NCT04139057, NCT03578406). The result also implies that TCR-T cells will benefit from elimination of their PDCD1, perhaps by using CRISPR-based approaches, to protect themselves against PD-L1-mediated inhibition [49].
In addition to anti-inflammatory cytokines, such as IL13, the expression of pro-inflammatory cytokines, such as IL5, was upregulated in TCR-TMART-1 targeting PD-L1high (Figure 4A-B). The result implied that the inhibition of PD-L1 might downregulate certain pro-inflammatory cytokines, which might be one reason why tumor PD-L1 is not a perfect predictor for the efficacy of PD-1/PD-L1 blockade. Moreover, the finding that combined blockade of PD-L1 and IL10 further enhanced T-cell immunity [50, 51] suggests that IL13 may also have the potential to be targeted together with PD-1/PD-L1 to increase anti-tumor function. In addition to cytokines, the expression of chemokines and cell recruitment was modified by increased tumor PD-L1 as well, demonstrating the complexity of the effects caused by tumor PD-L1.
Transcription factors play critical roles in immunity, such as TBX21 (T-bet), which activates transcription of IFN- gene and enhances Th1 cell development [52]. After stimulation by increased expression of tumor PD-L1, the expression of transcription factors responsible for the development of pro-inflammatory and anti-inflammatory cell populations was downregulated (Figure 4E-F). This finding suggested that PD-L1 blockade in clinical applications might upregulate some specific anti-inflammatory cell populations, resulting in the contradicting predictions for the effectiveness of PD-1/PD-L1 blockade by tumor PD-L1. Increased expression of tumor PD-L1 regulated different ICMs contrarily (Figure 5B) and modulated the expression patterns of SCMs (Figure 5F), which further promoted the complexity of the roles of tumor PD-L1.
Various cell death pathways were involved in tumor and T cell death (Figure 6). The death of neither tumor cells nor T cells correlated well with the expression level of PD-L1, though the expression of PD-L1 on T cells was dose-dependently increased by the elevation of tumor PD-L1 expression (Figure 6F-G). PD-L1 was reported to be expressed on T cells [53-55], and a recent research found that PD-L1 is up-modulated on T cells in cancers responding to antigen presentation, which suppresses neighboring macrophages and effector T cells and promotes self-tolerance [56]. Thus, the upregulated expression of PD-L1 on T cells might play a suppressive role in T cell function and anti-tumor activity.
There are some limitations in this work. PD-L1 was overexpressed in one melanoma cell line in our study, which may be different from human primary melanoma due to a more complicated microenvironment. Due to the lack of proper single-cell sequencing data from melanoma patients, we could only partly confirm our findings using clinical bulk data, while the prognostic role of different populations of CD8+ T cells could not be defined based on the bulk data from melanoma patients treated with anti-PD1/PD-L1.
Conclusions
Cell-based cytotoxicity and cytokine secretion assays in conjunction with scRNA-seq were applied to interrogate MART-1-specific transgenic T cells upon antigen-specific stimulation with different ratios of tumor PD-L1. This study provides the first comprehensive illustration of tumor PD-L1 influences on TCR-T cell function at the single-cell level, and reveals new findings regarding the heterogenous effects caused by increased tumor PD-L1 on TCR-T cells. It provides valuable information about why the PD-L1 blockade might promote not only pro-inflammatory responses, but also anti-inflammatory responses at the transcriptome level.
Abbreviations
PD-L1: programmed cell death-ligand-1; PD-1: programmed death-1; IFN-γ: interferon-γ; TILs: tumor infiltrating lymphocytes; NSCLC: non-small-cell lung cancer; APC: antigen presenting cell; CPI: checkpoint inhibitor; scRNA-seq: single-cell mRNA sequencing; PBMC: peripheral blood mononuclear cells; DMSO: dimethyl sulfoxide; PE: phycoerythrin; CFSE: Carboxyfluorescein succinicmidyl ester; CBA: cytometric bead array; SD: standard deviation; UMI: unique molecular identifier; GO: Gene Ontology; FACS: fluorescence-activated cell sorting; E:T: effector:target; OE: overexpressed; WT: wild-type; DEG: differentially expressed genes; Ctrl: control; GSVA: gene set variation analysis; TF: transcription factor; ER: endoplasmic reticulum; ICM: inhibitory checkpoint molecule; SCM: stimulatory checkpoint molecule; COVID-19: coronavirus disease 2019; SARS-CoV-2: severe acute respiratory syndrome coronavirus 2; mDC: myeloid dendritic cell; pDC: plasmacytoid dendritic cell; IL-6: interleukin 6; BALF: bronchoalveolar lavage fluid; ICI: immune checkpoint inhibitors.
Supplementary Material
Supplementary figures.
Supplementary table 1.
Supplementary table 2.
Acknowledgements
We sincerely thank the support provided by China National GeneBank and Guangdong Provincial Key Laboratory of Genome Read and Write (No. 2017B030301011). This research was supported by the Guangdong Enterprise Key Laboratory of Human Disease Genomics (2020B1212070028) and funded by Technology and Innovation Commission of Shenzhen Municipality, grant number JCYJ20170817150015170 and JCYJ20170817145845968. This manuscript was edited by Life Science Editors.
Author Contributions
Q.G. designed the project and wrote the manuscript, and revised the manuscript with C.C. S.L. performed the bioinformatic analysis. S.W., H.C., and Q.G. conducted the experiments related to single-cell sequencing. Q.X. and R.D. performed FACS analysis. F.W. and L.Z. assisted in performing experiments and manuscript revision. R.D., H.C., and Q.G. performed all other experiments and data analysis. Y.G., and X.D. helped with the project, and Q.G. and C.C. supervised the project.
Competing Interests
The authors have declared that no competing interest exists.
References
1. W Z, L C. Inhibitory B7-family molecules in the tumour microenvironment. Nat Rev Immunol. 2008;8:467-77
2. Abiko K, Matsumura N, Hamanishi J, Horikawa N, Murakami R, Yamaguchi K. et al. IFN-gamma from lymphocytes induces PD-L1 expression and promotes progression of ovarian cancer. Br J Cancer. 2015;112:1501-9
3. Mandai M, Hamanishi J, Abiko K, Matsumura N, Baba T, Konishi I. Dual Faces of IFNgamma in Cancer Progression: A Role of PD-L1 Induction in the Determination of Pro- and Antitumor Immunity. Clin Cancer Res. 2016;22:2329-34
4. X Z, Y Z, Q Q, J Z, Z L, W N. et al. PD-L1 induced by IFN-γ from tumor-associated macrophages via the JAK/STAT3 and PI3K/AKT signaling pathways promoted progression of lung cancer. Int J Clin Oncol. 2017;22:1026-33
5. H D, SE S, DR S, H T, F H, DB F. et al. Tumor-associated B7-H1 promotes T-cell apoptosis: a potential mechanism of immune evasion. Nat Med. 2002;8:793-800
6. Ghebeh H, Mohammed S, Al-Omair A, Qattan A, Lehe C, Al-Qudaihi G. et al. The B7-H1 (PD-L1) T lymphocyte-inhibitory molecule is expressed in breast cancer patients with infiltrating ductal carcinoma: correlation with important high-risk prognostic factors. Neoplasia. 2006;8:190-8
7. Thompson RH, Gillett MD, Cheville JC, Lohse CM, Dong H, Webster WS. et al. Costimulatory B7-H1 in renal cell carcinoma patients: Indicator of tumor aggressiveness and potential therapeutic target. Proc Natl Acad Sci U S A. 2004;101:17174-9
8. Patsoukis N, Brown J, Petkova V, Liu F, Li L, Boussiotis VA. Selective effects of PD-1 on Akt and Ras pathways regulate molecular components of the cell cycle and inhibit T cell proliferation. Sci Signal. 2012;5:ra46
9. Zhao Y, Lee CK, Lin CH, Gassen RB, Xu X, Huang Z. et al. PD-L1:CD80 Cis-Heterodimer Triggers the Co-stimulatory Receptor CD28 While Repressing the Inhibitory PD-1 and CTLA-4 Pathways. Immunity. 2019;51:1059-73 e9
10. Mayoux M, Roller A, Pulko V, Sammicheli S, Chen S, Sum E. et al. Dendritic cells dictate responses to PD-L1 blockade cancer immunotherapy. Sci Transl Med. 2020;12:1-11
11. Porter DL, Levine BL, Kalos M, Bagg A, June CH. Chimeric antigen receptor-modified T cells in chronic lymphoid leukemia. N Engl J Med. 2011;365:725-33
12. Hamid O, Robert C, Daud A, Hodi FS, Hwu WJ, Kefford R. et al. Safety and tumor responses with lambrolizumab (anti-PD-1) in melanoma. N Engl J Med. 2013;369:134-44
13. Motzer RJ, Escudier B, McDermott DF, George S, Hammers HJ, Srinivas S. et al. Nivolumab versus Everolimus in Advanced Renal-Cell Carcinoma. N Engl J Med. 2015;373:1803-13
14. Robert C, Long GV, Brady B, Dutriaux C, Maio M, Mortier L. et al. Nivolumab in previously untreated melanoma without BRAF mutation. N Engl J Med. 2015;372:320-30
15. Borghaei H, Paz-Ares L, Horn L, Spigel DR, Steins M, Ready NE. et al. Nivolumab versus Docetaxel in Advanced Nonsquamous Non-Small-Cell Lung Cancer. N Engl J Med. 2015;373:1627-39
16. Ferris RL, Blumenschein G, Fayette J, Guigay J, Colevas AD, Licitra L. et al. Nivolumab for Recurrent Squamous-Cell Carcinoma of the Head and Neck. N Engl J Med. 2016;375:1856-67
17. Reck M, Rodriguez-Abreu D, Robinson AG, Hui R, Csoszi T, Fulop A. et al. Pembrolizumab versus Chemotherapy for PD-L1-Positive Non-Small-Cell Lung Cancer. N Engl J Med. 2016;375:1823-33
18. Topalian SL. et al. Safety, Activity, and Immune Correlates of Anti-PD-1 Antibody in Cancer. N Engl J Med. 2012;366:2443-54
19. Herbst RS, Soria JC, Kowanetz M, Fine GD, Hamid O, Gordon MS. et al. Predictive correlates of response to the anti-PD-L1 antibody MPDL3280A in cancer patients. Nature. 2014;515:563-7
20. Daud AI, Wolchok JD, Robert C, Hwu W-J, Weber JS, Ribas A. et al. Programmed Death-Ligand 1 Expression and Response to the Anti-Programmed Death 1 Antibody Pembrolizumab in Melanoma. J Clin Oncol. 2016;34:4102-9
21. Larkin J, Chiarion-Sileni V, Gonzalez R, Grob JJ, Cowey CL, Lao CD. et al. Combined Nivolumab and Ipilimumab or Monotherapy in Untreated Melanoma. N Engl J Med. 2015;373:23-34
22. Kluger HM, Zito CR, Turcu G, Baine MK, Zhang H, Adeniran A. et al. PD-L1 Studies Across Tumor Types, Its Differential Expression and Predictive Value in Patients Treated with Immune Checkpoint Inhibitors. Clin Cancer Res. 2017;23:4270-9
23. Carlino MS, Long GV, Schadendorf D, Robert C, Ribas A, Richtig E. et al. Outcomes by line of therapy and programmed death ligand 1 expression in patients with advanced melanoma treated with pembrolizumab or ipilimumab in KEYNOTE-006: A randomised clinical trial. Eur J Cancer. 2018;101:236-43
24. Tawbi HA, Forsyth PA, Algazi A, Hamid O, Hodi FS, Moschos SJ. et al. Combined Nivolumab and Ipilimumab in Melanoma Metastatic to the Brain. N Engl J Med. 2018;379:722-30
25. Garon EB, Rizvi NA, Hui R, Leighl N, Balmanoukian AS, Eder JP. et al. Pembrolizumab for the treatment of non-small-cell lung cancer. N Engl J Med. 2015;372:2018-28
26. Hodi FS, Chiarion-Sileni V, Gonzalez R, Grob J-J, Rutkowski P, Cowey CL. et al. Nivolumab plus ipilimumab or nivolumab alone versus ipilimumab alone in advanced melanoma (CheckMate 067): 4-year outcomes of a multicentre, randomised, phase 3 trial. Lancet Oncol. 2018;19:1480-92
27. Carbone DP, Reck M, Paz-Ares L, Creelan B, Horn L, Steins M. et al. First-Line Nivolumab in Stage IV or Recurrent Non-Small-Cell Lung Cancer. N Engl J Med. 2017;376:2415-26
28. Butte MJ, Keir ME, Phamduy TB, Freeman GJ, Sharpe AH. PD-L1 interacts specifically with B7-1 to inhibit T cell proliferation. Immunity. 2007 p. 111-22
29. Zhao L, Cao YJ. Engineered T Cell Therapy for Cancer in the Clinic. Front Immunol. 2019;10:2250
30. Gao Q, Ouyang W, Kang B, Han X, Xiong Y, Ding R. et al. Selective targeting of the oncogenic KRAS G12S mutant allele by CRISPR/Cas9 induces efficient tumor regression. Theranostics. 2020;10:5137-53
31. Liu C, Wu T, Fan F, Liu Y, Wu L, Junkin M. et al. A portable and cost-effective microfluidic system for massively parallel single-cell transcriptome profiling. bioRxiv preprint. 2019 doi: https://doi.org/10.1101/818450
32. Li Y, Liu S, Hernandez J, Vence L, Hwu P, Radvanyi L. MART-1-specific melanoma tumor-infiltrating lymphocytes maintaining CD28 expression have improved survival and expansion capability following antigenic restimulation in vitro. J Immunol. 2010;184:452-65
33. Bethune MT, Li X, Yu J, McLaughlin J, Cheng D, Mathis C. et al. Isolation and characterization of NY-ESO-1-specific T cell receptors restricted on various MHC molecules. Proc Natl Acad Sci U S A. 2018 115
34. Ahmadi M, King JW, Xue S, Voisine C, Holler A, Wright GP. et al. CD3 limits the efficacy of TCR gene therapy in vivo. Blood. 2011 118
35. Morgan RA, Chinnasamy N, Abate-Daga D, Gros A, Robbins PF, Zheng z. et al. Cancer Regression and Neurological Toxicity Following Anti-MAGE-A3 TCR Gene Therapy. J Immunother. 2013 36
36. Yi M, Jiao D, Xu H, Liu Q, Zhao W, Han X. et al. Biomarkers for predicting efficacy of PD-1/PD-L1 inhibitors. Mol Cancer. 2018;17:129
37. Schoenfeld AJ, Rizvi H, Bandlamudi C, Sauter JL, Travis WD, Rekhtman N. et al. Clinical and molecular correlates of PD-L1 expression in patients with lung adenocarcinomas. Ann Oncol. 2020;31:599-608
38. Trapnell C, Cacchiarelli D, Grimsby J, Pokharel P, Li S, Morse M. et al. The dynamics and regulators of cell fate decisions are revealed by pseudotemporal ordering of single cells. Nat Biotechnol. 2014;32:381-6
39. Huang C, Lin Y, Hsiao W, Liao F, Huang P, Tan T. DUSP4 deficiency enhances CD25 expression and CD4+ T-cell proliferation without impeding T-cell development. Eur J Immunol. 2012;42:476-88
40. Choi S, Kim H, Leng L, Kang I, Jorgensen WL, Cho C. et al. Role of macrophage migration inhibitory factor in the regulatory T cell response of tumor-bearing mice. J Immunol. 2012;189:3905-13
41. Omilusik KD, Best JA, Yu B, Goossens S, Weidemann A, Nguyen JV. et al. Transcriptional repressor ZEB2 promotes terminal differentiation of CD8+ effector and memory T cell populations during infection. J Exp Med. 2015;212:2027-39
42. Dufva O, Koski J, Maliniemi P, Ianevski A, Klievink J, Leitner J. et al. Integrated drug profiling and CRISPR screening identify essential pathways for CAR T-cell cytotoxicity. Blood. 2020;135:597-609
43. Huang RY, Francois A, McGray AR, Miliotto A, Odunsi K. Compensatory upregulation of PD-1, LAG-3, and CTLA-4 limits the efficacy of single-agent checkpoint blockade in metastatic ovarian cancer. Oncoimmunology. 2017;6:e1249561
44. Sade-Feldman M, Yizhak K, Bjorgaard SL, Ray JP, de Boer CG, Jenkins RW. et al. Defining T Cell States Associated with Response to Checkpoint Immunotherapy in Melanoma. Cell. 2018;175:998-1013 e20
45. Durante MA, Rodriguez DA, Kurtenbach S, Kuznetsov JN, Sanchez MI, Decatur CL. et al. Single-cell analysis reveals new evolutionary complexity in uveal melanoma. Nat Commun. 2020;11:496
46. Tirosh I, Izar B, Prakadan SM, Wadsworth II MH, Treacy D, Trombetta JJ. et al. Dissecting the multicellular ecosystem of metastatic melanoma by single-cell RNA-seq. Science. 2016 352
47. Jerby-Arnon L, Shah P, Cuoco MS, Rodman C, Su MJ, Melms JC. et al. A Cancer Cell Program Promotes T Cell Exclusion and Resistance to Checkpoint Blockade. Cell. 2018;175:984-97 e24
48. Hugo W, Zaretsky JM, Sun L, Song C, Moreno BH, Hu-Lieskovan S. et al. Genomic and Transcriptomic Features of Response to Anti-PD-1 Therapy in Metastatic Melanoma. Cell. 2016;165:35-44
49. Gao Q, Dong X, Xu Q, Zhu L, Wang F, Hou Y. et al. Therapeutic potential of CRISPR/Cas9 gene editing in engineered T-cell therapy. Cancer Med. 2019;8:4254-64
50. Brooks DG, Ha SJ, Elsaesser H, Sharpe AH, Freeman GJ, Oldstone MB. IL-10 and PD-L1 operate through distinct pathways to suppress T-cell activity during persistent viral infection. Proc Natl Acad Sci U S A. 2008;105:20428-33
51. Sun Z, Fourcade J, Pagliano O, Chauvin JM, Sander C, Kirkwood JM. et al. IL10 and PD-1 Cooperate to Limit the Activity of Tumor-Specific CD8+ T Cells. Cancer Res. 2015;75:1635-44
52. Oh S, Hwang S. The Role of Protein Modifications of T-Bet in Cytokine Production and Differentiation of T Helper Cells. J Immunol Res. 2014. 2014
53. Dong H, Strome SE, Matteson EL, Moder KG, Flies DB, Zhu G. et al. Costimulating aberrant T cell responses by B7-H1 autoantibodies in rheumatoid arthritis. J Clin Invest. 2003 111
54. Pulko V, Harris KJ, Liu X, Gibbons RM, Harrington SM, Krco CJ. et al. B7-H1 Expressed by Activated CD8 T Cells Is Essential for Their Survival. J Immunol. 2011;187:5606-14
55. Liu X, Wu X, Cao S, Harrington SM, Yin P, Mansfield AS. et al. B7-H1 antibodies lose antitumor activity due to activation of p38 MAPK that leads to apoptosis of tumor-reactive CD8+ T cells. Sci Rep. 2016 6
56. Diskin B, Adam S, Cassini MF, Sanchez G, Liria M, Aykut B. et al. PD-L1 engagement on T cells promotes self-tolerance and suppression of neighboring macrophages and effector T cells in cancer. Nat Immunol. 2020;21:442-54
Author contact
![]() Corresponding authors: Qianqian Gao (Lead contact), E-mail: gaoqqac.cn; Cheng-Chi Chao, E-mail: great_scientistcom.
Corresponding authors: Qianqian Gao (Lead contact), E-mail: gaoqqac.cn; Cheng-Chi Chao, E-mail: great_scientistcom.