Impact Factor
- Issue 14; 2026
- Issue 13; 2026
- Issue 12; 2026
- Issue 11; 2026
- Issue 10; 2026
- Volume 16; 2026
- Advance Articles
- Past Issues
- Cover Images
- Cover Suggestion
- Index & Coverage
- Special Issues
Introduction
Methods
Results
Discussion
Abbreviations
Acknowledgements
Supplementary Material
References
International Journal of Biological Sciences
International Journal of Medical Sciences
 Global reach, higher impact

Theranostics 2021; 11(6):2490-2504. doi:10.7150/thno.47130 This issue Cite
Research Paper
In vivo detection of teriflunomide-derived fluorine signal during neuroinflammation using fluorine MR spectroscopy
Christian Prinz1,2, Ludger Starke1, Jason M. Millward1,2, Ariane Fillmer3, Paula Ramos Delgado1,2, Helmar Waiczies4, Andreas Pohlmann1, Michael Rothe5, Marc Nazaré6, Friedemann Paul2,7, Thoralf Niendorf1,2, Sonia Waiczies1,2 ![]()
1. Berlin Ultrahigh Field Facility (B.U.F.F.), Max Delbrück Center for Molecular Medicine, Berlin, Germany.
2. Experimental and Clinical Research Center, a joint cooperation between the Charité - Universitätsmedizin Berlin and the Max Delbrück Center for Molecular Medicine in the Helmholtz Association, Berlin, Germany.
3. Physikalisch-Technische Bundesanstalt (PTB), Berlin, Germany.
4. MRI TOOLS GmbH, Berlin, Germany.
5. Lipidomix GmbH, Berlin, Germany.
6. Medicinal Chemistry, Leibniz-Institut fϋr Molekulare Pharmakologie (FMP), Berlin, Germany.
7. Charité - Universitätsmedizin Berlin, corporate member of Freie Universität Berlin, Humboldt-Universität zu Berlin, and Berlin Institute of Health (BIH), Berlin, Germany.
Received 2020-4-17; Accepted 2020-11-17; Published 2021-1-1
Abstract

Background: Magnetic resonance imaging (MRI) is indispensable for diagnosing neurological conditions such as multiple sclerosis (MS). MRI also supports decisions regarding the choice of disease-modifying drugs (DMDs). Determining in vivo tissue concentrations of DMDs has the potential to become an essential clinical tool for therapeutic drug monitoring (TDM). The aim here was to examine the feasibility of fluorine-19 (19F) MR methods to detect the fluorinated DMD teriflunomide (TF) during normal and pathological conditions.
Methods: We used 19F MR spectroscopy to detect TF in the experimental autoimmune encephalomyelitis (EAE) mouse model of multiple sclerosis (MS) in vivo. Prior to the in vivo investigations we characterized the MR properties of TF in vitro. We studied the impact of pH and protein binding as well as MR contrast agents.
Results: We could detect TF in vivo and could follow the 19F MR signal over different time points of disease. We quantified TF concentrations in different tissues using HPLC/MS and showed a significant correlation between ex vivo TF levels in serum and the ex vivo 19F MR signal.
Conclusion: This study demonstrates the feasibility of 19F MR methods to detect TF during neuroinflammation in vivo. It also highlights the need for further technological developments in this field. The ultimate goal is to add 19F MR protocols to conventional 1H MRI protocols in clinical practice to guide therapy decisions.
Keywords: MRI, MRS, Fluorine, Teriflunomide, Magnetic Resonance Spectroscopy, experimental autoimmune encephalomyelitis, Multiple Sclerosis
Introduction
Multiple sclerosis (MS) is a chronic inflammatory disease of the central nervous system (CNS) [1, 2]. The disease course is highly variable, involving a wide spectrum of neurological and motoric symptoms [3]. Most patients show a relapsing and remitting (RRMS) disease course, which ultimately transitions to a progressive phase [2, 4].
1H Magnetic resonance imaging (1H MRI) has been indispensable for diagnosing MS [5-7]. 1H MRI can distinguish chronic from active lesions when using contrast agents to reveal blood brain barrier (BBB) disruptions [8-11]. Furthermore, MRI has been vital for making safe informed decisions with respect to disease modifying drugs (DMDs) [12, 13] to ensure a better dampening of disease activity [14]. Typically, T2 lesion load [15, 16] and brain atrophy [16] are used as outcome measures, especially during clinical studies. These MRI endpoints are commonly used as primary and secondary measures in phase II DMD trials involving large amounts of patients [17]. Despite the substantial armamentarium of DMDs available for MS [18-20], predicting treatment outcomes and tailoring DMD dosages to treatment objectives for individual patients poses a major unmet clinical need [21-23]. DMDs may need to traverse the BBB, to modify inflammatory responses within the CNS or to reduce neurodegeneration [24].
Currently there are no standard clinical methods to non-invasively monitor the distribution of drugs in patients. However, the possibility to quantify the concentration of drugs in the brain would greatly improve the assessment of individual treatment responses [22]. Drug levels are typically measured in blood, urine, saliva, and infrequently cerebrospinal fluid (CSF). However, drug levels in these fluids do not reliably reflect concentrations within the CNS. Imaging techniques such as positron emission tomography (PET) and single-photon emission computed tomography (SPECT) are used to detect drugs labeled with a radioisotope; these imaging methods are highly sensitive and are particularly useful in phase I clinical studies for small cohorts of human subjects [25-29]. However, they are not used for standard drug monitoring in patients; disadvantages include high costs, the necessity to inject radioactive compounds, restricted observation window due to short radiotracer half-life (18F t1/2 = 110 min), and a lack of distinction between drugs and their metabolites.
One third of all approved drugs are fluorinated, and are potentially detectable by fluorine-19 (19F) MRI in vivo [30-32]. The amount of 19F atoms endogenously present in the human body that can be detected with MR methods is negligible. The absence of background signal makes the 19F nucleus a unique and highly attractive biomarker for detecting administered fluorinated DMDs in vivo using 19F-MR methods. 19F MR methods have been applied to detect fluorinated drugs in animal [33-38] and human studies [39-45] in the past. They have also been applied in combination with drugs encapsulated in fluorine rich nanoparticles to monitor the efficacy of these therapies in animal models [46]. 19F-MR methods have also been employed in diagnostic imaging [47], for guiding tumor ablation therapies [48], and for imaging intracellular therapeutic targeting [49]. However, they remain under-utilized for the majority of drugs, especially in MS.
Teriflunomide (TF) is an anti-inflammatory DMD approved for use in MS that contains a trifluoromethyl group [50]. TF is administered orally once-daily and has a rapid, complete absorption with a long half-life (> 2 weeks) due to extensive enterohepatic recycling [51]. In RRMS patients, it reduces the annual relapse rate, slows disability progression, reduces the lesion volume [51, 52] and brain volume loss [53]. TF has a high tolerability and low discontinuation rate [50, 54]. TF was investigated in preclinical studies using the animal model of MS, experimental autoimmune encephalomyelitis (EAE) [55-57]. In rats, TF administration at EAE onset reduced disease severity and delayed progression [55, 57]. TF treatment delayed EAE onset in SJL/J mice, and suppressed disease entirely in C57BL/6 mice.
In this study we used 19F MR spectroscopy to study the possibility of detecting TF during EAE in vivo. We characterized the MR properties of TF in vitro, studying the impact of pH, protein binding, and MR contrast agents. We demonstrated the feasibility of 19F MR methods to detect TF non-invasively during neuroinflammation, with the ultimate goal for further development into future clinical applications.
Methods
Teriflunomide
Teriflunomide (TF) (Sanofi-Genzyme, Bridgewater, US) was formulated in 0.6% carboxymethylcellulose, sodium salt (CMC, Sigma, Schnelldorf, Germany) in the form of a suspension for in vivo use. CMC is an inactive ingredient used as thickening excipient, stabilizer and suspending agent. TF (20 mg) was mixed with 5 mL CMC/Tween-80 (0.6% CMC, 0.5% Tween-80 in water) using medium speed magnetic stirring (circa 24 h at RT) until a uniform milky suspension was obtained. The suspension was transferred to a clean glass vial and the original vial rinsed with a further 5 mL of CMC/Tween-80. The TF suspension (2 mg/mL) was adjusted to a pH of 7 using HCl and NaOH. For phantom experiments, TF was prepared in CMC, DMSO and human serum to study the effects of protein binding.
Animals
Dark Agouti rats (n = 2, Janvier Labs, Le Genest-Saint-Isle, France), C57BL/6N mice (n = 27, Charles River, Sulzfeld, Germany) and SJL/J (n = 33, Janvier Labs, Le Genest-Saint-Isle, France) mice (all female, age 2-4 months) were used to study the TF signal following oral application in vivo. The numbers of animals within each group are specified in the relevant experiments below.
Animal experiments were conducted in accordance with procedures approved by the Animal Welfare Department of the State Office of Health and Social Affairs Berlin (LAGeSo) and conformed to guidelines to minimize discomfort to animals (86/609/EEC).
EAE induction
EAE was induced by subcutaneous immunization of SJL/J mice with proteolipid protein peptide (PLP139-151) and C57BL/6 mice with myelin oligodendrocyte glycoprotein peptide (MOG35-55); for both peptides 250 µg peptide (Pepceuticals, Leicester, UK) per animal were emulsified with M. Tuberculosis H37RA (List Biological Laboratories, Campbell, US, 800 µg/animal) in 100 µL Complete Freund's Adjuvant (BD Difco, Heidelberg, Germany). Pertussis Toxin (Biotrend, Cologne, Germany, 1.25 ng/µL in SJL/J and 2 ng/µL in C57BL/6) was administered intraperitoneally in 200 µL PBS on days 0 and 2 [58].
EAE scoring was performed daily: righting reflex weakness = 0.5, tail paresis = 0.5, tail paralysis = 1, unilateral hindlimb paresis = 0.5, bilateral hindlimb paralysis = 1, unilateral forelimb paresis = 0.75, bilateral forelimb paralysis = 1.5.
Teriflunomide treatment and preparation for in vivo MR measurements
Rats (n = 2) were treated orally with 10 mg/kg TF and MR measurements were performed directly following administration. Animals were anesthetized by intraperitoneal (ip) injection using ketamine (40 mg/kg, WDT, Garbsen, Germany) and medetomidine (0.5 to 0.75 mg/kg, Henry Schein, Berlin, Germany) maintained by an ip catheter line. TF was administered via a catheter line to the stomach while the animal was in the scanner.
Mice were treated daily for 14 days with 30 mg/kg TF [55-57, 59] or vehicle control (CMC) administered by oral gavage. The increased dose used in mice takes into consideration guidelines on dose conversions in animals and is mostly due to differences in metabolism [56, 60]. EAE mice were treated with TF (C57BL/6 n = 12, SJL/J n = 12) or CMC (C57BL/6 n = 6, SJL/J n = 6). Healthy non-immunized C57BL/6 (n = 9) or SJL/J (n = 15) mice served as therapy controls. MR measurements in mice were performed on days 8 and 14 following EAE start, 16-24 h after the last drug administration. For in vivo MR measurements, mice were anesthetized by intraperitoneal injection using a mixture of xylazine (5 mg/kg, CP Pharma, Burgdorf, Germany) and ketamine (50 mg/kg, WDT, Garbsen, Germany) maintained by an ip catheter line.
Animals were transferred to a temperature-regulated bed (receiving circulated warm water from a water bath) and supplied with pressurized air (30 %) and O2 (70 %). Pulse, respiration and body temperature (Neoptix, OmniLink version 1.15, Omniflex, Neoptix, Québec, Canada) were continuously monitored. The body temperature was kept at 37 °C throughout the experiments.
For studying the BBB disruption in SJL/J EAE mice, gadopentetate dimeglumine (0.2 mmol/kg Gd-DTPA Magnevist, Bayer Pharma, Berlin, Germany) was administered intravenously via the tail vein using an infusion pump (Harvard PHD 2000, Harvard Apparatus, Cambridge, US).
Phantom construction
For characterizing the 19F MR properties (chemical shift, spectral shape and relaxation times) of TF, phantoms were prepared in 2.5 mL syringes (inner diameter, id: 9.7 mm, total length: 7.6 cm, B.Braun, Melsungen, Germany) equipped with stopper closing-cones (B.Braun, Melsungen, Germany) using dimethylsulfoxide (DMSO, Roth, Karlsruhe, Germany, 27.02 mg/mL), human serum (4.84 mg/mL) or CMC (2.70 mg/mL) as solvents/suspending agent. Given the different pH of various compartments in vivo, we studied the influence of pH on the relaxation times T1 and T2 as well as the 19F signal intensity in CMC in 1 mL syringes (id: 4.7 mm, total length: 9.6 cm, B.Braun, Melsungen, Germany). The pH for the 2.70 mg/mL TF concentration was adjusted to pH values of 5, 7.4, 10 and 13 with HCl or NaOH.
For studying the influence of contrast agent on 19F MR properties, 4 phantoms containing 16.67 mg/mL TF and different concentrations of Gd-DTPA (0.5 mM, 1 mM, 2 mM, and 4 mM) in DMSO were prepared in NMR tubes (id: 4.2 mm).
For assessing the limit of detection (LOD) for 19F MRS and performing calibrations, four TF concentrations were prepared in serum (400 µL) and the exact concentration for each sample was determined by mass spectrometry (11.8, 105.7, 787.4, 4208.2 µg/g). The serum samples (350 to 500 µL) were prepared in 1 mL syringes (as above).
MR methods
Hardware
MR experiments were performed on a Bruker Biospec 9.4 T MR scanner (Bruker Biospin, Ettlingen, Germany) with a horizontal bore. A room temperature (RT) dual-tunable 19F/1H head RF transceive coil (16 mm inner diameter) [61] was used to characterize TF in DMSO/serum/CMC in phantom experiments.
A RT dual-tunable 19F/1H rat body RF transceive coil (MRI.TOOLS GmbH, Berlin, Germany, 62 mm inner diameter) was used to study in vivo 19F MR spectroscopy (MRS) signals in the abdomen of the rat.
A cryogenically-cooled transceive 19F quadrature RF surface probe (20 mm inner diameter, Cryogenic Radiofrequency Probe, CRP, Bruker, Fällanden, Switzerland) [62] was used for in vivo 19F MRS measurements of the mouse head and abdomen as well as serum samples. With this coil we had previously shown that 19F MR sensitivity is enhanced by a factor of 15 compared to RT head coils [62]. The bed of the 19F CRP was adjusted with respect to the surface of the coil in order to acquire 19F MRS in different regions of the mouse body. The measurement volume above the bed was adjusted with respect to the surface of the coil-head by using a position gauge. This device reproduces the geometry of the coil-head and supporting components and can be used to adjust the position of the mouse on the bed outside of the MR scanner. Anatomical 1H scans ensured correct positioning and complete coverage of the regions of interest.
Phantom MR measurements
A non-selective single-pulse 19F MRS FID-acquire sequence (TR = 1000 ms, nominal flip angle = 90°, blockpulse, 4096 sampling points, acquisition delay = 0.05 ms, excitation pulse bandwidth = 10000 Hz, spectral read bandwidth = 25000 Hz, averages for serum/CMC/DMSO phantoms: avgserum = 8, avgCMC = 16, avgDMSO = 16) was used for detecting TF in phantoms and studying chemical shift and spectral shape (full-width half maximum, FWHM). This sequence (later referred to as default) was slightly modified e.g. using increased averages or bandwidth to increase signal-to-noise ratio (SNR) in in vivo and ex vivo experiments (see below).
19F T1 and T2 relaxation times were measured using MR spectroscopy. For T1, the default FID-acquire sequence was used but with 16 TRs ranging from 100 to 10000 ms, avgserum = 40, avgDMSO = 30, avgCMC = 30. For T2, a CPMG pulse sequence was used: 25 echoes, echo spacing for serum/CMC/DMSO phantoms: esserum = 2.8 ms, esDMSO = 40 ms, esDMSO+Gd-DTPA = 10.6 ms, esCMC = 10.6 ms, excitation pulse = 5000 Hz, spectral read bandwidth = 25000 Hz; TRserum = 2000 ms, TRDMSO = 5000 ms, TRCMC = 5000 ms, avg = 50 (for all phantoms).
For studying the influence of pH on the 19F MR signal detection, the default FID-acquire sequence was used, but a long TR of 8000 ms was chosen to allow full relaxation.
The LOD for the 19F CRP to perform 19F MRS in vivo was assessed using the above four concentrations of TF in serum and the default 19F MRS FID-acquire sequence but using avg = 1024, acquisition time = 17 min. The SNR of these spectra was measured and the LOD was determined as the concentration/number of 19F atoms that corresponded to an SNR of 5 (SNR1 estimation below) using a linear fit with y-axis intercept = 0. The SNR value of 5 was chosen as a conservative threshold for determining LOD.
In vivo 1H MRI using 19F/1H coils
Anatomical 1H MRI was performed using FLASH (Fast Low-Angle Shot) [63] and T2 weighted TurboRARE (Rapid Acquisition with Relaxation Enhancement) [64] pulse sequences. In EAE mice, BBB disruptions were assessed using an MDEFT (Modified Driven-Equilibrium FT) [65] sequence with inversion (TR/TE/TI 2600/3.9/950 ms, FOV (30.2×12.8×9) mm3, matrix size = 256×170×18, avg = 2, acquisition time = 3 m 7 s).
In vivo 19F MRS using 19F CRP
TF-derived 19F MR signal was studied in healthy and EAE mice immediately following acquisition of the anatomical scans. To account for the B1 inhomogeneity of the CRP surface coil during in vivo measurements, we calibrated the flip angle. Before in vivo measurements, a phantom reference sample of 1 mL TF in DMSO (27.02 mg/mL) was used to manually calibrate the flip angle and reference power. This sample was in a 2.5 mL syringe and was positioned at the coil surface. We acquired 10 spectra with the default 19F MRS FID-acquire sequence using different reference powers (0.0001 - 0.01 W). The best reference power from these manual measurements was verified by the automatically adjusted power settings for this sample by the MR system. Prior to each in vivo measurement, we adjusted the reference power manually (automatic 19F adjustments were not possible due to low SNR): spectra (avg = 128, 2 min 8 s each) with different reference powers (0.001, 0.002, 0.004, 0.008 W) were acquired from the head region of mice in vivo using the default FID-acquire method. The optimal reference power yielding the highest signal intensity was then chosen for the 19F MRS data acquisitions. For these acquisitions, the default FID-acquire sequence was used with avg = 1024, acquisition time = 17 min.
In vivo 19F MRS using 19F/1H rat body coil
To study 19F MRS signal of TF in the abdominal region of rats at different time points, the default FID-acquire sequence was used with alterations in: TR = 1500 ms, avg = 256, acquisition time = 6 min.
Ex vivo measurements
Tissue processing
Animals were sacrificed after 14 days of in vivo experiments. Under deep anesthesia, blood was withdrawn and animals were transcardially perfused with 30 mL (> 10× the estimated total mouse blood volume) phosphate-buffered saline (PBS) solution. CSF was collected from the cisterna magna and the perfused brain was isolated. The perfused brain samples are mostly depleted of blood and CSF. Samples were frozen (-80 °C) for subsequent mass spectrometry studies.
Perfused brain tissue (50 mg), serum (50 µL) or CSF (1-3 mg) was weighed/measured and homogenized in 450 µL phosphate buffer (100 mmol/L, pH = 6.0). 1 mL ethylacetate was added. The mixture was shaken vigorously for 5 min and centrifuged at 11000 rpm for 10 min. The upper layer was transferred to a 2 mL glass vial. The extraction was repeated twice. The organic extract was evaporated to dryness with a gentle N2 stream at 40 °C, after which the residue was dissolved in 1 mL ethanol.
High performance liquid chromatography mass spectrometry (HPLC/MS)
For assessing the LOD for HPLC/MS, 5 TF concentrations (1 ng/mL to 1000 ng/mL) were prepared in DMSO. LOD was calculated at an SNR = 9 using peak-to-peak algorithm from lowest calibrator 1 ng/mL.
HPLC-measurements were performed using an Agilent 1290 HPLC system with binary pump, autosampler and column thermostat equipped with a Phenomenex Kinetex-C18 column 2.6 µm, 2.1×150 mm column (Phenomenex, Aschaffenburg, Germany). Ammonium acetate (5 mM) and acetonitrile was used as solvent system. All solvents and buffers in HPLC-MS-grade were obtained from VWR Germany. The solvent gradient started at 5 % acetonitrile and was increased to 95 % within 5 min until 8 min with a flow rate of 0.4 mL/min and 1 µL injection volume. The HPLC was coupled with an Agilent 6470 triplequad mass spectrometer with electrospray ionization source using established parameters (gas temp = 250 °C, gas flow = 9 L/min, nebulizer pressure = 20 psi, sheath gas temp = 390 °C, sheath gas flow = 12 L/min, capillary voltage = 2700 V, nozzel voltage = 300 V) operated in negative multiple reaction monitoring mode (269.2 -160 capillary electrophoresis (CE) 28 V, - 82 CE 21, fragmentor voltage = 120 V, mass resolution wide/wide).
Ex vivo 19F MRS
For correlating the TF-derived 19F MR signal with HPLC/MS TF quantification, calibrations were first performed with mouse sera spiked with TF (using 3 concentrations closer to biologically expected values) in 1 mL syringes. These concentrations were measured with HPLC/MS (11.8, 105.7, 787.4 µg/g) and the default 19F MRS FID-acquire method (but excitation pulse = 70000 Hz, spectral read bandwidth = 70000 Hz, avg = 4096, acquisition time = 1 h 8 min). Next we measured the ex vivo serum samples from EAE mice (n = 10) in 1 mL syringes using the default FID-acquire method and HPLC/MS.
For both the calibration experiment (spiked serum) as well as the between-method correlation (ex vivo serum) we computed a linear fit with y-axis intercept = 0 to determine the relation of signal to concentration and then used this ratio to estimate TF concentrations in ex vivo serum samples from the 19F MRS signal intensity after accounting for slight volume differences.
MR data analysis
For in vivo proton image processing and analysis, the freely available software Fiji (Image J v1.47p, Open source software, NIH, MD, USA) [66] was used.
All spectral analyses and processing were performed in MATLAB (The MathWorks Inc., Natick, USA). Chemical shifts are referenced to trichloro-fluoro-methane, CFCl3 (δF=0 ppm). Post-processing of the real spectra included zero-filling to 214 points of all original FID data and a line-broadening of 70 Hz. The signal from both receive channels was averaged after zeroth and first order phase-correction.
We used two conventions to measure SNR of the main spectral peaks: SNR1 was measured by calculating the ratio of the peak amplitude (maximal peak height minus mean background signal) and one standard deviation of the background noise (σ1), as suggested in a recent expert's consensus paper on in vivo MR spectroscopy [67]. SNR2 was measured by calculating the ratio of the peak amplitude and the noise height (peak-to-peak) divided by 2.5 (σ2) [68]. Both SNR estimations are shown for all in vivo 19F MR measurements in healthy and EAE mice (Table S1). SNR1 was used for all data analysis. SNR2 is only reported in Table S1.
The time domain (TD) signal intensity was measured by calculating the y-axis intercept of the magnitude free-induction decay using a 4-th degree polynomial fit (FID fit) in MATLAB. The frequency domain (FD) signal intensity was determined by computing the integral of the MRS peak at -61 ppm (peak area). For this, we used a Lorentzian fit of the real spectrum [69] including a baseline offset and a secondary peak if the amplitude of the secondary peak exceeded SNR1 = 2. Only the area of the main peak was attributed to TF.
T1 and T2 were determined by mono exponential fitting of data points obtained from 19F MRS (T1) and CPMG (T2, three parameter fit).
Statistical analysis
MR-data and mass spectrometry data were pooled from all experiments. 19F signal intensities from 19F MR and TF concentrations in serum, perfused brain tissue and CSF samples from HPLC/MS experiments were log transformed, and the log-normal distribution confirmed using the Shapiro-Wilk normality test. EAE disease scores were presented as mean and standard error of the mean, maximum scores as median and interquartile range and were analyzed with the Mann-Whitney U test. Bodyweight was analyzed using the t-test; the logrank test was used to analyze the time-to-onset of clinical signs. 19F MR signal detection over time and mass spectrometry data was analyzed using ANOVA or 2-factor ANOVA, with the Tukey post-hoc test for multiple comparisons, or with an unpaired t-test. Levene's test was used for testing for homogeneity of variance. Correlation was assessed using the Pearson correlation (R) or the non-parametric Spearman rank-order correlation (ρ), as appropriate. p-values < 5 % were considered significant (depicted as *p < 0.05; **p < 0.01; ***p < 0.001). Statistical analysis was performed using the statistical computing environment R (version 3.6.1, R Foundation; https://R-project.org).
Results
Strain differences in response to teriflunomide treatment in EAE mice
We studied TF treatment response in both SJL/J (Figure 1A-D) and C57BL/6 (Figure 1E-H) EAE mice. In SJL/J mice, TF treatment prevented weight loss during the EAE disease course (Figure 1A, n = 12, pooled from 4 EAE experiments). Control EAE mice (n = 5, pooled from 4 EAE experiments) treated with vehicle showed a substantial weight loss from day 11 post-immunization (p.i.) onward (p = 0.002) (Figure 1A). TF treatment resulted in an almost complete absence of clinical signs in SJL/J mice. TF-treated EAE mice had lower clinical scores compared to vehicle-treated EAE mice, which showed a typical disease course for SJL/J mice, reaching peak clinical score at day 12 p.i. (Figure 1B). In the TF-treated group, only 8% of animals showed clinical signs by day 14 p.i. compared to untreated mice (100% incidence). The maximum disease score was also different between treated (0 ± 0, median ± interquartile range, IQR) and untreated (2.5 ± 0.5, median ± IQR) EAE mice (p < 0.001) (Figure 1C). TF delayed disease onset (p < 0.001), which is defined as time to reach a minimum clinical score of 0.5 (Figure 1D).
Effect of teriflunomide treatment on the disease course of EAE in SJL/J and C57BL/6 mice. (A) Change in bodyweight (Mean ± SE) over time in untreated (carboxymethylcellulose vehicle, n = 5) and TF treated (n = 12) SJL/J EAE mice. Changes in percent compared to the initial bodyweight are shown. (B) Mean EAE score ± SE of untreated (n = 5) and TF treated (n = 12) SJL/J EAE animals. The time axis is restricted to days with non-zero EAE score. (C) Maximum EAE score reached during the EAE disease course in untreated (n = 5) and TF treated (n = 12) SJL/J EAE animals. (D) Kaplan-Meier plot of untreated (n = 5) and TF treated (n = 12) SJL/J EAE animals depicting the time to disease onset (score=0.5) and the proportion of animals with clinical symptoms. (E) Change in bodyweight (Mean ± SE) over time in untreated (carboxymethylcellulose, n = 6) and TF treated (n = 9) C57BL/6 EAE mice. Changes in percent of the initial bodyweight is shown. (F) Mean EAE score ± SE of untreated (n = 6) and TF treated (n = 9) C57BL/6 EAE animals. The time axis is restricted to days with non-zero EAE score. (G) Maximum EAE score reached during the EAE disease course in untreated (n = 6) and treated (n = 9) C57BL/6 EAE animals. (H) Kaplan-Meier plot of untreated (n = 6) and treated (n = 9) C57BL/6 EAE animals depicting the time to onset (score = 0.5) of the EAE disease and the proportion of animals with clinical symptoms. (I-J) MR Images showing mild (I) and severe (J) blood brain barrier disruption using contrast agent (i.v.) and MDEFT on day 14 in two TF treated EAE mice. Lesions are indicated (yellow arrows) in the cerebellum and also in periventricular regions. Differences in body weight were analysed using Student's t-test; EAE scores and max scores were analysed using the Mann-Whitney U test; time to disease onset was analysed using the logrank test.
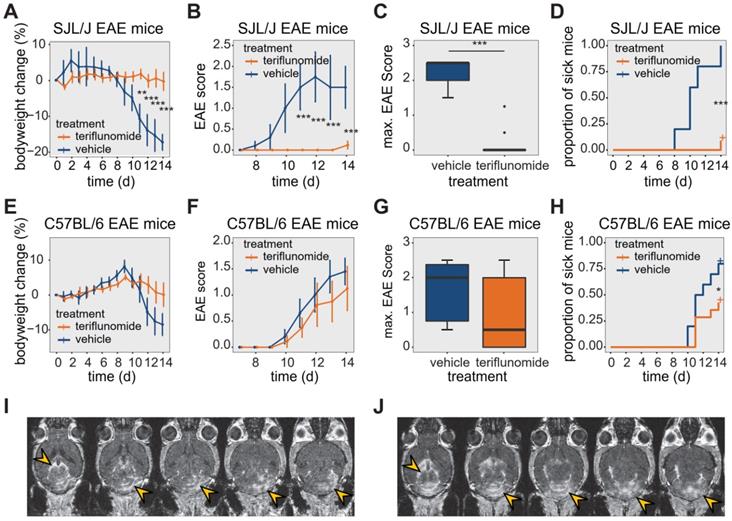
The response of C57BL/6 EAE mice (n = 9, pooled from 3 EAE experiments) to TF treatment was less pronounced. TF-treated C57BL/6 EAE mice showed a less marked reduction in weight over time, but there was no significant difference in weight loss compared to vehicle-treated C57BL/6 EAE controls (n = 6, pooled from 3 EAE experiments) (p > 0.1) (Figure 1E). TF-treated C57BL/6 mice began to show clinical signs by day 10 p.i., and while EAE scores were generally lower than those of vehicle treated controls, there were no differences in EAE scores between the two groups (p > 0.5) (Figure 1F). Also, there was no significant decrease in maximum EAE score in TF-treated C57BL/6 EAE mice (0.5 ± 2, median ± IQR) compared to vehicle-treated (2 ± 1.625, median ± IQR) C57BL/6 EAE mice (p > 0.05) (Figure 1G). TF treatment reduced disease incidence by 65% and also delayed onset, compared to untreated mice (p = 0.04) (Figure 1H).
The extent of CNS inflammation was examined on day 14 by measuring BBB disruption using contrast-enhanced MRI (Figure 1I-J). We observed contrast-enhancing lesions in SJL/J EAE mice treated with TF, even in the absence of clinical signs. The extent of these lesions varied among animals, with some showing comparatively mild (Figure 1I) and others comparatively severe (Figure 1J) disruption. Contrast-enhancing lesions were particularly prominent in the cerebellum (Figure 1I-J) and were also present in periventricular regions (Figure 1J).
Environmental factors alter the magnetic resonance properties of teriflunomide
The physicochemical properties of TF in DMSO, including chemical shift, 19F T1 and 19F T2 relaxation times are shown in Figure 2A-C. Changes in T1 and T2 occur with different concentrations of gadopentetate dimeglumine (Figure 2D). We observed a linear correlation between the inverse T1 (R1) (T1-relaxation times 1099 ms, 209 ms, 117 ms, 60 ms, 33 ms; Pearson R = 0.999, p < 0.001) and inverse of T2 (R2; T2-relaxation times 547 ms, 76 ms, 43 ms, 24 ms; Pearson R = 0.999, p = 0.001) with increasing Gd-DTPA concentrations (Figure 2D).
19F MR characterization of teriflunomide in different chemical environments. (A) 19F MR spectrum of TF in a DMSO phantom (global single pulse, TR=1000 ms, acquisition time = 16 s, concentration: 27.02 mg/mL in 1 mL). (B) Spectroscopic determination of T1 of teriflunomide in DMSO (T1 = 1000 ms). (C) Spectroscopic determination of T2 of teriflunomide in DMSO (T2 = 465 ms) using a CPMG sequence. (D) Correlation of the relaxation rates R1 and R2 (inverse T1 and inverse T2) with the concentration of the contrast agent gadopentetate dimeglumine (0.5, 1, 2, 4 mM) in DMSO (R = 0.998, p = 9.17e-6 for R1 and R = 0.999, p = 0.001 for R2). TF concentration = 27.02 mg/mL. (E) 19F MR spectrum of TF in a carboxymethylcellulose (CMC) phantom (global single pulse, TR=1000 ms, acquisition time = 16 s, concentration: 2.70 mg/mL in 1 mL). (F) Change of the 19F T1 with pH in CMC. (G) Change of the 19F T2 with pH in CMC. (H) Change of the 19F signal intensity with pH in CMC; concentration in CMC: 2.70 mg/mL in 1 mL, pH was controlled by adding HCl and NaOH. (I) 19F MR spectrum of teriflunomide in a serum phantom (acquisition time = 8 s, concentration: 1.3 mM in 1 mL). (J) Spectroscopic determination of T1 of teriflunomide in human serum (T1 = 1017 ms). (K) Spectroscopic determination of T2 of teriflunomide in human serum (T2 = 4 ms) using a CPMG sequence. (L) Assessment of the spectroscopic limit of detection (SNR1) using different TF concentrations in serum (19F MRS measured with a 19F CRP, global single pulse, TR = 1000 ms, acquisition time = 17 min).
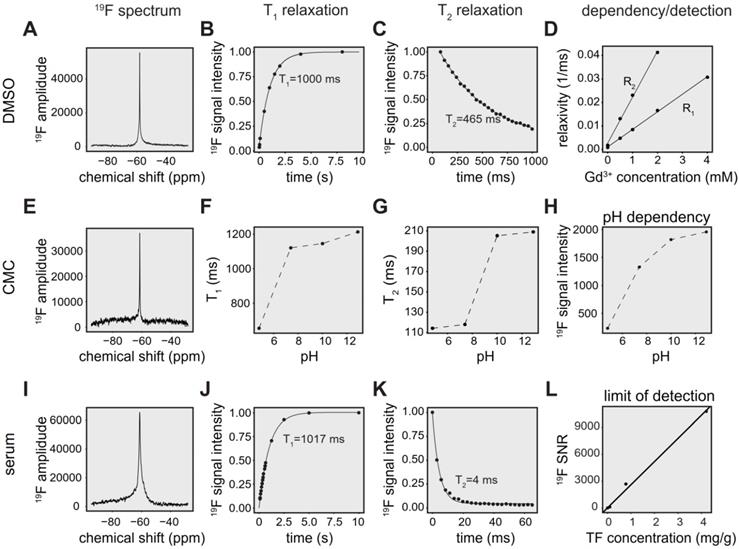
TF in CMC exhibits a single narrow peak spectrum (FWHM = 116 Hz) at ‑61 ppm (Figure 2E), in comparison to a peak at ‑58 ppm for experiments performed in DMSO (FWHM = 117 Hz) [70].
Both T1 (Figure 2F) and T2 (Figure 2G) were increased with increasing pH. We also observed increased signal intensity at higher pH using global single pulse spectroscopy with full relaxation (Figure 2H).
Compared to spectra in DMSO (FWHM = 117 Hz) [70], we observed a broader peak for TF in serum (FWHM = 528 Hz) at -61 ppm (Figure 2I). In addition, we characterized T1 (Figure 2J) and T2 (Figure 2K) in human serum in order to optimize pulse sequences for subsequent in vivo measurements. T1 of TF in serum was 1017 ms (Figure 2J, R² = 0.999), which was comparable to the T1 of 1000 ms in DMSO (Figure 2B). Conversely, T2 was markedly shortened to 4 ms (Figure 2K, R² = 0.963) in the presence of serum, which is 93-fold lower than the T2 of 465 ms in DMSO [70].
We obtained a detection limit for the 19F CRP using 19F MRS, validating the concentrations with mass spectrometry. At an SNR threshold of 5, the LOD was 1.9 µg/g, which is equal to 5.04e + 15 19F atoms in a volume of 400 µL (Figure 2L).
In vivo detection of teriflunomide in the abdominal region of healthy animals
Similar to TF spectra in CMC phantoms, we observed a TF peak at ‑61 ppm in healthy Dark Agouti rats (n=2) using 19F MRS (Figure S1A). Qualitatively, we discerned an initial increase in 19F MR signal followed by gradual decrease during the observation period of 30 minutes. We also detected TF in the abdominal region of healthy C57BL/6 mice (Figure S1B) 24 hours after the last drug administration, using the 19F CRP.
In vivo detection of teriflunomide in the head region
Similar to CMC phantoms and in vivo measurements in the rat abdomen, we observed a TF peak at ‑61 ppm in the mouse head region. We studied changes in TF levels in TF-treated healthy mice (Figure 3A, n = 6 on day8, n = 5 on day14, from 1 EAE experiment), and TF-treated EAE mice (Figure 3B, n = 7 on day8, n = 4 on day14, from 1 EAE experiment). Differences in animal numbers between the time points were either due to technical problems (4 cases) or due to animal welfare (mice needed to be euthanized due to disease severity, 2 cases). We observed a distinct second 19F peak in healthy and EAE animals (-75 to -85 ppm). The -75 ppm peak was seen at a later stage of EAE and was also observed in the abdomen of EAE mice (data not shown).
19F MR detection of teriflunomide (TF) in vivo. (A-B) 19F MR teriflunomide signal from the heads of healthy (A) and EAE (B) mice on day 8 and day 14 following the start of daily teriflunomide treatments. Measurements were performed 16-24 h after the last gavage (acquisition time = 17 min). (C-D) 19F MR signal calculated in the time domain as signal intensity from the FID fit (C) and frequency domain as peak area, integral of the main peak (δF = -61ppm) using the Lorentzian fit (D) and SNR (signal per one SD of the noise) of the same peak (E) plotted as arbitrary units for all EAE and healthy SJL/J animals for days 8 and 14.
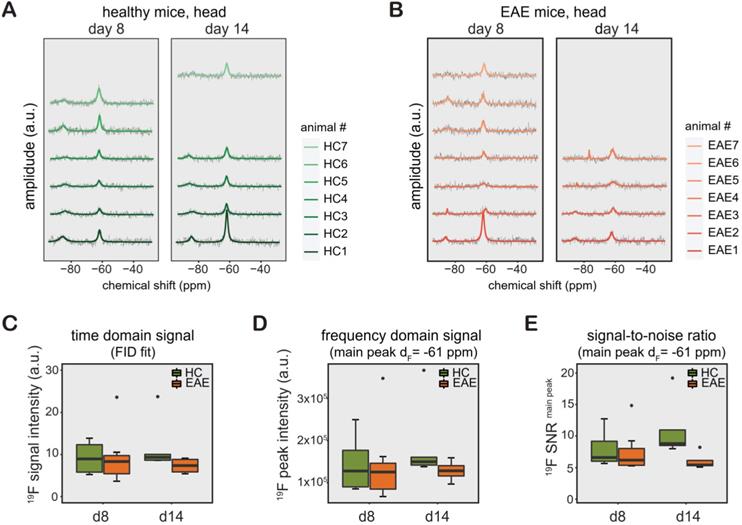
The 19F MR signal from the processed spectra of EAE and healthy mice is represented in both TD as FID fit (Figure 3C) and FD as peak area (integral of the main peak) at ‑61 ppm (Figure 3D) and SNR1 of this peak (Figure 3E). Data from these mice are shown separately in Table S1 (the raw data is also available as supplemental material). We did not observe any significant differences between the groups between day 8 and day 14, between EAE and healthy control mice (all p > 0.1) or in the pairwise comparisons (all p > 0.1) for all data, irrelevant whether FID fit, integral or SNR of main peak. In addition, we did not observe differences in variance of the 19F signal intensities (FID fit, integral or SNR) among the animals groups on any day or any of the pairwise comparisons (all p > 0.1).
Ex vivo determination of teriflunomide levels in healthy and EAE animals
The TF-derived signal was also measured in the serum of SJL/J EAE mice by 19F MRS (Figure S1C). TF concentrations in serum, CSF and perfused brain tissue were quantified by HPLC/MS for both SJL/J and C57BL/6 mice (Table 1). We calculated the LOD of the HPLC method to be 4.9 pg/g. In SJL/J mice there was a strong difference between biological samples (main effect p < 0.001), but no significant difference between healthy and EAE animals. TF concentrations in serum were an order of magnitude higher than those in perfused brain tissue or CSF, for both healthy and EAE animals (all p values < 0.001) (Figure 4A, left panel). In C57BL/6 mice, there was again a strong difference between biological samples (main effect p < 0.001), with TF concentrations in serum greater than those in perfused brain tissue or CSF (p < 0.001). Upon post-hoc comparisons, we observed that TF concentrations in the CSF were greater than in the perfused brain tissue, both for C57BL/6 EAE mice (p = 0.0025) and for C57BL/6 healthy control mice (p = 0.032) (Figure 4A, right panel).
Concentrations of teriflunomide in µg/g detected via HPLC/MS from ex vivo samples from EAE and healthy SJL/J and C57BL/6 mice (median ± interquartile range)
| SJL/J | C57BL/6 | |||
|---|---|---|---|---|
| EAE (n = 7) | Healthy (n = 6) | EAE (n = 4) | Healthy (n = 3) | |
| Serum | 32.5 ± 13.8 | 33.8 ± 17.9 | 19.0 ± 6.8 | 20.6 ± 7.4 |
| CSF | 1.7 ± 2.2 | 1.0 ± 1.0 | 0.5 ± 0.5 | 0.9 ± 0.3 |
| Brain | 0.6 ± 0.9 | 0.5 ± 0.3 | 0.1 ± 0.0 | 0.3 ± 0.1 |
Detection of teriflunomide by mass spectrometry. (A) Plot showing the detection of teriflunomide by mass spectrometry in the brain, CSF and serum of EAE and healthy animals of both strains SJL/J and C57BL/6 on day 14 (EAE SJL/J n = 7, healthy SJL/J n = 6, EAE C57BL/6 n = 4, healthy C57BL/6 n = 3). (B) Calibration curve for 19F MRS quantification using HPLC/MS concentrations of TF dissolved in serum and the corresponding 19F MRS signal intensities (SNR1; 19F MRS measured with a 19F CRP, global single pulse, TR = 1000 ms, acquisition time = 17 min, linear fit with Spearman ρ = 1.000, p = 0.333). (C) Correlation of 19F MR signal quantification ex vivo in the serum of TF treated mice with concentrations measured by mass spectrometry in serum (19F MRS measured with a 19F CRP, global single pulse, TR = 1000 ms, acquisition time=1 min, Spearman ρ = 0.903, p = 0.001, dotted line with slope = 1).
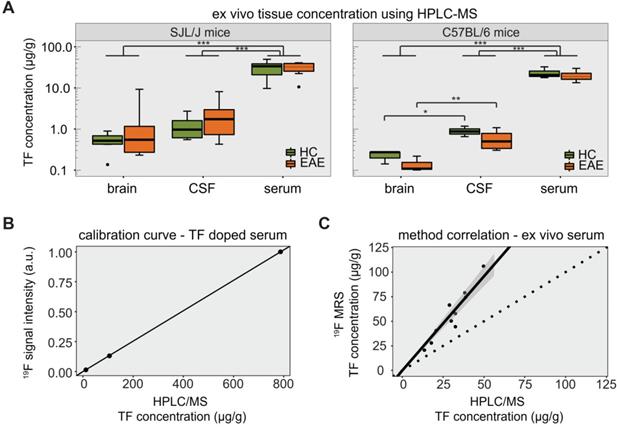
We observed significant differences in the variance of TF concentrations. In SJL/J mice, these differences were seen among perfused brain, CSF and serum samples (p < 0.001) but not between EAE and healthy control groups when considering all ex vivo samples (p = 0.945). When comparing EAE vs. healthy controls for each tissue separately (pairwise comparisons), the variance in TF concentration was significantly greater in the EAE group in the case of brain tissue (p = 0.048), but not CSF and serum samples (Figure 4A, left panel). In C57BL/6 mice, differences in variance were also seen among perfused brain, CSF and serum samples (p < 0.001). There was again no difference in TF variance between EAE and healthy controls (p = 0.406), even when performing the pairwise comparisons for each tissue (Figure 4A, right panel).
The HPLC/MS quantification of TF concentrations was important to establish the ground truth for validating in vivo 19F MRS data. A calibration of FD 19F MRS signal intensities with HPLC/MS concentration values in mouse serum (spiked with different TF dilution) is shown in Figure 4B. The resulting linear fit (Spearman ρ = 1.000, p = 0.333), was used to estimate the concentration from the FD 19F MR signal intensity. Compared to the HPLC/MS quantification, TF concentrations estimated from 19F MRS were elevated with a maximum relative deviation of 130% and a mean relative deviation of 83% (Figure 4C). However, TF concentrations determined by 19F MRS showed a clear correlation with concentrations determined by HPLC/MS (Spearman ρ = 0.903, p = 0.001).
Discussion
In this study, we show that non-invasive 19F MR methods can be used to detect TF in vivo. Ex vivo HPLC/MS analyses confirmed the availability of TF in the CNS at pharmacologically relevant concentrations [56]. The therapeutic effect was strain-dependent, being less pronounced in C57BL/6 mice. This could be attributed to the diverging pathology that both strains present during the course of an EAE: in SJL/J mice the pathology is mainly localized to the brain, in C57BL/6 mice lesions are mostly prevalent in the spinal cord [71]. EAE in SJL/J mice presents as a relapsing-remitting disease (similar to RRMS patients). EAE in C57BL/6 mice follows a chronic disease progression without remissions and relapses (similar to progressive/secondary progressive MS). These strain differences were behind the rationale for studying different mechanism of action of DMDs for the treatment of RRMS and P/SPMS [56]. Different responses to TF treatment among species and strains could be also attributed to differences in target binding potencies [72] or immune cell susceptibilities [56].
Despite increasing concerns regarding the risks of long-term deposition in the brain, contrast-enhanced MRI remains a key tool for diagnosis and differential diagnosis [73-75]. In this study we observed contrast-enhanced brain lesions at the expected time of peak disease, even in asymptomatic TF-treated EAE mice. This underscores the critical role of MRI for early detection of pathology in MS and EAE, even prior to the occurrence of clinical signs and that clinical scoring alone is not sufficient to fully assess the disease status [58].
In addition to peripheral effects and mechanisms of action, many DMDs for MS are expected to work within the CNS. Thus a non-invasive method that studies drug distribution in the CNS would be a useful tool in MS drug development and in treatment monitoring. Hence, we are addressing an area of major interest in MS that could benefit from new studies investigating therapies and their distribution in vivo. Nevertheless, the in vivo detection of 19F compounds with 19F MR methods remains challenging. This is primarily due to the low drug concentrations available in the human body [70]. Additionally, technological challenges in terms of hardware sensitivity and measurement precision and accuracy limit swift transitions to clinical applications.
19F MR spectroscopy techniques have been used for several years to detect fluorinated drugs in small animals [33-38] and humans [39-45]. The chemotherapeutic agent 5-Fluorouracil (5-FU) has been studied by 19F MRS in tumor-bearing rats [34] and patients with head and neck tumors [45] and more recently it was detected by 19F MRI in tumor bearing mice using high drug doses and fast spin echo sequences [38]. 19F MRS imaging (MRSI) of fluvoxamine and fluoxetine was performed in patients with major depressive disorder who were on long term treatment with these drugs [42]. Alternatively, therapeutic compounds containing cytosine (e.g. the neuroprotective drug citicoline or the anticancer drug gemcitabine) can be detected via chemical exchange saturation transfer (CEST) MRI; these molecules contain exchangeable protons that can be selectively saturated and then detected indirectly through the water signal. Recently, the potential of CEST MRI to detect these therapeutic compounds in vivo has been shown [76, 77].
Compared to studies investigating fluorinated drugs at high doses [38, 44], in our present study we administered therapeutic doses of the fluorinated drug, which previously had shown an influence on the disease course in SJL/J EAE mice [56]. Additionally, we did not only acquire 19F MR signals right after administration of the drug as has previously been done [36, 78, 79], but we also detected accumulated TF levels over time, and during pathology.
Furthermore, in this study we characterized the MR properties of TF in serum, DMSO and CMC and at varying pH, to assess alterations in the physicochemical and MR properties, which are important to consider during interpretation of data. The pH in different compartments has a known impact on the solubility, binding kinetics and hence bioavailability of drug molecules [80]. pH variations result in different protonation of molecules, changing their MR properties, such as chemical shift [81] and relaxation times [82-86]. pH changes can also effect drug solubility, e.g. at low pH only a fraction of TF is dissolved and thus detected by 19F MR, the precipitated portion will not contribute to the MR signal. Furthermore, pH could also affect the properties of the CMC support matrix. The stomach environment could alter its protonation state and therefore its solubility, thereby affecting the 19F MR properties of TF [87, 88].
While the T1 of TF in serum was comparable to that in DMSO, the T2 was substantially shortened in serum, which is also indicated by a broader TF peak [89] in serum, when compared to DMSO. Similar to micelles and nanoparticles [90], CMC could perhaps bind to serum proteins, although one would assume that the drug will be mostly bound to serum proteins in the blood stream. In any case, a shortening of T2 if caused by drug serum binding (or CMC serum binding) makes signal detection more challenging when using standard pulse sequences.
Here, we used a three-parameter exponential fit, taking an offset of the signal decay into account until reaching the level of noise. Potentially, another fraction of TF exhibiting a different relaxation behavior might contribute to the acquired signal, which however, cannot be distinguished in the experiments performed here. Conversely, an increase in TF MR signal can be expected in short TR measurements in the presence of gadolinium-based contrast agents due to a reduction in T1 saturation effects. This has implications for neuroinflammation since TF is likely to localize at sites of inflammatory activity in the brain or the spinal cord, and thus its proximity to gadolinium-enhanced lesions in the CNS might increase its detection.
We previously showed that temperature can influence the MR parameters of TF [70]. Here, 19F MR signals increased with increasing pH. Differences in spectral widths between TF in DMSO, CMC and serum can be explained by environmental effects such as different solubility of the drug in the medium and protein-binding effects (99% of TF is plasma protein bound) [91].
As a first step towards studying drug distribution in vivo, we measured the 19F MR signal in the abdominal region of healthy rats. The 19F MR signal was acquired directly after TF administration into the stomach; we assume that most of this signal originates from the stomach during the first few minutes. Changes in 19F signal in rats following oral administration can be attributed to pH and temperature changes in the stomach that may alter the solubility or binding of TF to CMC. We hypothesize that pH might play an ambivalent role in different environments e.g. in the stomach, in CMC or in DMSO with respect to solubility and consequently TF detection. The decreasing trend in 19F signal after the six-minute measurement could suggest a gradual influence of the acidic pH in the stomach on signal intensity but also a gradual distribution to the intestinal compartment and absorption into the blood circulation. We expect that the 19F MR signal from the abdominal region in EAE mice, measured 24 h after the last drug administration originates primarily from the liver (highest concentration of TF after blood) [92].
When studying the in vivo 19F MR signal of TF in the head region, we observed no changes between day 8 and day 14 p.i. In patients, TF has a half-life of approximately 15 days [51, 93] administered at a dose of 14 mg per day (circa 250 µg/kg). This corresponds to a mouse dose of circa 3 mg/kg [60]. In the current study and previous ones [55, 56] mice received 3-10 times this dose, which is needed to have an effect on the disease course [56]. Leflunomide, the prodrug of TF, reaches steady state in 7 weeks when administered orally at a daily dose of 20 mg (circa 350 µg/kg). If linear pharmacokinetics are assumed [94], the steady state of TF dose used in mice is expected to be reached earlier than day 8.
Interestingly, we observed a second peak in the range of -75 to ‑85 ppm alongside the main TF peak at ‑61 ppm in healthy and EAE mice, and in their ex vivo sera, but not in in vivo experiments carried out soon after drug administration in the rat. We assume that this peak is a TF metabolite. While we are not aware of any specific TF metabolites that resonate at this range, we are certain that this is not a contamination since it was not reproduced in our phantom experiments and our animals had not been exposed to any other 19F compounds. We believe this second peak surely warrants further investigation and might be valuable to further pharmacological research.
The major metabolite of TF in human plasma is 4-trifluoro-methylaniline oxanilic acid (4-TMOA) [51, 95]. This metabolite has a chemical shift of -59.7 ppm and would overlap with the TF parent compound [96]. Other metabolites such as mono-oxidated TF sulfate, 4-trifluoromethylaniline 2-hydroxy-maionanlc malonamic acid and its sulfate were identified in urine, and mono-oxidated TF sulfate and mono-oxidated TF in feces [95].
The chemical shifts of most CF3 groups lie within the range of -60 to -80 ppm. A more negative chemical shift would indicate increased shielding of the CF3 group, which can occur as a result of branching near the CF3 group or close proximity to hydrogen bond donors [97]. In human subjects the total amount of these metabolites in plasma is lower than 1 % of the parent compound (in contrast to urine and feces) and probably not detectable in vivo [95, 98]. However, this might also be different in mice. Different metabolic rates and processes can be an explanation of this finding. Even the EAE pathology might have an impact due to changes in metabolic processes during inflammation [99] and warrants further investigation in future studies.
In a rat EAE model, TF distribution to the brain was shown by whole-body autoradiography [92], whereas no TF could be detected in the brains of EAE mice when using MALDI-MS [100]. The in vivo 19F MR signal that we acquired in the head region of healthy and EAE mice with 19F MRS could reflect TF signals in the blood, CSF, brain parenchyma, or perhaps even infiltrating immune cells that are causing the pathology. Since we did not observe any significant differences in TF signal between the healthy controls and EAE mice in vivo, there is no evidence of pathology-related alterations in the drug distribution into the head region.
The results from mass spectrometry measurements also did not show significant differences in TF concentrations in perfused brain tissue, CSF and serum between EAE mice and healthy controls. Nevertheless, TF was detectable in CSF and perfused brain tissue in both SJL/J and C57BL/6 mice, though these were significantly lower than serum concentrations. This distribution pattern could reflect the route of the drug from the systemic circulation to the brain via the CSF or the vasculature.
The observed interindividual differences in TF levels are consistent with a TF study performed in patients where steady state plasma concentrations were in the range 7.6-14.8 mg/L and 11-16.9 mg/L following at least 8 weeks daily intake [93].
One caveat of the study was that we could not perform automatic power adjustments during the in vivo measurements in the mouse head, due to low SNR; instead we performed short measurements with different reference power settings on the living animal to determine the optimal reference power to reach the 90 ° flip angle. Nonetheless the uncertainty in the flip angle due to potential differences in the positioning of the animal or coil filling factors could be a potential source of variability in the 19F detection. We did not use a reference tube during the in vivo measurements for several technical (overlapping signals, potential signal losses), physical (complex in vivo setup and limited space) and animal welfare related (breathing obstruction) reasons.
A comparison between the 19F MRS method and the HPLC/MS method in ex vivo serum samples showed a linear correlation. However, there were deviations between HPLC/MS and 19F MRS concentration estimations; one could attribute these either to an overestimation by the 19F MRS method or an underestimation by the HPLC/MS method. The proportion of metabolite to parent compound might be higher in mice than in human subjects. Therefore, one could speculate, that the 19F MRS peak at ‑61 ppm overlaps with a significant amount of its metabolite. Potentially, metabolites detected by 19F MRS are not quantified by the HPLC/MS method and thereby could explain the deviation in the concentration estimation in both methods. Alternatively, differences in the properties of TF between spiked and ex vivo serum samples (e.g. differences in protein composition, conductive properties) might be a source for this deviation. Still, both methods were shown to correlate with each other and indicate that TF concentrations could be measured with 19F MRS in future studies, possibly even as non-invasive tool in vivo.
While there are still limitations in terms of technological development — in particular with regard to exact calibration of reference power due to low 19F amounts — we highlight here the usefulness and general feasibility of this approach for studying the biodistribution of fluorinated drugs. In this study, we needed to address several challenges for detecting TF in vivo. The quadrature, cryogenically cooled surface coil that we used in this study confers a theoretical increase in sensitivity of 40% [101] compared to a linear coil, but prohibits a dual-tunable feature that accommodates 1H imaging.
To distinguish the distribution of TF in different brain regions 19F MR imaging or localized 19F MR spectroscopy would be highly valuable. This is possible when studying neuroinflammation with 19F MRI and perfluoro-15-crown-5-ether nanoparticles; the 19F MR signal in the CNS and associated lymphatic system is sufficient for single-voxel spectroscopy e.g. PRESS (Point RESolved Spectroscopy) [61] and 19F MR imaging, even when using a RT coil [61]. This is not the case for small molecules such as TF that are available in much smaller quantities in the CNS. Understanding the specific 19F MR properties of the drug of interest will allow the choice and tailoring of appropriate MR pulse sequences. While determining the specific origin of signals detected with non-localized MR spectroscopy is not possible, hypotheses on the origin of signals could be verified by using single voxel spectroscopy. Nevertheless, due to a low T2 of TF in serum as well as the low TF concentrations expected in vivo at a therapeutic level, localized single-voxel MR spectroscopy or MRSI are not trivial techniques to be applied.
In this study we characterized the MS drug teriflunomide in phantom experiments and in vivo in the animal model of MS. The 19F CRP significantly boosts SNR compared to other available RF coil technologies and enabled the in vivo detection of TF-derived 19F MR signals in EAE mice within a short time [62]. However, more technological developments are needed to further boost 19F MR signal sensitivity to ultimately achieve drug quantification within specific tissue compartments [102]. The combination of multiple approaches such as using cryogenically cooled RF coils [62], higher magnetic fields [103] and methods to accelerate data acquisition such as compressed sensing [104] will be key to achieve this goal and allow monitoring drugs in vivo with 19F MRI.
Abbreviations
BBB: blood brain barrier; CFA: complete Freund's adjuvants; CMC: carboxymethylcellulose; CNS: central nervous system; CRP: cryoprobe; CSF: cerebrospinal fluid; DMD: disease modifying drug; EAE: experimental autoimmune encephalomyelitis; FWHM: full-width half maximum; HPLC/MS: high performance liquid chromatography mass spectrometry; LOD: limit of detection; MOG: myelin oligodendrocyte glycoprotein peptide; MR: magnetic resonance; MRI: magnetic resonance imaging; MRS: magnetic resonance spectroscopy; MS: Multiple Sclerosis; PLP: proteolipid protein peptide; PRESS: Point RESolved Spectroscopy; RRMS: relapse-remitting Multiple Sclerosis; SNR: signal-to-noise ratio; TF: teriflunomide.
Acknowledgements
This study was supported by Sanofi-Aventis, the European Research Council (ERC) to TN (743077, ThermalMR) and the Deutsche Forschungsgemeinschaft to SW (DFG WA2804). The authors would like to thank Stefanie Münchberg, Victoria Prochnov and Mariya Aravina for technical assistance.
Author Contributions
CP acquired, analyzed, interpreted the data and wrote the first draft of the manuscript; LS and JMM assisted with data acquisition, analysis and interpretation; MR acquired and analyzed the HPLC/MS data; AF, PRD, HW and AP assisted with analysis of MR data, AF, MN, FP and TN revised the manuscript critically for important intellectual content, SW conceived the experiments, analyzed and interpreted the data and wrote the manuscript with CP.
Supplementary Material
Supplementary figures and tables.
Competing Interests
C.P. received presentation fees from Sanofi-Aventis. J.M.M. received presentation fees from Novartis. M.R. is founder and CEO of Lipidomix GmbH. T.N. is founder and CEO of MRI.TOOLS GmbH and received travel funds from Siemens Healthcare. S.W. received research grants from Novartis and Genzyme and presentation fees from Novartis.
References
1. Dendrou CA, Fugger L, Friese MA. Immunopathology of multiple sclerosis. Nat Rev Immunol. 2015;15:545-58
2. Baecher-Allan C, Kaskow BJ, Weiner HL. Multiple Sclerosis: Mechanisms and Immunotherapy. Neuron. 2018;97:742-68
3. Reich DS, Lucchinetti CF, Calabresi PA. Multiple Sclerosis. N Engl J Med. 2018;378:169-80
4. Krieger SC, Cook K, De Nino S, Fletcher M. The topographical model of multiple sclerosis: A dynamic visualization of disease course. Neurol Neuroimmunol Neuroinflamm. 2016;3:e279
5. Sinnecker T, Kuchling J, Dusek P, Dörr J, Niendorf T, Paul F. et al. Ultrahigh field MRI in clinical neuroimmunology: a potential contribution to improved diagnostics and personalised disease management. EPMA J. 2015;6:16
6. Wuerfel J, Sinnecker T, Ringelstein EB, Jarius S, Schwindt W, Niendorf T. et al. Lesion morphology at 7 Tesla MRI differentiates Susac syndrome from multiple sclerosis. Mult Scler. 2012;18:1592-9
7. Sinnecker T, Dorr J, Pfueller CF, Harms L, Ruprecht K, Jarius S. et al. Distinct lesion morphology at 7-T MRI differentiates neuromyelitis optica from multiple sclerosis. Neurology. 2012;79:708-14
8. Absinta M, Sati P, Reich DS. Advanced MRI and staging of multiple sclerosis lesions. Nat Rev Neurol. 2016;12:358-68
9. Filippi M, Preziosa P, Banwell BL, Barkhof F, Ciccarelli O, De Stefano N. et al. Assessment of lesions on magnetic resonance imaging in multiple sclerosis: practical guidelines. Brain. 2019;142:1858-75
10. Geraldes R, Ciccarelli O, Barkhof F, De Stefano N, Enzinger C, Filippi M. et al. The current role of MRI in differentiating multiple sclerosis from its imaging mimics. Nat Rev Neurol. 2018;14:199
11. Thompson AJ, Banwell BL, Barkhof F, Carroll WM, Coetzee T, Comi G. et al. Diagnosis of multiple sclerosis: 2017 revisions of the McDonald criteria. Lancet Neurol. 2018;17:162-73
12. Cohan S, Chen C, Baraban E, Stuchiner T, Grote L. MRI utility in the detection of disease activity in clinically stable patients with multiple sclerosis: a retrospective analysis of a community based cohort. BMC Neurol. 2016;16:184
13. Bermel RA, Naismith RT. Using MRI to make informed clinical decisions in multiple sclerosis care. Curr Opin Neurol. 2015;28:244-9
14. Naismith RT. Multiple sclerosis should be treated using a step-down strategy rather than a step-up strategy-NO. Mult Scler. 2016;22:1400-2
15. Erbayat Altay E, Fisher E, Jones SE, Hara-Cleaver C, Lee J-C, Rudick RA. Reliability of classifying multiple sclerosis disease activity using magnetic resonance imaging in a multiple sclerosis clinic. JAMA Neurol. 2013;70:338-44
16. Tintore M, Rovira A, Rio J, Otero-Romero S, Arrambide G, Tur C. et al. Defining high, medium and low impact prognostic factors for developing multiple sclerosis. Brain. 2015;138:1863-74
17. O'Connor PW, Li D, Freedman MS, Bar-Or A, Rice GP, Confavreux C. et al. A Phase II study of the safety and efficacy of teriflunomide in multiple sclerosis with relapses. Neurology. 2006;66:894-900
18. Tintore M, Vidal-Jordana A, Sastre-Garriga J. Treatment of multiple sclerosis - success from bench to bedside. Nat Rev Neurol. 2019;15:53-8
19. Rommer PS, Milo R, Han MH, Satyanarayan S, Sellner J, Hauer L. et al. Immunological Aspects of Approved MS Therapeutics. Front Immunol. 2019;10:1564
20. Gehr S, Kaiser T, Kreutz R, Ludwig WD, Paul F. Suggestions for improving the design of clinical trials in multiple sclerosis-results of a systematic analysis of completed phase III trials. EPMA J. 2019;10:425-36
21. Tsareva E, Kulakova O, Boyko A, Favorova O. Pharmacogenetics of multiple sclerosis: personalized therapy with immunomodulatory drugs. Pharmacogenet Genomics. 2016;26:103-15
22. Grossman I, Knappertz V, Laifenfeld D, Ross C, Zeskind B, Kolitz S. et al. Pharmacogenomics strategies to optimize treatments for multiple sclerosis: Insights from clinical research. Prog Neurobiol. 2017;152:114-30
23. Pistono C, Osera C, Boiocchi C, Mallucci G, Cuccia M, Bergamaschi R. et al. What's new about oral treatments in Multiple Sclerosis? Immunogenetics still under question. Pharmacol Res. 2017;120:279-93
24. Lassmann H. Targets of therapy in progressive MS. Mult Scler J. 2017;23:1593-9
25. Gomes CM, Abrunhosa AJ, Ramos P, Pauwels EK. Molecular imaging with SPECT as a tool for drug development. Adv Drug Deliv Rev. 2011;63:547-54
26. Perkins AC, Frier M. Radionuclide imaging in drug development. Curr Pharm Des. 2004;10:2907-21
27. Matthews PM, Rabiner EA, Passchier J, Gunn RN. Positron emission tomography molecular imaging for drug development. Br J Clin Pharmacol. 2012;73:175-86
28. Lindner JR, Link J. Molecular Imaging in Drug Discovery and Development. Circ Cardiovasc Imaging. 2018;11:e005355
29. Waaijer SJH, Kok IC, Eisses B, Schröder CP, Jalving M, Brouwers AH. et al. Molecular Imaging in Cancer Drug Development. J Nucl Med. 2018;59:726-32
30. Niendorf T, Ji Y, Waiczies S. Fluorinated Natural Compounds and Synthetic Drugs. In: Ahrens ET, Flögel U, editor. Fluorine Magnetic Resonance Imaging. 1 ed: Pan Stanford Publishing. 2016 p: 311-44
31. Reid DG, Murphy PS. Fluorine magnetic resonance in vivo: a powerful tool in the study of drug distribution and metabolism. Drug Discov Today. 2008;13:473-80
32. Wolf W, Presant CA, Waluch V. 19F-MRS studies of fluorinated drugs in humans. Adv Drug Deliv Rev. 2000;41:55-74
33. Stevens AN, Morris PG, Iles RA, Sheldon PW, Griffiths JR. 5-Flourouracil metabolism monitored in vivo by 19F NMR. Br J Cancer. 1984;50:113-7
34. McSheehy P, Prior M, Griffiths J. Prediction of 5-fluorouracil cytotoxicity towards the Walker carcinosarcoma using peak integrals of fluoronucleotides measured by MRS in vivo. Br J Cancer. 1989;60:303-9
35. Desmoulin F, Gilard V, Malet-Martino M, Martino R. Metabolism of capecitabine, an oral fluorouracil prodrug: (19)F NMR studies in animal models and human urine. Drug Metab Dispos. 2002;30:1221-9
36. Morikawa S, Inubushi T, Morita M, Murakami K, Masuda C, Maki J. et al. Fluorine-19 fast recovery fast spin echo imaging for mapping 5-fluorouracil. Magn Reson Med Sci. 2007;6:235-40
37. Cron GO, Beghein N, Ansiaux R, Martinive P, Feron O, Gallez B. 19F NMR in vivo spectroscopy reflects the effectiveness of perfusion-enhancing vascular modifiers for improving gemcitabine chemotherapy. Magn Reson Med. 2008;59:19-27
38. Doi Y, Shimmura T, Kuribayashi H, Tanaka Y, Kanazawa Y. Quantitative (19)F imaging of nmol-level F-nucleotides/-sides from 5-FU with T(2) mapping in mice at 9.4T. Magn Reson Med. 2009;62:1129-39
39. Karson CN, Newton JE, Livingston R, Jolly JB, Cooper TB, Sprigg J. et al. Human brain fluoxetine concentrations. J Neuropsychiatry Clin Neurosci. 1993;5:322-9
40. Karson CN, Newton JE, Mohanakrishnan P, Sprigg J, Komoroski RA. Fluoxetine and trifluoperazine in human brain: a 19F-nuclear magnetic resonance spectroscopy study. Psychiatry Res. 1992;45:95-104
41. Komoroski RA, Newton JE, Cardwell D, Sprigg J, Pearce J, Karson CN. In vivo 19F spin relaxation and localized spectroscopy of fluoxetine in human brain. Magn Reson Med. 1994;31:204-11
42. Bolo NR, Hode Y, Nedelec JF, Laine E, Wagner G, Macher JP. Brain pharmacokinetics and tissue distribution in vivo of fluvoxamine and fluoxetine by fluorine magnetic resonance spectroscopy. Neuropsychopharmacology. 2000;23:428-38
43. Ji Y, Waiczies H, Winter L, Neumanova P, Hofmann D, Rieger J. et al. Eight-channel transceiver RF coil array tailored for (1)H/(1)(9)F MR of the human knee and fluorinated drugs at 7.0 T. NMR Biomed. 2015;28:726-37
44. Durst P, Schuff N, Crocq M-A, Mokrani M-C, Macher J-P. Noninvasive in vivo detection of a fluorinated neuroleptic in the human brain by 19F nuclear magnetic resonance spectroscopy. Psychiatry Res Neuroimaging. 1990;35:107-14
45. Schlemmer H-P, Becker M, Bachert P, Dietz A, Rudat V, Vanselow B. et al. Alterations of intratumoral pharmacokinetics of 5-fluorouracil in head and neck carcinoma during simultaneous radiochemotherapy. Cancer Res. 1999;59:2363-9
46. Lanza GM, Jenkins J, Schmieder AH, Moldobaeva A, Cui G, Zhang H. et al. Anti-angiogenic Nanotherapy Inhibits Airway Remodeling and Hyper-responsiveness of Dust Mite Triggered Asthma in the Brown Norway Rat. Theranostics. 2017;7:377-89
47. Wu L, Wen X, Wang X, Wang C, Sun X, Wang K. et al. Local Intratracheal Delivery of Perfluorocarbon Nanoparticles to Lung Cancer Demonstrated with Magnetic Resonance Multimodal Imaging. Theranostics. 2018;8:563-74
48. Shin SH, Park EJ, Min C, Choi SI, Jeon S, Kim YH. et al. Tracking Perfluorocarbon Nanoemulsion Delivery by 19F MRI for Precise High Intensity Focused Ultrasound Tumor Ablation. Theranostics. 2017;7:562-72
49. Metelev V, Zhang S, Zheng S, Kumar ATN, Bogdanov A Jr. Fluorocarbons Enhance Intracellular Delivery of Short STAT3-sensors and Enable Specific Imaging. Theranostics. 2017;7:3354-68
50. Derfuss T, Mehling M, Papadopoulou A, Bar-Or A, Cohen JA, Kappos L. Advances in oral immunomodulating therapies in relapsing multiple sclerosis. Lancet Neurol. 2020 p: 336-47
51. Wiese MD, Rowland A, Polasek TM, Sorich MJ, O'Doherty C. Pharmacokinetic evaluation of teriflunomide for the treatment of multiple sclerosis. Expert Opin Drug Metab Toxicol. 2013;9:1025-35
52. Xu M, Lu X, Fang J, Zhu X, Wang J. The efficacy and safety of teriflunomide based therapy in patients with relapsing multiple sclerosis: A meta-analysis of randomized controlled trials. J Clin Neurosci. 2016;33:28-31
53. Radue EW, Sprenger T, Gaetano L, Mueller-Lenke N, Cavalier S, Thangavelu K. et al. Teriflunomide slows BVL in relapsing MS: A reanalysis of the TEMSO MRI data set using SIENA. Neurol Neuroimmunol Neuroinflamm. 2017;4:e390
54. Bar-Or A. Teriflunomide (Aubagio®) for the treatment of multiple sclerosis. Exp Neurol. 2014 262, Part A: 57-65
55. Merrill J, Hanak S, Pu S-F, Liang J, Dang C, Iglesias-Bregna D. et al. Teriflunomide reduces behavioral, electrophysiological, and histopathological deficits in the Dark Agouti rat model of experimental autoimmune encephalomyelitis. J Neurol. 2009;256:89-103
56. Merrill JE. In vitro and in vivo pharmacological models to assess demyelination and remyelination. Neuropsychopharmacology. 2009;34:55-73
57. Ringheim GE, Lee L, Laws-Ricker L, Delohery T, Liu L, Zhang D. et al. Teriflunomide attenuates immunopathological changes in the dark agouti rat model of experimental autoimmune encephalomyelitis. Front Neurol. 2013;4:169
58. Lepore S, Waiczies H, Hentschel J, Ji Y, Skodowski J, Pohlmann A. et al. Enlargement of cerebral ventricles as an early indicator of encephalomyelitis. PloS one. 2013;8:e72841
59. Iglesias-Bregna D, Hanak S, Ji Z, Petty M, Liu L, Zhang D. et al. Effects of Prophylactic and Therapeutic Teriflunomide in Transcranial Magnetic Stimulation-Induced Motor-Evoked Potentials in the Dark Agouti Rat Model of Experimental Autoimmune Encephalomyelitis. J Pharmacol Exp Ther. 2013;347:203-11
60. Nair AB, Jacob S. A simple practice guide for dose conversion between animals and human. J Basic Clin Pharm. 2016;7:27-31
61. Waiczies H, Lepore S, Drechsler S, Qadri F, Purfürst B, Sydow K. et al. Visualizing brain inflammation with a shingled-leg radio-frequency head probe for 19F/1H MRI. Sci Rep. 2013;3:1280
62. Waiczies S, Millward JM, Starke L, Delgado PR, Huelnhagen T, Prinz C. et al. Enhanced Fluorine-19 MRI Sensitivity using a Cryogenic Radiofrequency Probe: Technical Developments and Ex vivo Demonstration in a Mouse Model of Neuroinflammation. Sci Rep. 2017;7:9808
63. Haase A, Frahm J, Matthaei D, Hanicke W, Merboldt KD. FLASH imaging. Rapid NMR imaging using low flip-angle pulses. J Magn Reson. 1986;67:258-66
64. Hennig J, Nauerth A, Friedburg H. RARE imaging: a fast imaging method for clinical MR. Magn Reson Med. 1986;3:823-33
65. Uğurbil K, Garwood M, Ellermann J, Hendrich K, Hinke R, Hu X. et al. Imaging at high magnetic fields: initial experiences at 4 T. Magn Reson Q. 1993;9:259-77
66. Schindelin J, Arganda-Carreras I, Frise E, Kaynig V, Longair M, Pietzsch T. et al. Fiji: an open-source platform for biological-image analysis. Nat Methods. 2012;9:676-82
67. Kreis R, Boer V, Choi IY, Cudalbu C, de Graaf RA, Gasparovic C. et al. Terminology and concepts for the characterization of in vivo MR spectroscopy methods and MR spectra: Background and experts' consensus recommendations. NMR Biomed. 2020 p: e4347
68. Günther H. NMR spectroscopy: basic principles, concepts, and applications in chemistry. 3 ed. Weinheim: Wiley-VCH. 2013
69. Near J, Harris AD, Juchem C, Kreis R, Marjańska M, Öz G. et al. Preprocessing, analysis and quantification in single-voxel magnetic resonance spectroscopy: experts' consensus recommendations. NMR Biomed. 2020 p: e4257
70. Prinz C, Delgado PR, Eigentler TW, Starke L, Niendorf T, Waiczies S. Toward (19)F magnetic resonance thermometry: spin-lattice and spin-spin-relaxation times and temperature dependence of fluorinated drugs at 9.4 T. Magn Reson Mater Phy. 2018; 10.1007/s10334-018-0722-8
71. Pierson E, Simmons SB, Castelli L, Goverman JM. Mechanisms regulating regional localization of inflammation during CNS autoimmunity. Immunol Rev. 2012;248:205-15
72. Fox RI, Herrmann ML, Frangou CG, Wahl GM, Morris RE, Strand V. et al. Mechanism of action for leflunomide in rheumatoid arthritis. Clin Immunol. 1999;93:198-208
73. El-Khatib AH, Radbruch H, Trog S, Neumann B, Paul F, Koch A. et al. Gadolinium in human brain sections and colocalization with other elements. Neurol Neuroimmunol Neuroinflamm. 2019;6:e515
74. Schlemm L, Chien C, Bellmann-Strobl J, Dörr J, Wuerfel J, Brandt AU. et al. Gadopentetate but not gadobutrol accumulates in the dentate nucleus of multiple sclerosis patients. Mult Scler. 2017;23:963-72
75. Boyken J, Niendorf T, Flemming B, Seeliger E. Gadolinium Deposition in the Brain after Contrast-enhanced MRI: Are the Data Valid? Radiology. 2018;288:630-2
76. Li Y, Chen H, Xu J, Yadav NN, Chan KW, Luo L. et al. CEST theranostics: label-free MR imaging of anticancer drugs. Oncotarget. 2016;7:6369-78
77. Liu H, Jablonska A, Li Y, Cao S, Liu D, Chen H. et al. Label-free CEST MRI Detection of Citicoline-Liposome Drug Delivery in Ischemic Stroke. Theranostics. 2016;6:1588-600
78. Wolf W, Presant CA, Servis KL, el-Tahtawy A, Albright MJ, Barker PB. et al. Tumor trapping of 5-fluorouracil: in vivo 19F NMR spectroscopic pharmacokinetics in tumor-bearing humans and rabbits. Proc Natl Acad Sci USA. 1990;87:492-6
79. Nakada T, Kwee IL, Griffey BV, Griffey RH. 19F 2-FDG NMR imaging of the brain in rat. Magn Reson Imaging. 1988;6:633-5
80. Florence AT, Attwood D. Solubility of Drugs in Liquids. In: Florence AT, Attwood D, editors. Physicochemical Principles of Pharmacy. London: Macmillan Education UK. 1981 p:125-72
81. Farrell D, Miranda E, Webb H, Georgi N, Crowley P, McIntosh L. et al. Titration_DB: Storage and analysis of NMR-monitored protein pH titration curves. Proteins. 2010;78:843-57
82. Moser E, Winklmayr E, Holzmüller P, Krssak M. Temperature- and pH-dependence of proton relaxation rates in rat liver tissue. Magn Reson Imaging. 1995;13:429-40
83. Meiboom S, Luz Z, Gill D. Proton Relaxation in Water. J Chem Phys. 1957;27:1411
84. Schilling AM, Blankenburg FB, Bernarding J, Heidenreich JO, Wolf KJ. Intracerebral pH affects the T2 relaxation time of brain tissue. Neuroradiology. 2002;44:968-72
85. Gerken JB. Measurement of pH by NMR Spectroscopy in Concentrated Aqueous Fluoride Buffers. J Fluor Chem. 2011;132:68-70
86. Grant R, Condon B, Moyns S, Patterson J, Hadley D, Teasdale G. Temporal physiochemical changes during in vitro relaxation time measurements: the cerebrospinal fluid. Magn Reson Med. 1988;6:397-402
87. Barbucci R, Magnani A, Consumi M. Swelling Behavior of Carboxymethylcellulose Hydrogels in Relation to Cross-Linking, pH, and Charge Density. Macromolecules. 2000;33:7475-80
88. Koshkina O, White PB, Staal AHJ, Schweins R, Swider E, Tirotta I. et al. Nanoparticles for “two color” 19F magnetic resonance imaging: Towards combined imaging of biodistribution and degradation. J Colloid Interface Sci. 2020;565:278-87
89. Jansen JF, Backes WH, Nicolay K, Kooi ME. 1H MR spectroscopy of the brain: absolute quantification of metabolites. Radiology. 2006;240:318-32
90. Corbo C, Molinaro R, Tabatabaei M, Farokhzad OC, Mahmoudi M. Personalized protein corona on nanoparticles and its clinical implications. Biomater Sci. 2017;5:378-87
91. Warnke C, Stuve O, Kieseier BC. Teriflunomide for the treatment of multiple sclerosis. Clin Neurol Neurosurg. 2013;115(Suppl 1):S90-4
92. Kaplan J, Cavalier S, Turpault S. Biodistribution of teriflunomide in naive rats vs rats with experimental autoimmune encephalomyelitis. Mult Scler J. 2015;21:141 -
93. Rakhila H, Rozek T, Hopkins A, Proudman S, Cleland L, James M. et al. Quantitation of total and free teriflunomide (A77 1726) in human plasma by LC-MS/MS. J Pharm Biomed Anal. 2011;55:325-31
94. Haraoui B. 57 - Leflunomide. In: Hochberg MC, Silman AJ, Smolen JS, Weinblatt ME, Weisman MH, editors. Rheumatology (Sixth Edition). Philadelphia. 2015 p:451-8
95. Yao X, Liu Y, Song L, Jiang J, Xiao F, Liu D. et al. Development of a simple HPLC-MS/MS method to simultaneously determine teriflunomide and its metabolite in human plasma and urine: Application to clinical pharmacokinetic study of teriflunomide sodium and leflunomide. Biomed Chromatogr. 2019;33:e4420
96. Wade KE, Troke J, Macdonald CM, Wilson ID, Nicholson JK. 19F NMR Studies of the Metabolism of Trifluoromethylaniline. In: Reid E, Robinson JD, Wilson ID, editors. Bioanalysis of Drugs and Metabolites, Especially Anti-Inflammatory and Cardiovascular. 1 ed. Boston, MA: Springer US. 1988 p:383-8
97. Dalvit C, Vulpetti A. Intermolecular and Intramolecular Hydrogen Bonds Involving Fluorine Atoms: Implications for Recognition, Selectivity, and Chemical Properties. ChemMedChem. 2012;7:262-72
98. Brunetti L, Wagner ML, Maroney M, Ryan M. Teriflunomide for the treatment of relapsing multiple sclerosis: a review of clinical data. Ann Pharmacother. 2013;47:1153-60
99. Morgan ET. Impact of infectious and inflammatory disease on cytochrome P450-mediated drug metabolism and pharmacokinetics. Clin Pharmacol Ther. 2009;85:434-8
100. Rzagalinski I, Hainz N, Meier C, Tschernig T, Volmer DA. Spatial and molecular changes of mouse brain metabolism in response to immunomodulatory treatment with teriflunomide as visualized by MALDI-MSI. Anal Bioanal Chem. 2018 p:353-65
101. Glover GH, Hayes CE, Pelc NJ, Edelstein WA, Mueller OM, Hart HR. et al. Comparison of linear and circular polarization for magnetic resonance imaging. J Magn Reson. 1985;64:255-70
102. Waiczies S, Srinivas M, Flögel U, Boehm-Sturm P, Niendorf T. Special issue on fluorine-19 magnetic resonance: technical solutions, research promises and frontier applications. Magn Reson Mater Phy. 2019;32:1-3
103. Waiczies S, Rosenberg JT, Kuehne A, Starke L, Delgado PR, Millward JM, et al. Fluorine-19 MRI at 21.1 T: enhanced spin-lattice relaxation of perfluoro-15-crown-5-ether and sensitivity as demonstrated in ex vivo murine neuroinflammation. Magn Reson Mater Phy. 2018
104. Starke L, Pohlmann A, Prinz C, Niendorf T, Waiczies S. Performance of compressed sensing for fluorine-19 magnetic resonance imaging at low signal-to-noise ratio conditions. Magn Reson Med. 2019 p:1-17
Author contact
![]() Corresponding author: Dr. Sonia Waiczies, Berlin Ultrahigh Field Facility (B.U.F.F.), Max Delbrück Center for Molecular Medicine (MDC) in the Helmholtz Association, Robert-Rössle-Str. 10 | D-13125 Berlin-Buch; E-mail: sonia.waicziesde.
Corresponding author: Dr. Sonia Waiczies, Berlin Ultrahigh Field Facility (B.U.F.F.), Max Delbrück Center for Molecular Medicine (MDC) in the Helmholtz Association, Robert-Rössle-Str. 10 | D-13125 Berlin-Buch; E-mail: sonia.waicziesde.