Impact Factor
 Global reach, higher impact
Theranostics 2020; 10(21):9890-9898. doi:10.7150/thno.46806 This issue Cite
Research Paper
Fluorescence background quenching as a means to increase Signal to Background ratio - a proof of concept during Nerve Imaging
Tessa Buckle1 ![]() , Steffen van der Wal1, Danny M. van Willigen1, Germaine Aalderink1, Gijs H. KleinJan1,2, Fijs W.B. van Leeuwen1
, Steffen van der Wal1, Danny M. van Willigen1, Germaine Aalderink1, Gijs H. KleinJan1,2, Fijs W.B. van Leeuwen1
1. Interventional Molecular Imaging Laboratory, Department of Radiology, Leiden University Medical Center, Leiden, The Netherlands.
2. Department of Urology, Leiden University Medical Center, Leiden, The Netherlands.
Received 2020-4-8; Accepted 2020-7-20; Published 2020-8-6
Abstract

Introduction: Adequate signal to background ratios are critical for the implementation of fluorescence-guided surgery technologies. While local tracer administrations help to reduce the chance of systemic side effects, reduced spatial migration and non-specific tracer diffusion can impair the discrimination between the tissue of interest and the background. To combat background signals associated with local tracer administration, we explored a pretargeting concept aimed at quenching non-specific fluorescence signals. The efficacy of this concept was evaluated in an in vivo neuronal tracing set-up.
Methods: Neuronal tracing was achieved using a wheat germ agglutinin (WGA) lectin. functionalized with an azide-containing Cy5 dye (N3-Cy5-WGA). A Cy7 quencher dye (Cy7-DBCO) was subsequently used to yield Cy7-Cy5-WGA, a compound wherein the Cy5 emission is quenched by Förster resonance energy transfer to Cy7. The photophysical properties of N3-Cy5-WGA and Cy7-Cy5-WGA were evaluated together with deactivation kinetics in situ, in vitro (Schwannoma cell culture), ex vivo (muscle tissue from mice; used for dose optimization), and in vivo (nervus ischiadicus in THY-1 YFP mice).
Results: In situ, conjugation of Cy7-DBCO to N3-Cy5-WGA resulted in >90% reduction of the Cy5 fluorescence signal intensity at 30 minutes after addition of the quencher. In cells, pretargeting with the N3-Cy5-WGA lectin yielded membranous staining, which could efficiently be deactivated by Cy7-DBCO over the course of 30 minutes (91% Cy5 signal decrease). In ex vivo muscle tissue, administration of Cy7-DBCO at the site where N3-Cy5-WGA was injected induced 80-90% quenching of the Cy5-related signal after 10-20 minutes, while the Cy7-related signal remained stable over time. In vivo, Cy7-DBCO effectively quenched the non-specific background signal up to 73% within 5 minutes, resulting in a 50% increase in the signal-to-background ratio between the nerve and injection site.
Conclusion: The presented pretargeted fluorescence-quenching technology allowed fast and effective reduction of the background signal at the injection site, while preserving in vivo nerve visualization. While this proof-of-principle study was focused on imaging of nerves using a fluorescent WGA-lectin, the same concept could in the future also apply to applications such as sentinel node imaging.
Keywords: Pretargeting, fluorescence imaging, nerve imaging, image-guided surgery, fluorescence activation
Introduction
Fluorescence-based imaging technologies that enable real-time illumination of specific anatomical structures are rapidly gaining ground in the field of image-guided surgery [1-3]. Herein the identification accuracy is highly dependent on the application of fluorescent tracers and accumulation thereof in the tissue of interest. Experimental implementation of new compounds and imaging concepts has been driven by routine clinical application of dyes such as indocyanine green and fluorescein [4]. Because light is heavily attenuated in tissue, fluorescence imaging was shown to have a relatively poor in vivo sensitivity compared to radio-guided surgery concepts [5, 6]. In many cases, this has resulted in the use of high tracer doses [7-9]. Reliance on high quantities of tracer not only drives up the cost of these molecular imaging procedures, it also increases the chance of background accumulation [10] that can impair diagnostic accuracy.
When the general location of an imaging target is already well-defined, local tracer administration provides an appealing alternative for intravenous tracer administration. This type of tracer deposition has proven its clinical potential during e.g. sentinel lymph node procedures. Human studies using local tracer administration have even demonstrated that fluorescence guidance can be connected with micro-dosing [5]. Alternatively, it has been argued that the up-and-coming concept of nerve imaging can benefit from approaches that rely on local administration to increase the effective local concentration [11] and to minimize the chance of systemic toxic side-effects [12].
A downside of using local administration is the impaired discrimination between the signal diffusing from the injection site and the relatively low signal accumulated in the structures of interest. In radioactivity-based sentinel node imaging procedures, the limitations caused by the background signals are designated as the “shine-through effect”. Here physical shielding of the background signal [13] or image processing of gamma camera images help eliminate the background signal [14, 15]. For emerging fluorescence-guided surgery applications similar technologies still need to be developed.
Other than for radioisotope-based imaging, fluorescence imaging allows chemical signal quenching based on distance-dependent energy transfer between fluorophores (< 8 nm distance between dye molecules). This Förster resonance energy transfer (FRET) phenomenon is used to excite one fluorophore with the emission of another [16, 17]. FRET can also be employed as a means of silencing the emission with the lowest wavelength, a concept that is widely explored in the design of activatable fluorescent tracers [18]. Specific FRET-based fluorescence deactivation was recently also explored as diagnostic read-out during receptor-(pre)targeted theranostics in vitro [19].
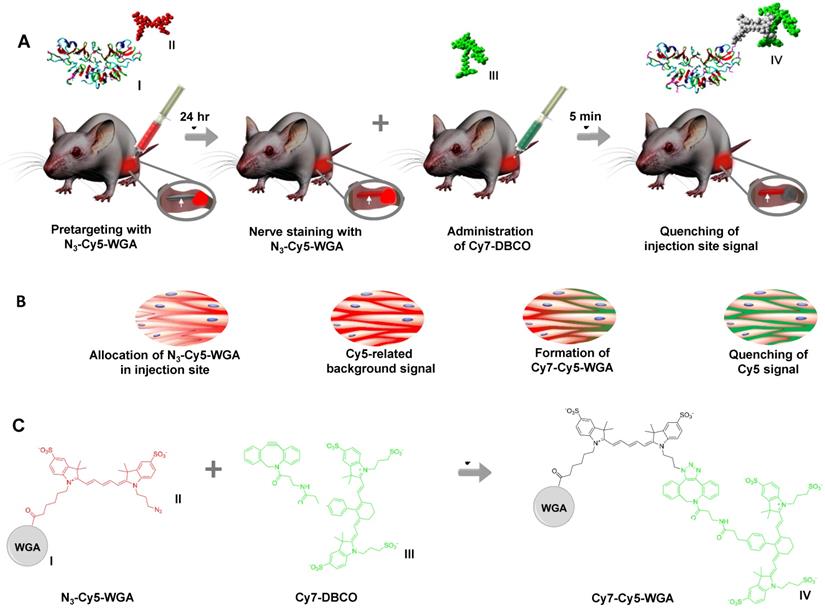
Here, we set out to determine if FRET-based fluorescence deactivation could be of value for in vivo imaging applications. Specifically, the ability to use fluorescence deactivation for background reduction during neuronal tracing of the nervus ischiadicus was studied using an azide-Cy5 functionalized analog of the known neuronal tracer wheat germ agglutinin (WGA) lectin (N3-Cy5-WGA; Scheme 1) [11]; WGA has an affinity for proteoglycans present on the extracellular matrix of peripheral nerves [20], allowing labeling without disrupting signal conduction within the nerve [11, 21]. Following neuronal pretargeting using N3-Cy5-WGA, fluorescence deactivation of the residual neuronal tracer at the injection site was realized via FRET quenching following click-chemistry-based conjugation of Cy7-DBCO (Scheme 1A/B). The quenching mechanism was first studied in situ and in vitro, followed by feasibility studies ex vivo in muscle tissue and in vivo in mice.
Schematic overview of deactivation signal injection site. A) Molecular representation of N3-Cy5-WGA with I representing WGA and II representing N3-Cy5. Pretargeting through injection of N3-Cy5-WGA (in red) in the quadriceps femoris muscle near the nervus ischiadicus and nerve staining at 24 hours after tracer administration. Insert showing the nervus ischiadicus (white arrow) and the injection site (in red) located in the hind leg. Molecular representation of Cy7-DBCO (III) and injection of Cy7-DBCO (in green) followed by subsequent Cy5-quenching at the injection site within 5 minutes after quencher administration. Insert showing the portion of the nervus ischiadicus stained by N3-Cy5-WGA (in red) and the quenching of the primary injection site (in grey) after the formation of Cy7-Cy5-WGA (IV). B) The corresponding distribution of N3-Cy5-WGA (Cy5 in red) and DBCO-Cy7/Cy7-Cy5-DBCO (Cy7 in green) over the extracellular space in the muscle tissue of the injection site during the different stages in the process as described in A. C) Reaction scheme including chemical structures of N3-Cy5-WGA, Cy7-DBCO, and Cy7-Cy5-WGA.
Materials and Methods
Synthesis N3-Cy5-OSu
N3-Cy5 was synthesized according to previously described methods [19], using an on-resin method as described by Lopalco et al [22]. Cleavage of the dye was achieved by the addition of (SO3)-indole phthalimide to resin-immobilized hemicyanine. After purification by semi-preparative HPLC (Waters 1525EF, Waters 2489, Reprosil-Pur 120 C18-AQ 250 x 10 mm), the amine group was liberated using methylamine and converted to an azide followed by HPLC-purification and lyophilization. Of the resulting blue solid, 5 mg (7.03 µmol) was dissolved in DMSO (200 µL). To this solution, Dipyrrolidino(N-succinimidyloxy)carbenium hexafluorophosphate (6 mg, 14.07 µmol) and N-methylmorpholine (3.9 µL, 35.16 µmol) were added. The mixture was stirred for 45 minutes at room temperature, after which CH3CN containing 0.1% trifluoroacetic acid (300 µL) and H2O containing 0.1% trifluoroacetic acid (1500 µL) were added followed by purification using HPLC. The fractions containing N3-Cy5-OSu were combined and lyophilized, yielding a blue powder (4.5 mg, 79% yield).
Synthesis N3-Cy5-WGA
WGA (1 mg, 27.8 µmol) was dissolved in 0.1 M phosphate buffer pH 8.4 (200 µL), where after 138.9 µmol of N3-Cy5-OSu (11.2 µL of a 10 µg/µL solution, in DMSO) was added. The mixture was stirred for 2 hours at room temperature before being purified using a 10 K Amicon centrifugal filter (Merck KGaA, Darmstadt, Germany). After repetitive washing until a colorless filtrate was observed, N3-Cy5-WGA was recovered as a blue liquid (20% yield).
Evaluation photophysical properties
The molar extinction coefficient and relative quantum Yield (ɸF) were determined according to previously described methods [19, 23]. A dilution range was made in PBS (0.01 M, pH 7.4) using a quantified amount of N3-Cy5 (either by weighing or quantitative NMR). The absorption of the dilution series was measured, and the maximum absorption values were plotted against the concentration and the molar absorption coefficient was calculated using linear regression. The quantum yields were determined by measuring absorbance and emission of 3-6 dilutions of the compound, thereby keeping the absorbance wavelength of interest below 0.100 Abs. The absorbance at one wavelength was plotted against the total emission by excitation at this same wavelength. The quantum yield was thereafter calculated using linear regression relative to that of a reference dye which was measured simultaneously. Emission spectra were extracted from the recorded epsilon and quantum yield data. The stability of N3-Cy5-WGA was determined using absorption measurements after 24 hours of incubation at 37°C [23]. In situ quenching was assessed after addition of two molar equivalents of Cy7-DBCO to 3 mL of a 1 µM solution of N3-Cy5-WGA or Cy5-NH2 (non-azide-containing control; dye synthesis described in [19]). The change in fluorescence over time was evaluated using repeated measurement of the emission spectrum (60 minutes with a 5-minute interval between measurements using excitation light of 620 nm and an excitation- and emission slit of 10), as described previously [19].
Fluorescence confocal imaging of cells
RT4 D6P2T Schwannoma cells (CRL-2768, ATCC) were cultured in Dulbecco's Modified Eagle Medium (Life Technologies, UK) containing penicillin, streptomycin and fetal calf serum (All BD Biosciences) at 37°C and 5% CO2. Two days prior to imaging, cells were seeded onto glass-bottom culture dishes (MatTek). At one hour prior to imaging, N3-Cy5-WGA (5 µL/0.58 nmol) was added to the medium and incubated at 4°C. A lysosomal (lysotracker green; 2 µL/mL, DND-26, Thermo Fisher) and nuclear stain (Hoechst 33342; 1 mg/mL, Thermo Fisher) was added as intracellular reference staining. Cell samples were washed thrice with PBS and placed on a Leica SP8 WLL confocal microscope (Leica Microsystems) for imaging. Images were acquired prior to addition of Cy7-DBCO (t=0; 800 μM in DMSO stock, 1 μl/ 0.8 nmol per sample resulting in a ratio of 10:14 Cy5:Cy7; [19]) and over the course of 30 minutes after addition of Cy7-DBCO to the medium (at room temperature) using Leica confocal software (Leica Microsystems) at sequential settings and 63x magnification (Cy5 settings for visualization of N3-Cy5-WGA: λex 633 nm, ; λem 650-700 nm; FITC settings for visualization of lysosomal staining: λex 488, λem 500-550 nm; UV settings for visualization of nuclear staining: λex 405 nm, λem 420-452 nm). Quantification of the Cy5 signal was performed using the quantification tool in Fiji software according to previously described methods [19]. For calculating normalized fluorescence intensities per time point, t=0 (prior to addition of Cy7-DCO) was set at 100%.
Ex vivo and in vivo quenching of the injection site
Muscle tissue was obtained from THY-1 YFP mice (n = 6 muscle specimens (quadriceps femoris muscle) per group). For assessment of signal quenching, muscle tissue specimens were imaged using an IVIS Spectrum preclinical imaging system (Perkin Elmer) and Living Image software (version 3.2). Prior to imaging, samples were superficially injected with N3-Cy5-WGA (5 µl, 0.58 nmol). For optimization of the volume/dose of Cy7-DBCO required for optimal quenching in tissue, samples were then either injected with 5, 10, or 20 µl (6.6-26.6 nmol resulting in ratios Cy5:Cy7 varying from 10:114 to 10:458) Cy7-DBCO. Tissue samples wherein only N3-Cy5-WGA was administered were used as a control. Tissue samples were imaged at Cy5 (λex 650 nm, λem 700 nm) and Cy7 (λex 780 nm, λem 800 nm) settings prior to addition of Cy7-DBCO (t=0) and followed over time (for 30 minutes at room temperature) after addition of the quencher.
The selection of the nervus ischiadicus was based on its accessible location and the possibility to reproducibly place tracer deposits in the quadriceps femoris muscle and subsequently assess staining of the nerve. Neuronal tracing of the nervus ischiadicus was assessed according to previously described methods [11]. In vivo assessment of signal quenching was evaluated in THY-1 YFP mice (n = 4 received both N3-Cy5-WGA and Cy7-DBCO, n = 2 served as control (only N3-Cy5-WGA, no Cy7-DBCO) at 24 hours after intramuscular injection of 20 µl (2.32 nmol) N3-Cy5-WGA allowing migration of the tracer along the nervus ischiadicus [11]. Prior to imaging mice were sacrificed and the quadriceps femoris muscle and nervus ischiadicus were exposed. Cy7-DBCO (10 µl,13.2 nmol, resulting in a 10:57 ratio for Cy5:Cy7) was injected into the injection site of N3-Cy5-WGA and images were obtained prior and at 5 minutes after injection of Cy7-DBCO using an IVIS Spectrum imaging system (Xenogen) and using a Dino-lite handheld digital fluorescence microscope (AM4115T-DFRW for Cy5 imaging; Dino-lite Digital Microscope).
Signal intensities in the individual samples were quantified (per ROI in photons/sec/cm2) using the quantification tool in the Living Image software [11]. For comparison between groups, fluorescence signals were normalized; here t=0 was set at 100%.
The area of distribution of the quencher over the injection site and the signal-to-background ratio (SBR; signal in the nerve signal/ signal injection site) were evaluated based on the IVIS images, using the ROI measuring tool in Fiji software. Distribution of the Cy7 signal over the muscle specimen was calculated as a percentage of the total area of the muscle specimen. Statistical analysis was performed using a Student's t-test and the level of significance was set at p < 0.05.
Results
Photophysical properties
The photophysical properties of the individual dyes N3-Cy5 and Cy7-DBCO, as well as the N3-Cy5-WGA and Cy7-Cy5-WGA constructs, are listed in Table 1. Accompanying fluorescence and absorption spectra are provided in Figure 1A. The emission wavelength of N3-Cy5-WGA was shown to be almost identical to that of free N3-Cy5, while the brightness of N3-Cy5-WGA was slightly decreased compared to the free dye. Interestingly, the formation of the Cy7-Cy5 construct caused the Cy5 excitation peak to undergo a hypsochromic shift of 27 nm and the Cy7 emission peak to undergo a hypsochromic shift of 24 nm. Also, the relative quantum yields of Cy5 and Cy7 decreased respectively 36-fold and 7.7-fold compared to the free dyes. Since the molar extinction coefficient of Cy7 also decreased 6-fold after conjugation, the Cy7 brightness in the Cy7-Cy5 construct dropped 50-fold.
Photophysical properties N3-Cy5 and Cy7-DBCO
| Tracer | Abs/Em in PBS (Stokes shift in nm) | Relative quantum yield (in PBS) | Molar extinction coefficient in PBS (L*Mol-1*cm-1) | Brightness |
|---|---|---|---|---|
| N3-Cy5 | 648/666 (18) | 26.0%* | 187 600 | 48 776 |
| N3-Cy5-WGA | 649/667 (19) | 18.0% | n.d. | 33 768¥ |
| Cy7-DBCO | 753/775 (22)** | 10.8% | 255 000** | 28 050 |
| Cy5 in Cy7-Cy5 construct | 620/666 (46) | 0.5% | 185 000 | 925 |
| Cy7 in Cy7-Cy5 construct | 799/775 (24) | 1.4% | 39 900 | 559 |
*previously reported by van der Wal et al. [24] **as provided by the manufacturer, ¥: Calculated using the molar extinction coefficient of the free dye, n.d.: not determined.
In situ and in vitro quenching of N3-Cy5-WGA after addition of Cy7-DBCO. A) Fluorescence absorption and emission of N3-Cy5, N3-Cy5-WGA, Cy7-DBCO, and the Cy5 and Cy7 signal in Cy7-Cy5-WGA. B) Stability of N3-Cy5-WGA and the Cy5 and Cy7 signal in Cy7-Cy5 in serum at t = 0 and t = 24 hours (dashed). Absorbance spectroscopy over the course of 60 minutes with a 5-minute interval between measurements (color coding per interval from red to purple) of the absorbance spectrum of C) N3-Cy5-WGA and D) the non-azide containing Cy5-NH2 after mixing with Cy7-DBCO (excitation light of 620 nm and an excitation- and emission slit of 10) with color scaling between t=0 (highest Cy5 intensity) and t=60 minutes. N3-Cy5-WGA emission peak detected at 630 nm, Cy7-DBCO emission peak detected at 780 nm. E) Normalized change of in situ fluorescence intensity over time after addition of Cy7-DBCO to N3-Cy5-WGA. F) Quantified decrease of in vitro N3-Cy5-WGA-related fluorescence in RT4 D6P2T cells assessed using fluorescence confocal microscopy over time after addition of Cy7-DBCO and subsequent formation of Cy7-Cy5-WGA. Herein the fluorescence intensity (%) depicts the normalized fluorescence percentage of fluorescence intensity, wherein the intensity measured at t = 0 (prior to addition of Cy7-DBCO) was set at 100%. G) Fluorescence confocal microscopy images of RT4 D6P2T cells after addition of N3-Cy5-WGA (I; t = 0 minutes, λex 633 nm) and at II) t = 1 minutes, III) t = 5 minutes and IV) t = 30 minutes after addition of Cy7-DBCO with N3-Cy5-WGA in red, lysosomes in green and the cell nucleus in blue.
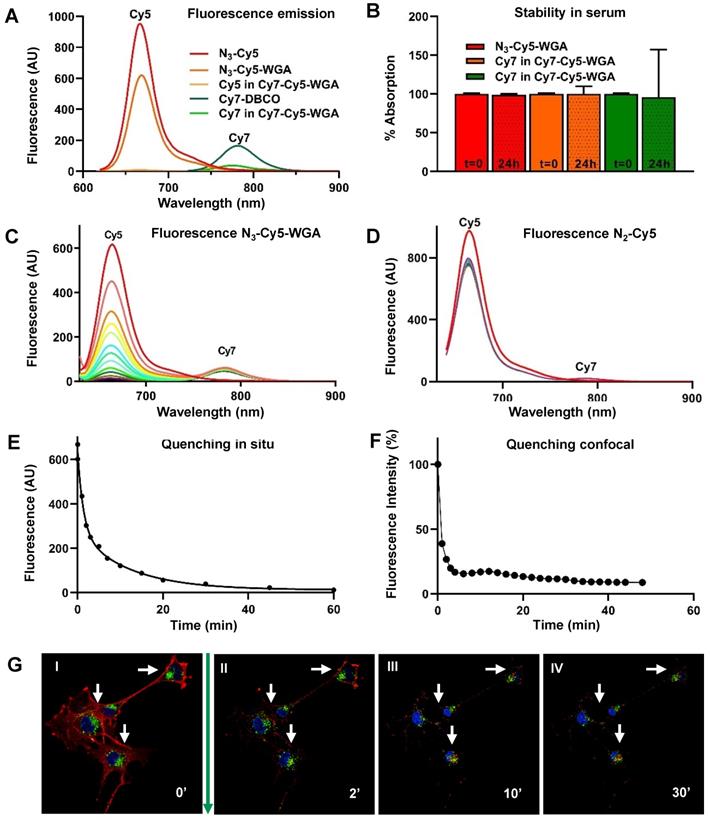
Stability measurements of N3-Cy5-WGA, Cy5, and Cy7 in the Cy7-Cy5 construct in serum revealed that the dye-protein combination remained stable in serum (100%, 99%, and 96%, respectively) over the course of 24 hours (Figure 1B).
In situ, conjugation of Cy7-DBCO to N3-Cy5-WGA yielded Cy7-Cy5-WGA (Scheme 1), with subsequent quenching of 98.1% of the overall Cy5 signal and reduced brightness for Cy7 (Figure 1C; Cy5 peak at 650 nm, Cy7 peak at 780 nm). Negligible quenching was observed between a non-azide containing Cy5 derivative (Cy5-NH2) and Cy7-DBCO (Figure 1D). Repeated measurements of the absorbance spectrum of N3-Cy5-WGA revealed a sharp decline in signal intensity within minutes after addition of Cy7-DBCO and an overall signal reduction of >90% of the signal intensity of Cy5 fluorescence over the course of 60 minutes (Figures 1A and 1E).
Hereafter, the deactivatable concept was studied in vitro using Schwannoma cell cultures (Figure 1F and 1G). In cells, N3-Cy5-WGA enabled a clear definition of the cell membrane (Figure 1G I), which could clearly be differentiated from the co-staining of lysosomes (in green) and the nucleus (in blue). After addition of Cy7-DBCO and formation of Cy7-Cy5-WGA, the staining of the cell membrane was shown to fade over time (Figure 1G II-IV), while the localization of nuclear and lysosomal control staining was not affected. When quantified, a decrease in signal intensity ranging from 61.5% (t = 0) to 91% (t = 30 minutes), after addition of Cy7-DBCO, was recorded. Subsequently, the level of signal quenching remained stable.
Quenching in muscle tissue
Local injection of N3-Cy5-WGA (20 μL, 2.32 nmol) in the triceps brachii muscle provides a model to study the deactivation concept in tissue (Figure 2). Based on the in situ and in vitro data (Figure 1), ex vivo assessment of the quenching of the injection site was performed over the course of 30 minutes. Under these conditions injection of Cy7-DBCO into muscle tissue allowed for the click reaction to occur, thus yielding a decrease in signal intensity as a result of FRET quenching (Figure 2; WGA alone in red). Increasing the volume of Cy7-DBCO (Figure 2; from 5 μL (6.6 nmol; 11 molar equivalents to Cy5; in blue) to 10 μL (13.3 nmol; 23 molar equivalents to Cy5; in green) and 20 μL (25.6 nmol; 46 molar equivalents to Cy5; in orange) increased the interstitial fluid pressure. The use of the different volumes resulted in different levels of Cy7 diffusion in the muscle tissue specimens; immediately after administration of 5 μL of Cy7-DBCO a tissue coverage of 46.2 ± 7.1% was reached, whereas after administration of 10 μL or 20 μL the Cy7 signal was shown to be distributed over respectively 73.7 ± 2.8% and 77.3 ± 14.3%, of the tissue specimen. At 20 minutes post administration of Cy7-DBCO the tissue coverage was not significantly altered (45.5 ± 8.1%, 77.7 ± 8.1% and 78.1 ± 13.2% for 5 μL, 10 μL, and 20 μL, respectively).
Quantification of deactivation signal in muscle tissue. Ai) Overlay of ex vivo Cy5-related fluorescence images (λex 650 nm) and a photograph of muscle tissue specimens after injection of 5 μL N3-Cy5-WGA alone (no Cy7-DBCO; in red) 5 μL N3-Cy5-WGA and at t = 1, t= 5 and t = 30 minutes after addition of 5 (blue), 10 (green) or 20 μL (orange) of Cy7-DBCO. ii) Quantified Cy5-related signal intensities in muscle tissue specimens per group over time (t = 0-30 minutes). Green arrow: time point of addition of Cy7-DBCO. Bi) Overlay of ex vivo Cy7-related fluorescence images (λex 780 nm) and a photograph of muscle tissue specimens without Cy7-DBCO (red) and after injection of 5 (blue), 10 (green) or 20 μL (orange) Cy7-DBCO. Green arrow: time point of addition of Cy7-DBCO. ii) Quantified Cy7-related signal intensities in the muscle tissue specimens per group over time (t = 0-30 minutes).
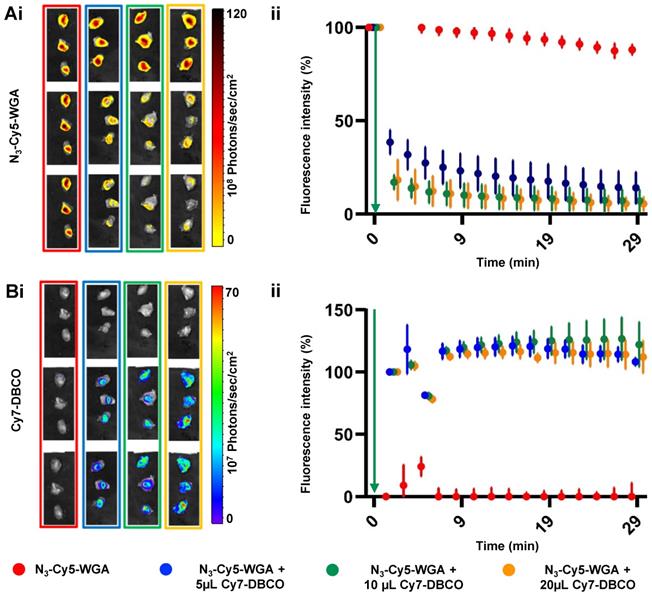
The distribution of Cy7-DBCO impacted on the quenched portion of N3-Cy5-WGA; an immediate decrease in signal intensity was seen in all samples wherein Cy7-DBCO was administered ranging from 62.5% for the 5 μL group to 82.8% and 82.7% for the 10 μL and 20 μL groups, respectively (Figure 2Ai and 2Bi). Quantification of the Cy5 signal in the tissue samples confirmed the visible quenching effects (Figure 2A and B). The signal decrease intensified until 20 minutes post administration of Cy7-DBCO (to respectively 76.8%, 89.9% and 90.1% for 5 μL, 10 μL, and 20 μL at 10 minutes and 82.4%, 91.7% and 93% for 5 μL, 10 μL, and 20 μL at 20 minutes), where after the signal remained relatively stable (86%, 92.9% and 94.5% decrease in fluorescence signal for the 5 μL, 10 μL and 20 μL groups at 30 minutes). In contrast, the fluorescence signal in the N3-Cy5-WGA group (no Cy7-DBCO) only showed a slight decrease of 12%, which could possibly be attributed to dye bleaching as a result of the repetitive imaging of the same sample. The Cy7 signal emitted by Cy7-DBCO, and subsequently by Cy7-Cy5-WGA, could be accurately visualized upon tracer administration (Figure 2Bi) and remained relatively stable over time (Figure 2Bii).
Nerve tracing and in vivo quenching of background signal
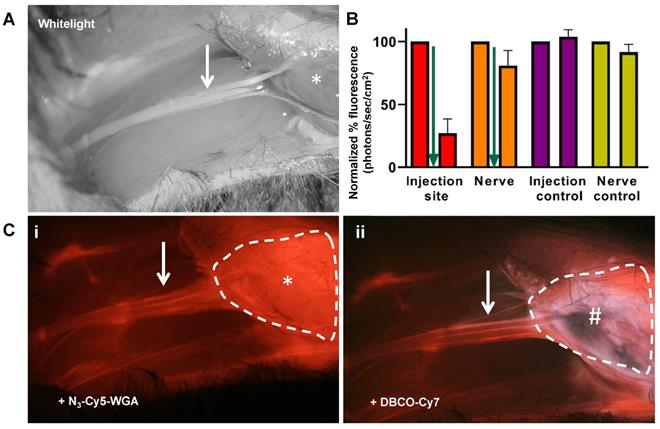
In vivo administration of N3-Cy5-WGA allowed for distinct visualization of tracer migration along the nervus ischiadicus (Figure 3) and quantitative assessment of the quenching effect at the site injection (Figure 3B). Initially, an accurate assessment of the stained portion of the nerve (Figure 3, white arrow) was hampered by an intense background signal emitted by the intramuscular deposition site of N3-Cy5-WGA (Figure 3Ci; *, encircled). Administration of Cy7-DBCO (Figure 3B, green arrow) resulted in a fast and significant 73% depletion of Cy5-related background signal within the first 5 minutes. While a slight decrease in signal was also seen in the nerve (19%), a clear distinction between the injection site and the nerve could be made (Figure 3B and 3Cii). Overall, quenching resulted in a 2-fold increase in the SBR between the nerve and the injection site (1.0 ± 0.2 vs. 2.1 ± 0.5; p= 0.03).
Quenching of the injection site in vivo. A) In vivo white-light image of the nervus ischiadicus (white arrow) and its anatomical localization (*: location of tracer deposition). B) Comparison of the quantified in vivo percentage of Cy5-related fluorescence (λex 650 nm) measured in the injection site (red) and nerve (orange) at 24 hours after injection of N3-Cy5-WGA (left bar) and 5 minutes after injection of Cy7-DBCO (right bar). Administration of Cy7-DBCO: green arrow. Animals wherein only N3-Cy5-WGA was administered served as control. C) i) fluorescence microscope image showing the injection site (* and encircled in white) and the nervus ischiadicus. ii) fluorescence microscope image after injection of Cy7-DBCO (#) at the site of injection of N3-Cy5-WGA.
Discussion
In the current manuscript, we have demonstrated that fluorescence deactivation could be successfully translated from in situ experiments to an in vivo application relying on local tracer deposition. Hereby, we have essentially introduced a fluorescence deactivation paradigm based on a pretargeting concept wherein the signal from non-specifically diffused fractions of primary targeting vector can be actively silenced using a secondary compound.
In line with prior literature [19, 25] the current work illustrates that orthogonal “click” chemistry provides a valuable chemical tool in the conjugation of (quencher) dyes to the primary fluorescent agent. In particular, the ability to swiftly conjugate Cy7-DBCO to N3-Cy5 ensures that both dyes are in close vicinity of each other (< 8 nm) and FRET transfer between the dyes is optimal as the dyes are both residing on the same molecule, hence the high degree, and rapid quenching, of the Cy5 signal of N3-Cy5 and not for Cy5-NH2 (Figures 1A and 1C). The quenching of Cy7 as well as the differences in quantum yields and molar extinction coefficient can most likely be ascribed to π-stacking [24], although cis-trans photoisomerization - an effect increased by steric hindrance- could also play a role [26, 27].
Pretargeting strategies are known to use a range of alternative forms of specific recognition of the primary targeting vector, e.g. based on monoclonal antibodies [28, 29] or host-guest chemistry [30]. In theory, these alternative means of connecting the secondary quenching agent to the fluorescent primary vector could also hold potential for fluorescence quenching applications. That said, it is likely that the increased spatial separation of the dyes in these indications will reduce quenching efficacy; FRET is distance dependent.
In a previous microscopy study, we showed that Cy7-DBCO does not have the ability to pass the cell membrane at 4 °C or 37 °C [19], and thus merely diffuses through the tissue. It is important to note that Cy7-DBCO could only realize quenching by formation of a covalent bond with N3-Cy5-WGA (Figure 1). Hence, the Cy7-DBCO diffusion, combined with the need for covalent bonds and the neuronal tracing capabilities of N3-Cy5-WGA [11], suggests that the 2-fold increase in the SBR observed following in vivo addition of Cy7-DBCO (Figure 2 and 3) is the result of Cy7-Cy5-WGA formation in the interstitial space. This efficient use of dye-based click-chemistry extends previous in vitro findings [19].
While the fluorescence deactivation concept may also prove of value during systemic applications, it is likely to hold most promise in procedures were local tracer deposition is being used. Next to experimental nerve imaging [31, 32], this could e.g. be embolization strategies [33], or sentinel lymph node procedures [6]. A limitation of implementing the fluorescence deactivation concept and the enabling chemical strategies used is the cost. For example, a routine sentinel node procedure, while clearly benefiting from techniques that reduce background staining [34], is not likely to warrant the development and approval costs of new pharmaceuticals for this indication. For more specialized indications, such as nerve imaging, this will likely be different.
Conclusion
The presented fluorescence deactivation technology allowed fast and effective reduction of the background signal at the injection site while preserving in vivo nerve visualization. While this proof-of-principle study was focused on imaging of nerves, it helps create a new fluorescence imaging paradigm.
Acknowledgements
We thank S.I. van Leeuwen for assisting with the graphics and Nikolas Duszenko for proofreading the manuscript. This research was financially supported by a Netherlands Organization for Scientific Research TTW-VICI grant (Grant No. TTW 16141), a European Research Council proof of concept grant (ERC-2017-PoC, Grant No. 790079) and the 2015-2016 Post-Doctoral Molecular Imaging Scholar Program Grant granted by the Society of Nuclear Medicine and Molecular Imaging (SNMMI) and the Education and Research Foundation for Nuclear Medicine and Molecular Imaging.
Competing Interests
The authors have declared that no competing interest exists.
References
1. van Leeuwen FW, Hardwick JC, van Erkel AR. Luminescence-based Imaging Approaches in the Field of Interventional Molecular Imaging. Radiology. 2015;276:12-29
2. Chi C, Du Y, Ye J, Kou D, Qiu J, Wang J. et al. Intraoperative imaging-guided cancer surgery: from current fluorescence molecular imaging methods to future multi-modality imaging technology. Theranostics. 2014;4:1072-84
3. van Leeuwen FWB, Schottelius M, Brouwer OR, Vidal-Sicart S, Achilefu S, Klode J. et al. Trending: Radioactive and Fluorescent Bimodal/Hybrid Tracers as Multiplexing Solutions for Surgical Guidance. J Nucl Med. 2020;61:13-9
4. Nagaya T, Nakamura YA, Choyke PL, Kobayashi H. Fluorescence-Guided Surgery. Front Oncol. 2017;7:314
5. KleinJan GH, Bunschoten A, van den Berg NS, Olmos RA, Klop WM, Horenblas S. et al. Fluorescence guided surgery and tracer-dose, fact or fiction? Eur J Nucl Med Mol Imaging. 2016;43:1857-67
6. KleinJan GH, van Werkhoven E, van den Berg NS, Karakullukcu MB, Zijlmans H, van der Hage JA. et al. The best of both worlds: a hybrid approach for optimal pre- and intraoperative identification of sentinel lymph nodes. Eur J Nucl Med Mol Imaging. 2018;45:1915-25
7. Nishio N, van den Berg NS, van Keulen S, Martin BA, Fakurnejad S, Zhou Q. et al. Optimal Dosing Strategy for Fluorescence-Guided Surgery with Panitumumab-IRDye800CW in Head and Neck Cancer. Mol Imaging Biol. 2020;22:156-64
8. Tummers QR, Hoogstins CE, Gaarenstroom KN, de Kroon CD, van Poelgeest MI, Vuyk J. et al. Intraoperative imaging of folate receptor alpha positive ovarian and breast cancer using the tumor specific agent EC17. Oncotarget. 2016;7:32144-55
9. van Leeuwen FW, Valdes-Olmos R, Buckle T, Vidal-Sicart S. Hybrid surgical guidance based on the integration of radionuclear and optical technologies. Br J Radiol. 2016;89:20150797
10. Alford R, Simpson HM, Duberman J, Hill GC, Ogawa M, Regino C. et al. Toxicity of organic fluorophores used in molecular imaging: literature review. Mol Imaging. 2009;8:341-54
11. KleinJan GH, Buckle T, van Willigen DM, van Oosterom MN, Spa SJ, Kloosterboer HE. et al. Fluorescent lectins for local in vivo visualization of peripheral nerves. Molecules (Basel, Switzerland). 2014;19:9876-92
12. Barth CW, Gibbs SL. Direct Administration of Nerve-Specific Contrast to Improve Nerve Sparing Radical Prostatectomy. Theranostics. 2017;7:573-93
13. Radioguided Surgery - Current Applications and Innovation Directions in Clinical Practice. In: Hermann K. NO, and Povosiki SP, editor. 2016
14. Stoffels I, Poeppel T, Boy C, Mueller S, Wichmann F, Dissemond J. et al. Radio-guided surgery: advantages of a new portable gamma-camera (Sentinella) for intraoperative real time imaging and detection of sentinel lymph nodes in cutaneous malignancies. J Eur Acad Dermatol Venereol. 2012;26:308-13
15. Brouwer OR, van den Berg NS, Matheron HM, van der Poel HG, van Rhijn BW, Bex A. et al. A hybrid radioactive and fluorescent tracer for sentinel node biopsy in penile carcinoma as a potential replacement for blue dye. Eur Urol. 2014;65:600-9
16. Clegg RM. Fluorescence resonance energy transfer. Curr Opin Biotechnol. 1995;6:103-10
17. Lerner E, Cordes T, Ingargiola A, Alhadid Y, Chung S, Michalet X. et al. Toward dynamic structural biology: Two decades of single-molecule Forster resonance energy transfer. Science. 2018;359:eaan1133
18. Ogawa M, Kosaka N, Longmire MR, Urano Y, Choyke PL, Kobayashi H. Fluorophore-quencher based activatable targeted optical probes for detecting in vivo cancer metastases. Mol Pharm. 2009;6:386-95
19. van der Wal S, de Korne CM, Sand LGL, van Willigen DM, Hogendoorn PCW, Szuhai K. et al. Bioorthogonally Applicable Fluorescence Deactivation Strategy for Receptor Kinetics Study and Theranostic Pretargeting Approaches. Chembiochem. 2018;19:1758-65
20. Mislovičová D, Gemeiner P, Kozarova A, Kožár T. Lectinomics I. Relevance of exogenous plant lectins in biomedical diagnostics. Biologia. 2009;64:1
21. Schellingerhout D, Le Roux LG, Bredow S, Gelovani JG. Fluorescence imaging of fast retrograde axonal transport in living animals. Mol Imaging. 2009;8:319-29
22. Lopalco M, Koini EN, Cho JK, Bradley M. Catch and release microwave mediated synthesis of cyanine dyes. Org Biomol Chem. 2009;7:856-9
23. Hensbergen AW, Buckle T, van Willigen DM, Schottelius M, Welling MM, van der Wijk FA. et al. Hybrid Tracers Based on Cyanine Backbones Targeting Prostate-Specific Membrane Antigen: Tuning Pharmacokinetic Properties and Exploring Dye-Protein Interaction. J Nucl Med. 2020;61:234-41
24. van der Wal S KJ, Valentijn ARPM, van Leeuwen FWB. Synthesis and systematic evaluation of symmetrtric sulfonated centrally Ce C bonded cyanine near-infrared dyes for protein labeling. Dyes and Pigments. 2016;132:7-19
25. Knorr G, Kozma E, Schaart JM, Nemeth K, Torok G, Kele P. Bioorthogonally Applicable Fluorogenic Cyanine-Tetrazines for No-Wash Super-Resolution Imaging. Bioconjug Chem. 2018;29:1312-8
26. Stennett EM, Ciuba MA, Levitus M. Photophysical processes in single molecule organic fluorescent probes. Chem Soc Rev. 2014;43:1057-75
27. Levitus M, Ranjit S. Cyanine dyes in biophysical research: the photophysics of polymethine fluorescent dyes in biomolecular environments. Q Rev Biophys. 2011;44:123-51
28. Bailly C, Bodet-Milin C, Rousseau C, Faivre-Chauvet A, Kraeber-Bodéré F, Barbet J. Pretargeting for imaging and therapy in oncological nuclear medicine. EJNMMI Radiopharm Chem. 2017;2:6
29. Goldenberg DM, Chang CH, Rossi EA, J W, McBride, Sharkey RM. Pretargeted molecular imaging and radioimmunotherapy. Theranostics. 2012;2:523-40
30. Rood MT, Spa SJ, Welling MM, Ten Hove JB, van Willigen DM, Buckle T. et al. Obtaining control of cell surface functionalizations via Pre-targeting and Supramolecular host guest interactions. Sci Rep. 2017;7:39908
31. Hingorani DV, Whitney MA, Friedman B, Kwon JK, Crisp JL, Xiong Q. et al. Nerve-targeted probes for fluorescence-guided intraoperative imaging. Theranostics. 2018;8:4226-37
32. Park MH, Hyun H, Ashitate Y, Wada H, Park G, Lee JH. et al. Prototype nerve-specific near-infrared fluorophores. Theranostics. 2014;4:823-33
33. Spa SJ, Welling MM, van Oosterom MN, Rietbergen DDD, Burgmans MC, Verboom W. et al. A Supramolecular Approach for Liver Radioembolization. Theranostics. 2018;8:2377-86
34. Govaert GA, Oostenbroek RJ, Plaisier PW. Prolonged skin staining after intradermal use of patent blue in sentinel lymph node biopsy for breast cancer. Eur J Surg Oncol. 2005;31:373-5
Author contact
![]() Corresponding author: T. Buckle, Interventional Molecular Imaging Laboratory, Department of Radiology; Leiden University Medical Center, Albinusdreef 2 (C2-S zone); PO BOX 9600, 2300 RC Leiden, The Netherlands. E-mail: t.bucklenl.
Corresponding author: T. Buckle, Interventional Molecular Imaging Laboratory, Department of Radiology; Leiden University Medical Center, Albinusdreef 2 (C2-S zone); PO BOX 9600, 2300 RC Leiden, The Netherlands. E-mail: t.bucklenl.