Impact Factor
- Issue 14; 2026
- Issue 13; 2026
- Issue 12; 2026
- Issue 11; 2026
- Issue 10; 2026
- Volume 16; 2026
- Advance Articles
- Past Issues
- Cover Images
- Cover Suggestion
- Index & Coverage
- Special Issues
Introduction
Results and Discussion
Conclusion
Materials and methods
Abbreviations
Supplementary Material
Acknowledgements
References
International Journal of Biological Sciences
International Journal of Medical Sciences
 Global reach, higher impact

Theranostics 2020; 10(15):6886-6897. doi:10.7150/thno.46794 This issue Cite
Research Paper
Gadofullerene nanoparticles for robust treatment of aplastic anemia induced by chemotherapy drugs
Wang Jia1,2, Mingming Zhen1,2 ![]() , Lei Li1,2, Chen Zhou1,2, Zihao Sun1,2, Shuai Liu1,2, Zhongpu Zhao1,2, Jie Li1,2, Chunru Wang1,2
, Lei Li1,2, Chen Zhou1,2, Zihao Sun1,2, Shuai Liu1,2, Zhongpu Zhao1,2, Jie Li1,2, Chunru Wang1,2 ![]() , Chunli Bai1,2
, Chunli Bai1,2 ![]()
1. Beijing National Laboratory for Molecular Sciences, Key Laboratory of Molecular Nanostructure and Nanotechnology, CAS Research/Education Center for Excellence in Molecular Sciences, Institute of Chemistry, Chinese Academy of Sciences, Beijing 100190, China.
2. University of Chinese Academy of Sciences, Beijing 100049, China.
Received 2020-4-8; Accepted 2020-4-29; Published 2020-5-23
Abstract

Aplastic anemia (AA) is characterized as hypoplasia of bone marrow hematopoietic cells and hematopenia of peripheral blood cells. Though the supplement of exogenous erythropoietin (EPO) has been clinically approved for AA treatment, the side-effects hinder its further application. Here a robust treatment for AA induced by chemotherapy drugs is explored using gadofullerene nanoparticles (GFNPs).
Methods: The gadofullerene were modified with hydrogen peroxide under alkaline conditions to become the water-soluble nanoparticles (GFNPs). The physicochemical properties, in vitro chemical construction, stability, hydroxyl radical scavenging ability, in vitro cytotoxicity, antioxidant activity, in vivo treatment efficacy, therapeutic mechanism and biological distribution, metabolism, toxicity of GFNPs were examined.
Results: GFNPs with great stability and high-efficiency antioxidant activity could observably increase the number of red blood cells (RBC) in the peripheral blood of AA mice and relieve the abnormal pathological state of bone marrow. The erythropoiesis mainly includes hemopoietic stem cells (HSCs) differentiation, erythrocyte development in bone marrow and erythrocyte maturation in peripheral blood. The positive control-EPO promotes erythropoiesis by regulating HSCs differentiation and erythrocyte development in bone marrow. Different from the anti-AA mechanism of EPO, GFNPs have little impact on both the differentiation of HSCs and the myeloid erythrocyte development, but notably improve the erythrocyte maturation. Besides, GFNPs can notably decrease the excessive reactive oxygen species (ROS) and inhibit apoptosis of hemocytes in blood. In addition, GFNPs are mostly excreted from the living body and cause no serious toxicity.
Conclusion: Our work provides an insight into the advanced nanoparticles to powerfully treat AA through ameliorating the erythrocyte maturation during erythropoiesis.
Keywords: gadofullerene nanoparticles, aplastic anemia, reactive oxygen species, erythropoiesis, erythrocyte maturation
Introduction
Aplastic anemia (AA), as one kind of acquired myeloid hematological system diseases, is characterized by the dysfunction of the hypocellular marrow and pancytopenia [1-3]. Meanwhile, the hemoglobin (HGB) lowering than 110 g/L in peripheral blood usually acts as an intuitive criterion of AA. The decreasing level of HGB is closely connected with the descending counts of red blood cells (RBC), which is commonly induced by the damaged function of erythropoiesis. Erythropoiesis is a complex process, including the differentiation of hematopoietic stem cells (HSCs), the development of erythrocyte and the maturation of erythrocyte [4,5], and the first two stages occur in bone marrow. The multifunctional HSCs as a sole source of hemocytes could be self-renewal and differentiate into various blood cells. They develop from nucleated red blood cells (NRBC) into reticulocytes (Retic) in bone marrow, which is called the erythrocyte development [6,7]. The Retic further matures in peripheral blood, enucleated into mature RBC.
Although the pathogenesis of AA is poorly understood, it closely related to chemical drugs, radiation, viral infection, genetic factors and so forth [8-10]. Chemotherapy is the most common cause of AA [1,2,8]. It causes direct injury towards HSCs and the hematopoietic microenvironment by chemotherapy drugs, resulting in AA. Currently, exogenous supplement with erythropoietin (EPO, produced by kidney) could stimulate erythropoiesis in bone marrow [5,11,12]. But this potentially causes tissue hypoxia, venous thrombosis, liver, and heart failure by EPO treatment. Additionally, uses of hematopoietic stem cell transplantation (HSCT) and immunosuppressive therapy (IST) for AA treatment also have numerous side-effects, e.g. low efficiency, relapses, unfavorable prognosis, high cost and others [9,10,13,14]. Thus, there is still lack of an effective and low toxicity therapeutic strategy for AA.
To date, nanomaterials mediated anti-oxidative therapy is emerging as a novel strategy in disease treatment through scavenging excessive reactive oxygen species (ROS) [15-19]. Among them, fullerenes and gadofullerene possess excellent capacities for scavenging ROS, and have exhibited superior effects on the treatments of many diseases associated with ROS, e.g. tumor, neurodegenerative disease, hepatic injury, pulmonary fibrosis, and so forth [20-25]. In addition, our previous studies showed that gadofullerene nanoparticles (GFNPs) could be specially accumulated into mice bone marrow by intravenous injection, promoting the content of white blood cells (WBC) and protecting against myeloid oxidative injury during chemotherapy in mice [22].
In this work, we further demonstrated that GFNPs have a potent anti-AA effect in mice by boosting the level of RBC and HGB. Mechanically we investigated the effects of GFNPs on the three stages of erythropoiesis. Our results revealed that GFNPs could not significantly regulate the differentiation of HSCs and the myeloid erythrocyte development, but notably promote the erythrocyte maturation, lower the level of excessive ROS and inhibit apoptosis of blood cells in peripheral blood of AA mice. Furthermore, the GFNPs were mostly metabolized out of the body without causing obvious damage. This work provides a promising strategy to develop advanced nanomedicine for robust AA treatment.
Results and Discussion
Synthesis and Characterizations of GFNPs
In this study, we adopted a simple solid-liquid reaction to modify gadofullerene to become water-soluble according to our previous works [26,27]. Briefly, gadofullerenes reacted with 30% hydrogen peroxide under alkaline conditions at 50 oC for about 30 min (Figure 1A). The hydroxyl bonding on the carbon cage made Gd@C82 molecules have a good dispersion in aqueous solution. Atomic force microscope (AFM) was to investigate the morphology of GFNPs, and Figure S1 showed that GFNPs had a diameter of ca. 50-80 nm and height of ca. 6-12 nm. Meanwhile, dynamic light scattering (DLS) was for the characterization of hydrodynamic parameters. Results in Figure 1B showed that the hydrodynamic size of GFNPs was 137.0±0.4 nm, owing to the strong interaction between hydrogen bonding of GFNPs and water molecules of hydroxyl groups. Besides, the hydrodynamic size distribution (Figure 1C) and the small polydispersity index (PDI, 0.15±0.01, Figure 1B) of the GFNPs indicated that GFNPs have a uniform size distribution. The previous studies have showed that the stability of nanoparticle is mainly influenced by its surface charge, and the Zeta potential of which between -30 mV~30 mV tends to form aggregates in aqueous solution [28]. In present study, we demonstrated that the Zeta potential of GFNPs is -42.17±0.62 mV (Figure 1B), the absolute value of which is greater than 30 mV, thus we suggested that GFNPs nanoparticle was relatively stable. Additionally, we have verified the high stability of GFNPs in PBS, 0.9% NaCl, FBS and dulbecco's modified eagle medium (DMEM) by observation the optical photographs on day 0 and day 30 after the synthesis, and there was no noticeable precipitate after 30 days (Figure 1D).
Preparation and Characterization of GFNPs. (A) Schematic diagrams of the synthesis of GFNPs. (B) The average size, polydispersity index (PDI) and Zeta potential of GFNPs in water. (C) Hydrodynamic size distribution of GFNPs by DLS. (D) Optical photographs of GFNPs in PBS (1x), 0.9 % NaCl, FBS and DMEM-H, on day 0 (up) and day 30 (down) after synthesized. (E) The FT-IR spectrum of GFNPs. (F) The ESR spectra of •OH captured by DMPO after treated with the ultrapure water (black line) or 30 µM GFNPs (red line). (G) The FDC-P1 cell viability after treatment with GFNPs (0, 1, 2, 4, 10, 20, 40, 100 µM). (H) The intracellular ROS levels of FDC-P1 cells treated with different concentrations of GFNPs (0, 20, 40, 100 µM) after treatment with H2O2 (400 µM) in dark for 1 h. (n≥3; *p < 0.05, vs Control group; # p < 0.05, vs only H2O2-treatment group).
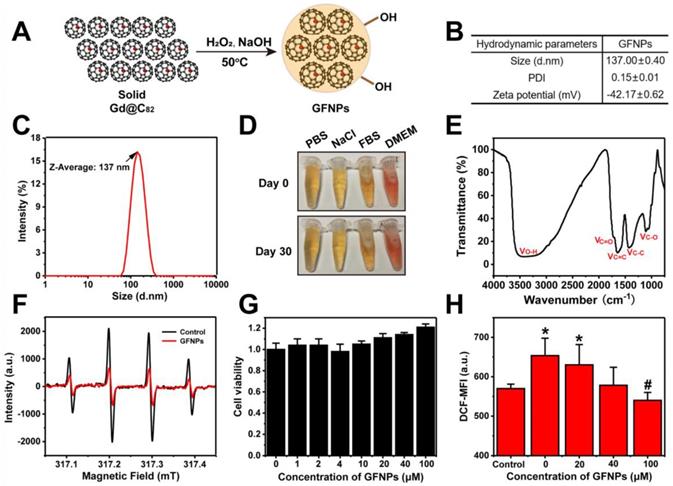
Fourier transform infrared spectrum (FT-IR) provided the information of the chemical structure of GFNPs (Figure 1E), and three main peaks situated at 1350-1400, 1600, and 3400 cm-1 refers to the stretching bands of C-C or C-O and vibrational bands of C=C, O-H, respectively. Meanwhile, the weak C=O peak located at 1750-1700 cm-1 was possibly corresponding to the pinacol rearrangement and subsequent keto-enol isomerization. X-ray photoelectron spectroscopy (XPS) was for the average composition of GFNPs, and the data (Figure S2) showed that the C1s peaks of GFNPs included 1 C-C (or C=C), 2 C-O, and 3 C=O, which were 45%, 32%, and 23%, respectively. Together, the average composition of GFNPs was calculated as Gd@C82(O)~19(OH)~26.
Considering hydroxyl radical (•OH) is one of the most common types of ROS connected with AA [29-31], we adopted the electron spin-resonance (ESR) spectrum to test the hydroxyl radical-scavenging capacity of GFNPs. H2O2 (20 μL,100 mM) was for generating •OH after UV-irradiation for 4 min, and the spin trap 5-dimethyl-1-pyrroline-N-oxide (DMPO, 40 μL,100 mM) acted as a trapping agent for •OH. DMPO-OH adduct performed as a typical four-line ESR signal (1:2:2:1 quartet) in Figure 1F. Data showed that only 30 μM GFNPs could scavenge almost 65% hydroxyl radicals, which illustrated that GFNPs have a superior anti-oxidative capability.
Further, we incubated FDC-P1 cells (normal mice bone marrow cells) with GFNPs to testify the cytotoxicity and antioxidant capacity of GFNPs. Firstly, we found that the cell viability of FDC-P1 cells was undiminished but a little increased after incubated with GFNPs within 100 μM for 24 h (Figure 1G), indicating that GFNPs have no obvious cytotoxicity within at least 100 μM. Subsequently, we employed the method of flow cytometry (FCM) to investigate the antioxidant capacity of GFNPs in the cellular level. H2O2 was used for generating ROS in FDC-P1 cells and DCFH-DA (a ROS sensitive probe) was to evaluate the intensity of ROS. After incubated with GFNPs (20, 40, 100 μM) for 3 h, there was an obvious reduction of the ROS level which was produced by H2O2. Thus, we drew a conclusion that GFNPs evidently lowered the excessive ROS levels of FDC-P1 cells induced by H2O2 (Figure 1H).
Besides, we conducted the biosafety studies in vivo, which is a vital factor for future use in clinical. Figure S3 showed that the body weights and some of major hematological indices (such as RBC, HGB, and hematocrit (HCT)) of mice had no noticeable changes in the GFNPs treated groups compared with the controls. Moreover, the main organs including heart, liver, spleen, lung and kidney had no obvious pathological change on day 15 after treated with GFNPs for six times. Together, all these data indicated that GFNPs had superior capability of not merely the high efficiency anti-oxidation, but also the preeminent biocompatibility.
The effects of GFNPs on AA induced by chemotherapy drugs in mice
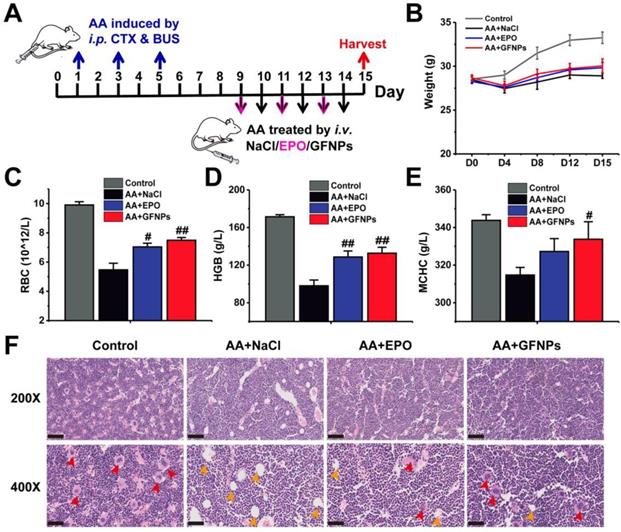
To evaluate the anti-AA effects of GFNPs, we established an AA mice model by three times of intraperitoneal (i.p.) administration with CTX & BUS (Figure 2A). The HGB in AA mice was observably decreased below 110 g/L by hematological examination, indicating we successfully obtained the AA mice models. Then the AA mice were further intravenously (i.v.) treated with saline, EPO (6×10⁴ IU/kg/d, 3 days) and GFNPs (60 mM/kg/d, 6 days), respectively (n = 6). The weights of AA mice were sharply decreased, and conversely, the AA mice treated with GFNPs and EPO showed quite increases in body weight after one-week observations (Figure 2B). To quantitatively evaluate the anti-AA effects of GFNPs, we took systematic hematological examinations at the end of the experiment. As shown in Figure 2C-E, there were significant decreases of the RBC, HGB and mean corpuscular hemoglobin concentration (MCHC) in AA mice. Interestingly, the levels of RBC, HGB and MCHC were prominently increased by GFNPs treatment. It is worth mentioning that the GFNPs could improve the level of HGB by 35.7% after 5 days treatment. Our results demonstrated that the GFNPs could improve the levels of RBC, HGB and MCHC more than those by EPO at the dosage used. In addition, the bone marrow pathology was used to precisely evaluate the anti-AA effects of GFNPs. The hematoxylin eosin (HE) staining exhibited that the extensive adipose (yellow arrow) was found in bone marrow of AA mice, compared with the abundant hematopoietic cells (red arrow) appearing in bone marrow of the control mice (Figure 2F). Surprisingly, the typically pathological changes in AA were obviously ameliorated by GFNPs, and there was a great increase of hematopoietic cells as well as a decrease of adipose. Thus, we suggest GFNPs have a superior effect on anti-AA.
The anti-AA effects of GFNPs in vivo. (A) Schematic diagram depicted the experimental protocol of anti-AA. (B) The body weights during 15 days observation. (C-E) The levels of red blood cells (RBC), hemoglobin (HGB) and mean corpuscular hemoglobin concentration (MCHC) at the end of treatment. (F) Light microscopy of H&E sections of mice bone marrow at 200X and 400X magnification. The red arrow indicated hematopoietic cells of red pulp, and the yellow arrow indicated adipose in yellow pulp. Scale bar = 100 µm (Up; 200X) and 50 µm (Bottom; 400X). (n=5; # p < 0.05, ## p < 0.01, vs AA+NaCl group).
The effects of GFNPs on the differentiation and development of erythrocyte in bone marrow of AA mice
Encouraged by the above results, we moved on to investigate the anti-AA mechanism by studying the effects of GFNPs on the whole process of erythropoiesis: hemopoietic stem cells (HSCs) differentiation, erythrocyte development and maturation [4,32,33]. The first two stages occur in the bone marrow, and the process of erythrocyte maturation primarily takes place in the peripheral blood (Figure 3A). The HSCs differentiation is the initial stage of hematopoiesis and hematopoietic cells development. The population of immature hematopoietic cells during hemopoietic differentiation could be measured using FCM labeled by the lineage-negative (Lin-) specific maker [34,35]. Our results demonstrated that the population of Lin- cells in AA mice was markedly decreased compared with the normal mice (Figure 3B and C). As one of the physiological functions of EPO was to promote the differentiation of erythroid stem cells into erythroblast [36], we found that the population of Lin- cells in the EPO treated AA mice was notably decreased. Though the significant improvement on RBCs by GFNPs treatment, they had little influence on the HSCs differentiation. Then, the HSCs give rise to erythroid progenitors and further into erythroid precursors (also called the nucleated red cells, NRBC) and reticulocyte (Retic), called erythrocyte development. CD71, as known as a transferrin receptor, is highly expressed in NRBC and absent in mature erythrocytes [37]. TER119 is an erythroid-specific marker expressed at all stages of differentiation from early proerythroblasts to mature erythrocytes [38]. The forward scattered (FSC) is commonly used to reflect relative cell size in the FCM measurement, and the size of Retic was smaller than that of NRBC. Thus, we could use CD71 and Ter119 two makers combining with FSC to quantitatively identify the proportion of NRBC (CD71+Ter119+FSC+) and Retic (CD71+Ter119+FSC-) by FCM. Our data revealed that due to the side-effects of chemotherapy drugs on erythropoietic stages, the total content of immature erythrocytes (CD71+Ter119+) include NRBC and Retic were sharply declined in AA mice (Figure 3D and E), and the respective counts of NRBC and Retic in 2×10⁴ live cells were also decreased (Figure 3F and G). After EPO treatment, the counts of CD71+Ter119+ cells, NRBC and Retic were all boosted owing to the stimulating hematopoietic functions of EPO. Contrastively, GFNPs had little impact on the counts of CD71+Ter119+ cells, NRBC and Retic in bone marrow of AA mice.
The effects of GFNPs on the erythrocyte differentiation and development in bone marrow of AA mice. (A) The schematic representation of the erythropoietic stages in bone marrow and peripheral blood. (B) The immature hematopoietic cells in bone marrow were specifically labeled by Lin- marker. (C) The relative proportion of the Lin- cells in total live cells. (D) The FCM analysis of Ter119+CD71+ cells (blue border), NRBC (Ter119+CD71+FSC+) and Retic (Ter119+CD71+FSC-) in bone marrow. (E-G) The counts of Ter119+CD71+ cells, NRBC, and Retic in 2x10⁴ live cells. (H-I) The protein expression of HIF-2α in bone marrow. (n = 5; # p < 0.05, ## p < 0.01, vs AA+NaCl group).
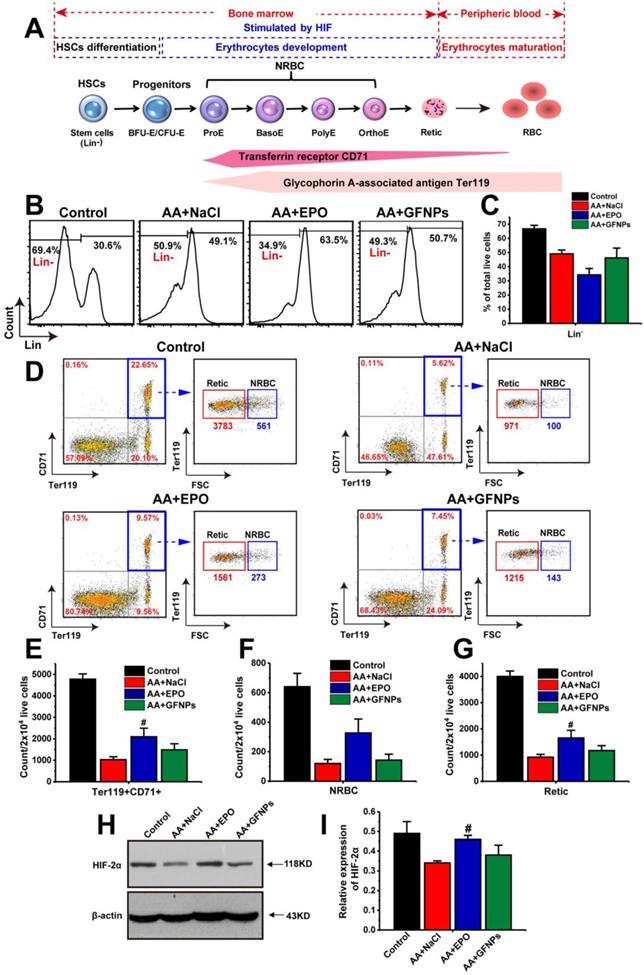
Additionally, the erythrocyte development was primarily adjusted by hypoxia-inducible factor-2α (HIF-2α). HIF-2α plays a vital role in hematopoiesis, and it regulates murine hematopoietic development in an erythropoietin-development manner. Our results revealed that the protein expression of HIF-2α was declined sharply in AA mice compared with the control (Figure 3H and I). It was increased in EPO-treated mice, but we found that GFNPs also did little to regulate the relative expression of HIF-2α, which further confirmed the above conclusion. Together, we considered that GFNPs could hardly contribute to the differentiation and development of erythrocyte in AA mice induced by chemotherapy, while EPO performed well on these processes. Thus, we didn't conduct further studies on the effect of GFNPs on these processes in bone marrow and inferred that the mechanism of GFNPs on AA could be different from that of EPO. We continued to study the other hematopoietic process-erythrocyte maturation in peripheral blood.
The effect of GFNPs on the erythrocyte maturation in peripheral blood of AA mice
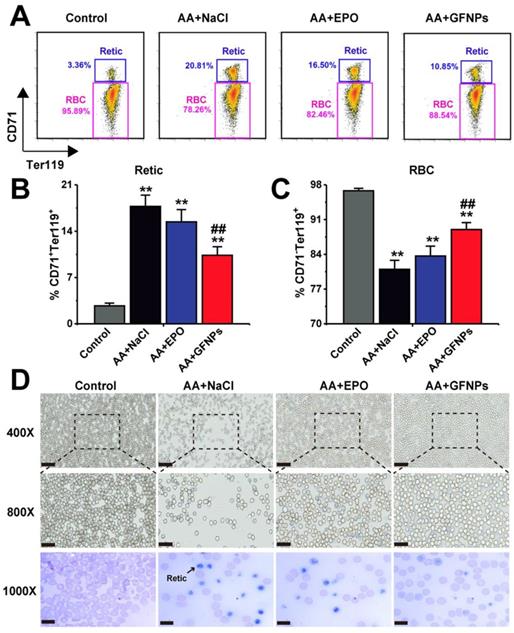
The Retic are released from bone marrow into the peripheral blood developing into mature RBC, called as erythrocyte maturation. In normal mice, there was no more than 5% retic in blood. However, due to the dysfunction of erythrocyte development and maturation induced by chemotherapy drugs, the relative proportion of Retic (CD71+Ter119+) in blood of AA mice was significantly higher than that in the normal mice (20.81% vs 3.36%, Figure 4A and B). Excitedly, we found that GFNPs could greatly promote the erythrocyte maturation of peripheral blood in AA mice (Figure 4C), leading to more RBC (CD71-Ter119+) in blood. We also found that the improvement on erythrocyte maturation by EPO treatment was notably lower than that by GFNPs. The blood smear method was further performed to observe Retic in blood by new methylene blue (NMB) and eosin staining (Figure 4D). As Retic contain abundant basophilic RNA before mature, which could be dyed reticular blue by NMB [39,40]. After denucleation and mature, RBC are only dyed by eosin instead of by NMB. It was clearly to reveal that the Retic were markedly reduced and the RBC was observably increased in blood by GFNPs treatment. But there were lots of Retic in AA mice treated both by normal saline and EPO, which was well consisted with the above results. All these data suggested that GFNPs highly promoted the erythrocyte maturation in the peripheral blood, superior to the effect of EPO. Driven by curiosity, we continued to conduct further studies in the peripheral blood.
GFNPs promoted the erythrocyte maturation of AA mice in blood. (A) The FCM analysis of Retic (CD71+Ter119+) and RBC (CD71-Ter119+) in blood. The relative proportion of (B) Retic and (C) mature RBC in all groups. (D) The reticulocyte staining in blood. The Retic were dyed reticular blue. Scale bar = 50 µm (top), 25 µm (middle) and 10 µm (bottom) (n=5; * p < 0.05, ** p < 0.01, vs Control group; # p < 0.05, ## p < 0.01, vs AA + NaCl group).
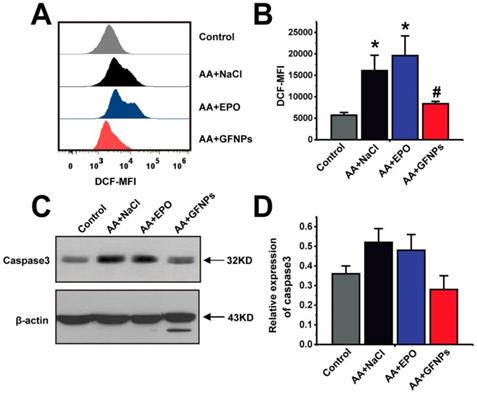
Given that AA induced by chemotherapy drugs is closely associated with ROS and GFNPs have the excellent performance on scavenging the excess free radicals in the body, we continued to study the effect of GFNPs on the ROS level in the peripheral blood of AA mice. Once the steady state of peripheral blood was disturbed by chemotherapy drugs in AA mice, it generated excessive ROS of blood cells measured by FCM (Figure 5A and B). We found that the ROS levels of blood cells were notably reversed by GFNPs treatment. However, the EPO barely affected the level of ROS in blood. The excessive ROS in AA mice further induced the apoptosis of blood cells resulting in the high protein expression of Caspase 3 measured by western blotting (WB) (Figure 5C and D). And Caspase 3 is an effector of apoptosis and the final executor of apoptosis [41-43]. Interestingly, GFNPs could remarkably decrease the protein expression of Caspase 3. The EPO also had little effects on Caspase 3. Mechanically, these results suggested that GFNPs decreased the excessive ROS and apoptosis of blood cells in AA mice.
GFNPs decreased the ROS levels and inhibited apoptosis of blood cells in peripheral blood of AA mice. (A) The FCM analysis of the ROS levels in total blood cells of mice in Control, AA + NaCl, AA + EPO, and AA + GFNPs group respectively. (B) The total ROS levels in blood. (C-D) WB analysis of the Caspase 3 expression in whole blood. (n=5; * p < 0.05, vs Control group; # p < 0.05, vs AA + NaCl group).
The biodistribution study and toxicity evaluation of GFNPs in vivo
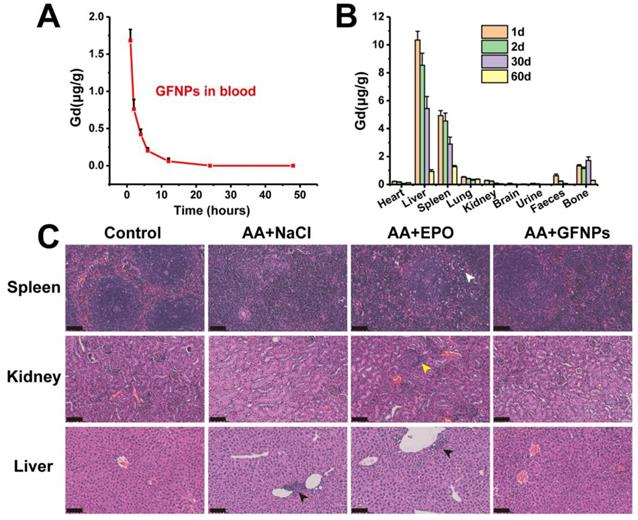
The biodistribution study of GFNPs was performed by the inductively coupled plasma mass spectrometry (ICP-MS). It has showed that the concentration of Gd3+ declined gradually in blood after 24 h treatment of GFNPs, and the half-life of GFNPs in blood was ~2.95 h (Figure 6A). In addition, the GFNPs were accumulated into liver, spleen, and bone, which were mostly eliminated from the living body 60 days after administration (Figure 6B). Meanwhile, to evaluate the safety of GFNPs on anti-AA therapy, we carried on to investigate the histopathological examinations of main tissues and organs at the end of anti-AA treatment (the 15th day). The H&E pathologic results showed that there was no obvious toxicity of GFNPs towards the main organs (spleen, kidney, and liver) after anti-AA therapy (Figure 6C). However, there existed some abnormities in EPO-treated AA mice, which performed as inflammation & necrosis of spleen (white arrow), abnormal glomeruli of kidney (yellow arrow) and nuclear accumulation of hepatic cell (black arrow). Notably, to further evaluate the hepatic and nephrotic toxicity of GFNPs after anti-AA therapy, we conducted the blood analysis including alanine aminotransferase (ALT), aspartate aminotransferase (AST), alkaline phosphatase (ALP), uric acid (UA), and blood urea nitrogen (BUN) on day 15. As for the hepatic function, the level of ALT, AST, and ALP in AA group (Table S1) were abnormal compared with those in Control group, especially the level of AST, which decreased significantly in AA group. Meanwhile, the levels of UA and BUN for nephrotic function evaluation in AA group were decreased obviously compared with those in Control group. These suggested it induced certain toxicity towards the liver and kidney after the administration of chemotherapy drugs. Inversely, the relevant indices for hepatic and nephrotic function in AA+GFNPs group had prominently improved compared with those in AA group, which almost reversed back to the normal. Together, these results demonstrated GFNPs could be cleared from main organs as time advanced and decreased the toxicity during AA treatment.
(A) The blood concentrations of GFNPs in vivo. (B) The distribution and metabolism of GFNPs in vivo. (C) The pathologic analysis of spleen, kidney, and liver of mice, Scale bar = 100 µm (n = 5).
Conclusion
In summary, GFNPs were found to serve as a versatile nanoparticle with excellent performance of anti-oxidation and anti-AA therapeutic effect in mice. When GFNPs were intravenously injected into AA mice for six consecutive days, the counts of RBC in blood were significantly increased and the pathological state of bone marrow was notably ameliorated. Remarkably, though GFNPs had little impact on the differentiation of hematopoietic cells or the development of erythrocytes, it was amazing that GFNPs could promote the erythrocyte maturation in blood obviously. Further, GFNPs could strikingly decrease the ROS level and inhibit apoptosis of blood cells in peripheral blood of AA mice. Besides, GFNPs could be excreted from the mice, causing no serious toxicity. This work provided a new inspiration for the treatment of anemia as well as other blood diseases and further alleviating the side-effects of chemotherapy using the functionalized nanoparticles.
Materials and methods
Materials
Gd@C82 (99% purity) was purchased from Xiamen Funano Co. Ltd. (Xiamen, China). Dulbecco's minimal essential medium (DMEM), 2',7'-Dichlorodihydrofluorescein diacetate (DCFH-DA), and PBS were purchased from BioDee Biotechnology Co. Ltd. (Beijing, China). NaOH, HNO3, and H2O2 were purchased from Beijing Chemical Works (Beijing, China). 5, 5-dimethyl-1-pyrroline-N-oxide (DMPO), Busulfan (BUS) and Cyclophosphamide (CTX) were obtained from Sigma-Aldrich (MO., USA). Chemicals used were all analytical reagents and solvents without further purification.
Preparation of gadofullerenes nanoparticles (GFNPs)
The water-soluble GFNPs were prepared as our previous studies [26,27]. Simply, the suspension of 50 mg Gd@C82 in 30% of aqueous H2O2 (7 mL) and 12% NaOH (3 mL) were vigorously stirred under 50 oC until the black suspension was dissolved gradually into a brownish-red solution. The solution was precipitated by ethanol and centrifuged at 9000 r/min for 5 min, and then the supernatant was discarded repeated for three times. Before used, the samples were further purified by dialysis (M.W.= 3500 Da) against ultrapure water (Millipore, Billerica, USA) to get rid of the unreacted materials.
Characterization of GFNPs
Inductively coupled plasma-mass spectrometry (ICP-MS, Thermo, iCAP-Q, USA) was conducted to determine the concentration of GFNPs. Fourier transform infrared spectrum (FT-IR, Nicolet iN10 MX, Thermo, USA) and X-ray photoelectron spectroscopy (XPS, ESCALab220i-XL, VG, U.K.) were taken to characterize the chemical structure and average composition of GFNPs after freeze-drying. Besides, the morphology characterizations of GFNPs were conducted by atomic force microscope (AFM, Bruke, Multimode 8, Germany). The particle size and Zeta potential of GFNPs in water were characterized by dynamic light scattering (DLS, Malvern, Nano-ZS90, UK).
Electron spin-resonance (ESR, JES-FA200, JEOL, Japan) was conducted to examine the hydroxyl radical scavenging capacity of GFNPs in vitro. Simply, 40 μL H2O2 (100 mM) and 20 μL DMPO (100 mM) were mixed with 20 μL GFNPs (30 μM) or ultrapure water, respectively. DMPO acted as a trapping agent and H2O2 was used to produce hydroxyl radical. The mixture was irradiated by a lamp (UV, 500 W, 4 min), and then the data were collected in dark.
A mouse bone marrow cell (FDC-P1 cell) was obtained from National Infrastructure of Cell Line Resource (Shanghai, China). The cells were incubated with DMEM-H (Invitrogen, California, USA) which was added the 10% fetal bovine serum (FBS, Hyclone Co., South Logan, UT), 2×10⁻³ μM IL-3 (Gibco, NY, USA) and 1% penicillin & streptomycin.
The cytotoxicity assessment of GFNPs was conducted as the conventional method. Briefly, 100 μL 1×10⁵ mL-1 FDC-P1 cells were incubated in a 96-well transparent plate for 24 h, then added 100 μL GFNPs (0, 1, 2, 4, 10, 20, 40, 100 μM) for another 24 h. Afterwards, the cell viability of FDC-P1 cells were examined according to a Cell Counting Kit-8 (CCK-8, DOJINDO, Kumamoto, Japan).
The antioxidant capacity of GFNPs was tested as follows. 1 mL 1×10⁵ FDC-P1 cells were seeded in a 6-well transparent plate for 24 h, then added 1 mL pure culture medium or culture medium with H2O2 (400 μM) for 1 h. Subsequently, the medium was renewal with new medium with different concentrations of GFNPs (0, 20, 40, 100 μM) for 3 h. Afterwards, FDC-P1 cells were cultured with 500 μL 2',7'-Dichlorodihydrofluorescein diacetate (DCFH-DA, 10 μM, Beyotime, China) at 37 °C in dark for 30 min, and then washed three times. Mean fluorescence intensity (MFI) of DCF was measured to quantize the level of intracellular reactive oxygen species by a flow cytometer (Invitrogen, AttuneTM NxT, USA). The detection channel of flow cytometer is BL1, and the excitation & emission wavelength are 488 nm and 530/30 nm, respectively.
Animal Experiments
Female ICR mice (24-26 g) were maintained from Sibeifu Beijing Biotechnology Co. Ltd. (Beijing, China). All the animal experiments were carried out in accordance with the National Regulation of China for Care and Use of Laboratory Animals, and approved by the Animal Ethics Committee of Institute of Processes, Chinese Academy of Sciences. Before the experiments, mice were acclimatized to laboratory conditions for 1 week. And after the states of mice were stable, the experiments were started as the day 0. All the animals were provided free access to food and water.
Toxicity study in vivo
Mice in two groups were treated as follows (n=5): 1) GFNPs group was injected GFNPs solution (150 μL, 60 mM/kg/day) by intravenous injection (i.v.) for six continuous days on day 9-14; 2) NaCl group was injected 0.9% NaCl (150 μL) by i.v. on day 9-14. The hematological toxicity studies on day 0, 8, 12, 15 were carried out. Subsequently, on day 15, the heart, liver, spleen, lung and kidney were obtained from the mice. Afterwards, the hematoxylin and eosin staining for histological studies were conducted.
The aplastic anemia (AA) therapy in vivo
20 female ICR mice were divided into four groups randomly (n = 5, each group). 1) Control group was i.v. 0.9% NaCl (150 μL) on day 9-14; 2) AA + NaCl group was administered BUS (20 mg/kg) and CTX (80 mg/kg) by intraperitoneal injection (i.p.) on day 1, 3, 5, 7, then i.v. 0.9% NaCl (150 μL) on day 9-14; 3) AA + EPO group was i.p. BUS and CTX on day 1, 3, 5, 7, then i.v. EPO (150 μL, 6×10⁴ IU/kg/day) on day 9, 11, 13; 4) AA + GFNPs was i.p. BUS and CTX on day 1, 3, 5, 7, then i.v. GFNPs (150 μL, 60 mM/kg/day) on day 9-14. The other operations were consistent with the Control group. On day 15, the mice were sacrificed by cervical dislocation to obtain blood and tissues for further studies.
Hematological analysis
20 μL peripheral blood samples (the 15th day) were collected into anticoagulant tubes. Four important indicators including red blood cell (RBC), hemoglobin (HGB), and mean corpuscular hemoglobin concentration (MCHC) were examined using automated hematology analyzer (Mindray, BC-5000vet, China).
About 1 mL peripheral blood samples (the 15th day) were collected and centrifuged to obtain the serum for biochemical analysis. The serum levels of relevant indicators including alanine aminotransferase (ALT), aspartate aminotransferase (AST), alkaline phosphatase (ALP), uric acid (UA), and blood urea nitrogen (BUN) were detected to evaluate the hepatic and nephrotic toxicity of GFNPs using the automatic biochemical analyzer (Toshiba, TBA-2000FR, Japan).
Histopathological Examination
The tissues (femur, heart, spleen, kidneys, liver, and lung) were harvested at the end of the animal experiments, and fixed in 4% formalin solution. Then the tissues were respectively dehydrated, embedded in paraffin, cut into 5-μm-thick slices and stained with hematoxylin and eosin (H&E). Subsequently, the slices were scanned using a scanning microtome (KF-PRO-005, KFBIO, China). The histopathological tests were performed according to a standard laboratory procedure. Each sample was for conventional processing and analysis.
Flow cytometry
Bone marrow cells and peripheral blood cells were collected and re-suspended in PBS (1×) on day 15. For hematopoietic cells phenotypic analysis, 1×10⁶ bone marrow cells were incubated with hematopoietic lineage antibody (eBioscience, #88-7772-72) at 4 °C for 1 h in the dark. For the analysis of erythrocyte development and changes of ROS in related process, the BM cells were stained with Ter 119-PE (1:400, BioLegend, AB_313709) and CD71-Percp cy5.5 (1:400, BioLegend, AB_2565482) for 30 minutes in the dark, then incubated with 10 μM DCFH-DA for 30 min at 37 °C, subsequently, washed and re-suspended in PBS. With regard to erythrocyte maturation process in blood and changes of ROS in related process, 3 μL PB cells were diluted with 50 μL PBS (1×), then stained with Ter 119-PE (1:400) and CD71-Percp cy5.5 (1:400) for 30 minutes in the dark, incubated with DCFH-DA (10 μM) for 30 min at 37 °C, and washed, re-suspended in PBS (1×). Finally, cells were measured in the flow cytometer. The results were analyzed by using FlowJo 7.6 software. The detection channel of flow cytometer is BL1-BL4, and the excitation wavelength is 488 nm.
Western Blotting
Western blotting (WB) was performed to quantify the protein expression of hypoxia-inducible factor-2α (HIF-2α, Abcam, AB199) in bone marrow, and Caspase 3 (GeneTex, GTX110543) in blood. β-actin (ZS, TA-09) was performed as an internal reference protein. Briefly, blood cells and bone marrow cells were collected and lysed in radio immunoprecipitation assay (RIPA) buffer (Beyotime, China), and then Bicinchoninic Acid (BCA) protein assay (Thermo, USA) was used to determine protein concentration. 40 μg protein extracts were separated via polyacrylamide gel electrophoresis (PAGE) electrophoresis, and then transferred onto polyvinylidene fluoride (PVDF) membranes (0.45 μm, Millipore, USA). The membranes were blocked with 5% non-fat milk for 1 h under agitation, and then incubated with the primary antibody overnight. Subsequently, after washing 3 times with Tris Buffered Saline Tween (TBST), the membranes were incubated with the secondary antibody for 40 minutes at room temperature. Finally, enhanced chemiluminescence (ECL) detection reagents (Millipore, USA) were used to develop the protein, and Gel Image system ver.4.00 (Tanon, China) was carried out for quantifying the gray level, and β-actin bands were used for normalization.
Reticulocyte staining
To study the effect of GFNPs on the mature/immature erythrocytes in peripheral blood intuitively, blood cells were stained with reticulocyte staining solution (Baso Co. Ltd., ZUH, China). And then pictures were taken using a scanner (KF-PRO-005, KFBIO, China).
Biodistribution study in vivo
The blood samples were collected at 1 h, 2 h, 4 h, 6 h, 12 h, 24 h, 48 h, and the mice were sacrificed on day 1, 2, 30, 60 after i.v. GFNPs (150 μL, 60 mM/kg). Then, the collected tissues (heart, liver, spleen, lung, kidney, brain, urine, faeces, and bone) and blood were weighed, digested by 1 mL HNO3 for at least 12 h till the tissues were dissolved. Subsequently, the samples were diluted with H2O 20~50 times, filtered with 220 nm membrane and detected by ICP-MS for the Gd3+ concentration.
Statistical Analysis
Quantitative data reported were mean ± s.e.m, unless otherwise noted. Student's t-test was performed to assess statistical significance of the results and p < 0.05 was considered statistically significant.
Abbreviations
AA: aplastic anemia; HGB: hemoglobin; RBC: red blood cells; HSCs: hematopoietic stem cells; NRBC: nucleated red blood cells; Retic: reticulocytes; EPO: erythropoietin; HSCT: hematopoietic stem cell transplantation; IST: immunosuppressive therapy; ROS: reactive oxygen species; GFNPs: gadofullerene nanoparticles; WBC: white blood cells; AFM: atomic force microscope; DLS: dynamic light scattering; PDI: polydispersity index; FT-IR: fourier transform infrared spectrum; XPS: x-ray photoelectron spectroscopy; •OH: hydroxyl radical; ESR: electron spin-resonance; DMPO: 5-dimethyl-1-pyrroline-N-oxide; FCM: flow cytometry; HCT: hematocrit; i.p.: intraperitoneal; MCHC: mean corpuscular hemoglobin concentration; ALT: alanine aminotransferase; AST: aspartate aminotransferase; ALP: alkaline phosphatase; UA: uric acid; BUN: blood urea nitrogen; HE: hematoxylin eosin; Lin-: lineage-negative; FSC: forward scattered; HIF-2α: hypoxia-inducible factor-2α; NMB: new methylene blue; WB: western blotting; ICP-MS: inductively coupled plasma mass spectrometry; DMEM: dulbecco's minimal essential medium; DCFH-DA: 2',7'-Dichlorodihydrofluorescein diacetate; BUS: busulfan; CTX: cyclophosphamide; MFI: mean fluorescence intensity; RIPA: radio immunoprecipitation assay; BCA: bicinchoninic acid; PAGE: polyacrylamide gel electrophoresis; PVDF: polyvinylidene fluoride; TBST: tris buffered saline tween; ECL: enhanced chemiluminescence.
Supplementary Material
Supplementary figures and tables.
Acknowledgements
This work is supported by the National Major Scientific Instruments and Equipments Development Project (ZDYZ2015-2) and the Key Research Program of the Chinese Academy of Sciences (QYZDJ-SSW-SLH025).
Competing Interests
The authors have declared that no competing interest exists.
References
1. Chatterjee R, Law S. Epigenetic and microenvironmental alterations in bone marrow associated with ROS in experimental aplastic anemia. Eur J Cell Biol. 2018;97:32-43
2. Chen YF, Zhao ZQ, Wu ZM, Zou ZY, Luo XJ, Li J. et al. The role of RIP1 and RIP3 in the development of aplastic anemia induced by cyclophosphamide and busulphan in mice. Int J Clin Exp Pathol. 2014;7:8411-20
3. Lin F, Karwan M, Saleh B, Hodge DL, Chan T, Boelte KC. et al. IFN-γ causes aplastic anemia by altering hematopoietic stem/progenitor cell composition and disrupting lineage differentiation. Blood. 2014;124:3699-708
4. Sankaran VG, Weiss MJ. Anemia: progress in molecular mechanisms and therapies. Nat Med. 2015;21:221-30
5. Grover A, Mancini E, Moore S, Mead AJ, Atkinson D, Rasmussen KD. et al. Erythropoietin guides multipotent hematopoietic progenitor cells toward an erythroid fate. J Exp Med. 2014;211:181-88
6. Wang C, Wu X, Shen F, Li Y, Zhang Y, Yu D. Shlnc-EC6 regulates murine erythroid enucleation by Rac1-PIP5K pathway. Dev Growth & Differ. 2015;57:466-73
7. Yu D, C O, Zhao G, Jiang J, Amigo JD, Khandros E. MiR-451 protects against erythroid oxidant stress by repressing 14-3-3ζ. Genes & Dev. 2010;24:1620-33
8. Chatterjee R, Chattopadhyay S, Law S. Deregulation of vital mitotic kinase-phosphatase signaling in hematopoietic stem/progenitor compartment leads to cellular catastrophe in experimental aplastic anemia. Mol Cell Biochem. 2016;422:121-34
9. Young NS, Calado RT, Scheinberg P. Current concepts in the pathophysiology and treatment of aplastic anemia. Blood. 2006;108:2509-19
10. Li JP, Zheng CL, Han ZC. Abnormal immunity and stem/progenitor cells in acquired aplastic anemia. Crit Rev Oncol Hemat. 2010;75:79-93
11. Scortegagna M, Ding K, Zhang Q, Oktay Y, Bennett MJ, Bennett M. et al. HIF-2α regulates murine hematopoietic development in an erythropoietin-dependent manner. Blood. 2005;105:3133-40
12. Watowich SS. The Erythropoietin Receptor. J Invest Med. 2011;59:1067-72
13. Scheinberg P, Young NS. How I treat acquired aplastic anemia. Blood. 2012;120:1185-96
14. Young NS, Bacigalupo A, Marsh JCW. Aplastic Anemia: Pathophysiology and Treatment. Biol Blood Marrow Tr. 2010;16:S119-25
15. Fan W, Yung B, Huang P, Chen X. Nanotechnology for Multimodal Synergistic Cancer Therapy. Chem Rev. 2017;117:13566-638
16. Li M, Xia J, Tian R, Wang J, Fan J, Du J. et al. Near-Infrared Light-Initiated Molecular Superoxide Radical Generator: Rejuvenating Photodynamic Therapy against Hypoxic Tumors. J Am Chem Soc. 2018;140:14851-59
17. Pagliari F, Mandoli C, Forte G, Magnani E, Pagliari S, Nardone G. et al. Cerium Oxide Nanoparticles Protect Cardiac Progenitor Cells from Oxidative Stress. ACS Nano. 2012;6:3767-75
18. Yang Q, Peng J, Xiao Y, Li W, Tan L, Xu X. et al. Porous Au@Pt Nanoparticles: Therapeutic Platform for Tumor Chemo-Photothermal Co-Therapy and Alleviating Doxorubicin-Induced Oxidative Damage. ACS Appl Mater & Inter. 2018;10:150-64
19. Yu H, Jin F, Liu D, Shu G, Wang X, Qi J. et al. ROS-responsive nano-drug delivery system combining mitochondria-targeting ceria nanoparticles with atorvastatin for acute kidney injury. Theranostics. 2020;10:2342-2357
20. Chen Z, Ma L, Liu Y, Chen C. Applications of Functionalized Fullerenes in Tumor Theranostics. Theranostics. 2012;2:238-250
21. Lao F, Chen L, Li W, Ge C, Qu Y, Sun Q. et al. Fullerene Nanoparticles Selectively Enter Oxidation-Damaged Cerebral Microvessel Endothelial Cells and Inhibit JNK-Related Apoptosis. ACS Nano. 2009;3:3358-68
22. Zhang Y, Shu C, Zhen M, Li J, Yu T, Jia W. et al. A novel bone marrow targeted gadofullerene agent protect against oxidative injury in chemotherapy. Sci China Mater. 2017;60:866-80
23. Zhou Y, Deng R, Zhen M, Li J, Guan M, Jia W. et al. Amino acid functionalized gadofullerene nanoparticles with superior antitumor activity via destruction of tumor vasculature in vivo. Biomaterials. 2017;133:107-18
24. Liu Z, Liang XJ. Nano-Carbons as Theranostics. Theranostics. 2012;2:235-237
25. Zhou Y, Li J, Ma H, Zhen M, Guo J, Wang L. et al. Biocompatible [60]/[70] Fullerenols: Potent Defense against Oxidative Injury Induced by Reduplicative Chemotherapy. ACS Appl Mater & Inter. 2017;9:35539-47
26. Zhen M, Shu C, Li J, Zhang G, Wang T, Luo Y. et al. A highly efficient and tumor vascular-targeting therapeutic technique with size-expansible gadofullerene nanocrystals. Sci China Mater. 2015;58:799-810
27. Zhou Y, Zhen M, Ma H, Li J, Shu C, Wang C. Inhalable gadofullerenol/[70] fullerenol as high-efficiency ROS scavengers for pulmonary fibrosis therapy. Nanomed Nanotechnol. 2018;14:1361-69
28. Xu R, Wu C, Xu H. Particle size and zeta potential of carbon black in liquid media. Carbon. 2007;45:2806-09
29. Liang R, Ghaffari S. Advances in understanding the mechanisms of erythropoiesis in homeostasis and disease. Br J Haematol. 2016;174:661-73
30. Pilo F, Angelucci E. A storm in the niche: Iron, oxidative stress and haemopoiesis. Blood Rev. 2018;32:29-35
31. Schieber M, Chandel NS. ROS Function in Redox Signaling and Oxidative Stress. Curr Biol. 2014;24:R453-62
32. Joharapurkar AA, Pandya VB, Patel VJ, Desai RC, Jain MR. Prolyl Hydroxylase Inhibitors: A Breakthrough in the Therapy of Anemia Associated with Chronic Diseases. J Med Chem. 2018;61:6964-82
33. Liao C, Carlson BA, Paulson RF, Prabhu KS. The intricate role of selenium and selenoproteins in erythropoiesis. Free Radical Bio Med. 2018;127:165-71
34. Shao L, Luo Y, Zhou D. Hematopoietic Stem Cell Injury Induced by Ionizing Radiation. Antioxid & Redox Sign. 2013;20:1447-62
35. Wang X, Chu Q, Jiang X, Yu Y, Wang L, Cui Y. et al. Sarcodon imbricatus polysaccharides improve mouse hematopoietic function after cyclophosphamide-induced damage via G-CSF mediated JAK2/STAT3 pathway. Cell Death & Dis. 2018;9:578-92
36. Eggold JT, Rankin EB. Erythropoiesis, EPO, macrophages and bone. Bone. 2019;119:36-41
37. Zhang Q, Steensma DP, Yang J, Dong T, Wu MX. Uncoupling of CD71 shedding with mitochondrial clearance in reticulocytes in a subset of myelodysplastic syndromes. Leukemia. 2019;33:217-29
38. Kina T, Ikuta K, Takayama E, Wada K, Majumdar AS, Weissman IL. et al. The monoclonal antibody TER-119 recognizes a molecule associated with glycophorin A and specifically marks the late stages of murine erythroid lineage. Br J Haematol. 2000;109:280-87
39. Cho JS, Russell B, Kosasaivee V, Zhang R, Colin Y, Bertrand O. et al. Unambiguous determination of Plasmodium vivax reticulocyte invasion by flow cytometry. Inter J Parasitology. 2016;46:31-39
40. Sandoval H, Thiagarajan P, Dasgupta S, Schumacher A, Prchal J, Chen M. et al. Essential role for Nix in autophagic maturation of erythroid cells. Nature. 2008;454:232-35
41. Ozoren N, El-Deiry WS. Cell surface Death Receptor signaling in normal and cancer cells. Semin Cancer Biol. 2003;13:135-47
42. Han J, Wang Y, Cai E, Zhang L, Zhao Y, Sun N. et al. Study of the Effects and Mechanisms of Ginsenoside Compound K on Myelosuppression. J Agric Food Chem. 2019;67:1402-08
43. Yin N, Liu Q, Liu J, He B, Cui L, Li Z. et al. Silver Nanoparticle Exposure Attenuates the Viability of Rat Cerebellum Granule Cells through Apoptosis Coupled to Oxidative Stress. Small. 2013;9:1831-41
Author contact
![]() Corresponding authors: E-mails: zhenmmac.cn; crwangac.cn; clbaicn.
Corresponding authors: E-mails: zhenmmac.cn; crwangac.cn; clbaicn.