Impact Factor
- Issue 14; 2026
- Issue 13; 2026
- Issue 12; 2026
- Issue 11; 2026
- Issue 10; 2026
- Volume 16; 2026
- Advance Articles
- Past Issues
- Cover Images
- Cover Suggestion
- Index & Coverage
- Special Issues
Introduction
Results
Discussion
Materials and Methods
Abbreviations
Supplementary Material
Acknowledgements
References
International Journal of Biological Sciences
International Journal of Medical Sciences
 Global reach, higher impact

Theranostics 2020; 10(14):6483-6499. doi:10.7150/thno.44025 This issue Cite
Research Paper
STIM1 is a metabolic checkpoint regulating the invasion and metastasis of hepatocellular carcinoma
Huakan Zhao1,2,*, Guifang Yan2,*, Lu Zheng3,*, Yu Zhou1,2, Halei Sheng1, Lei Wu1,2, Qi Zhang1,2, Juan Lei1,2, Jiangang Zhang1,2, Rong Xin1, Lu Jiang1, Xiao Zhang1,2, Yu Chen1,2, Jingchun Wang1, Yanquan Xu1, Dingshan Li1, Yongsheng Li1,2 ![]()
1. Clinical Medicine Research Center, Xinqiao Hospital, Army Medical University, Chongqing 400037, China.
2. Institute of Cancer, Xinqiao Hospital, Army Medical University, Chongqing 400037, China.
3. Department of Hepatobiliary Surgery, Xinqiao Hospital, Army Medical University, Chongqing 400037, China.
*These authors contributed equally to this work.
Received 2020-1-16; Accepted 2020-4-21; Published 2020-5-16
Abstract

Background: Cancer cells undergoing invasion and metastasis possess a phenotype with attenuated glycolysis, but enhanced fatty acid oxidation (FAO). Calcium (Ca2+)-mediated signaling pathways are implicated in tumor metastasis and metabolism regulation. Stromal-interaction molecule 1 (STIM1) triggered store-operated Ca2+ entry (SOCE) is the major route of Ca2+ influx for non-excitable cells including hepatocellular carcinoma (HCC) cells. However, whether and how STIM1 regulates the invasion and metastasis of HCC via metabolic reprogramming is unclear.
Methods: The expressions of STIM1 and Snail1 in the HCC tissues and cells were measured by immunohistochemistry, Western-blotting and quantitative PCR. STIM1 knockout-HCC cells were generated by CRISPR-Cas9, and gene-overexpression was mediated via lentivirus transfection. Besides, the invasive and metastatic activities of HCC cells were assessed by transwell assay, anoikis rate in vitro and lung metastasis in vivo. Seahorse energy analysis and micro-array were used to evaluate the glucose and lipid metabolism.
Results: STIM1 was down-regulated in metastatic HCC cells rather than in proliferating HCC cells, and low STIM1 levels were associated with poor outcome of HCC patients. During tumor growth, STIM1 stabilized Snail1 protein by activating the CaMKII/AKT/GSK-3β pathway. Subsequently, the upregulated Snail1 suppressed STIM1/SOCE during metastasis. STIM1 restoration significantly diminished anoikis-resistance and metastasis induced by Snail1. Mechanistically, the downregulated STIM1 shifted the anabolic/catabolic balance, i.e., from aerobic glycolysis towards AMPK-activated fatty acid oxidation (FAO), which contributed to Snail1-driven metastasis and anoikis-resistance.
Conclusions: Our data provide the molecular basis that STIM1 orchestrates invasion and metastasis via reprogramming HCC metabolism.
Keywords: invasion and metastasis, metabolic reprogramming, Snail1, SOCE, STIM1
Introduction
Hepatocellular carcinoma (HCC) is one of the most common malignancies and the third leading cause of cancer-related mortalities owing to its high metastatic rate [1]. The epithelial-mesenchymal transition (EMT) is pivotal for the invasion and metastasis of cancer cells [2]. Cancer cells acquire energy and material basis for rapid tumor growth by enhanced anabolism, while the EMT tumor cells depend on catabolic pathways to survive from metabolic stress during metastasis [3-5]. However, the metabolic reprogramming during the invasion and metastasis of HCC cells is still unknown. Exploring the underlying mechanism is critical for developing efficient strategies for preventing HCC metastasis.
Calcium (Ca2+)-mediated signaling pathways are implicated in tumorigenesis and metastasis, and Ca2+ is finely regulated within cellular compartments to sense signaling pathways to precisely respond to various stimuli [6]. Stromal interaction molecule 1 (STIM1), as an endoplasmic reticulum (ER) Ca2+ sensor, triggers store-operated Ca2+ entry (SOCE), which is the major route of Ca2+ influx for non-excitable cells including HCC cells [7, 8]. We previously reported that STIM1 is upregulated during tumor growth and correlates with elevated hypoxia-inducible factor-1 alpha (HIF-1α) in hypoxic HCC. HIF-1 promotes STIM1 mRNA synthesis and induces SOCE, which in return stabilizes HIF-1α by activating Ca2+/calmodulin-dependent protein kinase II (CaMKII) [9]. Recently, emerging evidence indicates that STIM1-mediated SOCE is closely related to metabolic regulation. For example, STIM1 regulates the cell-cycle and proliferation of activated T cells by upregulating glycolysis and oxidative phosphorylation (OXPHOS) [10]. SOCE promotes lipolysis via cyclic adenosine monophosphate (cAMP)-dependent upregulation of peroxisome proliferator activated receptor (PPAR) alpha in skeletal myofibers [11]. Cardiomyocytes lacking STIM1 exhibits dysregulated cardiac glucose and lipid metabolism [12]. Although STIM1-mediated SOCE is essential for the migration of various cell types, including tumor cells [13-15], the role of STIM1 in dynamic HCC progression, especially in metastatic HCC cells, remains unclear.
In this study, we aimed to explore the role of STIM1 in the metabolic reprogramming of metastatic and proliferative HCC cells. Our results may highlight a potential therapeutic target for the pathogenesis and metastatic progression of HCC.
Results
STIM1 is downregulated in metastatic HCC cells
We previously reported that STIM1 is positively correlated with HIF-1α during hypoxic HCC growth [9]. Since STIM1 promotes cell migration in lung cancer, breast cancer, and melanoma by regulating focal adhesion turnover [14-17], we speculated that it might also be upregulated in metastatic HCC. However, we found that STIM1 was notably downregulated in the tumor invading-edge (the region between tumor and para-tumor), compared with the corresponding tumor region of the HCC tissue (Figure 1A). Next, we evaluated the STIM1 levels in the tumor invading-edge with/without the portal vein tumor thrombus (PVTT), an essential indicator highly associated with the progression and metastasis of HCC [18, 19]. Compared with PVTT negative group, the samples from HCC patients with PVTT showed lower expression of STIM1 in the tumor invading-edge (Figure 1B).
STIM1 is reduced in tumor invading-edge and metastatic HCC cells. (A) Representative micrographs of STIM1 immunohistochemical analysis (400×) and statistical analysis of integrated optical density (IOD) of STIM1 against immunoglobulin G (IgG) in the invading edge and tumor of 12 HCC patients. (B) IOD of STIM1 against IgG in the tumor invading-edge of portal vein tumor thrombus (PVTT)-positive (n = 4) and PVTT-negative (n = 8) HCC samples. (C) Snail1 and STIM1 mRNA, (D) E-cadherin, Snail1 and STIM1 protein expressions were detected in SMMC7721, HepG2, Hep3B and BEL-7404 treated with TGF-β1 for 48 h. The results were analyzed and normalized against expression with 20 ng/mL bovine serum albumin (BSA) treated cells. (E) Diagram that the isolation different metastatic sublines from SMMC7721 cells after 4 rounds of selection, LM: low metastatic, HM: high metastatic. (F) Metastatic characteristic of LM- and HM-SMMC7721 sublines in vivo, lungs were observed for metastatic nodules on the surface, representative photographs and H&E staining were shown (n = 4 mice per group), arrows point to metastatic nodules. (G, H) The mRNA (G) and protein (H) expressions of STIM1, Snail1 and E-cadherin in LM- and HM-SMMC7721 sublines. (I) Kaplan-Meier analysis of correlation between the STIM1 expression and overall survival of HCC patients from TGCA (n = 360). Data of (A-D, G and H) are expressed as mean ± SEM (n = 3). *p < 0.05, **p <0.01, ***p < 0.001, NS represents no significant difference.
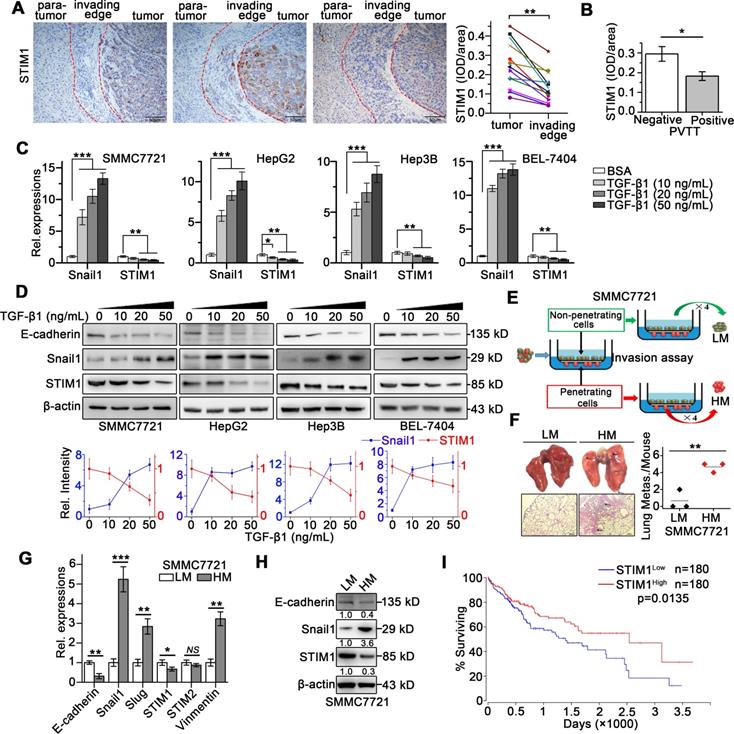
To monitor the dynamic expression of STIM1 during HCC cell invasion and metastasis, we established EMT models of SMMC7721, HepG2, Hep3B, and BEL-7404 cells via treatment with transforming growth factor beta 1 (TGF-β1) or under hypoxic condition. We found that TGF-β1 treatment for 48 h significantly enhanced Snail1 expressions, while dramatically repressed STIM1 expression (Figure 1C-D). Under hypoxic condition (1% O2), the mRNA and protein levels of STIM1 and HIF-1α were increased at 12 and 24 h; however, they were subsequently reduced at 36 and 48 h. Of interest, Snail1 increased steadily even at 36 and 48 h (Figure S1A-B). We next isolated the sublines with high and low metastatic capacity derived from the SMMC7721 cells (Figure 1E), as previously reported [20, 21]. The high metastatic (HM)-sublines displayed higher metastatic activity, while lower proliferating speed, compared with the low metastatic (LM)-sublines (Figure 1F and S2A-E). We found that STIM1 expression was markedly lower in the HM-sublines than in the LM-sublines of SMMC7721 cells (Figure 1G-H). Furthermore, Kaplan-Meier estimates revealed that low STIM1 expression correlated with poor survival among HCC patients via microarray data obtained from TCGA database [22] (Figure 1I). These results indicate that STIM1 is down-regulated in metastatic HCC cells compared with proliferating cells, and low STIM1 levels correlated with poor outcomes of HCC patients.
STIM1 promotes invasion and metastasis as well as anoikis of HCC cells
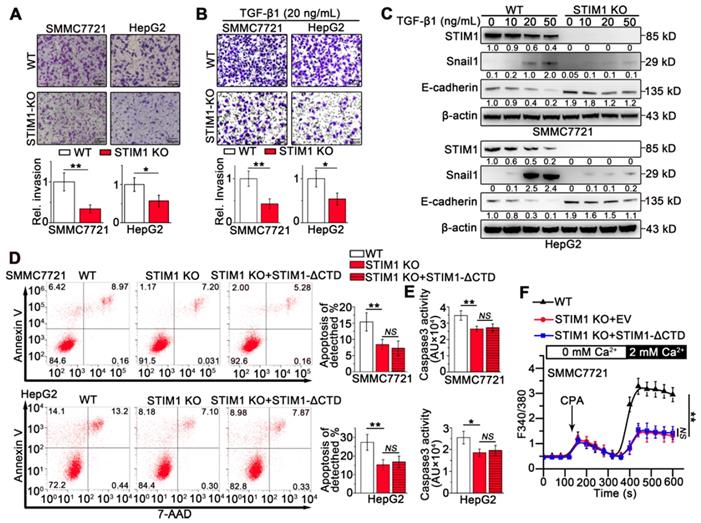
To determine the role of STIM1 in the invasion and metastasis of HCC cells, we generated STIM1 knockout (KO)-SMMC7721 and HepG2 cells using a CRISPR/Cas9 system (Figure S3A-D). STIM1 depletion significantly inhibited cell invasion (Figure 2A), clonal formation, and proliferation in vitro (Figure S3E-G). Furthermore, both TGF-β1- and hypoxia-induced invasion and metastasis as well as Snail1 expression were blunted when STIM1 was knocked-out in SMMC7721 and HepG2 cells (Figure 2B-C; S4A-B). Of interest, ablation of STIM1 enabled HCC cells to evade anoikis (Figure 2D-E), a programmed cell death triggered through detachment from the substratum [23-25]. Moreover, the introduction of a functional mutant STIM1 with a deletion of the C-terminal domain (STIM1-ΔCTD) failed to reverse anoikis resistance caused by STIM1 deficiency (Figure 2D-F), suggesting that repressed SOCE may contribute to anoikis resistance in STIM1 KO-HCC cells. These data indicate that STIM1 deficiency is required for anoikis resistance in metastatic HCC cells, i.e. STIM1 KO contributes to HCC cell survival during metastasis.
The effects of STIM1 deficiency on invasion and metastasis in HCCs. (A and B) Transwell assays of WT- and STIM1 KO- cells without (A) or with TGF-β1 (20 ng/mL) treatment (B). (C) STIM1, E-cadherin and Snail1 protein levels in WT- and STIM1 KO- cells treated with TGF-β1 for 48 h. (D, E) Flow cytometry analysis (FACS) (D) and caspase 3 activity assay (E) were applied to measure the anoikis rate in WT-, STIM1 KO-, STIM1 KO+STIM1-ΔCTD- SMMC7721 cells which were force suspended for 24 h, EV: empty vector; ΔCTD: deletion of the C-terminal domain. (F) Ca2+ mobilization in WT-, STIM1 KO-, STIM1 KO+STIM1-ΔCTD-SMMC7721 cells, respectively upon cyclopiazonic acid (CPA, 20 mM) stimulation, mean ± SEM of 8 independent cells each group. Data are expressed as mean ± SEM (n = 3). *p < 0.05, **p < 0.01, **p < 0.001, NS represents no significant difference.
The STIM1-Snail1 negative feedback circuit is involved in HCC pathogenesis and metastasis
Snail1 is essential for the invasion and metastasis of cancer cells, and its stability is regulated by glycogen synthase kinase 3 beta (GSK-3β)-induced ubiquitination [26-28]. Since STIM1-mediated SOCE activates the CaMKII/AKT pathway, and AKT also inhibits GSK-3β [10, 29], we speculated that STIM1 might suppress the proteasomal degradation of Snail1 by modulating the SOCE/CaMKII/AKT/GSK-3β pathway. Deficiency of STIM1 significantly reduced Snail1 protein levels and attenuated CaMKII/AKT/GSK-3β signaling (Figure 3A), while it did not influence Snail1 mRNA levels in SMMC7721 and HepG2 cells (Figure S5A). In contrast, STIM1 over-expression (OE) markedly boosted Snail1 protein expression, which was impaired by inhibitors of CaMKII/AKT/GSK-3β signaling pathway (Figure 3B). Thereafter, we assessed Snail1 stability using protein synthesis inhibitor-cycloheximide (CHX), and found that the degradation of Snail1 was significantly inhibited in STIM1 OE-SMMC7721 cells (Figure 3C). Moreover, robust Snail1 ubiquitination after pretreatment with proteasome inhibitor MG132 could be attenuated by over-expression of STIM1 (Figure 3D). Taken together, these data indicate that STIM1 stabilizes and activates Snail1 protein via the SOCE/CaMKII/AKT/GSK-3β signaling cascade in HCC cells.
The interaction between STIM1 and Snail1 in HCC. (A) Indicated protein expressions in WT- and STIM1 KO-SMMC7721 or HepG2 were examined, and β-actin was used as a loading control. (B) STIM1 OE-SMMC7721 cells were treated with SKF-96365 (10 µM), FK506 (10 µM), LY294002 (10 µM), GSK2126458 (1 µM) for 24 h; WB was used for measuring STIM1, p-AKT (Thr308), p-GSK-3β (Ser9) and Snail1 protein levels, and β-actin was used as a loading control, DMSO: dimethyl sulfoxide. (C) Mock- and STIM1 OE-SMMC7721 cells were treated by cycloheximide (CHX, 1 µM) with different time intervals. Cell extracts were immunoblotted with antibodies against STIM1, Snail1 and β-actin. Snail1 levels (normalized to β-actin) were plotted against CHX treatment durations. (D) Mock- and STIM1 OE-SMMC7721 cells were treated with or without MG132 (5 μM). Cell extracts were immunoprecipitated with Snail1 antibody and immunoblotted with antibodies against ubiquitin or Snail1, IP: immunoprecipitation, IB: immunoblotting. (E, F) HM-SMMC7721 sublines were transfected with scrambled siRNA (si-NC) or si-Snail1, RT-qPCR (E) and WB (F) to assess STIM1, Snail1 and E-cadherin expressions. (G, H) RT-qPCR (G) and WB (H) to assess STIM1, Snail1 and E-cadherin expressions in mock- and Snail1 OE-SMMC7721 and HepG2 cells. (I) Ca2+ mobilization upon CPA (20 mM) challenge after over-expressing Snail1, Snail1 plus STIM1, Snail1 plus STIM1-ΔCTD in SMMC7721 cells, respectively, mean ± SEM of 8 independent cells. (J) Bioinformatics analysis predicted binding site of Snail1 (5'-CAGGTG-3') in the promoter of STIM1, black arrow points to transcription start site. (K) ChIP assay of Snail1 protein and STIM1 promoter, representative agarose gel results showing recruitment of Snail1 to the STIM1 promoter, and PFKP promoter used as a positive control. (L) Luciferase activity assay of STIM1 promoter and STIM1 promoter containing mutant E-box (TAGGTT) in Snail1 OE-SMMC7721. Data are expressed as mean ± SEM (n = 3). *p < 0.05, **p < 0.01, ***p < 0.001, NS represents no significant difference.
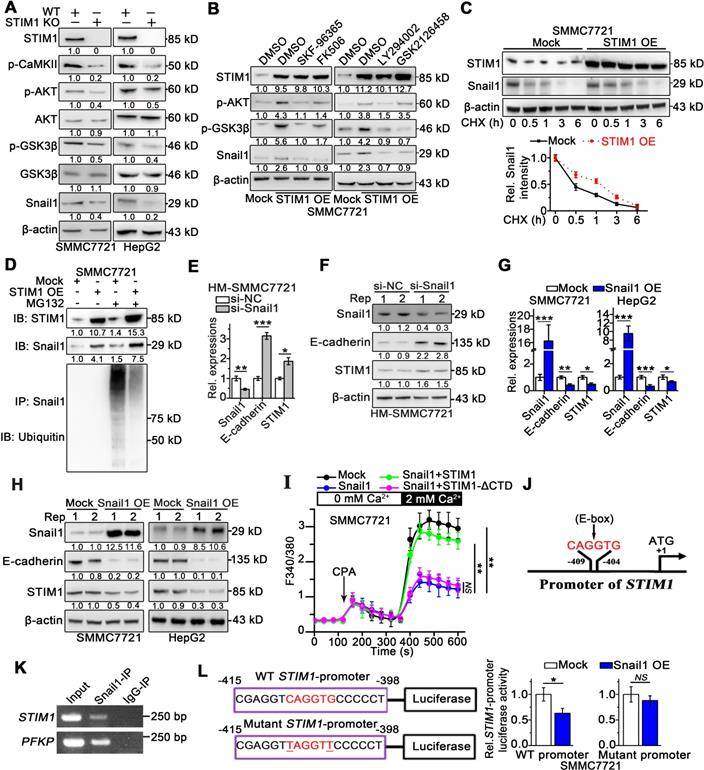
Since the expression patterns of STIM1 and Snail1 differed in metastatic HCC cells, we hypothesized that Snail1 may transcriptionally regulate STIM1 expression. Indeed, knockdown of Snail1 by short interfering RNA (siRNA) upregulated STIM1 expression (Figure 3E-F), as well as led to a moderate promotion of proliferation in HM-SMMC7721 sublines (Figure S5B). On the other hand, over-expression of Snail1 repressed the expressions of STIM1 and E-cadherin in SMMC7721 and HepG2 cells (Figure 3G-H). Nevertheless, the levels of STIM2 and Orai1 were not influenced by over-expressing Snail1 (Figure S5C-D). In addition, ectopic expression of Snail1 attenuated SOCE in SMMC7721 cells. Reintroducing of STIM1 restored SOCE in Snail1 over-expressing cells; however, this was not observed in cells with heterogeneous STIM1-ΔCTD supplementation (Figure 3I). Furthermore, the in silico analysis revealed that the STIM1 proximal promoter harbored a canonical E-box motif (5'-CAGGTG-3') at position -409 to -404 (Figure 3J), which may play an important role in mediating the transcriptional repressor activity of Snail1 [30, 31]. Chromatin immunoprecipitation (ChIP) analysis validated that DNA fragment of STIM1 promoter containing the putative Snail1 binding sites could be amplified from the Snail1-immunoprecipitated samples (Figure 3K). Consistently, electrophoretic mobility shift assay (EMSA) revealed that the probe corresponding to the region containing the E-box of the STIM1 promoter combined with Snail1, and this binding could be abrogated by the unlabeled oligonucleotides (Figure S5E). Moreover, the reporter activity of STIM1 promoter was suppressed by Snail1 over-expression in SMMC7721, whereas the specific mutation at predicted binding site attenuated the ability of Snail1 to suppress STIM1 promoter activity (Figure 3L). These results suggest that Snail1 transcriptionally suppresses STIM1 expression via binding with the STIM1 promoter at the E-box motif. Furthermore, Snail1 upregulation accompanied by STIM1 downregulation was observed in the invading-edge of HCC tissues (Figure S5F). Compared with PVTT negative samples, samples from HCC patients with PVTT possessed higher expression of Snail1 at the invading-edge of tumors (Figure S5G). These results indicate that Snail1 transcriptionally suppresses STIM1 expression and represses SOCE during the invasion and metastasis of HCC.
Restoration of STIM1 abrogates anoikis resistance and metastatic activity of Snail1 OE -HCC cells
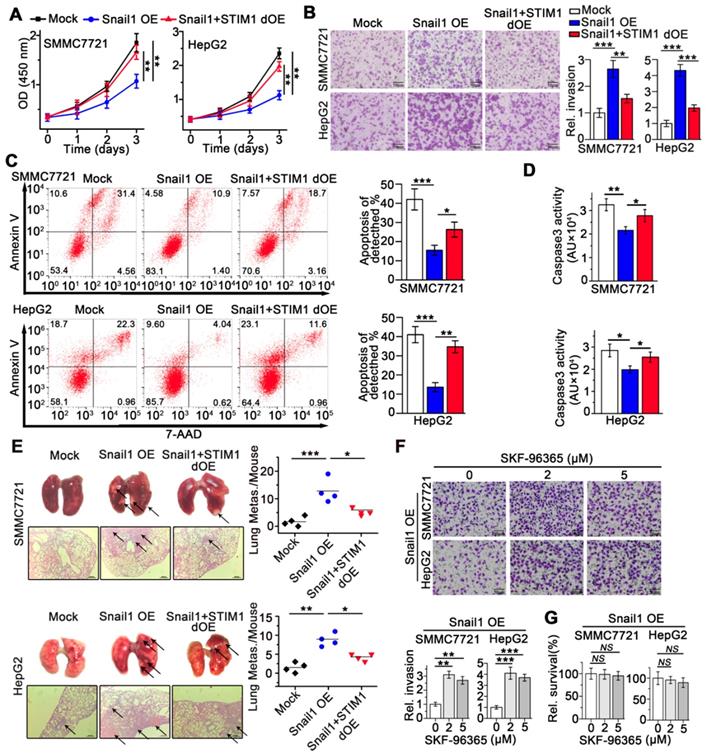
We next investigated the effects of STIM1 on the metastatic activity of Snail1 OE-HCC cells. Interestingly, STIM1 restoration facilitated cell proliferation (Figure 4A), but attenuated anoikis-resistance and metastasis of Snail1 OE-SMMC7721 and HepG2 cells both in vitro and in vivo (Figure 4B-E). Furthermore, low concentrations of SKF-96365, a specific SOCE inhibitor, enhanced the invasive capability of Snail1 OE-HCC cells (Figure 4F-G). These results further indicate that repressed STIM1/SOCE is required for avoiding anoikis and promoting the invasion and metastasis of Snail1 OE-HCC cells.
STIM1 replenish abrogates the anoikis resistance and metastasis of Snail1 OE-cells. (A) Effects of STIM1 on the proliferation of Snail1 OE-SMCC7721 and HepG2 cells. (B) Transwell assays for the invasion of WT-, Snail1 OE-, Snail1 plus STIM1 double OE (Snail1+STIM1 dOE)-SMMC7721 and HepG2 cells. (C, D) FACS (C) and caspase 3 activity assay (D) were used to measure the anoikis rate in mock-, Snail1 OE- and Snail1+STIM1 dOE-SMMC7721 and HepG2 cells. (E) The effects of STIM1 restoration on the metastasis of Snail1 OE-SMMC7721 and HepG2 cells in vivo. Lungs were observed for metastatic nodules on the surface, stained by H&E for histological analyses, arrows point to metastatic nodules. Representative photographs and H&E staining were shown (n = 4 mice per group). (F) Transwell assays were performed to detect the effects of different concentrations SKF-96365 on the invasion ability of Snail1 OE-SMMC7721 and HepG2 cells. (G) CCK-8 assay was applied to examine the effects of SKF-96365 with different concentrations on the survival of Snail1 OE-SMMC7721 and HepG2 cells. Data of (A-D, F and G) are expressed as mean ± SEM (n = 3). **p < 0.01, ***p < 0.001, ***p < 0.001, NS represents no significant difference.
STIM1 deficiency in HCC cells leads to decreased glycolysis and enhanced fatty acid oxidation
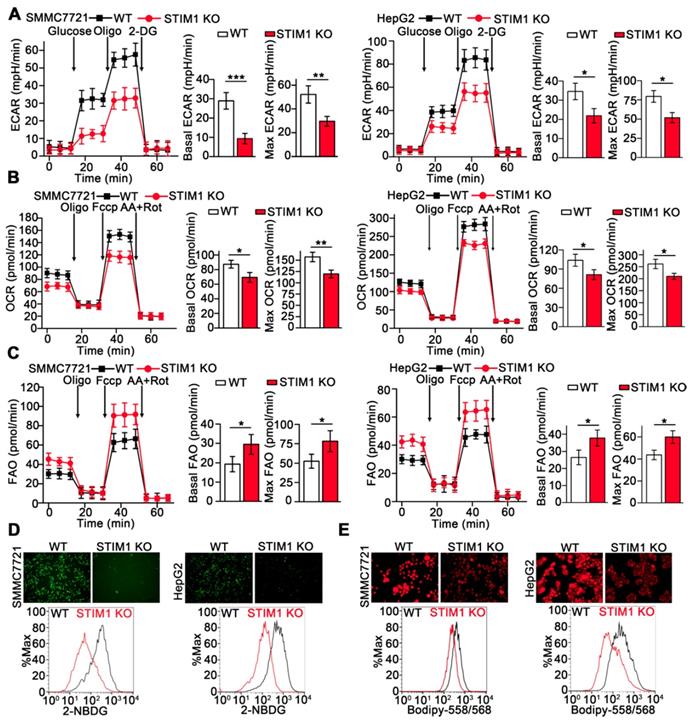
Metabolic reprogramming is fundamental for orchestrating the proliferation and metastasis of tumor cells [32-35]. We examined the metabolic phenotype resulting from STIM1 deficiency in HCC cells using Seahorse XFp cellular flux analyzer. Loss of STIM1 reduced the glycolysis-driven extracellular acidification rate (ECAR) and oxygen consumption rate (OCR) but enhanced fatty acid oxidation (FAO) in SMMC7721 and HepG2 cells (Figure 5A-C). Moreover, deletion of STIM1 dramatically decreased glucose uptake and intracellular lipid deposition in SMMC7721 and HepG2 cells (Figure 5D and E).
STIM1 deficiency rewires aerobic glycolysis towards FAO. (A-C) ECAR (A), OCR (B) and FAO (C) caused by STIM1 deficiency in SMMC7721 and HepG2 cells were measured by Seahorse XF24 analyzer. Oligo: Oligomycin, 2-DG: 2-Deoxy-D-glucose, Fccp: Carbonyl cyanide 4-(trifluoromethoxy) phenylhydrazone, AA/Rot: Antimycin A/Rotenone. (D, E) The glucose uptake (D) and intracellular lipid content (E) in WT- and STIM1 KO-SMMC7721 or HepG2 cells were determined by fluorescence microscope and FACS. Data are expressed as mean ± SEM (n = 3). *p < 0.05, **p < 0.01, ***p < 0.001.
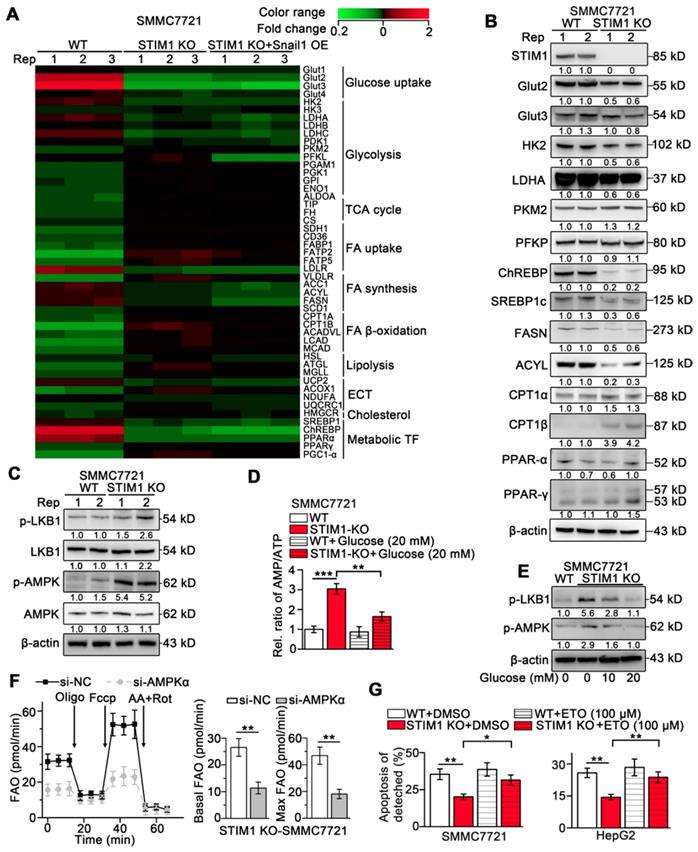
Our and other earlier studies have established that HIF-1 promotes glycolysis and de novo lipogenesis and inhibits FAO in HCC, and STIM1-mediated SOCE stabilizes HIF-1α [9, 36-38]. To elucidate the mechanism underlying STIM1-mediated regulation of glucose and lipid metabolism, we performed a PCR-array (GSE148129). We observed that genes involved in glucose uptake including glucose transporter 2 (GLUT2) and GLUT3 and glycolytic genes including hexokinases (HK2 and HK3), lactate dehydrogenase A (LDHA), and pyruvate dehydrogenase kinase 1 (PDK1) were significantly downregulated. Genes in fatty acid synthesis (FAS) including acetyl-coA carboxylase 1 (ACC1), fatty acid synthase (FASN), and ATP citrate lyase (ACLY) were markedly downregulated, while the key enzymes involved in FAO including carnitine palmitoyl-transferase A (CPT1A) and long-chain acyl-CoA dehydrogenases (LCAD) were upregulated in STIM1 KO-SMMC7721 cells (Figure 6A). Of note, GLUT2, HK2, PDK1, ACYL, FASN, and LCAD are direct targets of HIF-1 [39, 40]. Besides, the Snail1 protein expression was reduced in STIM1 KO-HCC cells, while Snail1 restoration couldn't reverse the expression changes of metabolic enzymes triggered by STIM1 deletion (Figure 6A), suggesting that the switched metabolism from aerobic glycolysis towards FAO after depletion of STIM1 is in a Snail1-independent manner. Consistently, the protein levels of Glut2, HK2, LDHA, ChREBP, SREBP1c, FASN and ACYL were dramatically decreased, while CPT1α and CPT1β were markedly increased in STIM1-deficient HCC cells (Figure 6B). The correlation between STIM1 and metabolism-related genes was analyzed using microarray data of 238 HCC patients obtained from Gene Expression Omnibus (GEO), which showed that STIM1 positively correlated with several genes involved in glycolysis and FAS, but negatively correlated with FAO (Figure S6A).
Lacking of STIM1 rewires aerobic glycolysis towards AMPK-activated FAO. (A) PCR-array was applied to examine the expression changes of key metabolic genes caused by STIM1 KO and STIM1 KO+Snail1 OE (GSE148129). (B) Protein levels of indicated metabolic molecules in WT- and STIM1 KO-SMMC7721 cells. (C) Protein levels of LKB1/AMPK pathway in WT- and STIM1 KO-SMMC7721 cells. (D) The AMP/ATP ratio in WT- and STIM1 KO-SMMC7721 with or without glucose (20 mM). (E) Effects of glucose on the expressions of p-LKB (Ser428) and p-AMPK (Thr172) in STIM1 KO-SMMC7721 cells. (F) FAO in STIM1 KO-SMMC7721 cells transfected with si-NC or si-AMPKα. (G) Effects of ETO (100 μM) on the anoikis of STIM1 KO-SMMC7721 and HepG2 cells were examined by FACS, as well as their corresponding WT-group. ETO: etomoxir. Data are expressed as mean ± SEM (n = 3). *p < 0.05, **p < 0.01, ***p < 0.001.
In addition, UK-5099, an inhibitor of mitochondrial pyruvate intake, but not BPTES (a glutaminase inhibitor), suppressed OCR in STIM1 KO-HCC cells (Figure S6B), indicating that decreased glycolysis is implicated in reduced OCR resulting from the ablation of STIM1. Furthermore, SOCE inhibitor SKF-96365 suppressed ECAR and OCR, but enhanced FAO in SMMC7721 cells (Figure S6C-E). Supplementation of STIM1-ΔCTD did not reverse the expression changes of metabolic enzymes upon STIM1 KO (Figure S6F). These results demonstrate that STIM1 promotes glycolysis and FAS during HCC pathogenesis via activating SOCE.
To elucidate the mechanism of enhanced FAO in STIM1-deficient HCC cells, we examined the key regulatory factors of FAO. Deletion of STIM1 activated phospho-liver kinase B1 (p-LKB1) and phospho-adenosine monophosphate-activated protein kinase (p-AMPK), but did not influence expressions of PPAR-α and PPAR-γ in SMMC7721 cells (Figure 6B-C). AMPK, a critical sensor of cellular energy in response to energy stress, is activated by CaMKII or LKB1 [41]. Activated AMPK inactivates ACC1 via Ser79 phosphorylation, which leads to a reduction in malonyl-CoA synthesis, thereby promoting FAO by alleviating the inhibition on CPT1 [42, 43]. Because the CaMKII pathway was blocked in STIM1 KO-HCC cells, AMPK might be activated by glucose deficiency. Indeed, we found that the ratio of adenosine monophosphate (AMP) and adenosine triphosphate (ATP) was elevated by STIM1 knockout (Figure 6D). Glucose supplementation not only reduced the AMP/ATP ratio, but also decreased the levels of p-LKB1 and downstream active p-AMPK (Figure 6D-E). Furthermore, AMPKα knockdown markedly attenuated STIM1 deficiency-triggered FAO (Figure 6F). Etomoxir (ETO), a specific CPT1 inhibitor blocking the FAO pathway, significantly promoted the apoptosis of the detached STIM1 KO-HCC cells, suggesting that elevated FAO contributed to anoikis resistance in STIM1-deficient HCC cells (Figure 6G). These findings demonstrate that STIM1 deficiency attenuates the glycolysis and FAS pathway, while activates the LKB1/AMPK-dependent FAO pathway in HCC cells.
Catabolic FAO triggered by STIM1 deficiency is required for Snail1-driven invasion and metastasis
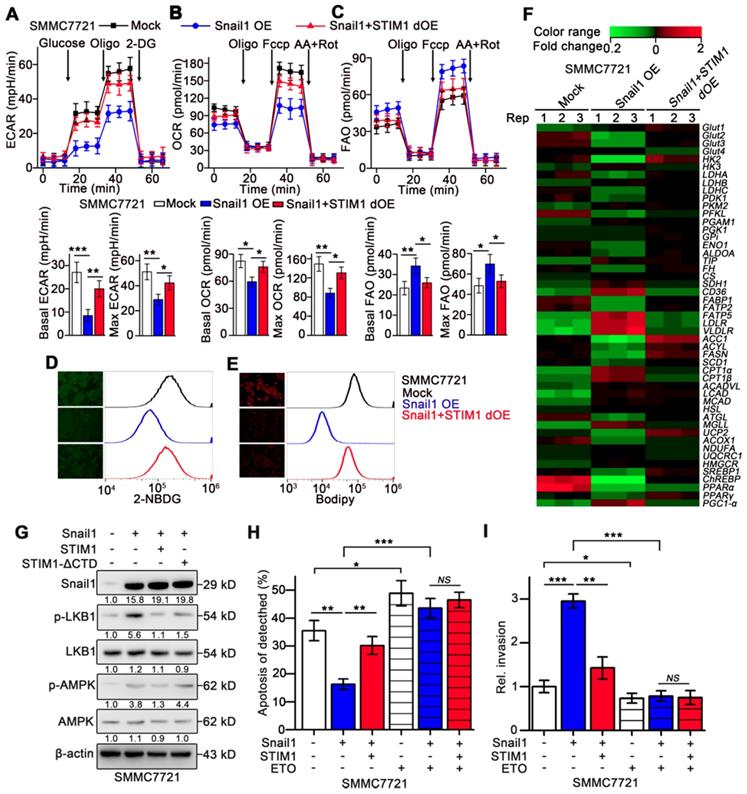
Metastatic cells exhibit enhanced catabolism but decreased anabolism [4, 5, 44], we speculated whether STIM1 deficiency contributed to the anabolism/catabolism switch during the EMT of HCC cells. Treatment with TGF-β1 repressed ECAR and moderately accelerated FAO in SMMC7721 cells (Figure S7A-B). Similarly, Snail1 OE-HCC cells exhibited significantly impaired OCR and ECAR but enhanced FAO, compared with the mock group. These metabolic changes caused by Snail1 OE were largely reversed upon STIM1 supplementation (Figure 7A-C). Furthermore, glucose uptake and lipid deposition were significantly reduced in Snail1 OE-HCC cells, which could be obviously eliminated by STIM1 supplementation (Figure 7D-E). Consistently, Snail1 OE inhibited the expressions of multiple genes related to glycolysis and FAS, while upregulated several genes involved in lipid uptake, lipolysis and FAO pathways (GSE135901) (Figure 7F). Supplementation of STIM1 also could remove the expression changes of metabolic enzymes caused by Snail1 OE (Figure 7F). Moreover, STIM1, but not STIM1-ΔCTD, could reverse the trend of the LKB1/AMPK pathway activated by Snail1 OE, validating that STIM1 downregulation triggered FAO in Snail1 OE-HCC cells (Figure 7G). In addition, when FAO pathway was blocked by ETO, STIM1 restoration could not alleviate the anoikis resistance or invasion activity driven by Snail1 (Figure 7H-I). These results indicate that STIM1 deficiency contributes to the metabolic switch from glycolysis and FAS to FAO, which is required for the invasion and metastasis driven by Snail1 in HCC cells.
Metabolic switch triggered by Snail1 could be reversed by STIM1 restoration. (A-C) ECAR (A), OCR (B) and FAO (C) in mock-, Snail1 OE-, Snail1+STIM1 dOE-SMMC7721 cells. (D, E) Glucose uptake (D) and intracellular lipid deposition (E) in mock-, Snail1 OE- and Snail1+STIM1 dOE-SMMC7721 cells. (F) PCR-array was applied to examine the expression of key metabolic genes in mock, Snail1 OE, Snail1 plus STIM1 dOE SMMC7721 cells (GSE135901). (G) Effects of STIM1 and STIM1-ΔCTD on the LKB1/AMPK pathway in Snail1 OE-SMMC7721 cells. (H) Effects of ETO (100 μM) on anoikis of mock-, Snail1 OE- and Snail1+STIM1 dOE-SMMC7721 cells were examined by FACS. (I) Effects of ETO (100 μM) on the invasion ability of mock-, Snail1 OE- and Snail1+STIM1 dOE-SMMC7721 cells via transwell assays. Data are expressed as mean ± SEM (n = 3). *p < 0.05, **p < 0.01, ***p < 0.001. NS represents no significant difference.
Discussion
STIM1-mediated SOCE contributes to cell migration in various tumors, including breast cancer, gastric cancer, colorectal cancer, and melanoma, by modulating focal adhesion turnover and myosin II contraction [14-17]. Unexpectedly, our data showed that STIM1 was downregulated in the invading-edge in comparison with the corresponding tumor tissue of HCC, which correlated with PVTT formation and poor prognosis of HCC patients. STIM1-activated SOCE promoted Snail1 expression through the CaMKII/AKT/GSK-3β pathway during proliferation. Of interest, Snail1 in turn transcriptionally suppressed STIM1 by binding with STIM1 promoter during EMT. The intracellular Ca2+ promotes anoikis, thus inhibiting extracellular Ca2+ influx, which is essential for the survival of metastatic cancer cells [45]. We found that repressed STIM1/SOCE was required for preventing anoikis during metastasis. Thus, STIM1 expression is temporally and differentially regulated during EMT, which orchestrates HCC pathogenesis and metastasis.
Although Snail1 directly activates the transcription of several genes, it is extensively considered as a transcriptional repressor [30, 31, 46, 47]. The repressor activity of Snail1 is dependent on binding to canonical E-box motif (5'-CACCTG-3' or 5'-CAGGTG-3') in the promoter of target gene via Cys2-His2 zinc-fnger domain [30, 48]. In addition, a proposed Snail1-responsive motif (5'-TCACA-3') has been identified in the promoters of several genes activated by Snail1 including ZEB1, MMP9, and p15INK4 [31, 46]. In this study, bioinformatics analysis revealed that the STIM1 proximal promoter (-1005 ~ +1 from the transcription starting site) harbored a canonical Snail1-binding E-box, whereas no motif of (5'-TCACA-3') was found. Moreover, ChIP and EMSA analysis confirmed that Snail1 could bind to the E-box in STIM1 promoter. The STIM1-promoter activity was dramatically suppressed by Snail1 over-expression, while the activity of E-box mutated STIM1-promoter was not altered. Therefore, our results indicate that Snail1 transcriptionally suppresses STIM1 expression by binding to the E-box of STIM1 promoter in HCC cells.
Disordered Ca2+ signal plays a critical role in regulating metabolism during tumor progression [49-51]. On one hand, cytosolic Ca2+ orchestrates the activity of the Ca2+-dependent metabolic enzymes [10, 52-55]. For instance, the activity of OXPHOS crucially depends on Ca2+-dependent a-ketoglutarate- and isocitrate-dehydrogenases in the mitochondrial matrix [53, 54]; and pyruvate dehydrogenase (PDH) is phosphorylated and inactivated at ser293 by the Ca2+-dependent phosphatase- pyruvate dehydrogenase kinases (PDK), thereby OXPHOS is switched towards aerobic glycolysis [52]. On the other hand, cytosolic Ca2+ signaling can indirectly activate various metabolic transcription factors, including nuclear factor of activated T cells (NFAT), AP-1 transcription factor (AP-1), and cAMP-response element-binding protein (CREB) [10, 11, 56]. Our data showed that both STIM1 KO and SOCE inhibitors-SKF-96365 suppressed glycolysis, but enhanced FAO in HCC cells, indicating that Ca2+ signal regulated by STIM1/SOCE is involved in metabolic regulation of HCC.
Metabolic reprogramming is necessary to maintain rapid growth and metastasis of cancer cells [4, 57, 58]. Our results showed that deletion of STIM1 significantly inhibited cell proliferation in HCC cells. Notably, knockout of STIM1 also markedly downregulated several downstream targets of HIF-1, including GLUT2, HK2, PDK1, ACYL and FASN, which are key enzymes for glycolysis and FAS, respectively. Literature have shown that HCC cells exhibit a high rate of glucose-derived de novo FAS to fulfill the biosynthesis of membranes and signaling molecules [57, 59, 60]. Conversely, the reduced lipid consumption (FAO) in cancer cells is expected to sustain uncontrolled rapid proliferation. For instance, HIF-1-mediated suppression of FAO through downregulation of MCAD and LCAD is critical for the growth of HCC cells [36], CD147-mediated inhibition of FAO is beneficial for HCC growth and metastasis [61]. However, metastatic cancer cells undergo metabolic stress, which are primarily characterized by glucose deficiency [4, 62]. The metabolic switch from anabolism (glycolysis and FAS) to catabolism (FAO) is required for protecting cells against starvation and anoikis [25, 63, 64]. The present results suggest that STIM1 is a key regulator of metabolism to maintain a balance between anabolism and catabolism. During proliferation, STIM1 promotes glycolysis and FAS but suppresses FAO, thus promoting HCC cell proliferation and Snail1 expression. However, with the upregulation of Snail1, the attenuation of STIM1-mediated SOCE results in the reduction of FAS but the acceleration of FAO, which subsequently inhibits cell proliferation and induces anoikis resistance and metastasis in HCC cells.
In conclusion, our results reveal that STIM1 is a metabolic checkpoint that orchestrates the invasion and metastasis in HCC by switching aerobic glycolysis to FAO. STIM1 repression is required for the 'metabolic switch' from anabolic to catabolic metabolism in HCC cells undergoing EMT, suggesting that temporal targeting the STIM1-Snail1 signaling circuit is a potential therapeutic alternative for metastatic HCC.
Materials and Methods
Human samples
Paraffin-embedded primary hepatocarcinoma tissues were obtained from patients at Xinqiao Hospital (Chongqing, China). Clinicopathological characteristics of HCC patients were summarized in Table S1. The use of clinical specimens in this study was approved by the Xinqiao Hospital ethics committee of the Amry Medical University.
Cell lines
SMMC7721, HepG2, Hep3B and HEK293T cell lines were purchased from the American Type Culture Collection (ATCC, Rockville, MD, USA). BEL-7404 were obtained from the Cell Bank of Type Culture Collection of Chinese Academy of Sciences (Shanghai, China). All cell lines had been authenticated and tested for Mycoplasma, and all cells were maintained according to the manufacturer's instructions and passages <10 were used in this study.
Establishment of high and low metastatic sublines of SMMC7721
A pair of SMMC7721 subpopulations with differently metastatic ability were established according to previously studies [20, 21, 65]. Transwells (BD biosciences, San Jose, CA) with 8-μm pore size filters covered with Matrigel (BD biosciences) inserted into 6-well plates were used to build an in vitro invasion model. In brief, SMMC7721 cells (60-70% confluent) were serum starved for 24 h before they were digested and suspended in medium without fetal bovine serum (FBS). Cell density was adjusted to 5×10⁵ cells/mL and 1 mL cell suspension was added into chamber pre-incubated with 0.5 mL DMEM without FBS. The lower chamber was added with DMEM with 20% (v/v) FBS. After 24 h incubation at 37 °C and 5% CO2, cells from upside (U) and downside (D) of the chamber membrane were harvested and cultured, respectively. In the subsequent three rounds of selection, only the upside cells derived from the first-generation of U-subpopulation and the membrane penetrated cells from the original D-sublines were obtained. After four rounds of continual separation, we acquired one pairs of SMMC7721 cell sublines, which were named as high metastatic (HM)- and low metastatic (LM)-sublines, respectively.
Gene expression
Total RNA was extracted using Trizol (TAKARA, Japan) and reversely transcribed using PrimeScript™ RT reagent Kit with gDNA Eraser (TAKARA). mRNA expression was assessed by Real-time quantitative polymerase chain reaction (RT-qPCR) using TB Green® Premix Ex Taq™ II (TAKARA) on BioRad CFX384 (Bio-Rad, CA) with 40 cycles at 95 °C for 10 s, 59 °C for 20 s and 72 °C for 30 s. Gene expression levels were analyzed using the delta Ct method and normalized by subtracting that of control β-actin mRNA. The gene-specific primers used in RT-qPCR experiments were listed in Table S2.
Western blotting
For HCC cells, whole lysates were prepared by direct lysis in RIPA buffer with PMSF (Beyotime, Beijing, China) and phosphatase inhibitors (Cwbiotech, Beijing, China). Protein concentration was quantified using BCA Protein Assay Kit (Beyotime) and 40 μg total protein/well was loaded. Samples were then separated by 4-12% Bis-Tris PAGE electrophoresis and transferred to PVDF membrane for detection. Western blots were probed overnight at 4 °C with specific primary antibodies in Tris-Buffered Saline Tween-20 (TBST) containing 5% skim milk. After washed for 3 times with TBST, the membranes were incubated for 1 h at room temperature with a respective IgG-HRP labled second antibody (1:5,000) in TBST containing 5% skim milk. Antigens were revealed using a chemiluminescence assay (Pierce, Rockford, USA). Quantification of bands was achieved by densitometry using the FluorChem HD2 system (ProteinSimple, Santa Clare, CA, USA). The antibodies used in WB analysis were listed in Table S3.
H&E staining and Immunohistochemistry
The tissue specimens were fixed at least 24 h in 10% neutral-buffered formaldehyde immediately after surgical removal, and then dehydrated in isopropyl alcohol, followed by clearing of alcohol by xylene. Subsequently, the dehydrated specimens were embedded in paraffin, standard staining with hematoxylin and eosin (H&E) was performed. For immunohistochemistry (IHC), tumor sections were deparaffinized, then incubated in citrate buffer (pH 6.0) at 95 °C for 45 min for antigen retrieval. Next, the specimens were blocked with 5% goat serum for 30 min, which followed by incubating with the primary antibodies rabbit immunoglobulin G (IgG, 1:200), STIM1 (1:100) or Snail1 (1:100) respectively overnight at 4 °C. After three washes, tissue sections were incubated with HRP anti-rabbit IgG (1:200) at room temperature for 60 min and followed by incubated with DAB solution and then counterstained with haematoxylin. Staining results were captured by an ortho microscope (Olympus, Tokyo, Japan) under high-magnification (400×). After that, the integrated optical density (IOD) of STIM1, Snail1 and IgG in the tumor invading-edge and corresponding tumor region were measured using ImageJ software (Media Cybernetics, Bethesda, MD, USA), and the mean density (IOD/area) of STIM1 and Snail1 against IgG in different areas of cancer specimens were calculated by ImageJ software. The antibodies used in IHC were listed in Table S3.
Animal studies
Male BABL/c nude mice (5~6 weeks old) obtained from the Charles River (Beijing, China) were used for in vivo metastasis assay and subcutaneous xenograft, randomization was conducted. The use of experimental animals was based on the National Institutes of Health (NIH) guidelines. For the lung metastatic model, 2×10⁶ HCC cells were injected into the blood of nude mice through tail vein. After 6 weeks, the mice were sacrificed and metastatic organs (lung) were excised and the micro-metastases were examined using a dissecting microscope. The metastasis was confirmed by H&E staining.
Inhibitors, recombinant proteins and other reagents
SKF-96365 (HY-100001), FK506 (HY-13756), MG132 (HY-13259), Cycloheximide (HY-12320), BPTES (HY-12683), UK-5099 (HY-15475), Etomoxir (HY-50202), Puromycin (HY-B1743) and Blasticidin S (HY-103401A) were obtained from MedChemExpres (Monmouth Junction, NJ, USA). LY29402 (LY294002) and GSK2126458 (S2658) were purchased from Selleckchem (Houston, TX, USA). Glucose (A2494001), Lipofectamine 2000 (11668027), 2-NBDG (N13195), Bodipy 558/568 (D3835) and Fura 2-AM (F1221) were obtained from Thermo Fisher Scientific (Waltham, MA, USA). Poly-2-hydroxyethyl methacrylate (poly-HEMA, 529257), dimethyl sulfoxide (DMSO, 34869) and cyclopiazonic acid (239805) were purchased from Sigma-Aldrich (St. Louis, MO, USA). Recombinant TGF-β1 (240-B-002) was obtained from R&D Systems, Inc. (Minneapolis, MN, USA).
Seahorse XFp metabolic flux assays
The rate of metabolic flux was determined by seahorse XFp extracellular flux analyzer (Agilent Technologies, Santa Clara, CA, USA). 5,000 cells/well were seeded in Seahorse XFp cell culture plates and allowed to adhere overnight. Then the medium was replaced with substrate-limited medium for 16 h. For ECAR detection: 60 min before the examination, cells were washed twice and replaced with Seahorse XF DMEM Medium (pH 7.4), then the cell plate was incubated in CO2 free incubator at 37 °C for 1 h, the EACR was detected according to Glycolysis Stress Test protocols. The following concentrations for each drug were used during ECAR acquisitions: Glucose, 10 mM; Oligomycin (Oligo), 1 μM; 2-Deoxy-D-glucose (2-DG), 50 mM. The rates of ECAR were normalized to protein levels in each well. For FAO detection: 60 min before the assay, cells were washed twice and replaced with FAO assay medium containing 111 mM NaCl, 4.7 mM KCl, 1.25 mM CaCl2, 2 mM MgSO4, 1.2 mM NaH2PO4, supplemented with 2.5 mM Glucose, 0.5 mM carnitine and 5 mM HEPES at a final pH of 7.4. Palmitate-BSA was applied at a final concentration of 0.1 mM just before the start of the assay. The FAO was detected according to XFp Cell Mito Stress Test protocols. The following concentrations for each drug were used during FAO acquisitions: Oligo, 4 μM; Fccp, 2 μM; Antimycin A/Rotenone (AA/Rot), 2 μM. The rates of FAO were normalized to protein levels in each well. For OCR detection: 60 min before the assay, cells were washed twice and replaced with Seahorse XF DMEM Medium (pH 7.4) containing 10 mM Glucose, 1 mM pyruvate and 2 mM Glutamine. The OCR was detected according to XFp Cell Mito Stress Test protocols. The following concentrations for each drug were used during OCR acquisitions: Oligo, 4 μM; Fccp, 2 μM; AA/Rot, 2 μM. The rates of OCR were normalized to protein levels in each well.
Glucose uptake and intracellular lipid content measurement
Glucose uptake was analyzed directly using the fluorescent glucose analog 2-NBDG. HCC cells were incubated in glucose-free RPMI medium containing 100 mM 2-NBDG for 90 min at 37 °C in dark, and the amount of 2-NBDG taken up by cells was assessed by flow cytometry analysis (FACS). For fluorescence examine, HCC cells grown on coverslips were fixed with 4% paraformaldehyde for 10 min, then cells were washed 3 times in cold PBS and stained with 100 mM 2-NBDG for 90 min at 37 °C in dark, and cell images were photographed using a fluorescence microscope (Leica, Wetzlar, Germany). For lipid content measurement, 2×10⁵ cultured HCC cells were incubated in the presence of 1 μM fluorescent lipid probe Bodipy 558/568 for 30 min at 37 °C in dark. Then the labeled cells were washed and re-suspended in cold PBS and the lipid content was quantified using FACS as mentioned above. For fluorescence examine, HCC cell lines grown on coverslips were fixed with 4% paraformaldehyde for 10 min. Following fixation, cells were washed 3 times in cold PBS and stained with 1 μM Bodipy 558/568 for 30 min at 37 °C in dark, and cell images were photographed using a fluorescence microscope (Leica).
Plasmids, lentiviral and siRNA
The recombinant plasmids containing human STIM1 and SNAI1 were purchased from GeneCopoeia (Rockville, MD, USA), STIM1-ΔCTD mutant recombinant plasmid which containing 1-440 AA of STIM1 was synthesized and inserted into pReceiver-Lv197 lentiviral vector. Lentivirus was produced in HEK293T cells according to the instruction manual of Lenti-Pac™ HIV Expression Packaging Kit (GeneCopoeia). Viral supernatant was harvested at 48~72 h post-transfection, passed through a 0.45 µm polyethersulfone low protein-binding filter, diluted 1:2 (v/v) with fresh medium containing polybrene (7.5 mg/mL) and used to infect the target cells at 80% confluence. Three days after infection, blasticidin S (10 μg/mL) or puromycin (3 μg/mL) was used to select the cells with stable expression of lentivirus. Over-expression efficiency of STIM1 or Snail1 was evaluated by immunoblotting and RT-qPCR. Besides, siRNAs targeting human Snail (SIGS0002558-1), AMPKα (SIGS0004655-4) were obtained from RiboBio (Guangzhou, China).
Calcium imaging
Calcium imaging was carried out as previously described [9]. In brief, cells were placed on coverslips coated with poly-D-lysine. Intracellular Ca2+ was monitored using the fluorescent Ca2+ indicator Fura 2-AM according to the manufacture's instruction. Images were collected at 6-second intervals. Measurements of intracellular Ca2+ concentration ([Ca2+]i) of single cells were performed using an inverted fluorescence microscope (Nikon, Japan). The standard extracellular solution contained (mM): 140 NaCl, 5 KCl, 2 CaCl2, 1 MgCl2·6H2O, 10 HEPES, 10 Glucose, pH 7.4. Ca2+-free extracellular solution was prepared by replacing CaCl2 with equimolar amounts of MgCl2 and 0.5 mM EGTA was added. After loading, cells were washed three times in the above solution and then left for 15 min to allow for further de-esterification. Background fluorescence signals were collected at the same rate for the same wavelengths (340 and 380 nm) and were subtracted from the corresponding fluorescence images. The results (∆F/F0) were expressed as ratios of fluorescence signals measured at 340 nm to fluorescence signals measured at 380 nm during a response divided by the ratio obtained in resting conditions (that is, before the addition of an agent). ∆F/F0 was used to assess the amplitude of [Ca2+]i in these cells.
CRISPR/Cas9 targeted deletion of STIM1
To knock out STIM1 gene, we designed single guided RNA (sgRNA) sequences (Forward 5′-CAC CGC ATC ATC GTC CAT CAG TTT G-3′; Reverse: 5′-AAA CCA AAC TGA TGG ACG ATG ATG C-3′) for human STIM1 gene and cloned the targeting sequences into the lentiCRISPR v2 vector (Addgene, Watertown, MA, USA). Lentivirus for STIM1 sgRNA, vector control were generated in HEK293T cells by standard methods using lenti-packaging vectors. SMMC7721 and HepG2 cells were then infected with the lentivirus for 48 h and selected with puromycin (3 μg/mL) for 10 days, then established the monoclonal cells. STIM1 deletion in individual monoclonal cell line was further verified by DNA sequencing and WB.
Chromatin immunoprecipitation PCR
Chromatin immunoprecipitation (ChIP) assays were performed using a ChIP Kit (Thermo Fisher Scientific) as described previously [9]. Briefly, chromatin from cells was crosslinked with 1% formaldehyde for 10 min at room temperature, sheared to an average size of 500 bp, and immunoprecipitated with Snail1 antibody (CST, 3879) and IgG. The ChIP-PCR primers of STIM1 (forward: 5'-AGC TTC TGC TGC TCG CCG CTC TTC-3'; reverse: 5'-GGA CCC ACT GTT GGA CCT GAG GAG-3') were designed to amplify the promoter region containing the putative Snail1-binding site (5'-CAGGTG-3') at the STIM1 promoter. Using PFPK as a positive control for ChIP analysis, The ChIP-PCR primers of PFKP (forward: 5'- CTA GAG CCC CCA ACC AGA GT-3'; reverse: 5'- GTG TGG GCA GGA GCA TCT AC -3') were designed according to the previously published study [66]. Each immunoprecipitated DNA sample was amplified using PCR and ChIP-PCR products were detected by agarose gel electrophoresis.
Electrophoretic mobility shift assay (EMSA)
EMSA was performed using the LightShift® Chemiluminescent EMSA Kit (Thermo Scientific, USA) according to the manufacturer's instructions. Biotin-labeled probe containing the E-box region acquired from the promoter of the STIM1 gene (-435 ~ -383) was synthesized by Sangon Biotech (Shanghai, China). DNA binding reactions were performed in 20 μL system containing 4.5 μL protein product was mixed with 1 μL (1 pmol) of the labeled probe, 2 µL 10×binding buffer, 1 µL 50% Glycerol, 100 mM MgCl2, 1 µg Poly (dI • dC), 100 mM MgCl2 and 200 mM EDTA. Reaction products were separated by electrophoresis in 6% polyacrylamide gels containing 0.5% ×TBE. Thereafter, the protein-DNA complexes were transfered onto a positively charged nylon membrane (Millipore, USA) and detected by chemiluminescence. Additional unlabeled oligonucleotides were used as competitor at 100-fold molar excess.
STIM1 promoter luciferase assay
To analyze the STIM1 promoter activity, the promoter region (-1005 ~ +1 from the transcription starting site) was synthesized by GenScript co., LTD (Nanjing, China) and subcloned into pGL3-basic vector (Promega, Madison, WI, USA), and E-box sequence 5'-CAGGTG was mutated to 5'-AAGGTA. To examine the STIM1 promoter activity, the mock- and Snail1 OE-cells were transfected with 1 μg of reporter vector and 20 ng of pSV-Renilla expression vector. Luciferase and Renilla activities were measured using the dual-luciferase reporter system kit (Promega), and the luciferase activity was normalized with renilla activity. The results were expressed as the averages of the ratios of the reporter activities from triplicate experiments.
Co-immunoprecipitation for ubiquitin assay
Mock- and STIM1 OE-SMMC7721 cells had been grown on 10-cm dishes, and were treated with 10 μM MG132 for an additional 4 h before harvested in lysis buffer with PMSF. The supernatants collected from centrifugation were pre-clarified by the protein A/G PLUS-agarose (Santa Cruz Biotechnology, Dallas, TX) overnight at 4 °C, followed by immunoprecipitation with antibody against Snail1 (CST , 3879) for 6 h at 4 °C, then washed five times with the cold lysis buffer containing PMSF, mixed with adequate amount of 1×SDS buffer and heated denaturation. Followed by immunoblotting analysis for ubiquitin and Snail1.
ATP and AMP assay
ATP concentrations were tested with enhanced ATP assay kit obtained from Beyotime according to the manusfactuer's protocol. Cells were lysed with ATP lysis-buffer and centrifuged at 1.5×10⁴ g for 10 min at 4 °C. The supernatants were collected and stored on ice. Before ATP test, 100 µL of ATP working solution was added to 1.5 mL tube and incubated for 5 min at room temperature. Next the supernatant were transferred to 100 µL of ATP working solution, mixed quickly, and the amount of luminescence emitted was immediately measured with Varioskan Flash (Thermo Fisher). The luminescence data were normalized against those sample protein amounts. AMP concentrations were tested with AMP-Glo assay kit obtained from Promega (USA) according to the manusfactuer's protocol. Upon completion of the enzyme reaction, the first step, requiring addition of AMP-Glo Reagent I, depleted the remaining ATP (for ATP requiring enzyme reactions, e.g.) and converted the AMP generated during the enzyme reaction to ADP. This step was completed in a 60 min incubation. As several AMP generating enzymatic reactions are dependent on ATP or cAMP as substrate and generate pyrophosphate (PPi) as a product in addition to AMP, which is a potent luciferase inhibitor. In the second step, AMP Detection Solution was added, which was concomitantly detected by a luciferase/luciferin system with Varioskan Flash (Thermo Fisher Scientific).
Anoikis assay and caspase 3 activity determination
Poly-2-hydroxyethyl methacrylate (poly-HEMA, Sigma-Aldrich) was prepared by dissolving it in 95% ethanol (v/v) to a concentration of 12 mg/mL and subsequently added to cell culture wells at a density of 5 mg/cm2. Cells were cultured for 24 h using poly (HEMA)-treated (suspended) dishes. Then, anoikis rate of cells was determined by the FITC Annexin V/7-AAD Apoptosis Kit (BD Biosciences, San Jose, CA, USA) and analyzed by BD FACS Calibur system, and data were analyzed with FlowJo software (San Carlos, CA, USA). Caspase 3 activity were tested by Caspase 3 Activity Assay Kit obtained from Beyotime according to the manusfactuer's protocol. Cell lysates were prepared by incubating 2×10⁶ cells/mL in extraction buffer for 30 min on ice. Lysates were centrifuged at 13,000×g for 15 min, and the supernatants were collected. The protein concentrations were determined by BCA protein assay (Beyotime). Cellular extracts (40 μg) were then incubated in a 96-well microtitre plate with 20 ng Ac-DEVD-pNA for 2 h at 37 °C. Caspase 3 activity was measured by cleavage of the Ac-DEVD-pNA or Ac-LEVD-pNA substrate to pNA, the absorbance of which was measured by Varioskan Flash (Thermo Fisher Scientific) at 405 nm. Relative caspase activity was calculated as a ratio of emission of treated cells to untreated cells.
Cell proliferation and viability
Cell proliferation and viability at the indicated incubation time were determined by Cell Counting Kit-8 (CCK-8) assay (Dojindo, Japan) according to the manusfactuer's protocol, the data were quantified with Varioskan Flash (Thermo Fisher Scientific) at 450 nm.
In vitro migration and invasion assays
For wound-healing migration assays, a single scratch wound was created by dragging a 10 μL plastic pipette tip across the cell surface. The area of a defined region within the scratch was measured using ImageJ software. The extent to which the wound had closed over 24 h was calculated and expressed as a percentage of the difference between time 0 and 24 h. For invasion assays, Transwells (BD biosciences, CA) with 8-μm pore size filters covered with matrigel (BD biosciences) were inserted into 24-well plates. The cells were serum-starved overnight and then added in the upper chamber (3×10⁴ cells per-insert) and the culture medium supplemented with 20% FBS was used as a chemoattractant in the lower chamber. After incubation for 24 h, non-invading cells that remained on the upper surface of the filter were removed, and the cells that had passed through the filter and attached to the bottom of the membrane were fixed in methanol and stained with 0.2% crystal violet. Numbers of the invasive cells in seven randomly selected fields from triplicate chambers were counted in each experiment under a phase-contrast microscope.
Statistical analysis
Overall survival of HCC patients was calculated using the Kaplan-Meier method, data were available online (http://www.oncolnc.org/) [22], and the differences in survival curves were analyzed using the log-rank test. Statistical analysis was performed using the statistical program Origin 9.1 (OriginLab, Northampton, MA, USA). All data were presented as mean ± SEM and were analyzed by Student's t test or one-way ANOVA. P values < 0.05 were considered statistically significant. Heatmaps were presented for up- and down-regulated genes using the Heatmap illustrator (version 1.0.3.7).
Data and materials availability
The accession numbers for the microarray published here are GEO: GSE148129 and GSE135901.
Abbreviations
2-DG: 2-Deoxy-D-glucose; AA/Rot: Antimycin A/Rotenone; ACC1: acetyl-coA carboxylase 1; ACLY: ATP citrate lyase; AMP: adenosine monophosphate; AMPK: adenosine monophosphate-activated protein kinase; AP-1: AP-1 transcription factor; ATP: adenosine triphosphate; BSA: bovine serum albumin; Ca2+: calcium; CaMKII: Calcium/Calmodulin-dependent protein kinase-II; ChIP: chromatin immunoprecipitation; CHX: cycloheximide; CPT1: palmitoyl-transferase 1; CREB: cyclic adenosine monophosphate response element-binding protein; DMSO: dimethyl sulfoxide; ECAR: glycolysis-driven extracellular acidification rate; EMT: epithelial-mesenchymal transition; EMSA: electrophoretic mobility shift assay; ER: endoplasmic reticulum; ETO: etomoxir; FACS: flow cytometry analysis; FAO: fatty acid oxidation; FAS: fatty acid synthesis; FASN: fatty acid synthase; Fccp: carbonyl cyanide 4-(trifluoromethoxy) phenylhydrazone; GEO: Gene Expression Omnibus; GLUT: glucose transporter; GSK-3β: glycogen synthase kinase 3 beta; HCC: hepatocellular carcinoma; H&E: hematoxylin and eosin; HIF-1α: hypoxia-inducible factor-1 alpha; HK: hexokinases; HM: high metastatic; IHC: immunohistochemistry; IOD: integrated optical density; LCAD: long-chain acyl-CoA dehydrogenases; LDHA: lactate dehydrogenase A; LKB1: liver kinase B1; LM: low metastatic; KO: knockout; NFAT: nuclear factor of activated T cells; OE: over-expression; OCR: oxygen consumption rate; Oligo: oligomycin; OXPHOS: oxidative phosphorylation; O2: oxygen; PDK1: pyruvate dehydrogenase kinase 1; PDH: pyruvate dehydrogenase; PI: propidium iodide; PPAR: peroxisome proliferator activated receptor; PVTT: portal vein tumor thrombus; RT-qPCR: real-time quantitative polymerase chain reaction; siRNA: short interfering RNA; SOCE: store-operated Ca2+ entry; STIM1: stromal-interaction molecule 1; sgRNA: single guided RNA; TGF-β1: transforming growth factor-beta 1; WB: western blotting; WT: wild type; ΔCTD: deletion of the C-terminal domain.
Supplementary Material
Supplementary figures and tables.
Acknowledgements
This work was supported by the National Nature Science Foundation of China (No. 81802972 and 81920108027), Chongqing Youth Expert Studio, Science Foundation for Post Doctorate Research of China (2018M643860), and Project funded by Chongqing Special Postdoctoral Science Foundation (No. XmT2018008).
Author Contributions
H.Z., G.Y., Y.Z. and H.S. performed cells and animal experiments; L.Z. provided patient sample slides with clinical information and analyzed the data; R.X., L.J., J.Z. and D.L. performed H&E and IHC experiments; H.Z, L.W., and Y.X. performed bioinformatics analysis; X.Z., J.W., J.Z. and Y.C. assisted with luciferase assay, ChIP, WB and RT-qPCR experiments; Y.L. and H.Z. designed this project, analyzed and interpreted the data and wrote the manuscript; Y.L. supervised this project. All authors reviewed the manuscript, provided feedback, and approved the manuscript in its final form.
Competing Interests
The authors have declared that no competing interest exists.
References
1. Bray F, Ferlay J, Soerjomataram I, Siegel RL, Torre LA, Jemal A. Global cancer statistics 2018: GLOBOCAN estimates of incidence and mortality worldwide for 36 cancers in 185 countries. CA Cancer J Clin. 2018;68:394-424
2. Shibue T, Weinberg RA. EMT, CSCs, and drug resistance: the mechanistic link and clinical implications. Nat Rev Clin Oncol. 2017;14:611-29
3. Sciacovelli M, Frezza C. Metabolic reprogramming and epithelial-to-mesenchymal transition in cancer. FEBS J. 2017;284:3132-44
4. Cha YH, Yook JI, Kim HS, Kim NH. Catabolic metabolism during cancer EMT. Arch Pharm Res. 2015;38:313-20
5. Herst PM, Grasso C, Berridge MV. Metabolic reprogramming of mitochondrial respiration in metastatic cancer. Cancer Metastasis Rev. 2018;37:643-53
6. Monteith GR, McAndrew D, Faddy HM, Roberts-Thomson SJ. Calcium and cancer: targeting Ca2+ transport. Nat Rev Cancer. 2007;7:519-30
7. Lewis RS. The molecular choreography of a store-operated calcium channel. Nature. 2007;446:284-7
8. Roos J, DiGregorio PJ, Yeromin AV, Ohlsen K, Lioudyno M, Zhang S. et al. STIM1, an essential and conserved component of store-operated Ca2+ channel function. J Cell Biol. 2005;169:435-45
9. Li Y, Guo B, Xie Q, Ye D, Zhang D, Zhu Y. et al. STIM1 mediates hypoxia-driven hepatocarcinogenesis via interaction with HIF-1. Cell Rep. 2015;12:388-95
10. Vaeth M, Maus M, Klein-Hessling S, Freinkman E, Yang J, Eckstein M. et al. Store-operated Ca2+ entry controls clonal expansion of T Cells through metabolic reprogramming. Immunity. 2017;47:664-79 e6
11. Maus M, Cuk M, Patel B, Lian J, Ouimet M, Kaufmann U. et al. Store-operated Ca2+ entry controls induction of lipolysis and the transcriptional reprogramming to lipid metabolism. Cell Metab. 2017;25:698-712
12. Collins HE, Pat BM, Zou L, Litovsky SH, Wende AR, Young ME. et al. Novel role of the ER/SR Ca2+ sensor STIM1 in the regulation of cardiac metabolism. Am J Physiol Heart Circ Physiol. 2019;316:H1014-H26
13. Yang N, Tang Y, Wang F, Zhang H, Xu D, Shen Y. et al. Blockade of store-operated Ca2+ entry inhibits hepatocarcinoma cell migration and invasion by regulating focal adhesion turnover. Cancer Lett. 2013;330:163-9
14. Yang S, Zhang JJ, Huang XY. Orai1 and STIM1 are critical for breast tumor cell migration and metastasis. Cancer Cell. 2009;15:124-34
15. Tsai FC, Seki A, Yang HW, Hayer A, Carrasco S, Malmersjo S. et al. A polarized Ca2+, diacylglycerol and STIM1 signalling system regulates directed cell migration. Nat Cell Biol. 2014;16:133-44
16. Sun J, Lu F, He H, Shen J, Messina J, Mathew R. et al. STIM1- and Orai1-mediated Ca2+ oscillation orchestrates invadopodium formation and melanoma invasion. J Cell Biol. 2014;207:535-48
17. Wang Y, Wang H, Pan T, Li L, Li J, Yang H. STIM1 silencing inhibits the migration and invasion of A549 cells. Mol Med Rep. 2017;16:3283-9
18. Chan SL, Mo FK, Johnson PJ, Liem GS, Chan TC, Poon MC. et al. Prospective validation of the Chinese University Prognostic Index and comparison with other staging systems for hepatocellular carcinoma in an Asian population. J Gastroenterol Hepatol. 2011;26:340-7
19. Llovet JM, Bustamante J, Castells A, Vilana R, Ayuso Mdel C, Sala M. et al. Natural history of untreated nonsurgical hepatocellular carcinoma: rationale for the design and evaluation of therapeutic trials. Hepatology. 1999;29:62-7
20. Huang Q, Gumireddy K, Schrier M, le Sage C, Nagel R, Nair S. et al. The microRNAs miR-373 and miR-520c promote tumour invasion and metastasis. Nat Cell Biol. 2008;10:202-10
21. Tie J, Pan Y, Zhao L, Wu K, Liu J, Sun S. et al. MiR-218 inhibits invasion and metastasis of gastric cancer by targeting the Robo1 receptor. PLoS Genet. 2010;6:e1000879
22. Anaya J. OncoLnc: linking TCGA survival data to mRNAs, miRNAs, and lncRNAs. PeerJ Comput Sci. 2016;2:e67
23. Guadamillas MC, Cerezo A, Del Pozo MA. Overcoming anoikis-pathways to anchorage-independent growth in cancer. J Cell Sci. 2011;124:3189-97
24. Lee H, Jang Y, Park S, Jang H, Park EJ, Kim HJ. et al. Development and evaluation of a CEACAM6-targeting theranostic nanomedicine for photoacoustic-based diagnosis and chemotherapy of metastatic cancer. Theranostics. 2018;8:4247-61
25. Tan Y, Lin K, Zhao Y, Wu Q, Chen D, Wang J. et al. Adipocytes fuel gastric cancer omental metastasis via PITPNC1-mediated fatty acid metabolic reprogramming. Theranostics. 2018;8:5452-68
26. Zhou BP, Deng J, Xia W, Xu J, Li YM, Gunduz M. et al. Dual regulation of Snail by GSK-3beta-mediated phosphorylation in control of epithelial-mesenchymal transition. Nat Cell Biol. 2004;6:931-40
27. Baulida J, Garcia de Herreros A. Snail1-driven plasticity of epithelial and mesenchymal cells sustains cancer malignancy. Biochim Biophys Acta. 2015;1856:55-61
28. Li H, Li J, Zhang G, Da Q, Chen L, Yu S. et al. HMGB1-induced p62 overexpression promotes Snail-mediated epithelial-mesenchymal transition in glioblastoma cells via the degradation of GSK-3beta. Theranostics. 2019;9:1909-22
29. Jing Z, Sui X, Yao J, Xie J, Jiang L, Zhou Y. et al. SKF-96365 activates cytoprotective autophagy to delay apoptosis in colorectal cancer cells through inhibition of the calcium/CaMKIIgamma/AKT-mediated pathway. Cancer Lett. 2016;372:226-38
30. Nieto MA. The snail superfamily of zinc-finger transcription factors. Nat Rev Mol Cell Biol. 2002;3:155-66
31. Baulida J, Diaz VM, Herreros AG. Snail1: a transcriptional factor controlled at multiple levels. J Clin Med. 2019 8
32. Pavlova NN, Thompson CB. The emerging hallmarks of cancer metabolism. Cell Metab. 2016;23:27-47
33. Lehuede C, Dupuy F, Rabinovitch R, Jones RG, Siegel PM. Metabolic plasticity as a determinant of tumor growth and metastasis. Cancer Res. 2016;76:5201-8
34. Porporato PE, Filigheddu N, Pedro JMB, Kroemer G, Galluzzi L. Mitochondrial metabolism and cancer. Cell Res. 2018;28:265-80
35. DeBerardinis RJ, Chandel NS. Fundamentals of cancer metabolism. Sci Adv. 2016;2:e1600200
36. Huang Li T, Li X Zhang L, Sun L He X. et al. HIF-1-mediated suppression of acyl-CoA dehydrogenases and fatty acid oxidation is critical for cancer progression. Cell Rep. 2014;8:1930-42
37. Bristow RG, Hill RP. Hypoxia and metabolism. Hypoxia, DNA repair and genetic instability. Nat Rev Cancer. 2008;8:180-92
38. Kim JW, Gao P, Dang CV. Effects of hypoxia on tumor metabolism. Cancer Metastasis Rev. 2007;26:291-8
39. Denko NC. Hypoxia, HIF1 and glucose metabolism in the solid tumour. Nat Rev Cancer. 2008;8:705-13
40. Pouyssegur J, Dayan F, Mazure NM. Hypoxia signalling in cancer and approaches to enforce tumour regression. Nature. 2006;441:437-43
41. Jiang S, Li T, Ji T, Yi W, Yang Z, Wang S. et al. AMPK: potential therapeutic target for ischemic stroke. Theranostics. 2018;8:4535-51
42. Lin SC, Hardie DG. AMPK: sensing glucose as well as cellular energy status. Cell Metab. 2018;27:299-313
43. Zong Y, Zhang CS, Li M, Wang W, Wang Z, Hawley SA. et al. Hierarchical activation of compartmentalized pools of AMPK depends on severity of nutrient or energy stress. Cell Res. 2019;29:460-73
44. LeBleu VS, O'Connell JT, Gonzalez Herrera KN, Wikman H, Pantel K, Haigis MC. et al. PGC-1alpha mediates mitochondrial biogenesis and oxidative phosphorylation in cancer cells to promote metastasis. Nat Cell Biol. 2014;16:992-1003 1-15
45. Zhivotovsky B, Orrenius S. Calcium and cell death mechanisms: a perspective from the cell death community. Cell Calcium. 2011;50:211-21
46. Wu WS, You RI, Cheng CC, Lee MC, Lin TY, Hu CT. Snail collaborates with EGR-1 and SP-1 to directly activate transcription of MMP 9 and ZEB1. Sci Rep. 2017;7:17753
47. Rembold M, Ciglar L, Yanez-Cuna JO, Zinzen RP, Girardot C, Jain A. et al. A conserved role for Snail as a potentiator of active transcription. Genes Dev. 2014;28:167-81
48. Batlle E, Sancho E, Franci C, Dominguez D, Monfar M, Baulida J. et al. The transcription factor snail is a repressor of E-cadherin gene expression in epithelial tumour cells. Nat Cell Biol. 2000;2:84-9
49. Rimessi A, Pedriali G, Vezzani B, Tarocco A, Marchi S, Wieckowski MR. et al. Interorganellar calcium signaling in the regulation of cell metabolism: A cancer perspective. Semin Cell Dev Biol. 2020;98:167-80
50. Kouba S, Ouldamer L, Garcia C, Fontaine D, Chantome A, Vandier C. et al. Lipid metabolism and calcium signaling in epithelial ovarian cancer. Cell Calcium. 2019;81:38-50
51. Glass-Marmor L, Penso J, Beitner R. Ca2+-induced changes in energy metabolism and viability of melanoma cells. Br J Cancer. 1999;81:219-24
52. Rardin MJ, Wiley SE, Naviaux RK, Murphy AN, Dixon JE. Monitoring phosphorylation of the pyruvate dehydrogenase complex. Anal Biochem. 2009;389:157-64
53. McCormack JG, Halestrap AP, Denton RM. Role of calcium ions in regulation of mammalian intramitochondrial metabolism. Physiol Rev. 1990;70:391-425
54. McCormack JG, Denton RM. The effects of calcium ions and adenine nucleotides on the activity of pig heart 2-oxoglutarate dehydrogenase complex. Biochem J. 1979;180:533-44
55. Chakraborty PK, Mustafi SB, Xiong X, Dwivedi SKD, Nesin V, Saha S. et al. MICU1 drives glycolysis and chemoresistance in ovarian cancer. Nat Commun. 2017;8:14634
56. Shanmughapriya S, Rajan S, Hoffman NE, Zhang X, Guo S, Kolesar JE. et al. Ca2+ signals regulate mitochondrial metabolism by stimulating CREB-mediated expression of the mitochondrial Ca2+ uniporter gene MCU. Sci Signal. 2015;8:ra23
57. Budhu A, Roessler S, Zhao X, Yu Z, Forgues M, Ji J. et al. Integrated metabolite and gene expression profiles identify lipid biomarkers associated with progression of hepatocellular carcinoma and patient outcomes. Gastroenterology. 2013;144:1066-75 e1
58. Zheng YL, Li L, Jia YX, Zhang BZ, Li JC, Zhu YH. et al. LINC01554-mediated glucose metabolism reprogramming suppresses tumorigenicity in hepatocellular carcinoma via downregulating PKM2 expression and inhibiting Akt/mTOR signaling pathway. Theranostics. 2019;9:796-810
59. Calvisi DF, Wang C, Ho C, Ladu S, Lee SA, Mattu S. et al. Increased lipogenesis, induced by AKT-mTORC1-RPS6 signaling, promotes development of human hepatocellular carcinoma. Gastroenterology. 2011;140:1071-83
60. Huang Q, Tan Y, Yin P, Ye G, Gao P, Lu X. et al. Metabolic characterization of hepatocellular carcinoma using nontargeted tissue metabolomics. Cancer Res. 2013;73:4992-5002
61. Li J, Huang Q, Long X, Zhang J, Huang X, Aa J. et al. CD147 reprograms fatty acid metabolism in hepatocellular carcinoma cells through Akt/mTOR/SREBP1c and P38/PPARalpha pathways. J Hepatol. 2015;63:1378-89
62. Caino MC, Chae YC, Vaira V, Ferrero S, Nosotti M, Martin NM. et al. Metabolic stress regulates cytoskeletal dynamics and metastasis of cancer cells. J Clin Invest. 2013;123:2907-20
63. Wang MD, Wu H, Fu GB, Zhang HL, Zhou X, Tang L. et al. Acetyl-coenzyme A carboxylase alpha promotion of glucose-mediated fatty acid synthesis enhances survival of hepatocellular carcinoma in mice and patients. Hepatology. 2016;63:1272-86
64. Wang YN, Zeng ZL, Lu J, Wang Y, Liu ZX, He MM. et al. CPT1A-mediated fatty acid oxidation promotes colorectal cancer cell metastasis by inhibiting anoikis. Oncogene. 2018;37:6025-40
65. Ma G, Jing C, Li L, Huang F, Ding F, Wang B. et al. MicroRNA-92b represses invasion-metastasis cascade of esophageal squamous cell carcinoma. Oncotarget. 2016;7:20209-22
66. Kim NH, Cha YH, Lee J, Lee SH, Yang JH, Yun JS. et al. Snail reprograms glucose metabolism by repressing phosphofructokinase PFKP allowing cancer cell survival under metabolic stress. Nat Commun. 2017;8:14374
Author contact
![]() Corresponding author: yliedu.cn (Y.L.)
Corresponding author: yliedu.cn (Y.L.)