Impact Factor
 Global reach, higher impact
Theranostics 2020; 10(7):3254-3262. doi:10.7150/thno.39838 This issue Cite
Research Paper
Comparative prognostic implication of treatment response assessments in mCRPC: PERCIST 1.0, RECIST 1.1, and PSA response criteria
Erik M. Velez1, Bhushan Desai1, Lingyun Ji2, David I. Quinn3, Patrick M. Colletti1, Hossein Jadvar1 ![]()
1. Division of Nuclear Medicine, Department of Radiology, Keck School of Medicine of USC, University of Southern California, Los Angeles, California
2. Department of Preventive Medicine, Keck School of Medicine of USC, University of Southern California, Los Angeles, California
3. Division of Oncology, Department of Medicine, Kenneth J. Norris Jr. Comprehensive Cancer Center, Keck School of Medicine of USC, University of Southern California, Los Angeles, California
Received 2019-8-31; Accepted 2020-1-15; Published 2020-2-10
Abstract

Accurate appraisal of treatment response in metastatic castrate-resistant prostate cancer (mCRPC) is challenging in view of remarkable tumor heterogeneity and the available choices among many established and novel therapeutic approaches. The purpose of this single-center prospective study was to evaluate the comparative prognostic utility of PERCIST 1.0 in predicting overall survival (OS) in patients with mCRPC compared to RECIST 1.1 and prostate-specific antigen (PSA)-based treatment response assessments.
Methods: Patients with mCRPC were prospectively enrolled if they were beginning systemic medical therapy or transitioning to new systemic therapy after not responding to a prior treatment. All patients underwent a baseline 18F-fluorodeoxyglucose (FDG) positron emission tomography/ computed tomography (PET/CT) prior to the initiation of treatment and again 4 months after the start of therapy. Patients' responses to treatment at 4 months compared to baseline were evaluated with RECIST 1.1, PERCIST 1.0 and PSA response criteria. The associations between patients' response categories and OS were evaluated. OS was defined as the duration in time between the date of baseline PET/CT to death from any cause. Patients with different response status were compared with logrank tests. Survival probabilities were calculated using the Kaplan-Meier method.
Results: Patients with progressive disease by PSA response criteria at 4 months demonstrated significantly shorter OS (24-month OS probability: 18% ± 11%) compared to patients with stable disease, SD, (44% ± 19%, p=0.03) and complete response, CR, or partial response, PR, (53% ± 11%, p=0.03). RECIST 1.1 response criteria demonstrated a similar trend in OS, however no statistically significant differences were noted between patients with PD (25% ± 15%) compared to SD/non-CR, non-PD (54% ± 13%) and CR/PR (54% ± 14%) (p=0.13). PERCIST 1.0 criteria demonstrated significant differences in OS between responders, CMR/PMR (56% ± 12%), compared to SMD (38% ± 17%, p=0.03) and PMD (21% ± 10%, p=0.01). Patients with progressive disease by both PERICST 1.0 and PSA response criteria demonstrated significantly worse OS (24-month OS: 0%, 12-month OS: 31% ± 14%) compared to patients with progressive disease by either response criteria.
Conclusion: PERCIST 1.0 may provide significant prognostic information for patients with mCRPC undergoing systemic chemotherapy, particularly when incorporated with PSA treatment response criteria.
Keywords: 18F-FDG, PET/CT, Prostate, Cancer, Metastatic, Castrate-resistant
Introduction
Prostate cancer is the second leading cause of cancer-related death in men, affecting approximately 1 in 6 men. With the utilization of prostate-specific antigen (PSA) screening, the majority of patients diagnosed with prostate cancer present with locoregional disease [1]. However, approximately 6% of patients present with metastatic disease on initial diagnosis and many patients with localized disease will ultimately develop recurrent and metastatic disease [2]. The majority of patients with metastatic prostate cancer will eventually develop castrate-resistance, with progressive disease despite castrate serum androgen levels [3]. Metastatic castrate-resistant prostate cancer (mCRPC) remains incurable and is associated with significantly shorter overall survival [4].
The accurate assessment of treatment response in patients with mCRPC is crucial [5]. Early identification of non-responders ensure patients receive optimal management and avoid costly ineffective therapies, many of which have significant side effects [6]. However, conventional methods for assessing treatment response, such as the Response Evaluation Criteria in Solid Tumors (RECIST) have limited value in mCRPC. The evaluation of osseous metastases is limited on conventional CT and the confounding flare phenomenon following treatment limits the utility of conventional bone scintigraphy [7].
Positron emission tomography (PET) has been gaining increasing traction in the imaging evaluation of prostate cancer. Several PET radiotracers, including 18F NaF, 18F- or 11C-choline, 18F-fluciclovine and prostate specific membrane antigen (PMSA)-based agents, have shown promising results in various phases of the disease [8-11]. 18F-fluorodeoxyglucose (FDG), the most commonly utilized PET radiotracer for oncologic imaging, has shown mixed results for imaging patients with prostate cancer, with several studies showing low tumoral FDG uptake [12-14]. However, many of these studies included cohorts of patients in the early stages of prostate cancer and may not be applicable to patients with more advanced metastatic disease. Indeed, several recent studies have demonstrated the utility of FDG in assessing patients with metastatic prostate cancer [15-18]. Additionally, FDG PET has the inherent advantage of widespread availability and established use in treatment response criteria with the PET Response Criteria in Solid Tumors (PERCIST) [19].
The purpose of this single-center prospective cohort study was to evaluate the comparative prognostic utility of PERCIST 1.0 assessment using FDG PET/CT compared to conventional anatomy-based RECIST 1.1 and non-imaging PSA-based treatment response assessments in patients with mCRPC.
Methods
Patient Selection
Institutional Review Board and Radiation Safety Committee approvals were obtained for this prospective cohort study. All patients signed a written informed consent and the protocol was compliant with the Health Insurance Portability and Accountability Act. The investigation was performed under clinical trial registration number NCT00282906, “FDG Positron Emission Tomography and Computed Tomography (PET-CT) in Metastatic Prostate Cancer”.
Patients were prospectively recruited from 2005 to 2011. Patients with mCRPC were eligible for enrollment if they were beginning systemic medical therapy or transitioning to new systemic therapy after not responding to a prior treatment. Medical therapy, and the determination of castrate-resistant status, were made at the discretion of the treating physicians prior to enrollment into the study.
All patients underwent a baseline FDG PET/CT prior to the initiation of treatment and had a 4-month follow-up PET/CT after the start of therapy. Exclusion criteria included a history of malignancy other than prostate cancer, poorly controlled diabetes mellitus, active inflammatory conditions, active infections, and patients with recent or complicated nonhealing fractures or recent arthroplasty to diminish potential false positives. Patients with changes in baseline therapy greater than one week prior to the follow-up 4th month PET/CT scan were also excluded.
PET/CT Imaging
All patients underwent PET/CT imaging (Biograph Duo LSO; Siemens) 1 hour after intravenous administration of 370-550 MBq (10-15 mCi) of FDG, as previously described [16, 17]. Customary quality control procedures were performed before all PET/CT scans (68Ge normalization daily and Society of Nuclear Medicine and Molecular Imaging PET/CT chest phantom every 3 months). All patients fasted for 4-6 h before 18F-FDG PET/CT imaging and water intake was encouraged before and after each scan. Blood glucose levels were obtained for all patients before intravenous administration of FDG and in all cases was less than 200 mg/dL.
Helical CT (pitch, 1.0; 90-130 mAs; 130 kVp) was performed first for each scan. Only oral contrast material was used. PET was then performed for 4 min per bed position at a sufficient number of bed positions to cover the top of the head to the feet. Raw CT data were reconstructed into 5 mm thick transverse images, and coronal and sagittal reformats were generated. CT-based attenuation-corrected PET images were reconstructed and viewed on a color high-resolution monitor. PET and CT images could be viewed on a continuous fusion scale from PET-only to CT-only images using E-soft image fusion software (Siemens).
PET/CT images were interpreted in consensus by two fellowship-trained board-certified nuclear radiologists with more than 20 years of experience in interpreting PET/CT studies. Lesions with visually discernible uptake and associated distinct correlation on CT, that were not physiologic or benign entities, were selected for further evaluation, with up to an arbitrary maximum of 30 lesions per scan for the various metastatic sites (e.g. bone, lymph node, soft tissue). The mean hepatic background standardized uptake value (SUV) was obtained for each patient by placing a 3-cm diameter ROI over an area of normal liver [20]. The maximum SUV (SUVmax) of each lesion was than determined using 3-dimensional regions of interest (ROI) with vendor-provided software (Siemens) and corrected for lean body mass (SUL) [21]. Lesions with a SULmax less than the average liver SUL were assigned a value of 0.
Statistical Methods
Patients' response status at 4th month compared to baseline was evaluated with three response criteria: RECIST 1.1, PERCIST 1.0 and PSA response criteria [2, 19, 22] (Table 1). For RECIST 1.1, up to 5 target lesions, with a maximum of 2 lesions per organ were identified with a short axis diameter of ≥15 mm for lymph nodes and a long axis diameter of ≥10mm for all other lesions as per RECIST 1.1 criteria [23]. For patients without target lesions by RECIST 1.1, patients were categorized as CR if there was disappearance of all non-target lesions, non-CR/non-PD if there was persistence of one or more non-target lesions, and categorized as PD if there was any new lesion on follow-up examination. When available, bone scan data was used in conjunction with CT results for the detection of new osseous metastases and to identify resolution of previously active disease in sclerotic bone lesions. For PERCIST 1.0, up to 5 target lesions, lesions with a SULmax of at least 1.5 times greater than the liver SUL mean, with a maximum of 2 lesions/organ were identified. Non-target lesions with an SULmax between the liver SUL mean and 1.5 times the liver SUL mean were also evaluated. The PSA response criteria were based on those used in the Prostate Cancer Clinical Trials Working Group 3 (PCWG3) [24].
Treatment Response Criteria
| PSA-based response criteria | RECIST 1.1 | PERCIST 1.0 | |
|---|---|---|---|
| CR/CMR | PSA decline to undetectable (<0.2 ng/mL) | Disappearance of all target and non-target lesions | Disappearance of all FDG avid lesions |
| PR/PMR | ≥50% PSA decline and ≥2 ng/mL decline | ≥30% decrease in sum of target lesions | ≥30% decrease in SUL peak + decline by ≥0.8 SUL |
| SD/SMD | Neither PR or PD | Neither PR or PD | Neither PR or PD |
| PD/PMD | ≥25% PSA increase and ≥2 ng/mL increase | ≥20% increase in sum of target lesions + absolute increase of at least 5 mm or new lesions | ≥30% increase in SUL peak + >0.8 SUL increase or new lesions |
1 CR=complete response, PR=partial response, SD=stable disease, PD=progressive disease. 1 CMR=complete metabolic response, PMR=partial metabolic response, SMD=stable metabolic disease, PMD=progressive metabolic disease. 2 SUL= Standard uptake value, corrected using lean body mass
The associations between patients' response status and OS were evaluated. OS was defined as the duration in time between the dates of baseline scan and death. Patients who were alive at their last follow-up were censored at that time. Patients with different response status (CR/PR, SD, and PD) were compared with logrank tests. Due to a low number of patients with complete response and the primary objective of assessing responders (CR/PR) from non-responders, patients with complete and partial responses were grouped together for analysis. For RECIST 1.1 analysis, patients without target lesions categorized as non-CR/non-PD were grouped with the SD patients. Survival probabilities were calculated using the Kaplan-Meier method. Statistical analyses were performed using STATA software (version 11.0; StataCorp LP College Station, TX). All reported p-values were two-sided and a p value ≤0.05 was considered statistically significant.
Results
A total of 87 patients with mCRPC were initially enrolled in this study, of which 53 received a 4th month PET/CT. Of this cohort, 6 patients changed chemotherapy regimens more than a week before the 4th month scan, leaving 47 patients eligible for analyses, two of which had a change of chemotherapy within the week of the PET/CT scan. Table 2 summarizes patient and disease characteristics of the patient cohort. Of the 47 patients with mCRPC, 30 patients (63.8%) were chemotherapy naïve and 17 patients (36.2%) had been transitioned to a new chemotherapy regimen. The median OS of patients was 18.3 months (95% confidence interval [CI], 10.1-26.4 months), with the 24-month survival probability of 39% ± 7% (Figure 1).
Patient and Disease Characteristics
| Variables | Metastatic castrate-resistant prostate cancer (N=47) | |
|---|---|---|
| n or median | % | |
| Age at PET/CT Scan (years) | ||
| Median (Min, 25%, 75%, Max) | 69.(50, 60, 74, 89) | |
| 50-69 | 24 | 51.1 |
| 70-90 | 23 | 48.9 |
| Race/Ethnicity | ||
| Hispanic | 10 | 21.3 |
| White | 32 | 68.1 |
| Other | 5 | 10.6 |
| Years since initial diagnosis (years) | ||
| Median (Min, 25%, 75%, Max) | 7.6 (0.47, 2.8, 11.8, 17.6) | |
| Gleason Score at diagnosis | ||
| Median (Min, 25%, 75%, Max) | 8 (5, 7, 9, 10) | |
| Missing (number of patients) | 5 | |
| Prior Chemotherapy | ||
| No | 30 | 63.8 |
| Yes | 17 | 36.2 |
| PSA (ng/ml) at baseline | ||
| Median (Min, 25%, 75%, Max) | 46.4 (0.09, 16.5, 99.8, 4530) | |
| Alkaline Phosphatase | ||
| Median (Min, 25%, 75%, Max) | 94 (36, 65, 148, 847) | |
| Sites of Disease | ||
| Bone Only | 20 | 42.6 |
| Lymph Nodes Only | 6 | 12.7 |
| Soft Tissue Only | 1 | 2.1 |
| Lymph Nodes and Soft Tissue Only | 3 | 6.4 |
| Bone and Lymph Nodes Only | 11 | 23.4 |
| Bone and Soft Tissue Only | 3 | 6.4 |
| Bone, Lymph Nodes and Soft Tissue | 3 | 6.4 |
Kaplan-Meier plot of overall survival of patients with metastatic castrate resistant prostate cancer. CI- confidence interval, OS- overall survival.
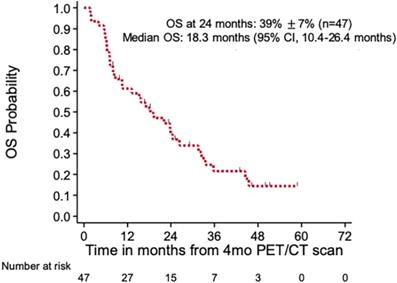
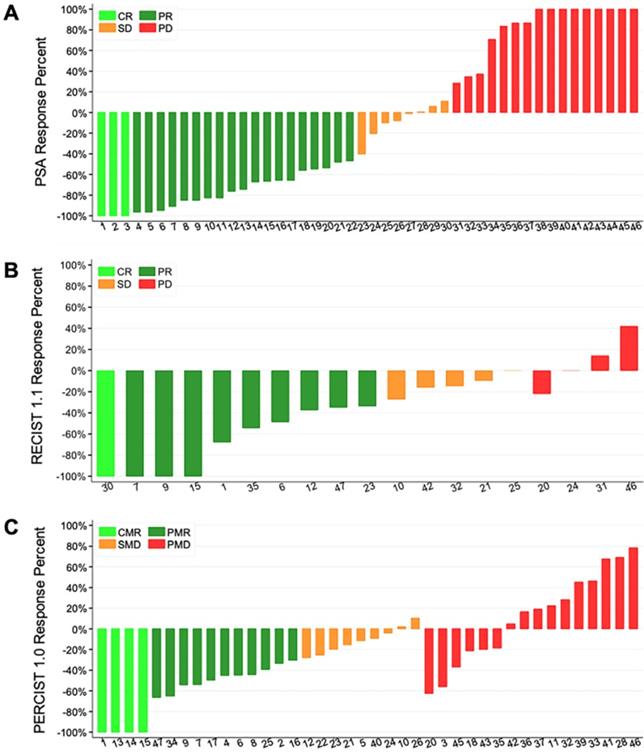
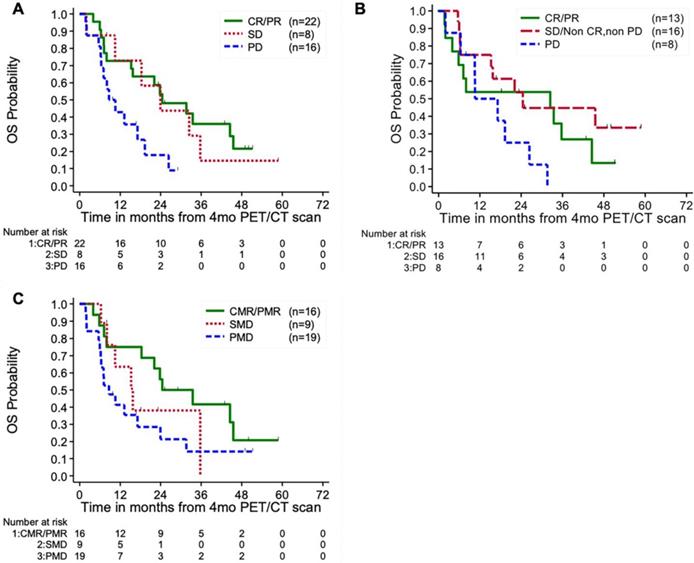
Table 3 and Figure 2 summarizes the results of the PSA, RECIST 1.1, and PERCIST 1.0 response criteria at the 4th month imaging evaluation. Patients with progressive disease by PSA response criteria at 4 months demonstrated significantly worse OS (24-month survival probability: 18% ± 11%) compared to patients with stable disease (44% ± 19%, p=0.03) and complete or partial response (53% ± 11%, p=0.03) (Figure 3a). However, no significant differences were noted between the CR/PR and SD groups for this response criteria (p=0.83). RECIST 1.1 response criteria demonstrated a similar trend in OS, however no statistically significant differences were noted between patients with PD (25% ± 15%) compared to SD/non-CR, non-PD (54% ± 13%) and CR/PR (54% ± 14%) (p=0.13) (Figure 3b). PERCIST 1.0 criteria demonstrated significant differences in OS between responders, CMR/PMR (56% ± 12%), compared to SMD (38% ± 17%, p=0.03) and PMD (21% ± 10%, p=0.01), however no significant differences were noted between the PMD and SMD groups for this response criteria (p=0.79) (Figure 3c). No significant differences in OS were noted between patients with progressive disease by PSA response criteria compared to PERICST response criteria.
PCWG2-PSA, RECIST 1.1, PERCIST 1.0 response evaluation at 4th month follow-up
| Variables | Metastatic castrate-resistant prostate cancer (N=47) | ||
|---|---|---|---|
| n or median | % | ||
| 4th Month Disease Evaluation: PSA | |||
| CR | 3 | 6 | |
| PR | 19 | 40 | |
| SD | 8 | 17 | |
| PD | 16 | 34 | |
| PSA <0.2 at Baseline and 4th month | 1 | 2 | |
| 4th Month Disease Evaluation: RECIST 1.1 1 | |||
| # of Patients WITH Target Lesions at Baseline | 19 | 51 | |
| # of Target Lesions: Median (Min, 25%, 75%, Max) | 2 (1, 1, 3, 5) | ||
| # of Non-Target Lesions: Median (Min, 25%, 75%, Max) | 5 (0, 2, 10, 21) | ||
| Total # of Lesions: Median (Min, 25%, 75%, Max) | 8 (1, 4, 11, 22) | ||
| Overall Response Evaluation | |||
| CR | 1 | ||
| PR | 9 | ||
| SD | 5 | ||
| PD | 4 | ||
| # of Patients WITHOUT Target Lesions | 18 | 49 | |
| # of Non-Target Lesions: Median (Min, 25%, 75%, Max) | 5 (0, 1, 10, 20) | ||
| Response Evaluation (non-Target lesions) | |||
| CR | 3 | ||
| Non-CR/non-PD | 11 | ||
| PD | 4 | ||
| 4th Month Disease Evaluation: PERCIST 1.0 1 | |||
| # of Target Lesions: Median (Min, 25%, 75%, Max) | 3 (0, 1, 5, 5) | ||
| # of Non-Target Lesions: Median (Min, 25%, 75%, Max) | 3 (0, 0, 6, 18) | ||
| Total # of Lesions: Median (Min, 25%, 75%, Max) | 6 (0, 2, 11, 23) | ||
| MAX SUL: Median (Min, 25%, 75%, Max) | 3.6 (0, 2.1, 5.1, 10.6) | ||
| Overall Response Evaluation | |||
| CMR | 4 | 9 | |
| PMR | 11 | 23 | |
| SMD | 10 | 21 | |
| PMD | 19 | 40 | |
| Not Evaluable by PERCIST 1.0 2 | 3 | 6 | |
| Occurrence of New Lesions | 12 | 26 | |
1 For patients with extensive number of bone lesions, not all bone lesions were counted or measured for disease evaluation. 2 Patients not evaluable with PERCIST 1.0 due to not having any target or non-target lesions or new lesions based on PERCIST 1.0.
Waterfall plots of the 4-month target lesions' percent of response after chemotherapy with PSA (A), RECIST 1.1 (B), and PERCIST 1.0 (C) response criteria. Of note, only 19 of the 47 patients enrolled had target lesions by RECIST 1.1 criteria and were evaluable. CR/CMR- complete response, SD/SMD- stable disease, PD/PMD- progressive disease, PR/PMR- partial response.
Kaplan-Meier plot of overall survival by PSA (A), RECIST 1.1 (B), and PERCIST 1.0 (C) response status. CR/CMR- complete response, SD/SMD- stable disease, PD/PMD- progressive disease, PR/PMR- partial response.
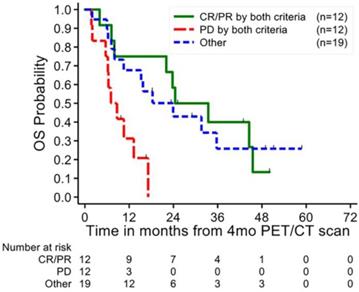
A total of 12 patients (26%) demonstrated progressive disease by both PERCIST 1.0 and PSA based response criteria and 12 patients (26%) showed complete or partial response by both criteria (Figure 4). Patients with PD by both criteria demonstrated a significantly worse prognosis compared to PD by either response criteria individually, with a 24-month OS probability of 0% (p<0.01) and a 12-month OS probability of 31% ± 14% compared to 12-month OS probabilities of 43% ± 13% and 41% ± 11% (p<0.05) for PSA and PERCIST 1.0 criteria respectively. There were no significant differences between the partial and complete responders by both criteria (24-month OS 58% ± 14%) compared to the OS of responders by the individual criteria. Patients with mixed responses by PSA and PERCIST demonstrated a 24-month OS probability of 43% ± 12%, without a discernable trend in survival between discordant patients.
Kaplan-Meier plot of overall survival of combined PERCIST 1.0 and PSA response status. Patients with progressive disease by both response criteria demonstrated significantly worse overall survival compared to those categorized as progressive disease by one response criteria alone. CR/CMR- complete response, SD/SMD- stable disease, PD/PMD- progressive disease, PR/PMR- partial response.
The RECIST 1.1 and PERCIST 1.0 response-criteria demonstrated concordances of 44% and 65%, respectively, with the PSA response criteria. RECIST 1.1 was concordant with PERCIST 1.0 criteria for 50% of cases. The main discrepancies between RECIST 1.1 criteria compared to the PSA and PERCIST 1.0 criteria occurred due to the inability of RECIST 1.1 to assess differences in complete and partial responses from those with stable or non-progressive/non-partial responsive disease. 38 patients (62%) demonstrated complete or partial response in the PSA group and 28 patients (46%) in the PERCIST 1.0 group compared to only 13 patients in the RECIST 1.1 group (35% of evaluable patients).
Of the 47 patients enrolled in this study, 30 were chemotherapy naïve and 17 were enrolled after switching from a prior chemotherapy agent. The chemotherapy naïve patients demonstrated better overall survival (58% ± 9%) compared to patients enrolled switched to a new treatment (7% ± 7%, p=0<0.001). Chemotherapy naïve patients demonstrated similar trends in OS compared to the overall cohort, potentiually due to low sample size.
Discussion
PSA-based response criteria play an important role treatment monitoring for patients with mCRPC. Studies have shown shorter PSA doubling times and high PSA velocity are associated with significantly shorter OS in patients with mCRPC [25, 26]. However, there are several limitations in using PSA data for patients with mCRPC [27]. Docetaxel, a common first line chemotherapy agent for mCRPC patients, has been shown to down regulate PSA expression and secretion, resulting in discrepancies between PSA changes and disease response [28]. In addition, up to 20% of patients on docetaxel therapy have been shown to have a PSA flare during the initiation of treatment, despite ensuing therapeutic response [29]. Furthermore, mCRPC can demonstrate significant intra- and inter-tumor heterogeneity with varying degrees of PSA expression and chemosensitivity, thus complicating the interpretation of PSA data on overall treatment impact in patients with multiple sites of disease [30]. Lastly, with the increasing use of molecularly targeted and other novel agents, (e.g. 223Ra dichloride, sorafenib, cabozantinib, sipuleucel-T), there may be dissociated anti-tumor and PSA effects, and therefore, the utility of PSA-based response assessment will be limited [31, 32].
PERCIST 1.0, introduced by Wahl et al. in 2009 as a guideline to assess treatment response in patients with cancer using FDG PET, has since been evaluated for the use in numerous malignancies, including colorectal cancer, small-cell lung cancer, and lymphoma [33]. Although no studies to date have evaluated the utility of PERCIST 1.0 for patients with mCRPC, there are a few studies which have investigated the use of a modified PERCIST criteria utilizing 68Ga-PMSA-11 PET/CT. In a study of 88 patients with biochemically progressive metastatic prostate cancer, Gupta et al. investigated the utility of a modified PERCIST using changes in uptake value on 68Ga-PMSA-11 PET/CT compared to RECIST 1.1. In this study, the modified PERCIST classified a significantly higher number of patients with disease progression compared to RECIST 1.1 (80.7% PD by PERCIST vs 50.6% PD by RECIST 1.1, p<0.05) [34]. Seitz et. al demonstrated similar results with a modified PERCIST criteria using 68Ga-PMSA-11 PET/ CT showing high concordance between PERCIST and PSA-based response compared to RECIST 1.1 [35].
In our study we found that PERCIST 1.0 treatment response assessment at 4 months correlated highly with PSA response criteria and had significant implications for predicting OS. Of the response criteria, PERCIST 1.0 was superior at distinguishing the overall survival of responders compared to patients with stable disease, whereas the PSA response criteria was superior at distinguishing the overall survival of patients with progressive versus stable disease. However, the PSA response criteria lacked the ability to distinguish survival differences in patients with stable vs. responsive disease. RECIST 1.1, which incorporates the use of CT data, showed a trend in distinguishing the OS of progressors vs. non-progressors, although not statistically significant in our study, yet was unable to distinguish survival differences between patients with responsive versus stable disease. This may be in large part due to the inherent inability of RECIST 1.1 to accurately monitor osseous metastases, which constitutes the majority of lesions in patients with mCRPC. When lacking target lesions, RECISTS 1.1 cannot distinguish patients with stable disease from those with partial response. These findings highlight the added value that FDG PET contributes to conventional imaging with regards to assessing treatment response and disease aggressiveness. This added information may be valuable to treating clinicians, potentially prompting earlier changes in systemic therapies in nonresponding patients, which may lead to improved overall outcome. Of note, patients with progressive disease by both PERCIST 1.0 and PSA response criteria demonstrated significantly worse OS compared to those with progressive disease by one criterion alone. These combined results may be useful in identifying patients with highly aggressive disease, providing crucial prognostic information to clinicians and potentially prompting the use of more aggressive treatment regimens.
Potential limitations for this study include grouped analysis of patients undergoing first-line chemotherapy vs those enrolled during a transition to a new agent. However, the majority of the patients enrolled in this study underwent first-line chemotherapy and subset analyses of the chemotherapy naive patients demonstrated similar trends in OS. As may have been expected, the cohort of patients switched to new chemotherapy agents demonstrated significantly worse OS, reflecting more aggressive tumor biology [36]. While none of the response criteria were able to demonstrate significant differences in OS between response groups in this cohort, this may be secondary to a low sample size and additional larger studies are required to evaluate the effectiveness of the response criteria in this subset of patients. In addition, although we used RECIST 1.1 response criteria in conjunction with available bone scan data, follow-up bone scans were not performed in all patients to exclude lesions secondary to the flare phenomenon. However, only 4 patients were classified as PD by RECIST 1.1 criteria due to isolated bone scan findings, 3 of which demonstrated corresponding lesions on FDG PET/CT. To accurately assess the treatment response between the baseline and 4-month follow-up, only patients with no change in chemotherapy regimens between baseline and follow-up scans were included, excluding the assessment of patients who underwent early changes in therapy at the discretion of their treating physician. Lastly, due to practical and ethical constraints there was a lack of histologic verification for the metastatic lesions. However, all selected lesions for analysis were required to have correlation on CT to be considered as sites of metastatic disease.
Conclusion
PERCIST 1.0 may provide useful prognostic information in men with mCRPC undergoing treatment, particularly at distinguishing the overall survival in patients with favorable treatment response compared to those with stable disease. Furthermore, the incorporation of both PERCIST 1.0 and PSA-based response criteria may be useful for identifying patients with highly aggressive disease and poor overall survival, although further studies are required to confirm these results.
Abbreviations
CT: computed tomography; PET: positron emission tomography; FDG: 18F-fluorodeoxyglucose; PSA: prostate-specific antigen; PSMA: prostate specific membrane antigen; CI: confidence interval; HR: hazard ratio; SE: standard error; mCRPC: metastatic castrate-resistant prostate cancer; CR: complete response; PR: partial response; SD: stable disease; PD: progressive disease; CMR: complete metabolic response; PMR: partial metabolic response; SMD: stable metabolic disease; PMD: progressive metabolic disease; RECIST: Response Evaluation Criteria in Solid Tumors; PERCIST: PET Response Criteria in Solid Tumors; SUL: standardized uptake value corrected for lean body mass.
Acknowledgements
Support by grants from the National Cancer Institute and National Institutes of Health R01-CA111613 (H. Jadvar) and P30‐CA014089 (USC Norris Comprehensive Cancer Center).
Competing Interests
The authors have declared that no competing interest exists.
References
1. Siegel RL, Miller KD, Jemal A. Cancer statistics, 2018. CA Cancer J Clin. 2018;68:7-30
2. Scher HI, Halabi S, Tannock I, Morris M, Sternberg CN, Carducci MA. et al. Design and end points of clinical trials for patients with progressive prostate cancer and castrate levels of testosterone: recommendations of the Prostate Cancer Clinical Trials Working Group. J Clin Oncol. 2008;26:1148-59
3. Tamada S, Iguchi T, Kato M, Asakawa J, Kita K, Yasuda S. et al. Time to progression to castration-resistant prostate cancer after commencing combined androgen blockade for advanced hormone-sensitive prostate cancer. Oncotarget. 2018;9:36966-74
4. Francini E, Gray KP, Shaw GK, Evan CP, Hamid AA, Perry CE. et al. Impact of new systemic therapies on overall survival of patients with metastatic castration-resistant prostate cancer in a hospital-based registry. Prostate Cancer Prostatic Dis. 2019
5. Bubley GJ, Carducci M, Dahut W, Dawson N, Daliani D, Eisenberger M. et al. Eligibility and response guidelines for phase II clinical trials in androgen-independent prostate cancer: recommendations from the Prostate-Specific Antigen Working Group. J Clin Oncol. 1999;17:3461-7
6. Gupta M, Choudhury PS, Rawal S, Goel HC, Rao SA. Evaluation of response in patients of metastatic castration resistant prostate cancer undergoing systemic radiotherapy with lutetium177-prostate-specific membrane antigen: A comparison between response evaluation criteria in solid tumors, positron-emission tomography response criteria in solid tumors, European organization for research and treatment of cancer, and MDA criteria assessed by gallium 68-prostate-specific membrane antigen positron-emission tomography-computed tomography. Urol Ann. 2019;11:155-62
7. Ryan CJ, Shah S, Efstathiou E, Smith MR, Taplin ME, Bubley GJ. et al. Phase II study of abiraterone acetate in chemotherapy-naive metastatic castration-resistant prostate cancer displaying bone flare discordant with serologic response. Clin Cancer Res. 2011;17:4854-61
8. Jadvar H. Molecular imaging of prostate cancer: PET radiotracers. AJR Am J Roentgenol. 2012;199:278-91
9. Velez EM, Desai B, Jadvar H. Treatment Response Assessment of Skeletal Metastases in Prostate Cancer with (18)F-NaF PET/CT. Nucl Med Mol Imaging. 2019;53:247-52
10. Jilg CA, Drendel V, Rischke HC, Beck T, Vach W, Schaal K. et al. Diagnostic Accuracy of Ga-68-HBED-CC-PSMA-Ligand-PET/CT before Salvage Lymph Node Dissection for Recurrent Prostate Cancer. Theranostics. 2017;7:1770-80
11. Lutje S, Heskamp S, Cornelissen AS, Poeppel TD, van den Broek SA, Rosenbaum-Krumme S. et al. PSMA Ligands for Radionuclide Imaging and Therapy of Prostate Cancer: Clinical Status. Theranostics. 2015;5:1388-401
12. Watanabe H, Kanematsu M, Kondo H, Kako N, Yamamoto N, Yamada T. et al. Preoperative detection of prostate cancer: a comparison with 11C-choline PET, 18F-fluorodeoxyglucose PET and MR imaging. J Magn Reson Imaging. 2010;31:1151-6
13. Minamimoto R, Senda M, Jinnouchi S, Terauchi T, Yoshida T, Murano T. et al. The current status of an FDG-PET cancer screening program in Japan, based on a 4-year (2006-2009) nationwide survey. Ann Nucl Med. 2013;27:46-57
14. Jadvar H, Desai B, Ji L, Conti PS, Dorff TB, Groshen SG. et al. Prospective evaluation of 18F-NaF and 18F-FDG PET/CT in detection of occult metastatic disease in biochemical recurrence of prostate cancer. Clin Nucl Med. 2012;37:637-43
15. Jadvar H. Is There Use for FDG-PET in Prostate Cancer? Semin Nucl Med. 2016;46:502-6
16. Jadvar H, Velez EM, Desai B, Ji L, Colletti PM, Quinn DI. Prediction of time to hormonal treatment failure in metastatic castrate-sensitive prostate cancer with (18)F-FDG PET/CT. J Nucl Med. 2019;60:1524-30
17. Jadvar H, Desai B, Ji L, Conti PS, Dorff TB, Groshen SG. et al. Baseline 18F-FDG PET/CT parameters as imaging biomarkers of overall survival in castrate-resistant metastatic prostate cancer. J Nucl Med. 2013;54:1195-201
18. Zukotynski KA, Kim CK, Gerbaudo VH, Hainer J, Taplin ME, Kantoff P. et al. (18)F-FDG-PET/CT and (18)F-NaF-PET/CT in men with castrate-resistant prostate cancer. Am J Nucl Med Mol Imaging. 2015;5:72-82
19. Wahl RL, Jacene H, Kasamon Y, Lodge MA. From RECIST to PERCIST: Evolving Considerations for PET response criteria in solid tumors. J Nucl Med. 2009;50(Suppl 1):122S-50S
20. Paquet N, Albert A, Foidart J, Hustinx R. Within-patient variability of (18)F-FDG: standardized uptake values in normal tissues. Journal of nuclear medicine: official publication, Society of Nuclear Medicine. 2004;45:784-8
21. Tahari AK, Chien D, Azadi JR, Wahl RL. Optimum lean body formulation for correction of standardized uptake value in PET imaging. J Nucl Med. 2014;55:1481-4
22. Therasse P, Arbuck SG, Eisenhauer EA, Wanders J, Kaplan RS, Rubinstein L. et al. New Guidelines to Evaluate the Response to Treatment in Solid Tumors. JNCI: Journal of the National Cancer Institute. 2000;92:205-16
23. Eisenhauer EA, Therasse P, Bogaerts J, Schwartz LH, Sargent D, Ford R. et al. New response evaluation criteria in solid tumours: revised RECIST guideline (version 1.1). Eur J Cancer. 2009;45:228-47
24. Scher HI, Morris MJ, Stadler WM, Higano C, Basch E, Fizazi K. et al. Trial Design and Objectives for Castration-Resistant Prostate Cancer: Updated Recommendations From the Prostate Cancer Clinical Trials Working Group 3. J Clin Oncol. 2016;34:1402-18
25. Moreira DM, Howard LE, Sourbeer KN, Amarasekara HS, Chow LC, Cockrell DC. et al. Predicting Time From Metastasis to Overall Survival in Castration-Resistant Prostate Cancer: Results From SEARCH. Clin Genitourin Cancer. 2017;15:60-6 e2
26. Li QK, Chen L, Ao MH, Chiu JH, Zhang Z, Zhang H. et al. Serum fucosylated prostate-specific antigen (PSA) improves the differentiation of aggressive from non-aggressive prostate cancers. Theranostics. 2015;5:267-76
27. Jan YJ, Yoon J, Chen JF, Teng PC, Yao N, Cheng S. et al. A Circulating Tumor Cell-RNA Assay for Assessment of Androgen Receptor Signaling Inhibitor Sensitivity in Metastatic Castration-Resistant Prostate Cancer. Theranostics. 2019;9:2812-26
28. Kuroda K, Liu H, Kim S, Guo M, Navarro V, Bander NH. Docetaxel down-regulates the expression of androgen receptor and prostate-specific antigen but not prostate-specific membrane antigen in prostate cancer cell lines: implications for PSA surrogacy. Prostate. 2009;69:1579-85
29. Armstrong AJ, Febbo PG. Using surrogate biomarkers to predict clinical benefit in men with castration-resistant prostate cancer: an update and review of the literature. Oncologist. 2009;14:816-27
30. Shah RB, Mehra R, Chinnaiyan AM, Shen R, Ghosh D, Zhou M. et al. Androgen-independent prostate cancer is a heterogeneous group of diseases: lessons from a rapid autopsy program. Cancer Res. 2004;64:9209-16
31. Chi KN, Ellard SL, Hotte SJ, Czaykowski P, Moore M, Ruether JD. et al. A phase II study of sorafenib in patients with chemo-naive castration-resistant prostate cancer. Ann Oncol. 2008;19:746-51
32. Emmenegger U, Ko YJ. PSA-based treatment response criteria in castration-resistant prostate cancer: promises and limitations. Can Urol Assoc J. 2009;3:375-6
33. O JH, Lodge MA, Wahl RL. Practical PERCIST: A Simplified Guide to PET Response Criteria in Solid Tumors 1.0. Radiology. 2016;280:576-84
34. Gupta M, Choudhury PS, Rawal S, Goel HC, Rao SA. Evaluation of RECIST, PERCIST, EORTC, and MDA Criteria for Assessing Treatment Response with Ga68-PSMA PET-CT in Metastatic Prostate Cancer Patient with Biochemical Progression: a Comparative Study. Nucl Med Mol Imaging. 2018;52:420-9
35. Seitz AK, Rauscher I, Haller B, Kronke M, Luther S, Heck MM. et al. Preliminary results on response assessment using (68)Ga-HBED-CC-PSMA PET/CT in patients with metastatic prostate cancer undergoing docetaxel chemotherapy. Eur J Nucl Med Mol Imaging. 2018;45:602-12
36. Kessel K, Seifert R, Schafers M, Weckesser M, Schlack K, Boegemann M. et al. Second line chemotherapy and visceral metastases are associated with poor survival in patients with mCRPC receiving (177)Lu-PSMA-617. Theranostics. 2019;9:4841-8
Author contact
![]() Corresponding author: Hossein Jadvar, MD, PhD, MPH, MBA, Department of Radiology, University of Southern California, 2250 Alcazar St., CSC 102, Los Angeles, CA 90033 USA. Phone: 323-442-1107; Fax: 323-442-3253; E-mail: jadvarusc.edu
Corresponding author: Hossein Jadvar, MD, PhD, MPH, MBA, Department of Radiology, University of Southern California, 2250 Alcazar St., CSC 102, Los Angeles, CA 90033 USA. Phone: 323-442-1107; Fax: 323-442-3253; E-mail: jadvarusc.edu