Impact Factor
 Global reach, higher impact
Theranostics 2020; 10(4):1884-1909. doi:10.7150/thno.38625 This issue Cite
Review
Spatial heterogeneity of nanomedicine investigated by multiscale imaging of the drug, the nanoparticle and the tumour environment
Josanne Sophia de Maar1, Alexandros Marios Sofias2, Tiffany Porta Siegel3, Rob J. Vreeken3,4, Chrit Moonen1, Clemens Bos1, Roel Deckers1 ![]()
1. Division of Imaging and Oncology, University Medical Center Utrecht, Utrecht University, the Netherlands.
2. Department of Circulation and Medical Imaging, Faculty of Medicine and Health Sciences, Norwegian University of Science and Technology (NTNU), Trondheim, Norway.
3. The Maastricht Multimodal Molecular Imaging Institute (M4I), Division of Imaging Mass Spectrometry, Maastricht University, Maastricht, the Netherlands.
4. Janssen Research & Development, Beerse, Belgium.
Received 2019-7-22; Accepted 2019-11-13; Published 2020-1-1
Abstract

Genetic and phenotypic tumour heterogeneity is an important cause of therapy resistance. Moreover, non-uniform spatial drug distribution in cancer treatment may cause pseudo-resistance, meaning that a treatment is ineffective because the drug does not reach its target at sufficient concentrations. Together with tumour heterogeneity, non-uniform drug distribution causes “therapy heterogeneity”: a spatially heterogeneous treatment effect. Spatial heterogeneity in drug distribution occurs on all scales ranging from interpatient differences to intratumour differences on tissue or cellular scale. Nanomedicine aims to improve the balance between efficacy and safety of drugs by targeting drug-loaded nanoparticles specifically to tumours. Spatial heterogeneity in nanoparticle and payload distribution could be an important factor that limits their efficacy in patients. Therefore, imaging spatial nanoparticle distribution and imaging the tumour environment giving rise to this distribution could help understand (lack of) clinical success of nanomedicine. Imaging the nanoparticle, drug and tumour environment can lead to improvements of new nanotherapies, increase understanding of underlying mechanisms of heterogeneous distribution, facilitate patient selection for nanotherapies and help assess the effect of treatments that aim to reduce heterogeneity in nanoparticle distribution.
In this review, we discuss three groups of imaging modalities applied in nanomedicine research: non-invasive clinical imaging methods (nuclear imaging, MRI, CT, ultrasound), optical imaging and mass spectrometry imaging. Because each imaging modality provides information at a different scale and has its own strengths and weaknesses, choosing wisely and combining modalities will lead to a wealth of information that will help bring nanomedicine forward.
Keywords: Drug distribution, Nanomedicine, Clinical Imaging, Optical imaging, Mass Spectrometry Imaging.
Introduction
In 2015, 17.5 million people were diagnosed with cancer globally and its incidence is increasing. Although the prognosis of most cancer types has improved, still 8.7 million people died of cancer in that year [1]. Rather than a single disease, 'cancer' comprises of a diverse collection of diseases. A high degree of heterogeneity in tumour genotype, phenotype and behaviour (including responsiveness to therapy) exists not only between tumour types, but also between tumours of the same histological type in different patients [2], between primary and metastatic tumours in the same patient, within a patient's tumour that is developing over time [3] and even within a single tumour at one moment [2, 4-10]. The genetic and non-genetic causes of tumour heterogeneity have been reviewed in detail elsewhere. This heterogeneity is an important cause of therapy resistance [3, 11-14] and in some cancer types an association between the degree of intratumoural heterogeneity and a worse prognosis has been found [15-17]. This stresses the importance of evaluating disease heterogeneity and the need for personalized treatment.
Therapy heterogeneity
Therapy heterogeneity, a spatially heterogeneous treatment effect, is another important source of variability between patients and between tumours within an individual. Spatial heterogeneity in drug distribution contributes to therapy heterogeneity and can lead to pseudoresistance: the treatment does not have the desired effect, not because of cellular or genetic mechanisms of resistance, but because the drug simply does not reach all tumour cells at a high enough concentration [18-20]. Moreover, unintended accumulation of drugs in healthy tissue may lead to increased toxicity [18]. Furthermore, heterogeneity in spatial distribution of drugs can generate distinct microenvironments within the tumour, causing intra- and intertumour heterogeneity and, ultimately, influencing clinical outcome.
Spatial heterogeneity of nanomedicine
Heterogeneous drug distribution occurs for drugs of all sizes. In this review we will focus on its impact in the field of nanomedicine. Nanomedicines are sub-micron size drug delivery systems, which are designed to improve the drug delivery to tumours while reducing systemic side effects [21]. Several principles for drug targeting to tumours are described in literature [22]: passive targeting (mainly relying on the enhanced permeability and retention (EPR) effect [23, 24]), active targeting (using carriers decorated with tumour-specific targeting antibodies) or triggered release (drug release from nanocarriers in response to heat, ultrasound or light) [25]. Regardless of the targeting method, nanomedicine has to overcome several physiological barriers before reaching the targeted tumour cells, which may very likely introduce therapy heterogeneity [26].
Scales of heterogeneity
As reviewed by Garattini et al., heterogeneous drug distribution leading to therapy heterogeneity can occur on many scales [18]. On each scale different factors influence the distribution of the nanoparticle and drug.
On patient scale, the inter-patient variability of nanomedicine pharmacokinetics (PK) is influenced by many factors such as age, gender, body composition, prior treatments, and drug-drug interactions [27]. For a number of liposomal nanoparticles, it has been shown that the PK variability of nanoparticles is greater than that of the corresponding small molecule drugs [28]. Clearance of most nanoparticles occurs mainly via the mononuclear phagocyte system (MPS, also known as the reticuloendothelial system) through uptake by circulating and tissue-homing phagocytic cells, primarily in the liver and spleen [29]. One explanation for interpatient differences is that MPS function is affected by age, gender and inflammation [30]. Comorbidity affecting renal function or hepatic function could in turn diminish renal clearance or hepatobiliary excretion of certain nanoparticles. On the other hand, the presence of tumours in the liver increased the clearance of a liposomal campthothecin analogue [31]. Furthermore, due to the accelerated blood clearance (ABC) phenomenon, a second dosage of polyethylene glycol (PEG)ylated nanoparticles is cleared more rapidly, leading to additional inter and intra patient differences [32].
Also on the organ and tumour scale, many factors can contribute to heterogeneity in nanoparticle and drug distribution between different tumours in an individual patient. Accumulation of nanoparticles is tumour type and organ dependent [33]. Tumour locations with limited perfusion or specific barriers such as the blood brain barrier [34] or blood retina barrier [35] can hinder nanoparticle and drug accumulation. A large variation in EPR effect exists between tumour types, sizes and locations, most likely related to variability in tumour blood vessel architecture and function [26, 36]. Likewise, preclinical small animal tumour models generally overestimate the EPR effect compared to tumours in patients, which complicates clinical translation of nanomedicine [37]. Moreover, differences in composition of the tumour microenvironment (including immune cell infiltration, pericyte coverage of the endothelium, density of the extracellular matrix, hypoxia and interstitial fluid pressure (IFP) can lead to intertumour heterogeneity in nanoparticle accumulation and treatment effect [3, 37-40].
Finally, on tissue and cellular scale, there are numerous causes for heterogeneity in drug and nanoparticle distribution within a single tumour. These intratumour differences relate among other things to endothelial cell gaps across the vessel wall, perfusion, extracellular matrix composition and immune cell presence (e.g. tumour associated macrophages, TAM) [3, 19, 38]. Variable endothelial gaps (ranging from one to hundreds of nanometers) result in non-uniform extravasation of nanoparticles into the tumour [41]. Heterogeneity in tumour perfusion will cause non-uniform transport of nanoparticles and nutrients to different parts of the tumour and introduce local variance in oxygenation and tumour pH [19, 38].
Role of imaging to evaluate spatial heterogeneity of nanomedicine
Some nanomedicine formulations are currently used in the clinic [42, 43], but overall the success of nanomedicine has been modest [44-46]. Spatial heterogeneity in distribution of nanoparticles could be an important factor limiting the efficacy in patients and therefore the acceptance of nanotherapy in the clinic. Better understanding of the extent and impact of therapy heterogeneity from cellular to patient scale may increase the success of nanomedicine in clinical practice.
Many imaging methods are available to visualize at a variety of scales the three main factors (i.e. nanoparticle distribution, drug distribution and tumour environment) that influence spatial therapy heterogeneity and thus efficacy. These methods can be used to:
1. Evaluate the effect of the therapy in a preclinical setting, to facilitate the development of new treatments.
2. Improve understanding of the underlying mechanisms that lead to heterogeneous distribution of nanoparticles and drugs.
3. Select patients and predict their treatment response for a personalized treatment plan: which patient likely benefits from a certain therapy and in which patient is adaptation of therapy necessary?
4. Evaluate the effect of methods that aim to address therapy heterogeneity, such as modulating the tumour microenvironment, hyperthermia or sonopermeation [19, 47, 48].
Scope
Over the last years, several excellent review papers on imaging in nanomedicine were published focusing on imaging the biodistribution of nanoparticles [49], imaging labelled nanoparticles [50-52], the role of imaging to evaluate treatments that alter nanoparticle delivery [47], imaging nanoparticles as companion diagnostics [53, 54], or clinical applications of imaging in the field of nanomedicine [55-57]. In this review we will provide a non-exhaustive overview of imaging methods used in the field of nanomedicine, which visualize spatial distribution of nanoparticles or drugs or factors contributing to heterogeneity on different scales, i.e. patient, organ/tumour and tissue/cellular scale. For each method, we will highlight the three main aspects that can be imaged: the drug, the nanoparticle and the tumour (micro-) environment. We will focus on three groups of imaging modalities. A summary of the modalities and their strengths and limitations is presented in Table 1. First we will discuss non-invasive clinical imaging methods, because of their direct usability in clinical translation of nanomedicine. Subsequently, we will elaborate on the most commonly used preclinical modality optical imaging as it is the most frequently employed imaging modality to investigate the interplay between drug, nanoparticle and environment. Optical imaging can be a non-invasive technique in the preclinical setting, while it is invasive clinically. Finally we will discuss mass spectrometry imaging (MSI), an invasive but promising and versatile label-free method for monitoring drug distribution and effect. Our goal is to show how imaging can provide information on all aspect that influence nanotherapy and in this way will help clinical and preclinical researchers to improve the effectiveness of nanotherapies and translate their use to cancer patients.
Comparison of modalities to image spatial heterogeneity of nanomedicine.
| Modality | Drug | Nanoparticle | Environment | Spatial resolution | Tempor. res. | Imaging depth | Strengths | Limitations | |
|---|---|---|---|---|---|---|---|---|---|
| Non-invasive clinical imaging methods | PET / SPECT | Drug labelled with radioactive tracer (e.g. 11C, 18F and 123I). | NP labelled with radioactive tracer (e.g. 64Cu and 89Zr). | Specific radiotracers for environmental factors such as hypoxia ([18F]-FMISO), proliferation ([18F]-FLT) or angiogenesis. | Clinical: ~4 mm (PET) ~10mm (SPECT) Preclinical: < 1 mm (PET/SPECT) | Slow | Whole body | - Established clinical method - Non-invasive - Images biological processes and metabolic activity - Quantitative - High sensitivity (pM-nM) | - Labelling required - Low resolution - Radiation - Lacks anatomical information: combination with other modality (CT, MRI) often needed - Radiotracers can cause toxicity |
| MRI | MR contrast agents as model drugs (e.g. Gd- and Mn- chelate). | - Superparamagnetic NP labelled to drugs or other NP - NP incorporating, encapsulating or labelled with MR contrast agents | Particular MRI sequences that can measure perfusion, vascular permeability, diffusion or oxygenation status. | ~1 mm (clinical) ~0.1 mm (preclinical) | Slow | Whole body | - Established clinical method - Non-invasive - High spatial resolution - Physiological and anatomical information | - Contrast-agents can cause toxicity - Not compatible with certain pacemakers, metal implants, claustrophobia etc. - Indirect quantification | |
| CT | CT contrast agents as model drug (e.g. iodine). | Metallic NP (e.g. gold, bismuth). | Dynamic CT with contrast injection for measuring perfusion and permeability. | 50-500 μm | Fast | Whole body | - Established clinical method - Non-invasive | - Radiation - Contrast-agents can cause toxicity | |
| US | US contrast agents as model drug (e.g. nanobubbles). | - Micro- and nanosized echogenic NP - NP labelled with US contrast agents. | - Specific ultrasound modes for measuring flow velocity and stiffness - Contrast-enhanced ultrasound to measure perfusion | 50-500 μm | Fast | ~ 30 cm | - Established clinical method - Non-invasive - Possible therapeutic use in sonopermeation - Anatomical and physiological information - High spatial and temporal resolution - High sensitivity (single MB detection) | - Operator dependent - Visualization difficult behind bone and air cavities | |
| Optical Imaging | BLI/FLI | - Drug labelled with fluorescent dye - Inherently fluorescent drug - Fluorescent dyes as model drug | NP co-loaded/labelled with fluorescent dye. | - Endogenous luminescence of (tumour) cell populations (BLI) - Specific (antibody-labelled) fluorescent probes to image environmental characteristics | ~5 μm | Medium | ~1 cm | - Preclinically whole-body imaging possible - Combination of tracers can be used to obtain information on more than one aspect | - Surface-weighted 2D images - Labelling often required - Limited tissue depth penetration - Invasive when used clinically (biopsy or surgery needed) |
| fDOT/ FMT | - Drug labelled with fluorescent dye - Fluorescent dyes as model drug | NP co-loaded/labelled with fluorescent dye. | Specific dyes to image environmental characteristics. | < 1 mm | Medium | 1-2 mm | - 3D information - Possibility to combine with CT - Combination of probes can be used to obtain information on more than one aspect | - Labelling often required - Only preclinical use | |
| IVM | - Drug labelled with fluorescent dye - Inherently fluorescent drug - Fluorescent dyes as model drug | NP co-loaded/labelled with fluorescent dye. | Specific dyes to image environmental characteristics. | Subcellular | Fast | 1-2 mm | - Preclinically non-invasive real-time method with high spatial and temporal resolution - Combination of probes can be used to obtain information on more than one aspect - High sensitivity (nM to μM) | - 2D information - Labelling often required - Only preclinical use | |
| Opto-acoustic | Fluorescent dye as model drug (e.g. ICG, IRDye800CW). | - Co-loading/labelling with fluorescent dye (e.g. ICG) - NP as optoacoustic contrast agent (e.g. Single-walled carbon nanotubes, gold NP) | - Endogenous contrast (e.g. Hb) - Specific (antibody-labelled) fluorescent probes to image environmental characteristics | 1 μm - 1 mm | Fast | 1 - 20 mm | - 3D information - Imaging at multiple scales - Penetration beyond optical diffusion limit - Combination endogenous and exogenous contrasts can be used to obtain information on more than one aspect | - Labelling often required - Operator dependent - Imaging depth is limited when the blood volume is high | |
| Mass Spectrometry Imaging | MSI | Label-free imaging of drugs and metabolites. | Label-free imaging of NP or NP compounds (e.g. phospholipids). | -Label-free imaging endogenous compounds (e.g. metabolites, proteins, lipids). - Imaging of tumour environmental markers (e.g. hypoxia) | 1 µm (IMC) 10-20 μm (MALDI) 50-200 μm (DESI) Sub-μm (SIMS) | Slow | Not applicable | - Label-free - Endogenous and exogenous compounds can be measured simultaneously to obtain information on more than one aspect - Quantitative measurement | - Invasive both preclinically and clinically (biopsy or surgery needed) - Susceptible to sampling error - Temporal information only with repeated sampling of tissue - Protocol has to be developed specifically for drug of interest |
PET: positron emission tomography; SPECT: single photon emission computed tomography; NP: nanoparticle; F-MISO: fluoromisonidazole; FLT: fluorothymidine; CT: computed tomography; MRI: magnetic resonance imaging; US: ultrasound; BLI: bioluminescence imaging; FLI: fluorescence imaging; fDOT: fluorescence diffuse optical tomography; FMT: fluorescence-mediated molecular tomography; IVM: intravital microscopy; ICG: indocyanine green; Hb: haemoglobin; MSI: mass spectrometry imaging; IMC: imaging mass cytometry; MALDI: matrix assisted laser desorption ionisation; DESI: desorption electro spray ionisation; SIMS: secondary ion mass spectrometry.
Nuclear imaging: scintigraphy/SPECT/PET
Nuclear imaging techniques, namely scintigraphy, Single-Photon Emission Computed Tomography (SPECT) and Positron Emission Tomography (PET) provide highly sensitive quantitative information about the distribution of an administered radiopharmaceutical. They are often combined with CT (SPECT/CT or PET/CT) to add anatomical information and perform attenuation correction. Since the spatial resolution is lower than that of MRI, CT and US imaging, clinical PET and SPECT are mainly informative on patient and organ scale. In the preclinical setting, high-resolution PET and SPECT techniques demonstrate expansion to the tissue scale [58], which is nicely represented by the study of Wang et al. showing the heterogeneous spatial distribution of radiolabelled multi-walled carbon nanotubes in mouse brains with high-resolution SPECT [59].
Currently, the metabolic activity measured with 18F-fluorodeoxyglucose (FDG-) PET/CT is widely used in the clinic for diagnosis and monitoring therapy response. Traditionally several parameters are analysed for diagnosis and prognosis, including maximum standardized uptake values (SUVmax), peak standardized uptake values (SUVpeak), metabolic tumour volume (MTV), and total lesion glycolysis (TLG). Recently, intratumoural heterogeneity of baseline 18F-FDG uptake measured by PET texture analysis has been introduced as new predictive and prognostic factor for neoadjuvant chemotherapy [60-63].
Imaging the nanoparticle
Nuclear imaging has already gained widespread acceptance in the management of cancer using standard chemotherapeutic agents, but may also play an important role in the advancement of nanomedicine towards clinical practice. Historically, nuclear imaging is used to image the distribution of radiolabelled nanoparticles on the patient and organ/tumour scale [47, 49-51, 56, 57]. Already in 1984, Lopez et al. used scintigraphy to track the distribution of Tc-99-m labelled liposomes in cancer patients on organ scale [64]. More recently, studies have used nuclear imaging of radiolabelled nanoparticles as a companion diagnostic to predict treatment response to drug containing nanoparticles or for directly visualizing the distribution of labelled therapeutic nanoparticles [65-69]. The latter approach is nicely illustrated by a clinical study in nineteen HER2-positive metastatic breast cancer patients [69]. HER2-targeted PEG-liposomes containing doxorubicin were administered together with a 64Cu-labelled tracer dose of the same liposomes and their distribution was imaged by PET/CT. This study was able to demonstrate and quantify the EPR effect in patients and found that tumour liposome concentrations were similar to those found preclinically. Heterogeneity in nanoparticle distribution on the patient and tumour scale was observed and an association was found between the amount of 64Cu-labelled liposome uptake in the tumour and the overall tumour response and progression free survival [69]. Recently, Miedema et al. used PET/CT to track 89Zr-labelled docetaxel nanoparticles in five patients with various tumour types and observed uptake of the nanoparticles in 35% of the tumours, which they attributed to the EPR effect. Heterogeneous patterns of accumulation were seen on patient and organ scale [70].
Imaging the tumour environment
Furthermore, clinical studies with different tracers are being conducted to extend the use of nuclear imaging to gaining insight into the different aspects of tumour physiology, such as proliferation (e.g. 18F-fluorothymidine (FLT-PET) [71-73]), hypoxia (e.g. 18F-fluoromisonidazole (F-MISO)-PET [55, 74, 75]) and angiogenesis (e.g. with radiolabelled arginine-glycine-aspartic acid (RGD) peptide tracers [76] or vascular endothelial growth factor expression [76, 77]).
Other tracers visualize expression of receptors that can be targeted by drugs (e.g. 18F-fluoroestradiol (FES-) PET [78, 79], human epidermal growth factor receptor 2 (HER2-) PET or SPECT [80]), demonstrate suitability for targeted therapy (e.g. response prediction to tyrosine kinase inhibitors in non-small cell lung cancer [76, 81]), or image tumour specific markers (e.g. prostate specific membrane antigen (PSMA-) PET [82, 83] and radiolabelled somatostatin analogues for neuroendocrine tumours [84, 85]).
Nuclear imaging methods create the possibility to combine imaging of nanoparticle distribution with imaging of characteristics of the tumour environment. A good example of this is the ZEPHIR trial [86], which was able to characterize tumour and therapy heterogeneity on the patient and tumour scale, based on pre-treatment HER2-PET/CT with 89Zr-trastuzumab and FDG-PET/CT after just one treatment cycle. These two types of PET imaging where used to characterize distribution of the nanoparticle (trastuzumab in T-DM1) and the tumour environment (FDG uptake). In metastatic breast cancer patients, who all had HER2 positive disease on biopsy, the combination of early metabolic response on FDG-PET (significant reduction in FDG uptake in >50% of the tumour load) and positive 89Zr-trastuzumab uptake (>50% of the tumour load) on the HER2-PET could predict treatment response to the antibody-drug conjugate (ADC) trastuzumab-emtansine (T-DM1) (Fig. 1A) [86]. A preclinical immunohistochemistry study has shown that trastuzumab distribution is also very heterogeneous on the tissue scale and that a large amount of HER2 receptors are never reached by trastuzumab [87]. The ZEPHIR study demonstrates that the inherent problems of characterising the tumour environment by tissue biopsies (i.e. sampling error and overlooking intra- and intertumour heterogeneity) can be circumvented through the use of nuclear imaging.
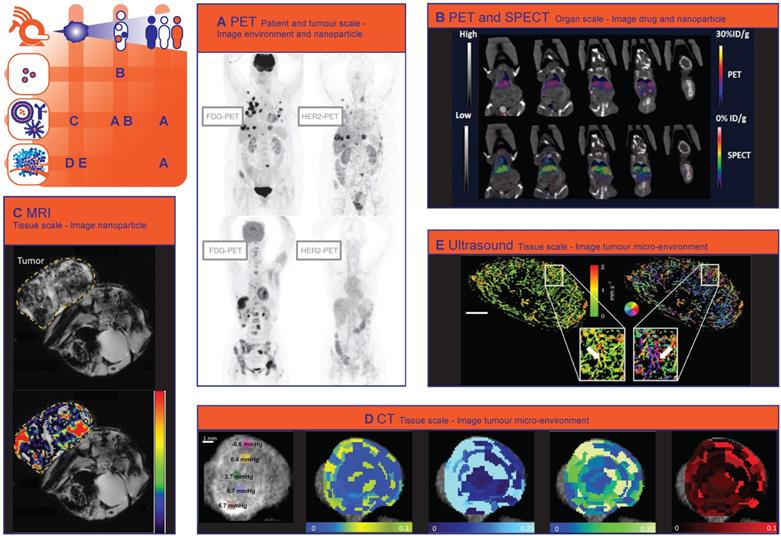
Non-invasive clinical methods to image spatial heterogeneity of nanomedicine. (A) Patterns of HER2-PET/CT confronted with FDG-PET/CT, Maximum intensity projection. Lesion uptake was considered pertinent when visually higher than blood pool. Top: dominant part of tumour load showed tracer uptake. Lung, liver and bone involvement seen of FDG-PET: not all lung lesions are seen on HER2-PET. Bottom: entire tumour load lacked tracer uptake. Liver and bone involvement seen on FDG-PET are not seen on HER2PET. (Adapted with permission from [86], copyright 2016 Oxford University Press on behalf of the European Society for Medical Oncology). (B) In vivo computed tomography (CT), positron emission tomography (PET)/CT, and SPECT/CT images of a nude mouse injected with 14 MBq of [18F]-FCP encapsulated [111In]-Liposome through tail vein injection 1 h post-administration. Coronal images. Both PET/CT and SPECT/CT images show the uptake of [18F]-FCP encapsulated in [111In]-Liposome in the liver and spleen. Both images correspond to each other in the uptake profile, demonstrating the feasibility of dual-tracer imaging from a single nano-construct. (Adapted with permission from [89], copyright 2017 MDPI). (C) MR T2* images of CL1-5-F4/NF-κB-luc2-xenograft-bearing mice treated with erlotinib-conjugated iron oxide nanoparticles. Voxelwise estimates of the intratumoural iron concentration derived from changes in the ΔR2* signal (P < 0.0001), which correlates to the amount of intratumoural erlotinib content. Top: T2* weighted MR image. Bottom: T2*-weighted MR image with color-coded overlay of voxelwise estimates of intratumoural iron concentration (Adapted with permission from [105], copyright 2018 Elsevier). (D) A panel of images showing point-based measurements of IFP overlaid on the intratumoural distribution of CT-liposomes in an orthotopic tumour. Images from left to right represent: interstitial Fluid Pressure (IFP); permeability; perfusion; interstitial volume fraction; plasma volume fraction. The coloured circles and corresponding numbers represent the region of interest (ROI) locations, ROI size used for point-based analysis, and measured IFP. Predominantly peripheral CT-liposome enhancement was observed, with some heterogeneous accumulation within the central tumour region. Metrics of perfusion were spatially heterogeneous, but tended to increase towards the tumour periphery. (Adapted with permission from [118], copyright 2015 Elsevier). (E) Motion model ultrasound localization microscopy (mULM). Super-resolution ultrasound images of an A431 tumour provide detailed information on the microvascular architecture including insights into vascular connectivity and the number of vascular branching points (see arrows in magnifications). Functional information such as MB velocities (left image) and MB flow directions (right image; color-coding illustrating the direction of flow according to the coloured circle) can be determined for each individual vessel and evaluated together with the morphological characteristics. Scale bar = 1 mm. (Adapted with permission from [142], copyright 2018 Nature Research).
Imaging the drug
Depending on the nanoparticles' release characteristics, imaging nanoparticle distribution might not necessarily reflect the distribution of encapsulated drugs and thus provide an incomplete view of drug distribution. To avoid the shortcomings of imaging the nanoparticle, the chemotherapeutic drug camptothecin and a photosensitizing agent were conjugated and labelled with 64Cu. In this way, the distribution of the drug conjugate could be imaged even after release from the polymeric nanoparticle. This study showed that a higher amount of the 64Cu-labelled photosensitizing agent was delivered to the tumour when it was conjugated to camptothecin. Accordingly, nanoparticles containing the combination more efficiently inhibited tumour growth than nanoparticles containing either the photosensitizer or camptothecin [88]. Attempts have been made to distinguish the distribution of nanoparticles from the distribution of drugs with nuclear imaging. For example, Lamichhane et al. combined PET and SPECT to image [111In]-Liposomes and the encapsulated [18F]-Fluorinated Carboplatin separately on organ scale. A similar distribution was found for both drug and carrier, with the highest accumulation in the spleen and liver. (Fig. 1B) [89].
Magnetic resonance imaging
Because of the lack of radiation, its high spatial resolution and excellent soft tissue contrast. Magnetic resonance imaging (MRI) is widely used in daily clinical practice for tumour diagnosis, characterisation and response evaluation. MRI is increasingly being investigated in image-guided therapy such as MR-guided radiotherapy (MR-LINAC) [90] and MR-guided High Intensity Focused Ultrasound (MR-HIFU) [91, 92]. Several MRI techniques have been used in nanomedicine research, to characterize the tumour environment and to image the distribution of nanoparticles or (model) drugs on organ/tumour and tissue scale [47, 49, 50, 55, 56, 93].
Imaging the tumour environment
Tumour vascular development and density, as well as perfusion and hypoxia, are key regulators of nanoparticle distribution and nanotherapy effect. Dynamic Contrast Enhanced (DCE-) MRI has been used in clinical trials to evaluate the effect of antivascular treatment on perfusion and vascular permeability [94, 95]. Preclinically, Baker et al. used MRI and histopathology to evaluate factors of the tumour environment that contribute to therapy heterogeneity on tissue level. Distribution of trastuzumab was very heterogeneous. However, area's with little trastuzumab did not correspond with areas that were poorly vascularized [96]. More specifically related to nanomedicine, Activin receptor-like kinase 5 (ALK5) inhibition with A-83-01 was shown to increase accumulation of liposomal Gadolinium (Gd) diethylenetriaminepentaacetic acid (DTPA) on dynamic MRI [97]. Restricted diffusion on diffusion weighted imaging (DWI) correlates with the cell density of a tumour [98, 99], while Blood Oxygenation Level Dependent (BOLD-) and Tissue Oxygenation Level-Dependent (TOLD-) MRI quantify tumour oxygenation [100, 101]. Hypoxic regions inherently have impaired transport of molecules and in addition hypoxia alters key cellular process such as energy metabolism and cellular receptor uptake and signalling, that can affect both intracellular uptake and efflux of nanomedicine [102].
Imaging the nanoparticle
Iron-oxide nanoparticles have been approved as MRI contrast agent for clinical use. However, they can also function as companion diagnostic or as (imageable) drug delivery systems [103]. For example, Ramanathan et al. conducted a clinical pilot study where they used feromoxytol (FMX) iron nanoparticles (also known as superparamagnetic iron oxide particles, SPION) to predict the deposition of nanoliposomal irinotecan. They showed a correlation between FMX-MRI and tumour response [104]. This companion diagnostic approach could lead to improved patient selection and personalized treatment. Alternatively, tracking the distribution of therapeutic nanoparticles could help with response prediction and early adaptation of a treatment plan. For example Hsu et al. could track the uptake of iron oxide nanoparticles conjugated to tyrosine kinase inhibitor erlotinib at tissue scale, and observed that the particle induced tumour inhibition in non-small cell lung cancer-bearing mice (Fig. 1C) [105]. Also other MRI contrast agents such as manganese and gadolinium have been incorporated in nanoparticles to create paramagnetic nanoparticles that can be imaged with MRI [106, 107]. For instance, Nitta et al. used Gd-dendron modified liposomes to evaluate intratumoural microvasculature with MRI and found a clear difference in vessel architecture between two tumour models. In addition, increased leakage of the liposomes into the tumour tissue was observed after anti-angiogenic sunitinib treatment [108].
Imaging model drugs
Moreover, MRI contrast agents have been encapsulated in nanoparticles as model drugs, to visualize and quantify drug release triggered by temperature, pH or ultrasound sensitive nanoparticles using MRI [93, 109]. Onuki et al. combined two MRI contrast agents to visualize the nanoparticle distribution as well as content release in mice on tissue scale. The mice were treated with poly(D,L-lactide-co-glycolide) nano/microspheres, encapsulated with gadolinium-DTPA, SPIONs and the chemotherapeutic drugs 5-fluorouracil. In vivo, release of gadolinium-DTPA was seen from 30 minutes after intravenous injection, in the same tumour regions where most of the nanospheres had accumulated [110]. Using MR contrast agents as a model drug is a convenient way to visualize in vivo drug release and spatial distribution at tumour and tissue scale. However, these MR contrast agents may influence the stability of nanoparticle [111] and interact with the co-loaded drug. Furthermore, the tissue distribution of the MR contrast agent and the co-loaded drug may not correspond due to different physicochemical properties of both molecules.
Computed tomography
Computed tomography (CT) imaging is very commonly used in the clinic for diagnostic purposes and response evaluation after treatment. More recently, it was shown that CT could derive tumour transport properties in patients with pancreatic cancer that correlated with gemcitabine incorporation, pathological response, and oncologic outcome [112]. Yoon et al. showed that CT texture features, as a non-invasive imaging biomarker for the identification of intratumoural heterogeneity, correlated with survival rate in gastric cancer [63].
Imaging the tumour environment
The added value of CT imaging for nanomedicine through identifying tumour transport properties was already shown in the preclinical setting. Dynamic Contrast Enhanced (DCE) CT has been used in several studies to measure the intratumoural perfusion, permeability and the accumulation of CT contrast agent-containing nanoparticles in mice [49, 113-116]. Since intratumoural perfusion is associated with liposome accumulation, DCE-CT could be useful to select patients more likely to respond to treatment with liposomal drugs [117]. Correlations were found between distribution of interstitial fluid pressure, tumour perfusion and the intratumoural accumulation of iohexol-containing liposomes imaged with CT on tissue scale (Fig. 1D) [118]. Spectral CT is another promising technique to image therapy heterogeneity on tissue scale, since it can provide high-resolution imaging and quantification of various components of the tumour microenvironment by taking advantage of differences in their energy-dependent attenuation [119]. Spectral CT has already been utilized to monitor vascular and tumour response to vascular endothelial growth factor (VEGF-) inhibitors in rabbits [120] and to assess angiogenesis clinically [121]. Related to nanomedicine, both tumour vasculature and tumour retention of liposomes has been imaged simultaneously with spectral CT, by administering iodine and Gd liposomes at different intervals before CT imaging [116].
Imaging the nanoparticle
In addition to imaging a contrast agent encapsulated in a nanoparticle, CT can also be utilized to image metallic nanoparticles with a high attenuation of x-rays [49, 122]. For example Mao et al. used CT to image the distribution of gold nanoparticle clusters containing doxorubicin on tissue scale and found that the nanoparticles accumulated mostly in the periphery of the tumour [123]. Because vessels in the tumour periphery are actually on average less permeable than in the tumour core, these results suggest that EPR is not the only factor in play. Extravasation into the core might, among other factors, be hampered by tumour perfusion and the interstitial tumour matrix [26]. In another study, CT imaging showed that hollow bismuth subcarbonate nanotubes, assembled from ultrasmall nanoclusters and loaded with doxorubicin for chemoradiotherapy, had an increased circulation time and exhibited a stronger EPR effect in mice compared to non-assembled ultrasmall nanoclusters [124].
Ultrasound imaging
Ultrasound (US) is a low-cost, radiation-free and patient-friendly clinical imaging method that is mostly used for tumour diagnosis and image-guided biopsies. The introduction of contrast-enhanced ultrasound (CEUS), i.e. using microbubbles as ultrasonographic contrast agents, has extended the application of ultrasound in many fields due to improved image quality and new information that cannot be obtained with standard US [125, 126].
Imaging the tumour environment
CEUS can provide anatomical as well as functional information about the vasculature of the tumour (micro-) environment [127-131]. As an example, CEUS with poly (butyl cyanoacrylate)-based microbubbles has been used to image the degree of vascularisation on tumour scale in mice, which was correlated with the degree of EPR-mediated accumulation of a polymeric drug carrier [132]. Moreover, Rojas et al. used targeted sub-micron phase-change contrast agents (liquid perfluorocarbon droplets, which contrary to microbubbles can also provide extravascular contrast) to image angiogenic vessels and perfusion in rats [133].
Tumour environment modelling treatments to improve nanoparticle delivery have been investigated using CEUS. Changes in tumour physiology (i.e. vessel fraction and blood flow) measured by US imaging after collagenase treatment corresponded with changes in IFP, therefore US imaging can be used as an earlier marker of tumour response [134]. Fibrinolytic therapy decompressed blood vessels and improved tumour perfusion was observed with CEUS. Probably related to these physiological changes, the anticancer efficacy of nanoparticle-encapsulated paclitaxel and the penetration of liposomal doxorubicin improved by fibrinolytic therapy [135]. IFP can also be measured directly by US elastography [136].
Recent advances in US imaging such as ultrafast ultrasound and super-resolution techniques provide also information on microvascular properties [137]. Ultrafast Doppler imaging is capable of visualizing the heterogeneous tumour vasculature over time in 3-D with high sensitivity and spatial resolution (80 μm) [138, 139]. Super-resolution ultrasound imaging technology allows vascular imaging at even higher spatial resolution (~10 μm) [140]. These techniques have already been used for detailed visualization of tumour microvascular morphology [141], characterization of tumour perfusion on tissue scale (Fig. 1E) [142] and monitoring of early tumour response to an angiogenesis inhibiting drug [143] and will soon be of great value for prediction of nanotherapy heterogeneity and response.
Imaging the nanoparticle
In addition to imaging the tumour environment, the distribution of nanoparticles can be imaged by US, using echogenic nanoparticles [144] (e.g. nanobubbles [145, 146], echogenic liposomes [147], polymeric gas-containing nanoparticles [148-150] or combining ultrasound contrast agents with nanoparticles through simultaneous administration or the use of nanoparticle-coated microbubbles [151-153]. Besides the benefits associated with imaging of nanoparticle distribution, ultrasound and microbubbles can improve the therapeutic effect of a drug or nanoparticle through a number of mechanisms, summarized as 'sonopermeation' [154].
Imaging the drug
Although drugs cannot be imaged directly with ultrasound, drug distribution can be visualized. To achieve this, Ektate et al. developed low-temperature sensitive echogenic liposomes, loaded with doxorubicin and perfluoropentane. Tumour hyperthermia led to increased US contrast in mice, which was correlated with increased doxorubicin delivery [147]. Min et al. used a different approach and administered doxorubicin-loaded calcium carbonate polymeric nanoparticles to tumour-bearing mice. In an acidic environment, such as a tumour, the nanoparticles released their doxorubicin load and simultaneously produced carbon dioxide nanobubbles through hydrolysis, which made ultrasound imaging of release at tumour scale possible [155].
Optical imaging of nanotherapy heterogeneity
Optical imaging modalities are used to collect a variety of information on various spatial and temporal scales [156]: from organism to molecule and from static snapshots to real-time continuous dynamic visualization [157]. These techniques are used in preclinical set-ups to provide macroscopic information at organism and organ scales (bioluminescence imaging (BLI), fluorescence imaging (FLI)) [158] or combined in tomographic set-ups to provide three-dimensional distribution profiles at organ and tissue scales (fluorescence diffuse optical tomography (fDOT), fluorescence-mediated molecular tomography (FMT)) [159, 160]. Most importantly, the possibility for high spatial and temporal resolution imaging enables tissue and (sub-)cellular scale imaging in preclinical set-ups via intravital microscopy (IVM) (confocal laser scanning microscopy (CLSM) and two-photon / multiphoton microscopy (MPM)) [161, 162]. Real-time in vivo optical imaging modalities are steadily substituting “old-school” ex vivo methodology - “dead mice tell too few tales” [163] - and, preclinically, they establish high-resolution alternatives to conventional clinical imaging modalities. In addition, supplementary ex vivo / in vitro optical imaging techniques can provide supportive structural and functional information (immunohistochemistry (IHC) on tissue slices, electron microscopy (EM), flow cytometry imaging). Optical imaging is widely used in the development and evaluation of nanotherapies: molecular imaging helps unravel nanoparticles' complex in vivo fate [164, 165], while development of nanoparticles with multimodal-imaging potential [166-170] and state-of-the-art fluorescence-labelling strategies [171, 172] increase the amount and quality of information.
Whole body fluorescence imaging on organism and organ / tumour scale
Traditionally, macroscopic optical imaging modalities are used in preclinical small animal experimental procedures as alternatives to conventional non-terminal / non-invasive whole-body imaging modalities (PET/SPECT, MRI, CT). BLI, one of the most commonly used optical imaging techniques, allows real-time detection of protein-derived native light emission (Fig. 2A). Even though the required genetic engineering (transfection of cancer cell lines, transgenic animals) makes the technique inapplicable to wild type tumours [173], BLI remains a fast and user-friendly option to evaluate nanotherapy efficacy based on the endogenous luminescence of tumours [174-180] to verify nanoparticles' diagnostic or theranostic potential [168, 181, 182], and to combine with other imaging approaches [183]. Another extensively used preclinical imaging technique is whole body fluorescence imaging (FLI), which requires the administration of fluorescent nanoparticles or molecules (Fig. 2A). Whole body FLI allows for a two dimensional organism and organ/tumour scale evaluation of nanotherapy spatial heterogeneity. Researchers use FLI to define nanoparticles' in vivo release profile [184], to monitor nanoparticle tumour accumulation [185-189], to determine how specific structural characteristics of nanoparticles alter their tumour accumulation [186], to examine nanoparticles theranostic potential [170, 190-192], to evaluate the performance of nanoparticles as potential single- [193-195] or multimodal [168, 170, 196, 197] imaging probes. Despite the fact that BLI and FLI can be used to delineate solid tumours and detect fluorescent nanoparticles respectively, they fail to provide three-dimensional and deep-tissue information. This disadvantage can be surpassed by integrating fluorescence-driven tomographic techniques [159]. fDOT [173] and fluorescence molecular tomography hybridized with computed tomography (FMT-CT) [198-200] in combination with Near-infrared (NIR-) decorated nanoparticles provide additional three-dimensional spatial information (Fig. 2B).
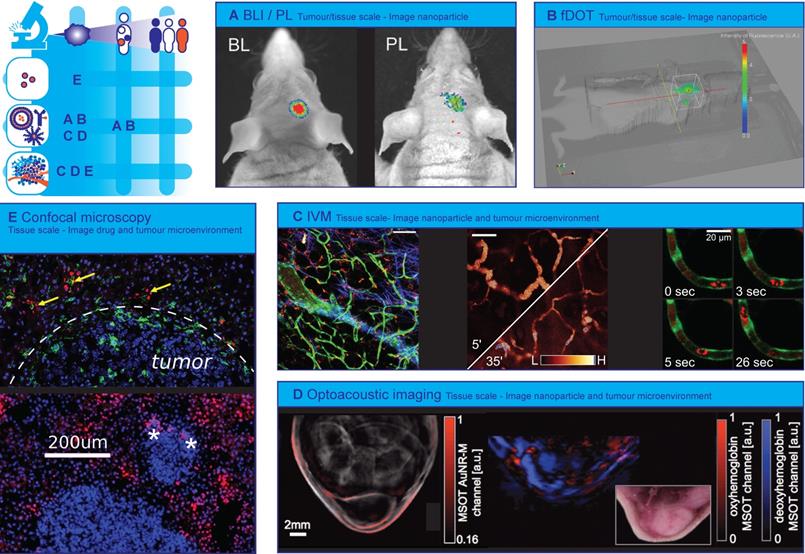
Optical technologies to image spatial heterogeneity of nanomedicine. (A) Combination of bioluminescence imaging (BLI) of luciferase expressing glioblastoma and photoluminescence (PL) imaging of theranostic photonic nanoparticles to verify nanoparticle tumour targeting efficacy. (Adapted with permission from [181], copyright 2016 Wiley). (B) 3D fluorescence-enhanced diffuse optical tomography (fDOT) image after injection of NIR-decorated nanoparticles in tumour-bearing mouse. (Adapted with permission from [173] copyright 2012 SPIE Digital Library). (C) Representative examples of real-time intravital microscopy (IVM) used to visualizing tumour microenvironment and track nanoparticles. The combination of bright-field illumination, non-linear optical imaging effects, endogenous fluorescence, and i.v. administration of fluorescent dyes contribute to a high quality tumour microenvironment characterization. Left: Green fluorescent protein (GFP) expressing endothelium (green) in a TIE2GFP mouse, 70 KDa TMR-dextran positive TAM (red), collagen (blue). Middle: Rhodamine-labelled nanoemulsions, passive diffusion on inflamed tissue over 30 min. Right: Atto633-labelled Doxil-like liposomes in circulation (red blur within vessel) and phagocytosed by a slow-moving circulating immune cell (red blob), GFP expressing endothelium (green) on TIE2GFP mouse (green). Scale bars 100 μm (right: 20 μm). (A.M. Sofias and S. Hak, unpublished data). (D) Multispectral Optoacoustic Tomography (MSOT) images of nude mouse with A2780 tumour Left: gold nanorod accumulation (overlaid in red) 24 hours after injection Right: MSOT images of oxyhemoglobin (red) and deoxyhemoglobin (blue) distribution visualizes vasculature. (Adapted with permission from [277], copyright 2012 Radiological Society of North America (United States)). (E) Heterogeneity of transport and structural properties of 4T1 breast cancer metastases in mouse liver. Several magnified metastases with different sizes and the red fluorescence of extravasated doxorubicin delivered by PEGylated liposomal doxorubicin (PLD) and colocalizing (yellow arrows) with Kupffer cells (green) outside tumours; stars denote doxorubicin fluorescence in tumours, the white-dashed line indicates the tumour boundary (Adapted with permission from [225], copyright 2018 Elsevier).
Intravital microscopy on tissue and (sub) cellular scale
Recent advancements in molecular imaging revealed the dark side of the field of nanomedicine. The scepticism about the EPR effect [39], the demonstration of low targeting efficiency towards tumour cells [201], and even, surprisingly, the incrimination of nanomaterials as metastasis mediators [202] denote that nanoparticle behaviour in vivo is highly complex. Therefore, a deeper understanding of in vivo behaviour, targeting mechanisms and nanoparticles' specific engagement with cell populations (tumour, stromal, endothelial, immune cells) is essential. Extensive use of real-time imaging techniques like IVM, could potentiate our efforts to characterize the tumour microenvironment on tissue and cellular scale (Fig. 2C) and design nanotherapies with predictable and desired physicochemical and immunobiological behaviour.
Imaging the nanoparticle
Indeed, IVM can provide information regarding nanoparticles' extravasation, diffusion, and penetration into tumours (Fig. 2C). For such purpose, orange/red fluorescence-labelled nanoparticles are most commonly injected together with large molecular weight (e.g. 2 MDa) green fluorescence-labelled dextran to delineate vessels. This two-dye strategy was applied to confirm the silica nanoparticle-based delivery of small interfering ribonucleic acid (siRNA) cancer therapeutics to orthotopic MDA-MB-231 tumours [203]. Similarly, extravasation of 100 nm long circulating liposomes into melanomas in presence / absence of Tumour Necrosis Factor (TNF) co-administration was evaluated. The IVM experiment revealed TNF-mediated vessel permeabilization that led to enhanced liposome extravasation. Unsurprisingly, the TNF-derived benefit was not observed for liposomes of larger size (400, 800 nm) [204], corroborating the realization that nanoparticles much larger than 100 nm cannot extravasate. Alongside qualitative visualization, IVM was utilized for semi-quantitative analysis comparing accumulation of nanoparticles in tumours versus healthy organs [205].
Interestingly, IVM has been used to identify differences in nanoparticle diffusion to tumour sites or nanoparticle tumour targeting, and to correlate them to different physicochemical properties, providing an excellent tool for head-to-head nanoparticle comparisons. The size-dependent diffusion of nanoparticles was studied after administration of a library of small fluorescent quantum dot nanoparticles with diameters of 12, 60 and 125 nm, revealing that 12 nm nanoparticles diffused twice as far in comparison to the largest size particles [206]. Similarly, a size effect was found when attempting to target lymph node metastases with nanoparticles: of three nanoparticles with diameters of 30, 70, and 80 nm, only the smallest reached the metastasis [207]. By comparing the studies that aimed to understand the importance of the nanoparticle size in in vivo behaviour, a clear pattern of deeper tissue penetration by smaller nanoparticles is revealed. In another study low (5 mol %) PEG surface density proved to contribute to a higher targeting specificity of arginylglycylaspartic acid (RGD) nanoparticles, than high (50 mol %) surface PEG density [208]. A head-to-head comparison between the extravasation of a quantum dot and a nanotube sharing similar surface coating, surface area, and charge but different geometry (spherical vs cylindrical respectively) revealed shape-dependent and tumour-dependent extravasation patterns. Of three investigated tumour models, cylindrical single-walled carbon nanotubes were found to extravasate only markedly in a human glioblastoma tumour model, while spherical quantum dots extravasated only in a colon adenocarcinoma tumour model. Surprisingly, no extravasation of either nanoparticle was observed in an ovarian adenocarcinoma tumour model [209]. Comparably, heterogeneity in extravasation patterns between these tumour models was found for RGD-decorated and control quantum dots [210]. The importance of morphology was emphasized when plateloid-shaped microparticles were found to adhere more efficiently to tumour vasculature and exhibit a higher tumour to liver accumulation ratio than cylindroid microparticles [211].
Imaging the tumour environment
In addition to addressing nanoparticle tumour targeting and accumulation profiles, IVM has been used to unravel more intricate interactions between nanoparticles and immune cells; an interesting option given the increasing appeal of cancer immunotherapy. One of the first studies providing real-time insight in the behaviour of TAM, developed magneto-fluorescent nanoparticles enabling the visualization of nanoparticle-labelled TAM on tumour/organ scale (MRI, FMT) and on tissue and cellular scale (IVM). Among other findings, TAM phagocytosed more nanoparticles than other myeloid cells, they were situated in close proximity to tumour cells and displayed low motility [212]. Since nanoparticles tend to accumulate in TAMs, the hypothesis that an increase in TAM population within the tumour microenvironment would also increase nanoparticle accumulation was tested. Application of radiation proved to increase TAM / tumour cell ratio and confirmed this hypothesis: radiation enhanced the accumulation of liposomal doxorubicin in the tumour. IVM experiments showed that the enhanced accumulation was mediated by an increase in 'vascular bursts' (bursts of extravasation of nanoparticles into the tumour tissue) for which the presence of TAM and perivascular phagocytes was required [213]. Of note, the verification that vascular bursts are a driving mechanism for enhanced accumulation of nanoparticles within a tumour, challenges the conventional EPR-effect theory about roughly homogeneously increased leakiness of tumour vasculature [214]. Another immune cell-related variable that has been tested via IVM is the nanoparticle clearance from circulation. Myeloid immune cells proved to be a significant mediator of nanoparticle clearance, as nanoparticles injected in mice pre-treated with clodronate (which causes depletion of phagocytotic cells), circulated in a significantly higher amount in the blood [215].
Given that angiogenesis is a hallmark of cancer, the attention of intravital microscopy users has been directed particularly to nanoparticle-mediated vessel wall visualization and targeting. Already in the mid '00s, a successful attempt using vascular cell adhesion molecule 1 (VCAM-1) decorated nanoparticles paved the way for future success [216]. Subsequently, the development of RGD-decorated multimodal (fluorescence and paramagnetic) quantum dots [217] or nanoemulsions [208] aimed to actively target the αvβ3 integrin receptor overexpressed by angiogenic endothelium. By comparing the above studies, we see that attaching a certain targeting peptide to a nanoparticle alters the nanoparticle's in vivo behaviour in a similar manner regardless of the selected nanomaterial, i.e., nanoemulsions versus quantum dots. The multimodal nature of nanoparticles allows for visualization of angiogenic endothelium and neovasculature on tumour/organ scale (MRI, FLI, BLI), tissue scale (IHC and IVM), and cellular scale (IVM) [208, 217]. Of note, IVM strategies of visualizing nanoparticles and immune cells could be expanded outside the field of nanomedicine, for cancer cell imaging [218], which could be used as complementary technique in the analysis of liquid biopsies [219] and in the assessment of tumour heterogeneity [220].
The new mechanistic and molecular insights that were obtained through IVM procedures inspired researchers to develop IVM-specialized imaging agents. Biocompatible organic dots for MPM [221], magneto-fluorescent nanoparticles [222] and fluorescent nanoprobes that detect vascular permeability [223] are among representative examples of nanoparticles aiming to increase the information obtained by imaging.
Optical imaging of drugs
Visualization of fluorescent-labelled nanoparticles and related aspects of the tumour microenvironment provide valuable information on therapy heterogeneity in nanomedicine. Imaging the administered drug itself would complete the picture. However, direct imaging of drugs remains elusive. In this respect, inherently fluorescent drugs are convenient [224, 225], and some chemotherapeutic drugs relevant to cancer research possess fluorescent properties (i.e. doxorubicin, mitoxantrone, irinotecan) [226]. The application fluorescent drugs is nicely illustrated by a study that showed colocalization of fluorescent doxorubicin with Kupffer cells outside of tumours in a liver metastasis mouse model after treatment with PEGylated liposomal doxorubicin (Fig. 2E) [225]. Another interesting study from our institution used ex-vivo fluorescence microscopy to quantify tumour tissue doxorubicin concentration and heterogeneity of doxorubicin distribution after treatment of mice with doxorubicin, PEGylated liposomal doxorubicin (Doxil) and temperature-sensitive doxorubicin liposomes (ThermoDox) at three different dosages. Heterogeneity in doxorubicin distribution was visualized on tissue scale and could be compared spatially to heterogeneous vessel perfusion, hypoxia and dividing cell fraction in the tumour microenvironment [227]. However, in vivo imaging of inherently fluorescent drugs is hampered by their relatively low fluorescence quantum yield, which limits their detectability at therapeutic concentrations. Another approach could be the conjugation of fluorescent molecules to the drugs that are carried by nanoparticles, despite the fact that this could result into alternation of their properties. The conjugation of fluorescent dyes to macromolecular drugs has been successfully applied before [87, 96, 228]. In these studies the drugs had a significantly higher molecular weight than the conjugated fluorescent dye, which made their biodistribution properties, targeting specificity and efficacy less likely to be compromised by the dye. Fluorescently labelled therapeutic antibodies have already been administered to patients in early clinical studies [229-231].
Tissue optical clearing
Utilization of fluorescent molecules is often restricted by factors such limited imaging depth. Therefore, more sophisticated ex vivo techniques like the tissue optical clearing strategies [232] have been developed to surpass these limitations [233] by reversing the tissue opacity [234]. The application of such a methodology has been successfully applied to 3D cell spheres [235], tissue samples [236, 237], intact organs [238, 239] and even entire organisms [240]. Even though most of the conducted research is performed in soft tissues and organs, e.g., the brain, the tissue optical clearing strategies appear an appealing methodology for visualizing tissues in which fluorescence signal is heavily scattered, such as the dense connective tissue [241]. Tissue clearing applications provide high quality 3D information and improved mapping of the tissue environment which is useful to investigate the nanoparticle [242-244] and drug [228] distribution at tissue, organ, and organism scale. Additionally, tissue clearing has been used as a tool to study the heterogeneity of immune cell infiltration and therapeutic response in tumour models [245]. Besides its pre-clinical use, tissue clearing methodology has been applied for microscopic assessment of clinical specimens [246].
Clinical translation of optical imaging
Due to the limitations in tissue penetration and size of the imageable subject, in vivo optical imaging is mainly constricted to preclinical applications. Clinically, optical imaging is of course widely used on ex vivo biopsy or surgical samples. Although this consists mostly of immune histochemistry, some work has been done to complement this with fluorescent imaging [247, 248]. To our knowledge, fluorescent imaging has not yet been applied in clinical trials using nanomedicine. However, progress has been made towards translation of the use of silica nanoparticles for intra-operative sentinel node and tumour detection [249, 250]. In the future ex-vivo analysis of patient biopsies or surgical samples during clinical nanomedicine trials could provide detailed information on therapy heterogeneity on the tissue scale by visualizing nanoparticles, tumour microenvironment and perhaps fluorescent drugs. However, non-invasive in-vivo techniques will probably remain more appealing. Apart from nanomedicine, the clinical use of optical imaging is mostly complementary, with primary focus on intraoperative imaging [248, 251-253] and fluorescence-guided diagnosis [248, 254].
Optoacoustic imaging
Optoacoustic (photoacoustic) imaging is an emerging hybrid technique that combines the benefits of US and optical techniques, i.e. deep imaging depth, high spatial resolution and high contrast [255]. In optoacoustic imaging energy emitted by a pulsed laser source is absorbed by tissue causing its thermoelastic expansion, which generates ultrasound waves that can be detected with conventional ultrasound transducers [256]. The spatial resolution and imaging depth can be adapted to the scale of the preferred application domain, ranging from cellular substructures to organs with the same type of contrast [257]. Optoacoustic signal is mainly provided by endogenous molecules, such as haemoglobin (Hb), melanin, lipids, and collagen, or exogenous contrast agents such as small-molecule dyes, gold nanoparticles and liposomes [258, 259].
Imaging the tumour environment
In the oncology domain the endogenous contrast is typically used to study tumour vasculature [260, 261] and oxygenation status (Hb) [262, 263] at cellular scale [264] as well as at tissue scale [265]. Whereas targeted exogenous contras agents enable the readout of a specific biological entity or process such as Epidermal Growth Factor Receptor (EGFR) expression [266] or matrix metalloproteinase activity [267]. By using multiple wavelength illumination (i.e. Multispectral Optoacoustic Tomography (MSOT)) it is possible to differentiate the contribution of different contrast agents and analyse their concentration and distribution simultaneously. In the work of Tomaszewski et al. MSOT imaging of endogenous contrast (i.e. signals from oxy- and deoxyhaemoglobin) and exogenous contrast (signals from the FDA approved organic dye indocyanine green (ICG)) allowed for the non-invasive assessment of tumour vascular function, hypoxia, and necrosis revealing a complex, yet consistent network of relationships in the tumour vascular microenvironment [262]. Okumura et al., in turn, showed the potential of photoacoustic imaging coupled with ICG for evaluating changes in tumour vascular permeability associated with antiangiogenic therapy [268]. ICG rapidly binds to albumin in plasma, becoming a macromolecule that is not able to extravasate from vessels with intact endothelium. Reduced vessel permeability after anti-VEGF therapy, perceived as photoacoustic signal decrease in the tumour, was detected before inhibition of tumour growth indicating the potential of optoacoustic imaging as early marker of therapy response. Reporter gene products such as β-galactosidase [269], tyrosinase [270, 271] and fluorescent proteins [272] have also been used to produce contrast for optoacoustic imaging. Recently, Peters et al. introduced a new approach for creating optoacoustic imaging contrast by injecting phototrophic purple bacteria into tumours, which allowed them to monitor in vivo spatiotemporal changes of macrophage activity [273]. The spatiotemporal distribution and activity of macrophages are very relevant for nanomedicine since macrophages are increasingly being used for targeting nanoparticles towards tumour cells [274].
Imaging the nanoparticle
Nanocarriers not only serve as optoacoustic contrast agent, but can also act as vehicles for drugs. Several nanoparticles have been loaded with drugs and combined with optoacoustic imaging for non-invasive and real-time monitoring of biodistribution and pharmacokinetics [275, 276]. Herzog et al. used the MSOT approach to investigate the accumulation over time of long-circulating gold nanorods as well as intratumoural patterns of hemoglobin oxygenation to demonstrate imaging of the EPR effect (Fig. 2D). Higher nanorod accumulation was seen in the tumour model with a higher fraction of deoxygenated haemoglobin, although the underlying mechanism is still unclear [277]. The work by Song et al. illustrates nicely how MSOT is applied for whole-body visualization of the nanocarrier-based drugs distribution as well as the blood vessels in mice. They demonstrated that the distribution of platinum containing nanoparticles in tumours is highly vascularity-dependent, and could only access the peripheral region of the tumours [278]. Similarly, Kim et al. used bioconjugated gold nanocages as a contrast agent for quantitative molecular optoacoustic tomography of melanomas and surrounding blood vessels at microscopic scale in vivo [279]. These gold nanocages have already been used for triggered drug delivery [280]. Another interesting approach is to use pulsed laser irradiation, intrinsically part of optoacoustic instrumentation, as a stimulus for triggered drug release [281]. Here, low-intensity laser irradiation was used for photoacoustic imaging, while high-intensity laser irradiation induced the vaporization of perfluorohexane loaded in the nanoparticle and triggering the fast release of the co-loaded drug paclitaxel.
Imaging the drug
In order to monitor the drugs themselves using optoacoustic imaging they should exhibit NIR-absorbing properties. Unfortunately, few if any clinically prescribed drugs have strong intrinsic absorption in the NIR. As an alternative, small molecule NIR dyes are co-loaded with drugs of interest to monitor drug release and distribution [282]. An alternative approach for monitoring drug release was recently proposed by Yang et al. [283]. They developed a multifunctional nanotheranostic platform consisting of two optoacoustic imaging probes that allowed for concurrent non-invasive real-time ratiometric optoacoustic imaging of acidic tumour pH and monitoring of pH-induced drug release in living mice.[284]
Photothermal and photodynamic therapy
Optical and optoacoustic imaging have frequently been combined with photothermal therapy (PTT [170, 187, 190, 285]) and photodynamic therapy (PDT [168, 188, 189]) so that the NIR excitation can be used for both imaging and therapy. The recent progress in this field was excellently reviewed by Zhu et al. [286]. In PDT a photosensitizer is administered, which is subsequently activated by external light. In PTT nanoparticles generate heat upon laser light excitation. Nanoparticles (e.g. gold nanoparticles) can act as photothermal agents while simultaneously delivering photosensitizing agents [287]. Clinical trials using these therapies have already been performed [288] and imaging the distribution of photodynamic and photothermal agents could help towards further clinical translation.
Mass Spectrometry Imaging
Mass Spectrometry Imaging (MSI) is a label free, multiplex technique that is used to visualize the molecular distribution of endogenous compounds such as metabolites[289], lipids [290, 291], proteins and peptides [292-294], as well as drugs [295, 296] and drug delivery systems [297] in biological tissues. MSI therefore has the ability to collect not only drug distribution data but also endogenous compound information related to drug-induced efficacy and toxicity on tissue and cellular scale. This technique is increasingly being used in the pharmaceutical research and development pipeline and has demonstrated its utility from early stage drug discovery to preclinical development and clinical evaluation of tumour response to treatment. MSI is used for i) localizing and quantifying drug and metabolite levels (pharmacokinetics) to study efficacy [295], ii) assessing off target drug accumulation to study toxicity [298, 299], and iii) detecting endogenous biomarkers (pharmacodynamics) for predicting and evaluating treatment response [300].
In MSI spatially defined desorption/ionization methods are used to collect sequentially mass spectra from a small region (pixel) of a tissue sample. Among the multitude of surface sampling techniques, matrix-assisted laser desorption/ionisation (MALDI) uses a laser beam for desorption/ionization of tissue-representative molecules co-crystalized in a solidified matrix; while desorption electrospray ionization (DESI) makes use of an electrically charged solvent spray and in secondary ion mass spectrometry (SIMS), a beam of high energy primary ions (e.g. Ar+, Ga+, In+) is used to release secondary ions from the sample surface. In contrast to MALDI and SIMS where the sample is analysed under vacuum, DESI is non-destructive and performed at atmospheric pressure, which renders the technique more user friendly and through appropriate solvent selection, more tuneable to increase selectivity and/or sensitivity. Depending on the ionization method used spatial resolution, sensitivity, and the molecules that can be analysed change. Mostly, MALDI is used at 10 to 20 µm spatial resolution, whilst DESI resolution spans 50 µm till 200 µm and SIMS allows for sub-µm resolution. Sensitivity wise DESI outperforms MALDI and SIMS, partly due to increased pixel size (see spatial resolution) and partly due to improved ionization efficiency. Although sensitivity is determined by e.g. physiochemical properties of the compound, typically one requires low µg/g concentrations in the case of DESI and approx. 20 µg/g tissue for detection by MALDI and SIMS.
Imaging the drug
The number of drugs that have been detected using MSI is extensive, ranging from anti-cancer drugs (e.g. paclitaxel [301], sunitinib [302], doxorubicin [303]), antibiotics (moxifloxacin [304], polymyxin [298]), beta blocker propranolol [305] and antipsychotic drug olanzapine [306]. MALDI and DESI are mainly used to study the drug distribution at tissue scale. MALDI MSI images for example showed clearly that the distribution of paclitaxel distribution is very heterogeneous and depends on the histopathological characteristics of the different tumour models investigated (figure 3A) [307]. High performance liquid chromatography (HPLC) analysis of tumour homogenates was not able to detect the heterogeneous drug distribution in tumour sections. The same group also showed that the anti-angiogenic agent bevacizumab induced changes in the tumour microenvironment (i.e. more uniform distribution of vessels and less necrosis). Bevacizumab led to a more homogeneous distribution of paclitaxel and even though the total tumour paclitaxel concentration was lower, anti-tumour activity was greater [308]. In a comparable study, Torok et al. explored the effect of the intratumoural concentration and distribution of five receptor tyrosine kinase inhibitors on their anti-vascular and anti-tumour activities [309]. They demonstrated that limited tumour tissue drug penetration was the primary source of resistance to angiogenesis inhibitors. Both studies clearly show the impact of drug distribution on pharmacological responses and demonstrate the potential of MALDI-MSI to predict the efficacy of unlabelled small molecule drugs in malignant tissue.
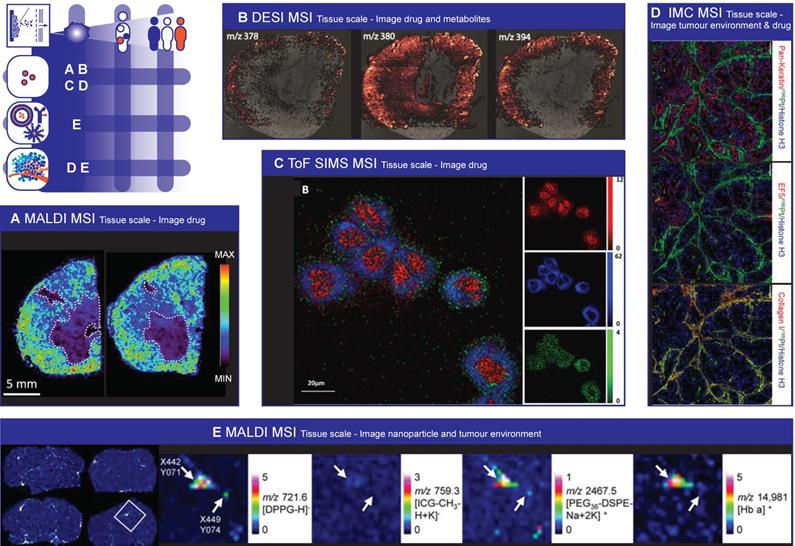
Mass Spectrometry Imaging to image spatial heterogeneity of nanomedicine. (A) Paclitaxel distribution by MALDI MSI. Necrotic areas, highlighted with dashed lines, are those were there is the lower drug signal. (Adapted with permission from [307], copyright 2016 Nature Research). (B) DESI image overlay representing the spatial distribution of the drug compound (m/z 378) and its most abundant metabolites (m/z 380 and 394) in a tissue section of a formalin fixed frozen rabbit kidney. (Adapted with permission from [313], copyright 2016 Springer US). (C) ToF SIMS 2D images of 3D data acquired in higher spatial resolution mode from HeLa cells completely consumed by the argon cluster source during analysis. The cells were incubated for 2 h with 9.7 nmol/mL amiodarone hydrochloride. Composite image where red represents ribose m/z 81, blue shows the signal from the phosphatidylcholine lipid fragment (m/z 184), and green shows the amiodarone signal, [M + H]+ (m/z 646). (Adapted with permission from [317], copyright 2017 American Chemical Society). (D) Cisplatin effects on tumour proliferation, DNA damage and cisplatin distribution in the tumour. Representative Pan-Keratin, EF5, Collagen I, 195Pt, and Histone H3 images of cisplatin-treated (40 mg/kg for 24 h) mice with OCIP28 patient derived xenografts. Scale bar = 100 μm. (Adapted with permission from [321], copyright 2016 Nature Research). (E) MALDI MSI images performed on brain slices of mice that were dosed with liposomes. Four images on the left: Half of the mice were perfused before being sacrificed (right panels) to reduce the remaining blood in the tissue. MALDI images of liposomal marker 1,2-dipalmitoyl-sn-glycero-3-phosphoglycerol (DPPG) and indocyanine green (ICG) were acquired in reflector negative ion mode, of PEG36-DSPE in reflector positive mode and of Hb α chain in linear positive mode. DPPG, ICG and 1,2-distearoyl-sn-glycero-3-phosphoethanolamine conjugated with monodisperse polyethylene glycol (PEG36-DSPE) were measured with 4-Phenyl-α-cyanocinnamic acid amide (PhCCAA) MALDI matrix. Hb was detected after delipidation and 2,5-dihydroxybenzoic acid (sDHB) deposition on the same tissue region. Magnifications: MALDI-MS images of the boxed parts marked in perfused brain in pixels indicated by an arrow shows the co-localisation of the liposomal components and hemoglobin at pixel X442 Y071 and the absence of HB at pixel X449 Y074. (Adapted with permission from [324], copyright 2016 Nature Research)
Unlike whole-body autoradiography, which is the standard for quantitative assessment of drug distribution, MSI can detect the parent drug and metabolites simultaneously in a single experiment, without having to label the drug [310, 311]. For example Liu et al. imaged the time-dependent and concentration-dependent permeability and metabolism of irinotecan in tumour organoids. They discovered that the active metabolite SN-38 did not co-localize well with the parent drug irinotecan and the inactive metabolite SN-38G, which may lead to therapy heterogeneity [312]. Bruinen et al. were able to find out using MALDI and DESI that precipitation of crystal-like structures in the cortex of rabbit kidney, which were assumed to cause the renal toxicity, were mainly composed of metabolites and relatively little parent drug (figure 3B) [313]. In another example, Groseclose et al. [314] reported on the nephrotoxicity of dabrafenib, an approved drug for treatment of specific tumours in adults. Pre-clinical studies showed renal pathogenesis due to obstructive nephropathy in juvenile rats. MSI allowed for spatial analysis of DAB and its metabolites and determination of the chemical composition of the renal deposits. It showed that the deposits were dabrafenib- and dabrafenib metabolite-free and they were merely composed of calcium phosphate. Hence a better risk assessment for pediatric treatment with dabrafenib was performed.
So far, MALDI-MSI cannot yet match the spatial resolution of established methods for intracellular imaging such electron microscopy. However, using SIMS it is possible to map the distribution of drugs within individual cells [315]. For example, SIMS was used to localize the drug amiodarone at therapeutic dosing concentrations in four different cell types (figure 3C) [316, 317]. SIMS was also employed to study the intracellular accumulation of two drugs (p-boronophenylalanine (BPA) and sodium borocaptate (BSH)) used for boron neutron capture therapy [318]. By labelling each drug with a different boron isotope (i.e. 10BPA and 11BSH), they were able to image the subcellular distribution of both drugs independently in the same cell. In a recent paper by Vanbellingen et al. the distribution of the B-cell lymphoma 2 (Bcl-2) inhibitor ABT-737 was studied in a treated A-172 human glioblastoma cell line [319]. They were able to visualize the drug and some endogenous markers on the (sub-)surface of the cells with high spatial (~250 nm) and high mass resolution (m/Δm ~10,000), and absence in the nucleus, confirming site of action.
An alternative and novel MSI technique for imaging drug distribution at subcellular resolution, the so-called imaging mass cytometry (IMC), was introduced in the life sciences by Giessen et al. in 2014 [320]. IMC is based on laser ablation inductively coupled plasma mass spectrometry (LA-ICP-MS), and provides capability to either analyse drugs containing metal ions, like e.g. cisplatin, or use antibodies labelled with a polymer containing (rare-earth) metals (e.g. Europium, Gadolinium, Gold, Platinum). Because these metals all have distinct isotopic patterns and are absent in biological specimens, they can be quantified with high precision. Next the use of laser ablation offers the possibility to excise tissue sample of (sub-)micron size, providing an order improved spatial resolution. Using this technique Chang et al. imaged the platinum distribution at subcellular resolution (1 µm) in patient-derived pancreatic cancer xenograft-bearing mice treated with cisplatin, revealing extensive binding of platinum to collagen fibres in both tumour and normal mouse tissues (Figure 3D) [321]. Theiner and coworkers also employed LA-ICP-MS to localize platinum in the kidney in mice treated with three different Pt-containing drugs. The imaging data revealed that the drugs were mostly located outside of the malignant parts of the samples. This clearly demonstrates that determining average Pt concentrations might overestimate drug uptake and cause misleading conclusions on therapy efficacy [322].
Imaging the nanoparticle
MSI also provides the opportunity to image nanocarriers, such as lipid- and metal-based nanoparticles. Typically nanoparticles are labelled or loaded with a radioactive or fluorescent probe in order to follow the in vivo fate after administration. However, this requires additional chemical development and the introduction of the probe may influence the biodistribution of the nanoparticle. Recently, Zandanel et al. showed that MALDI-MSI allows for the simultaneous visualization of the polymeric nanoparticle, the encapsulated drug (doxorubicin) and its metabolite (doxorubicinol) in treated mouse liver [323]. Unfortunately, they didn't show the co-localization of the nanoparticle and the drug in the same tissue section. Fülöp et al. exploited the multiplex nature of MSI even further by determining the spatial distribution and integrity of drug-loaded liposomes in tissue with a single label-free measurement [324]. By imaging two lipids (DPPG and PEG36-DSPE) incorporated in the liposomal bi-layer they were able to visualize the liposome distribution, and in addition they could interrogate the integrity of the liposomes by looking at the co-localization of the two lipid markers (figure 3E) [324]. Furthermore, they examined the presence of remaining blood in the same tissue slice by MALDI imaging of hemoglobin, which allowed determining the localization of the liposomes with respect to the blood vessels.
Xue et al. developed an MSI method that enabled not only the visualization, but also the quantification of the in situ drug (doxorubicin) release from molybdenum disulphide (MoS2) nanosheets [325]. The quantification of the drug release was done calculating the intensity ratios for doxorubicin and MoS2 signals. In two mouse tumour models (H22 and 4T1) they observed that the accumulation of drug-loaded MoS2 nanosheets was high in the spleen and liver, but the tumour tissue accumulation was much lower. However, the highest drug release from carriers was observed in tumour tissue, which was ascribed to higher drug dissociation extent due to the acidic tumour microenvironment.
Imaging the tumour environment
As indicated earlier, mass spectrometry offers unique capabilities for untargeted exploration of biological samples and provides simultaneous information of the distribution of the drug, the nanoparticle and endogenous compounds such as metabolites, lipids and proteins. Therefore, MSI can be used to detect biomarkers associated with disease, molecular changes due to drug treatment and tumour components limiting nanomedicine distribution and effect or augmenting off-target effects.
Several studies report that the heterogeneous distribution of lipids and proteins could reflect the effect of therapy and/or could be used as prognostic/predictive marker for outcome. A very nice example of identifying and using endogenous proteomic profiles for distinguishing between responders and non-responders to chemotherapy for oesophageal adenocarcinoma is given by Aichler et al. [326]. Here they selected a series of proteins in pre-therapeutic biopsies, which were identified through liquid chromatography mass spectrometry (LC-MS) analysis and investigated for functional relevance in-vitro. They identified a proteomic signature that was correlated with pre-existing defects in the mitochondrial respiratory chain complexes of cancer cells and was predictive for response to neoadjuvant cisplatin chemotherapy. Yanagisawa et al. reported for the first time in 2003 the ability of MALDI-MSI to generate proteomics patterns of tumour subsets in non-small-cell lung cancer [327]. They showed that protein profiles obtained from tumour tissue samples obtained during surgery could be used to accurately classify tumours and stratify patients into groups associated to poor or good prognosis. Bauer et al. employed MALDI-MSI to identify protein markers differentially expressed in tumour biopsies from patients displaying complete pathological response (pCR) and non-complete pathological response after neoadjuvant paclitaxel/radiation treatment for breast cancer [292]. Proteomic profiling of liver tissue using MALDI-MSI was also used to compare toxicity of hollow CuS nanoparticles and hollow gold nanospheres after intravenous administration in mice [328].
Also tumour hypoxia is investigated by many groups since it is associated with tumour aggressiveness and resistance to cancer treatment. Manscini et al. used MALDI-MSI to simultaneously detect pimonidazole, a clinically used hypoxia marker, its metabolites and associated biomolecules in a single experiment [329]. They detected several endogenous species that co-localized with the hypoxic regions. Interestingly, these identified species are known to be involved in hypoxia or metabolic reprogramming in cancer, although their specific roles remain to be elucidated. Masaki et al. studied the distribution of 18F-fluoromisonidazole (FMISO), a widely used PET hypoxia imaging probe [330]. The mass spectrometry images showed that FMISO and its metabolites were nearly homogenously distributed in the tumour and did not correlate with the radioactivity distribution. However, they identified a glutathione conjugate of amino-FMISO which did co-localise with the radioactive signals and was involved in FMISO accumulation in hypoxic tumour tissues.
Interestingly, most MSI studies that investigate drug distributions do not yet exploit the multiplex capabilities of MSI. Instead of using the wealth of information on endogenous molecule distributions (lipids, proteins, hemoglobin) already available in the acquired MSI image they superimpose the drug MSI images with standard H&E stained tissue images and/or various immunohistochemistry (IHC) images. As most of these IHC images are specific to a certain protein, this can be a laborious and time consuming effort. Moreover, correlating drug distribution with the distribution of these endogenous molecules would allow for non-supervised investigations to discover new factors that impair drug transport in tumour tissue and could be used as biomarker for prognosis and therapy response prediction.
Discussion/ Conclusion
Spatial heterogeneity in nanoparticle distribution occurs at all scales and can reduce nanotherapy efficacy. A wide range of imaging modalities help visualize nanoparticle distribution or factors contributing to heterogeneous distribution, by imaging the drug, the nanoparticle and the tumour environment.
Imaging scale
When selecting imaging modalities, researchers need to take into account the desired imaging scale. Non-invasive clinical imaging methods provide three-dimensional information of the intact body on patient, organ and tumour scale, and recent developments, such as super-resolution ultrasound, have broadened their application to provide even tissue scale information. Optical imaging modalities have a superior spatial resolution, procuring images on the tissue and cellular scale, and in the preclinical setting they can provide (sometimes non-invasive) organism and organ scale information as well. Besides that, in vivo applications and intravital techniques offer the possibility to visualize dynamic processes. Clinical use of optical imaging is still hampered by the limited penetration depth and therefore requires tissue sampling or intraoperative use. MSI provides information on tissue and even cellular scale. As it requires a tissue specimen it is inherently an invasive method, regardless of preclinical or clinical use. Due to this limitation, the technique is most suitable and currently most used in the preclinical setting, where an entire tumour or even the whole animal can be analysed at once. In contrast, in the clinic MSI approaches will most likely follow a workflow similar to standard histopathology. Emerging technologies allow for more accurate tissue sampling using intra-procedural multimodality imaging during biopsies [331, 332]. Whenever biopsies are used sampling error is a disadvantage (just as it is for histopathology evaluations) and the technique is therefore less suitable for imaging on organ or tumour scale. Nonetheless, implementation of MSI in clinical research (especially when tissue samples are collected anyway) is feasible and adds a wealth of molecule distribution data on tissue scale. As such, MSI is increasingly becoming an established tool in clinical and pharmaceutical studies.
Intrinsic versus extrinsic contrast
Nuclear imaging methods and most optical imaging methods require labelling of nanoparticles, drugs or aspects of the tumour environment, which has some disadvantages. First, the stability of the link between a label and a nanoparticle determines its usefulness in tracking the nanoparticle, for one could be imaging the label on itself after disconnection from the nanoparticle. Second, attaching a label could change the pharmacokinetic and drug release properties of the nanoparticle leading to erroneous prediction of the distribution of an unlabelled equivalent. Third, administering a labelled version of a previously approved therapeutic nanoparticle or drug could cause additional toxicity and obtaining clinical approval is cumbersome and costly. Fourth, administration of radiolabelled theranostic nanoparticles may decrease the effect of subsequent therapeutic administration through the ABC phenomenon [333]. MSI provides a label-free alternative to obtain detailed tissue and cellular scale information on drugs, nanoparticles and the tumour microenvironment simultaneously.
Multimodal imaging
The integration of imaging data collected from multimodality techniques offers a unique opportunity to combine information related to drug and nanoparticle distribution and tumour environment on multiple scales and provide synergistic advantages over the use of a single modality.
Clinical imaging modalities are generally combined to merge functional (SPECT, PET) with anatomical information (CT, MR) collected on the same scale. A range of nanoparticles for multimodality imaging have been developed [169, 196, 197, 334-336]. On tissue and cellular scale, successful examples have shown complementarity between optical imaging and MSI techniques [337]. Fluorescence and MSI have been combined to characterize local drug release and map unlabelled therapeutic drug distribution [311]. MSI enabled monitoring of the drug and related metabolites, which were impossible to differentiate with solely fluorescence. The combination of MSI and IMC with IHC and fluorescence in situ hybridization (FISH), creates a new dimension to molecular pathology. Now, drug levels within tumour regions can be correlated to different degrees of vascularization of the tumour - highlighted with specific vasculature staining [338]. One of the reported limitations is the impossibility to perform all analyses on the same tissue section. As a consequence and because a tumour is such a heterogeneous system, it is highly probable that two consecutive sections have different morphology / molecular content, which is then difficult to correlate accurately.
To achieve multiscale information, optical imaging and MSI have been paired with clinical imaging [59, 169, 183, 196, 197, 339]. Using dual fluorescent and MRI probes, the high sensitivity of fluorescent imaging is complemented with MRI's ability for deep-tissue penetration and high spatial and temporal resolution [340, 341].
A challenge remains the integration of molecular information provided by 2D / ex vivo MSI or optical imaging with 3D / in vivo images, such as those generated with SPECT, PET, CT or MRI. This challenge is inherent to the fact that the images are acquired at different scales, can be subjected to different deformations, and lack common fiducial markers. A first step towards combining two-dimensional MSI with three-dimensional MRI is the ability to monitor MRI contrast agents with MSI, which was demonstrated by Tata et al. [342]. They used DESI-MSI to monitor Gadoteridol, to characterize intratumoural heterogeneity and further guide delineation of tumour margins. Coregistration of MSI with other modalities is promising to bridge the gap between the different scales [343-347]. It is worth mentioning that the route towards user-friendly automated methods that are needed to integrate these methods in a routine (clinical) workflow is still long. Nonetheless, multiscale and multi-aspect (i.e. nanoparticle, drug and environment) data is believed to open new doors to improve the characterization of spatially heterogeneous distribution and heterogeneous effect and could greatly contribute in the development of new and more effective nanotherapies.
Role of imaging for clinical translation
Integration of imaging techniques in preclinical lab practice has contributed to an improved understanding of the in vivo behaviour of nanoparticles. Additionally, it has led to valuable information on how specific characteristics within the tumour environment can affect nanotherapy outcomes. Continued application of these imaging approaches, and especially the combination of different techniques, will further strengthen our understanding of therapy heterogeneity on organism, tissue, cellular and even subcellular scale. Meanwhile the role of imaging for monitoring PK and biodistribution is well established in research and development stage; however in the clinical setting it is not yet adopted. Clinically, spatial heterogeneity distribution of therapeutic nanoparticles, poses the threats of under- and overtreatment. Despite the fact that many studies have shown that drug concentration does not correspond with tissue drug levels, phase I and II clinical trials mainly rely on blood samples and spatially sparse biopsies to measure PK on patient scale and biodistribution on organ scale. Imaging drugs or nanoparticles in clinical studies is still rare and often no information is acquired about spatial heterogeneity of nanomedicine on organ, tumour or tissue scale. However imaging drug/nanoparticle distribution can help predict treatment effect and therefore select which patients will benefit most and in which patients a therapy adjustment or a combination therapy that reduces heterogeneity are warranted. Combining imaging of nanoparticle and drug distribution with imaging of tumour environment characteristics or early response indicators promises to help personalize treatment further. Currently, only optical imaging is commonly used to investigate, in the preclinical setting, the interplay between environment, nanoparticle and drug. It is our hope and recommendation that non-invasive clinical imaging and MSI will play a central role in future preclinical and clinical research on the interaction of drug, nanoparticle and environment. Choosing and combining imaging modalities wisely will lay the foundation for successful future nanotherapies.
Abbreviations
ABC: accelerated blood clearance; ADC: antibody-drug conjugate; ALK5: Activin receptor-like kinase 5; BLI: bioluminescence imaging; BOLD: blood oxygenation level dependent; BPA: p-boronophenylalanine; BSH: sodium borocaptate; CEUS: contrast-enhanced ultrasound; CLSM: confocal laser scanning microscopy; CT: computed tomography; DCE: dynamic contrast enhanced; DESI: desorption electro spray ionisation; DPPG: 1,2-dipalmitoyl-sn-glycero-3-phosphoglycerol; DTPA: diethylenetriaminepentaacetic acid; DWI: diffusion weighted imaging; EGFR: epidermal growth factor receptor; EM: electron microscopy; EPR: enhanced permeability and retention; FDG: 8F-fluorodeoxyglucose; fDOT: fluorescence diffuse optical tomography; FES: 18F-fluoroestradiol; FISH: fluorescence in situ hybridization; FLI: fluorescence imaging; FLT: 18F-fluorothymidine; F-MISO: 18F-fluoromisonidazole; FMT-CT: fluorescence molecular tomography hybridized with computed tomography; FMT: fluorescence-mediated molecular tomography; FMX: feromoxytol; GFP: green fluorescent protein; Hb: haemoglobin; HER2: human epidermal growth factor receptor 2; HPLC: high performance liquid chromatography; ICG: indocyanine green; IFP: interstitial fluid pressure; IHC: immunohistochemistry; IVM: intravital microscopy; LA-ICP-MS: laser ablation inductively coupled plasma mass spectrometry; LC-MS: liquid chromatography mass spectrometry; IMC: imaging mass cytometry; MALDI: matrix assisted laser desorption ionisation; MPM: multiphoton microscopy; MPS: mononuclear phagocyte system; MR-HIFU: magnetic resonance guided high intensity focused ultrasound; MR-LINAC: magnetic resonance linear accelerator; MRI: magnetic resonance imaging; MSI: mass spectrometry imaging; MSOT: multispectral optoacoustic tomography; MTV: metabolic tumour volume; NIR: near-infrared; PDT: photodynamic therapy; PEG: polyethylene glycol; PEG36-DSPE: 1,2-distearoyl-sn-glycero-3-phosphoethanolamine conjugated with monodisperse polyethylene glycol; PET: positron emission tomography; PhCCAA: 4-Phenyl-α-cyanocinnamic acid amide; PK: pharmacokinetics; PL: photoluminescence; PLGA-PEG: poly(D,L-lactic-co-glycolic acid)-b-polyethylene glycol; PSMA: prostate specific membrane antigen; PTT: photothermal therapy; RGD: arginylglycylaspartic acid; sDHB: 2,5-dihydroxybenzoic acid; siRNA: small interfering ribonucleic acid; SIMS: secondary ion mass spectrometry; SPECT: single-photon emission computed tomography; SPION: superparamagnetic iron oxide particles; SUVmax: maximum standardized uptake values; SUVpeak: peak standardized uptake values; TAM: tumour associated macrophages; TMR: tetramethylrhodamine; TOF: time of flight; T-DM1: trastuzumab-emtansine; TLG: total lesion glycolysis; TNF: tumour necrosis factor; TOLD: tissue oxygenation level dependent; US: ultrasound; VCAM-1: vascular cell adhesion molecule 1; VEGF: vascular endothelial growth factor.
Acknowledgements
J.S.d.M and R.D, are supported by a Dutch Cancer Society (KWF) grant (UU 2015-7891) and a Vrienden UMC Utrecht project ('opereren zonder snijden'). A.M.S. is supported by a PhD stipend (90062100) and a travel grant (90284100) from the Central Norway Regional Health Authority “Helse Midt-Norge”. T.P.S. and R.J.V. acknowledge the M4I institute and financial support of the Dutch Province of Limburg through the LINK programme.
Competing Interests
The authors have declared that no competing interest exists.
References
1. Global Burden of Disease Cancer Collaboration, Fitzmaurice C, Allen C, Barber RM, Barregard L, Bhutta ZA. et al. Global, Regional, and National Cancer Incidence, Mortality, Years of Life Lost, Years Lived With Disability, and Disability-Adjusted Life-years for 32 Cancer Groups, 1990 to 2015: A Systematic Analysis for the Global Burden of Disease Study. JAMA Oncol. 2017;3:524-48
2. Cros J, Raffenne J, Couvelard A, Pote N. Tumor Heterogeneity in Pancreatic Adenocarcinoma. Pathobiology. 2018;85:64-71
3. Marusyk A, Almendro V, Polyak K. Intra-tumour heterogeneity: a looking glass for cancer? Nat Rev Cancer. 2012;12:323-34
4. Andor N, Graham TA, Jansen M, Xia LC, Aktipis CA, Petritsch C. et al. Pan-cancer analysis of the extent and consequences of intratumor heterogeneity. Nat Med. 2016;22:105-13
5. Jamal-Hanjani M, Quezada SA, Larkin J, Swanton C. Translational implications of tumor heterogeneity. Clin Cancer Res. 2015;21:1258-66
6. Nassar A, Radhakrishnan A, Cabrero IA, Cotsonis GA, Cohen C. Intratumoral Heterogeneity of Immunohistochemical Marker Expression in Breast Carcinoma A Tissue Microarray-based Study. Appl Immunohistochem Mol Morphol. 2010;18:433-41
7. Zhang J, Fujimoto J, Zhang J, Wedge DC, Song X, Zhang J. et al. Intratumor heterogeneity in localized lung adenocarcinomas delineated by multiregion sequencing. Science. 2014;346:256-9
8. Gerlinger M, Catto JW, Orntoft TF, Real FX, Zwarthoff EC, Swanton C. Intratumour heterogeneity in urologic cancers: from molecular evidence to clinical implications. Eur Urol. 2015;67:729-37
9. Grzywa TM, Paskal W, Wlodarski PK. Intratumor and Intertumor Heterogeneity in Melanoma. Transl Oncol. 2017;10:956-75
10. Liu J, Dang H, Wang XW. The significance of intertumor and intratumor heterogeneity in liver cancer. Exp Mol Med. 2018;50:e416
11. Rybinski B, Yun K. Addressing intra-tumoral heterogeneity and therapy resistance. Oncotarget. 2016;7:72322-42
12. Dzobo K, Senthebane DA, Thomford NE, Rowe A, Dandara C, Parker MI. Not Everyone Fits the Mold: Intratumor and Intertumor Heterogeneity and Innovative Cancer Drug Design and Development. OMICS. 2018;22:17-34
13. Saunders NA, Simpson F, Thompson EW, Hill MM, Endo-Munoz L, Leggatt G. et al. Role of intratumoural heterogeneity in cancer drug resistance: molecular and clinical perspectives. EMBO Mol Med. 2012;4:675-84
14. Dagogo-Jack I, Shaw AT. Tumour heterogeneity and resistance to cancer therapies. Nat Rev Clin Oncol. 2018;15:81-94
15. Maley CC, Galipeau PC, Finley JC, Wongsurawat VJ, Li X, Sanchez CA. et al. Genetic clonal diversity predicts progression to esophageal adenocarcinoma. Nat Genet. 2006;38:468-73
16. Park SY, Gonen M, Kim HJ, Michor F, Polyak K. Cellular and genetic diversity in the progression of in situ human breast carcinomas to an invasive phenotype. J Clin Invest. 2010;120:636-44
17. Jamal-Hanjani M, Wilson GA, McGranahan N, Birkbak NJ, Watkins TBK, Veeriah S. et al. Tracking the Evolution of Non-Small-Cell Lung Cancer. N Engl J Med. 2017;376:2109-21
18. Garattini S, Fuso Nerini I, D'Incalci M. Not only tumor but also therapy heterogeneity. Ann Oncol. 2018;29:13-8
19. Tredan O, Galmarini CM, Patel K, Tannock IF. Drug resistance and the solid tumor microenvironment. J Natl Cancer Inst. 2007;99:1441-54
20. Minchinton AI, Tannock IF. Drug penetration in solid tumours. Nat Rev Cancer. 2006;6:583-92
21. Allen TM, Cullis PR. Drug delivery systems: entering the mainstream. Science. 2004;303:1818-22
22. Lammers T, Hennink WE, Storm G. Tumour-targeted nanomedicines: principles and practice. Br J Cancer. 2008;99:392-7
23. Matsumura Y, Maeda H. A new concept for macromolecular therapeutics in cancer chemotherapy: mechanism of tumoritropic accumulation of proteins and the antitumor agent smancs. Cancer Research. 1986;46:6387-92
24. Maeda H. Macromolecular therapeutics in cancer treatment: the EPR effect and beyond. J Control Release. 2012;164:138-44
25. Arranja AG, Pathak V, Lammers T, Shi Y. Tumor-targeted nanomedicines for cancer theranostics. Pharmacol Res. 2017;115:87-95
26. Rosenblum D, Joshi N, Tao W, Karp JM, Peer D. Progress and challenges towards targeted delivery of cancer therapeutics. Nat Commun. 2018;9:1410
27. Caron WP, Song G, Kumar P, Rawal S, Zamboni WC. Interpatient pharmacokinetic and pharmacodynamic variability of carrier-mediated anticancer agents. Clin Pharmacol Ther. 2012;91:802-12
28. Schell RF, Sidone BJ, Caron WP, Walsh MD, White TF, Zamboni BA. et al. Meta-analysis of inter-patient pharmacokinetic variability of liposomal and non-liposomal anticancer agents. Nanomedicine. 2014;10:109-17
29. Dobrovolskaia MA, Aggarwal P, Hall JB, McNeil SE. Preclinical studies to understand nanoparticle interaction with the immune system and its potential effects on nanoparticle biodistribution. Mol Pharm. 2008;5:487-95
30. Yuan D, He H, Wu Y, Fan J, Cao Y. Physiologically Based Pharmacokinetic Modeling of Nanoparticles. J Pharm Sci. 2019;108:58-72
31. Wu H, Ramanathan RK, Zamboni BA, Strychor S, Ramalingam S, Edwards RP. et al. Population pharmacokinetics of pegylated liposomal CKD-602 (S-CKD602) in patients with advanced malignancies. J Clin Pharmacol. 2012;52:180-94
32. Abu Lila AS, Kiwada H, Ishida T. The accelerated blood clearance (ABC) phenomenon: clinical challenge and approaches to manage. J Control Release. 2013;172:38-47
33. Yokoi K, Tanei T, Godin B, van de Ven AL, Hanibuchi M, Matsunoki A. et al. Serum biomarkers for personalization of nanotherapeutics-based therapy in different tumor and organ microenvironments. Cancer Lett. 2014;345:48-55
34. Parodi A, Rudzinska M, Deviatkin AA, Soond SM, Baldin AV, Zamyatnin AA Jr. Established and Emerging Strategies for Drug Delivery Across the Blood-Brain Barrier in Brain Cancer. Pharmaceutics. 2019:11
35. Lafond M, Aptel F, Mestas JL, Lafon C. Ultrasound-mediated ocular delivery of therapeutic agents: a review. Expert Opin Drug Deliv. 2017;14:539-50
36. Natfji AA, Ravishankar D, Osborn HMI, Greco F. Parameters Affecting the Enhanced Permeability and Retention Effect: The Need for Patient Selection. J Pharm Sci. 2017;106:3179-87
37. Nichols JW, Bae YH. EPR: Evidence and fallacy. J Control Release. 2014;190:451-64
38. Jain RK, Stylianopoulos T. Delivering nanomedicine to solid tumors. Nat Rev Clin Oncol. 2010;7:653-64
39. Danhier F. To exploit the tumor microenvironment: Since the EPR effect fails in the clinic, what is the future of nanomedicine? J Control Release. 2016;244:108-21
40. Dou YN, Chaudary N, Chang MC, Dunne M, Huang H, Jaffray DA. et al. Tumor microenvironment determines response to a heat-activated thermosensitive liposome formulation of cisplatin in cervical carcinoma. J Control Release. 2017;262:182-91
41. Lee H, Hoang B, Fonge H, Reilly RM, Allen C. In vivo distribution of polymeric nanoparticles at the whole-body, tumor, and cellular levels. Pharm Res. 2010;27:2343-55
42. Bobo D, Robinson KJ, Islam J, Thurecht KJ, Corrie SR. Nanoparticle-Based Medicines: A Review of FDA-Approved Materials and Clinical Trials to Date. Pharm Res. 2016;33:2373-87
43. Giodini L, Re FL, Campagnol D, Marangon E, Posocco B, Dreussi E. et al. Nanocarriers in cancer clinical practice: a pharmacokinetic issue. Nanomedicine. 2017;13:583-99
44. Park K. Facing the truth about nanotechnology in drug delivery. ACS Nano. 2013;7:7442-7
45. Maeda H, Khatami M. Analyses of repeated failures in cancer therapy for solid tumors: poor tumor-selective drug delivery, low therapeutic efficacy and unsustainable costs. Clin Transl Med. 2018;7:11
46. Hare JI, Lammers T, Ashford MB, Puri S, Storm G, Barry ST. Challenges and strategies in anti-cancer nanomedicine development: An industry perspective. Adv Drug Deliv Rev. 2017;108:25-38
47. Blocker SJ, Shields AF. Imaging of Nanoparticle Distribution to Assess Treatments That Alter Delivery. Mol Imaging Biol. 2018;20:340-51
48. Golombek SK, May JN, Theek B, Appold L, Drude N, Kiessling F. et al. Tumor targeting via EPR: Strategies to enhance patient responses. Adv Drug Deliv Rev. 2018;130:17-38
49. Arms L, Smith DW, Flynn J, Palmer W, Martin A, Woldu A. et al. Advantages and Limitations of Current Techniques for Analyzing the Biodistribution of Nanoparticles. Front Pharmacol. 2018;9:802
50. Dearling JLJ, Packard AB. Molecular imaging in nanomedicine - A developmental tool and a clinical necessity. J Control Release. 2017;261:23-30
51. Chakravarty R, Goel S, Dash A, Cai W. Radiolabeled inorganic nanoparticles for positron emission tomography imaging of cancer: an overview. Q J Nucl Med Mol Imaging. 2017;61:181-204
52. Chakravarty R, Hong H, Cai W. Image-Guided Drug Delivery with Single-Photon Emission Computed Tomography: A Review of Literature. Curr Drug Targets. 2015;16:592-609
53. Miller MA, Arlauckas S, Weissleder R. Prediction of Anti-cancer Nanotherapy Efficacy by Imaging. Nanotheranostics. 2017;1:296-312
54. Ehlerding EB, Grodzinski P, Cai W, Liu CH. Big Potential from Small Agents: Nanoparticles for Imaging-Based Companion Diagnostics. ACS Nano. 2018;12:2106-21
55. Spence T, De Souza R, Dou Y, Stapleton S, Reilly RM, Allen C. Integration of imaging into clinical practice to assess the delivery and performance of macromolecular and nanotechnology-based oncology therapies. J Control Release. 2015;219:295-312
56. Kunjachan S, Ehling J, Storm G, Kiessling F, Lammers T. Noninvasive Imaging of Nanomedicines and Nanotheranostics: Principles, Progress, and Prospects. Chem Rev. 2015;115:10907-37
57. Man F, Lammers T, R TMdR. Imaging Nanomedicine-Based Drug Delivery: a Review of Clinical Studies. Mol Imaging Biol. 2018;20:683-95
58. Deleye S, Van Holen R, Verhaeghe J, Vandenberghe S, Stroobants S, Staelens S. Performance evaluation of small-animal multipinhole muSPECT scanners for mouse imaging. Eur J Nucl Med Mol Imaging. 2013;40:744-58
59. Wang JT, Rubio N, Kafa H, Venturelli E, Fabbro C, Menard-Moyon C. et al. Kinetics of functionalised carbon nanotube distribution in mouse brain after systemic injection: Spatial to ultra-structural analyses. J Control Release. 2016;224:22-32
60. Molina-Garcia D, Garcia-Vicente AM, Perez-Beteta J, Amo-Salas M, Martinez-Gonzalez A, Tello-Galan MJ. et al. Intratumoral heterogeneity in (18)F-FDG PET/CT by textural analysis in breast cancer as a predictive and prognostic subrogate. Ann Nucl Med. 2018;32:379-88
61. Song H, Jiao Y, Wei W, Ren X, Shen C, Qiu Z. et al. Can pretreatment (18)F-FDG PET tumor texture features predict the outcomes of osteosarcoma treated by neoadjuvant chemotherapy? Eur Radiol. 2019;29:3945-54
62. Yoon HJ, Kim Y, Chung J, Kim BS. Predicting neo-adjuvant chemotherapy response and progression-free survival of locally advanced breast cancer using textural features of intratumoral heterogeneity on F-18 FDG PET/CT and diffusion-weighted MR imaging. Breast J. 2019;25:373-80
63. Yoon SH, Kim YH, Lee YJ, Park J, Kim JW, Lee HS. et al. Tumor Heterogeneity in Human Epidermal Growth Factor Receptor 2 (HER2)-Positive Advanced Gastric Cancer Assessed by CT Texture Analysis: Association with Survival after Trastuzumab Treatment. PLoS One. 2016;11:e0161278
64. Lopez-Berestein G, Kasi L, Rosenblum MG, Haynie T, Jahns M, Glenn H. et al. Clinical pharmacology of 99mTc-labeled liposomes in patients with cancer. Cancer Res. 1984;44:375-8
65. Koukourakis M, Koukouraki S, Giatromanolaki A, Kakolyris S, Georgoulias V, Velidaki A. et al. High intratumoral accumulation of stealth liposomal doxorubicin in sarcomas-rationale for combination with radiotherapy. Acta Oncol. 2000;39:2017-11
66. Seymour LW, Ferry DR, Anderson D. et al. Hepatic Drug Targeting: Phase I Evaluation of Polymer-Bound Doxorubicin. J Clin Oncol. 2002;20:1668-76
67. Geretti E, Leonard SC, Dumont N, Lee H, Zheng J, De Souza R. et al. Cyclophosphamide-Mediated Tumor Priming for Enhanced Delivery and Antitumor Activity of HER2-Targeted Liposomal Doxorubicin (MM-302). Mol Cancer Ther. 2015;14:2060-71
68. Head HWDIGD, Bao A, Garcia-Rojas X, Prihoda TJ, McManus LM, Goins BA. et al. Combination Radiofrequency Ablation and Intravenous Radiolabeled Liposomal Doxorubicin: Imaging and Quantifi cation of Increased Drug Delivery to Tumors. Radiology. 2010;255:405-14
69. Lee H, Shields AF, Siegel BA, Miller KD, Krop I, Ma CX. et al. (64)Cu-MM-302 Positron Emission Tomography Quantifies Variability of Enhanced Permeability and Retention of Nanoparticles in Relation to Treatment Response in Patients with Metastatic Breast Cancer. Clin Cancer Res. 2017;23:4190-202
70. Miedema IHC, Zwezerijnen GJC, Oprea-Lager DE, Verheul HMW, Vugts DJ, Huisman MC. et al. First-in-human imaging of nanoparticle entrapped docetaxel (CPC634) in patients with advanced solid tumors using 89Zr-Df-CPC634 PET/CT. J Clin Oncol. 2019;37:suppl abstr 3093
71. Wong PK, Lee ST, Murone C, Eng J, Lawrentschuk N, Berlangieri SU. et al. In vivo imaging of cellular proliferation in renal cell carcinoma using 18F-fluorothymidine PET. Asia Oceania J Nucl Med Biol. 2014;2:3-11
72. Shen G, Ma H, Pang F, Ren P, Kuang A. Correlations of 18F-FDG and 18F-FLT uptake on PET with Ki-67 expression in patients with lung cancer: a meta-analysis. Acta Radiologica. 2017;59:188-95
73. Wieder H, Beer AJ, Siveke J, Schuster T, Buck AK, Herrmann K. et al. 18F-fluorothymidine PET for predicting survival in patients with resectable pancreatic cancer. Oncotarget. 2018;9:10128-34
74. Rajendran JG, Krohn KA. F-18 fluoromisonidazole for imaging tumor hypoxia: imaging the microenvironment for personalized cancer therapy. Semin Nucl Med. 2015;45:151-62
75. Andrzejewski P, Wengert G, Helbich TH, Magometschnigg H, Georg D, Hacker M. et al. Sequential [(18)F]FDG-[(18)F]FMISO PET and Multiparametric MRI at 3T for Insights into Breast Cancer Heterogeneity and Correlation with Patient Outcomes: First Clinical Experience. Contrast Media Mol Imaging. 2019;2019:1307247
76. Cheng G. Non-Small-Cell Lung Cancer PET Imaging Beyond F18 Fluorodeoxyglucose. PET Clin. 2018;13:73-81
77. Nagengast WB, Hooge MN, van Straten EM, Kruijff S, Brouwers AH, den Dunnen WF. et al. VEGF-SPECT with (1)(1)(1)In-bevacizumab in stage III/IV melanoma patients. Eur J Cancer. 2011;47:1595-602
78. Kurland BF, Peterson LM, Lee JH, Schubert EK, Currin ER, Link JM. et al. Estrogen Receptor Binding (18F-FES PET) and Glycolytic Activity (18F-FDG PET) Predict Progression-Free Survival on Endocrine Therapy in Patients with ER+ Breast Cancer. Clin Cancer Res. 2017;23:407-15
79. Yang Z, Sun Y, Xu X, Zhang Y, Zhang J, Xue J. et al. The Assessment of Estrogen Receptor Status and Its Intratumoral Heterogeneity in Patients With Breast Cancer by Using 18F-Fluoroestradiol PET/CT. Clin Nucl Med. 2017;42:421-7
80. Henry KE, Ulaner GA, Lewis JS. Human Epidermal Growth Factor Receptor 2-Targeted PET/Single- Photon Emission Computed Tomography Imaging of Breast Cancer: Noninvasive Measurement of a Biomarker Integral to Tumor Treatment and Prognosis. PET Clin. 2017;12:269-88
81. Xiao Z, Song Y, Kai W, Sun X, Shen B. Evaluation of 99mTc-HYNIC-MPG as a novel SPECT radiotracer to detect EGFR-activating mutations in NSCLC. Oncotarget. 2017;8:40732-40
82. Schwarzenboeck SM, Rauscher I, Bluemel C, Fendler WP, Rowe SP, Pomper MG. et al. PSMA Ligands for PET Imaging of Prostate Cancer. J Nucl Med. 2017;58:1545-52
83. Pozzo L, Monteiro LR, Cerci JJ, Fanti S, Negro A, Trindade E. HTA in nuclear medicine: [68Ga]PSMA PET/CT for patients with prostate cancer. ClinTransl Imaging. 2019;7:7-20
84. Cuccurullo V, Prisco MR, Di Stasio GD, Mansi L. Nuclear Medicine in Patients with NET: Radiolabeled Somatostatin Analogues and their Brothers. Curr Radiopharm. 2017;10:74-84
85. Werner RA, Bluemel C, Lassmann M, Kudlich T, Higuchi T, Lopci E. et al. SPECT- and PET-Based Patient-Tailored Treatment in Neuroendocrine Tumors. Clinical Nuclear Medicine. 2015;40:e271-e7
86. Gebhart G, Lamberts LE, Wimana Z, Garcia C, Emonts P, Ameye L. et al. Molecular imaging as a tool to investigate heterogeneity of advanced HER2-positive breast cancer and to predict patient outcome under trastuzumab emtansine (T-DM1): the ZEPHIR trial. Ann Oncol. 2016;27:619-24
87. Baker JHE, Lindquist KE, Huxham LA, Kyle AH, Sy JT, Minchinton AI. Direct Visualization of Heterogeneous Extravascular Distribution of Trastuzumab in Human Epidermal Growth Factor Receptor Type 2 Overexpressing Xenografts. Clin Cancer Res. 2008;14:2171-9
88. Zhang F, Ni Q, Jacobson O, Cheng S, Liao A, Wang Z. et al. Polymeric Nanoparticles with a Glutathione-Sensitive Heterodimeric Multifunctional Prodrug for In vivo Drug Monitoring and Synergistic Cancer Therapy. Angew Chem Int Ed Engl. 2018;57:7066-70
89. Lamichhane N, Dewkar GK, Sundaresan G, Mahon RN, Zweit J. [(18)F]-Fluorinated Carboplatin and [(111)In]-Liposome for Image-Guided Drug Delivery. Int J Mol Sci. 2017;18:1079
90. Lagendijk JJ, Raaymakers BW, Raaijmakers AJ, Overweg J, Brown KJ, Kerkhof EM. et al. MRI/linac integration. Radiother Oncol. 2008;86:25-9
91. Hectors SJ, Jacobs I, Moonen CT, Strijkers GJ, Nicolay K. MRI methods for the evaluation of high intensity focused ultrasound tumor treatment: Current status and future needs. Magn Reson Med. 2016;75:302-17
92. Jolesz FA. MRI-guided focused ultrasound surgery. Annu Rev Med. 2009;60:417-30
93. Reeβing F, Szymanski W. Following nanomedicine activation with magnetic resonance imaging: why, how, and what's next? Curr Opin Biotechnol. 2018;58:9-18
94. O'Connor JP, Jackson A, Parker GJ, Roberts C, Jayson GC. Dynamic contrast-enhanced MRI in clinical trials of antivascular therapies. Nat Rev Clin Oncol. 2012;9:167-77
95. Li W, Quan YY, Li Y, Lu L, Cui M. Monitoring of tumor vascular normalization: the key points from basic research to clinical application. Cancer Manag Res. 2018;10:4163-72
96. Baker JHE, Kyle AH, Reinsberg SA, Moosvi F, Patrick HM, Cran J. et al. Heterogeneous distribution of trastuzumab in HER2-positive xenografts and metastases: role of the tumor microenvironment. Clin Exp Metastasis. 2018;35:691-705
97. Minowa T, Kawano K, Kuribayashi H, Shiraishi K, Sugino T, Hattori Y. et al. Increase in tumour permeability following TGF-beta type I receptor-inhibitor treatment observed by dynamic contrast-enhanced MRI. Br J Cancer. 2009;101:1884-90
98. Guo Y, Cai YQ, Cai ZL, Gao YG, An NY, Ma L. et al. Differentiation of clinically benign and malignant breast lesions using diffusion-weighted imaging. J Magn Reson Imaging. 2002;16:172-8
99. Yin Y, Sedlaczek O, Muller B, Warth A, Gonzalez-Vallinas M, Lahrmann B. et al. Tumor Cell Load and Heterogeneity Estimation From Diffusion-Weighted MRI Calibrated With Histological Data: an Example From Lung Cancer. IEEE Trans Med Imaging. 2018;37:35-46
100. Jiang L, Weatherall PT, McColl RW, Tripathy D, Mason RP. Blood oxygenation level-dependent (BOLD) contrast magnetic resonance imaging (MRI) for prediction of breast cancer chemotherapy response: a pilot study. J Magn Reson Imaging. 2013;37:1083-92
101. Bane O, Besa C, Wagner M, Oesingmann N, Zhu H, Fiel MI. et al. Feasibility and reproducibility of BOLD and TOLD measurements in the liver with oxygen and carbogen gas challenge in healthy volunteers and patients with hepatocellular carcinoma. J Magn Reson Imaging. 2016;43:866-76
102. Brownlee WJ, Seib FP. Impact of the hypoxic phenotype on the uptake and efflux of nanoparticles by human breast cancer cells. Sci Rep. 2018;8:12318
103. Wu M, Huang S. Magnetic nanoparticles in cancer diagnosis, drug delivery and treatment. Mol Clin Oncol. 2017;7:738-46
104. Ramanathan RK, Korn RL, Raghunand N, Sachdev JC, Newbold RG, Jameson G. et al. Correlation between Ferumoxytol Uptake in Tumor Lesions by MRI and Response to Nanoliposomal Irinotecan in Patients with Advanced Solid Tumors: A Pilot Study. Clin Cancer Res. 2017;23:3638-48
105. Hsu FT, Liu HS, Ali AAA, Tsai PH, Kao YC, Lu CF. et al. Assessing the selective therapeutic efficacy of superparamagnetic erlotinib nanoparticles in lung cancer by using quantitative magnetic resonance imaging and a nuclear factor kappa-B reporter gene system. Nanomedicine. 2018;14:1019-31
106. Langereis S, Geelen T, Grull H, Strijkers GJ, Nicolay K. Paramagnetic liposomes for molecular MRI and MRI-guided drug delivery. NMR Biomed. 2013;26:728-44
107. Zeng L, Wu D, Zou R, Chen T, Zhang J, Wu A. Paramagnetic and Superparamagnetic Inorganic Nanoparticles for T1-Weighted Magnetic Resonance Imaging. Curr Med Chem. 2018;25:2970-86
108. Nitta N, Takakusagi Y, Kokuryo D, Shibata S, Tomita A, Higashi T. et al. Intratumoral evaluation of 3D microvasculature and nanoparticle distribution using a gadolinium-dendron modified nano-liposomal contrast agent with magnetic resonance micro-imaging. Nanomedicine. 2018;14:1315-24
109. Manzoor AA, Lindner LH, Landon CD, Park JY, Simnick AJ, Dreher MR. et al. Overcoming limitations in nanoparticle drug delivery: triggered, intravascular release to improve drug penetration into tumors. Cancer Res. 2012;72:5566-75
110. Onuki Y, Jacobs I, Artemov D, Kato Y. Noninvasive visualization of in vivo release and intratumoral distribution of surrogate MR contrast agent using the dual MR contrast technique. Biomaterials. 2010;31:7132-8
111. Yeo SY, de Smet M, Langereis S, Vander Elst L, Muller RN, Grull H. Temperature-sensitive paramagnetic liposomes for image-guided drug delivery: Mn(2+) versus [Gd(HPDO3A)(H2O)]. Biochim Biophys Acta. 2014;1838:2807-16
112. Koay EJ, Truty MJ, Cristini V, Thomas RM, Chen R, Chatterjee D. et al. Transport properties of pancreatic cancer describe gemcitabine delivery and response. J Clin Invest. 2014;124:1525-36
113. Lee N, Choi SH, Hyeon T. Nano-sized CT contrast agents. Adv Mater. 2013;25:2641-60
114. Cormode DP, Naha PC, Fayad ZA. Nanoparticle contrast agents for computed tomography: a focus on micelles. Contrast Media Mol Imaging. 2014;9:37-52
115. Ekdawi SN, Stewart JM, Dunne M, Stapleton S, Mitsakakis N, Dou YN. et al. Spatial and temporal mapping of heterogeneity in liposome uptake and microvascular distribution in an orthotopic tumor xenograft model. J Control Release. 2015;207:101-11
116. Badea CT, Clark DP, Holbrook M, Srivastava M, Mowery Y, Ghaghada KB. Functional imaging of tumor vasculature using iodine and gadolinium-based nanoparticle contrast agents: a comparison of spectral micro-CT using energy integrating and photon counting detectors. Phys Med Biol. 2019;64:065007
117. Stapleton S, Allen C, Pintilie M, Jaffray DA. Tumor perfusion imaging predicts the intra-tumoral accumulation of liposomes. J Control Release. 2013;172:351-7
118. Stapleton S, Milosevic M, Tannock IF, Allen C, Jaffray DA. The intra-tumoral relationship between microcirculation, interstitial fluid pressure and liposome accumulation. J Control Release. 2015;211:163-70
119. Anderson NG, Butler AP. Clinical applications of spectral molecular imaging: potential and challenges. Contrast Media Mol Imaging. 2014;9:3-12
120. Lv P, Liu J, Yan X, Chai Y, Chen Y, Gao J. et al. CT spectral imaging for monitoring the therapeutic efficacy of VEGF receptor kinase inhibitor AG-013736 in rabbit VX2 liver tumours. Eur Radiol. 2017;27:918-26
121. Chen XH, Ren K, Liang P, Chai YR, Chen KS, Gao JB. Spectral computed tomography in advanced gastric cancer: Can iodine concentration non-invasively assess angiogenesis? World J Gastroenterol. 2017;23:1666-75
122. Guo J, Rahme K, He Y, Li LL, Holmes JD, O'Driscoll CM. Gold nanoparticles enlighten the future of cancer theranostics. Int J Nanomedicine. 2017;12:6131-52
123. Mao W, Kim HS, Son YJ, Kim SR, Yoo HS. Doxorubicin encapsulated clicked gold nanoparticle clusters exhibiting tumor-specific disassembly for enhanced tumor localization and computerized tomographic imaging. J Control Release. 2018;269:52-62
124. Hu X, Sun J, Li F, Li R, Wu J, He J. et al. Renal-Clearable Hollow Bismuth Subcarbonate Nanotubes for Tumor Targeted Computed Tomography Imaging and Chemoradiotherapy. Nano Lett. 2018;18:1196-204
125. Leen E, Averkiou M, Arditi M, Burns P, Bokor D, Gauthier T. et al. Dynamic contrast enhanced ultrasound assessment of the vascular effects of novel therapeutics in early stage trials. Eur Radiol. 2012;22:1442-50
126. Schinkel AF, Kaspar M, Staub D. Contrast-enhanced ultrasound: clinical applications in patients with atherosclerosis. Int J Cardiovasc Imaging. 2016;32:35-48
127. Hoyt K, Umphrey H, Lockhart M, Robbin M, Forero-Torres A. Ultrasound imaging of breast tumor perfusion and neovascular morphology. Ultrasound Med Biol. 2015;41:2292-302
128. Chen M, Wang WP, Jia WR, Tang L, Wang Y, Zhan WW. et al. Three-dimensional contrast-enhanced sonography in the assessment of breast tumor angiogenesis: correlation with microvessel density and vascular endothelial growth factor expression. J Ultrasound Med. 2014;33:835-46
129. Lassau N, Bonastre J, Kind M, Vilgrain V, Lacroix J, Cuinet M. et al. Validation of dynamic contrast-enhanced ultrasound in predicting outcomes of antiangiogenic therapy for solid tumors. Invest Radiol. 2014;49:794-800
130. Panfilova A, Shelton SE, Caresio C, van Sloun RJG, Molinari F, Wijkstra H. et al. On the Relationship between Dynamic Contrast-Enhanced Ultrasound Parameters and the Underlying Vascular Architecture Extracted from Acoustic Angiography. Ultrasound Med Biol. 2019;45:539-48
131. Hudson JM, Williams R, Karshafian R, Milot L, Atri M, Burns PN. et al. Quantifying vascular heterogeneity using microbubble disruption-replenishment kinetics in patients with renal cell cancer. Invest Radiol. 2014;49:116-23
132. Theek B, Gremse F, Kunjachan S, Fokong S, Pola R, Pechar M. et al. Characterizing EPR-mediated passive drug targeting using contrast-enhanced functional ultrasound imaging. J Control Release. 2014;182:83-9
133. Rojas JD, Dayton PA. In vivo Molecular Imaging Using Low-Boiling-Point Phase-Change Contrast Agents: A Proof of Concept Study. Ultrasound Med Biol. 2019;45:177-91
134. Zheng X, Goins BA, Cameron IL, Santoyo C, Bao A, Frohlich VC. et al. Ultrasound-guided intratumoral administration of collagenase-2 improved liposome drug accumulation in solid tumor xenografts. Cancer Chemother Pharmacol. 2011;67:173-82
135. Kirtane AR, Sadhukha T, Kim H, Khanna V, Koniar B, Panyam J. Fibrinolytic Enzyme Cotherapy Improves Tumor Perfusion and Therapeutic Efficacy of Anticancer Nanomedicine. Cancer Res. 2017;77:1465-75
136. Wang H, Mislati R, Ahmed R, Vincent P, Nwabunwanne SF, Gunn JR. et al. Elastography Can Map the Local Inverse Relationship between Shear Modulus and Drug Delivery within the Pancreatic Ductal Adenocarcinoma Microenvironment. Clin Cancer Res. 2019;25:2136-43
137. Couture O, Hingot V, Heiles B, Muleki-Seya P, Tanter M. Ultrasound Localization Microscopy and Super-Resolution: A State of the Art. IEEE Trans Ultrason Ferroelectr Freq Control. 2018;65:1304-20
138. Provost J, Papadacci C, Demene C, Gennisson J-L, Tanter M, Pernot M. 3-D Ultrafast Doppler Imaging Applied to the Noninvasive and Quantitative Imaging of Blood Vessels in vivo. IEEE Trans Ultrason Ferroelectr Freq Control. 2015;62:1467-72
139. Demené C, Payen T, Dizeux A, Barrois G, Gennisson JL, Bridal L. et al. 3-D Longitudinal Imaging of Tumor Angiogenesis in Mice in vivo Using Ultrafast Doppler Tomography. Ultrasound Med Biol. 2019;45:1284-96
140. Errico C, Pierre J, Pezet S, Desailly Y, Lenkei Z, Couture O. et al. Ultrafast ultrasound localization microscopy for deep super-resolution vascular imaging. Nature. 2015;527:499-502
141. Lin F, Shelton SE, Espindola D, Rojas JD, Pinton G, Dayton PA. 3-D Ultrasound Localization Microscopy for Identifying Microvascular Morphology Features of Tumor Angiogenesis at a Resolution Beyond the Diffraction Limit of Conventional Ultrasound. Theranostics. 2017;7:196-204
142. Opacic T, Dencks S, Theek B, Piepenbrock M, Ackermann D, Rix A. et al. Motion model ultrasound localization microscopy for preclinical and clinical multiparametric tumor characterization. Nat Commun. 2018;9:1527
143. Ghosh D, Xiong F, Mattrey R, Sirsi S, Hoyt K. Monitoring early tumor response to vascular targeted therapy using super-resolution ultrasound imaging. 2017 IEEE IUS. 2017
144. Guvener N, Appold L, de Lorenzi F, Golombek SK, Rizzo LY, Lammers T. et al. Recent advances in ultrasound-based diagnosis and therapy with micro- and nanometer-sized formulations. Methods. 2017;130:4-13
145. Zhang X, Zheng Y, Wang Z, Huang S, Chen Y, Jiang W. et al. Methotrexate-loaded PLGA nanobubbles for ultrasound imaging and Synergistic Targeted therapy of residual tumor during HIFU ablation. Biomaterials. 2014;35:5148-61
146. Nittayacharn P, Yuan HX, Hernandez C, Bielecki P, Zhou H, Exner AA. Enhancing Tumor Drug Distribution With Ultrasound-Triggered Nanobubbles. J Pharm Sci. 2019;108:3091-8
147. Ektate K, Kapoor A, Maples D, Tuysuzoglu A, VanOsdol J, Ramasami S. et al. Motion Compensated Ultrasound Imaging Allows Thermometry and Image Guided Drug Delivery Monitoring from Echogenic Liposomes. Theranostics. 2016;6:1963-74
148. Min HS, You DG, Son S, Jeon S, Park JH, Lee S. et al. Echogenic Glycol Chitosan Nanoparticles for Ultrasound-Triggered Cancer Theranostics. Theranostics. 2015;5:1402-18
149. Li X, Sui Z, Li X, Xu W, Guo Q, Sun J. et al. Perfluorooctylbromide nanoparticles for ultrasound imaging and drug delivery. Int J Nanomedicine. 2018;13:3053-67
150. Kulkarni P, Haldar MK, Karandish F, Confeld M, Hossain R, Borowicz P. et al. Tissue-Penetrating, Hypoxia-Responsive Echogenic Polymersomes For Drug Delivery To Solid Tumors. Chemistry. 2018;24:12490-4
151. Jamburidze A, Huerre A, Baresch D, Poulichet V, De Corato M, Garbin V. Nanoparticle-Coated Microbubbles for Combined Ultrasound Imaging and Drug Delivery. Langmuir. 2019;35:10087-96
152. Lentacker I, Geers B, Demeester J, De Smedt SC, Sanders NN. Design and evaluation of doxorubicin-containing microbubbles for ultrasound-triggered doxorubicin delivery: cytotoxicity and mechanisms involved. Mol Ther. 2010;18:101-8
153. Tay LM, Xu C. Coating microbubbles with nanoparticles for medical imaging and drug delivery. Nanomedicine. 2016;12:91-4
154. Snipstad S, Sulheim E, de Lange Davies C, Moonen C, Storm G, Kiessling F. et al. Sonopermeation to improve drug delivery to tumors: from fundamental understanding to clinical translation. Expert Opin Drug Deliv. 2018;15:1249-61
155. Min KH, Min HS, Lee HJ, Park DJ, Yhee JY, Kim K. et al. pH-controlled gas-generating mineralized nanoparticles: a theranostic agent for ultrasound imaging and therapy of cancers. ACS Nano. 2015;9:134-45
156. Ntziachristos V. Going deeper than microscopy: the optical imaging frontier in biology. Nature Methods. 2010;7:603-14
157. Weissleder R, Pittet MJ. Imaging in the era of molecular oncology. Nature. 2008;452:580-9
158. Ntziachristos V, Ripoll J, Wang LV, Weissleder R. Looking and listening to light: the evolution of whole-body photonic imaging. Nature Biotechnology. 2005;23:313-20
159. Weissleder R, Ntziachristos V. Shedding light onto live molecular targets. Nature Medicine. 2003;9:123-8
160. Rudin M, Weissleder R. Molecular imaging in drug discovery and development. Nature Reviews Drug Discovery. 2003;2:123-31
161. Pittet MJ, Weissleder R. Intravital imaging. Cell. 2011;147:983-91
162. Amornphimoltham P, Masedunskas A, Weigert R. Intravital microscopy as a tool to study drug delivery in preclinical studies. Advanced Drug Delivery Reviews. 2011;63:119-28
163. Baker M. Whole-animal imaging: The whole picture. Nature. 2010;463:977-80
164. Miller MA, Weissleder R. Imaging the pharmacology of nanomaterials by intravital microscopy: Toward understanding their biological behavior. Adv Drug Deliv Rev. 2017;113:61-86
165. Hak S, Reitan NK, Haraldseth O, de Lange Davies C. Intravital microscopy in window chambers: a unique tool to study tumor angiogenesis and delivery of nanoparticles. Angiogenesis. 2010;13:113-30
166. Mulder WJM, Strijkers GJ, Nicolay K, Griffioen AW. Quantum dots for multimodal molecular imaging of angiogenesis. Angiogenesis. 2010;13:131-4
167. Mulder WJM, Griffioen AW, Strijkers GJ, Cormode DP, Nicolay K, Fayad ZA. Magnetic and fluorescent nanoparticles for multimodality imaging. Nanomedicine. 2007;2:307-24
168. Cui L, Lin Q, Jin CS, Jiang W, Huang H, Ding L. et al. A PEGylation-Free Biomimetic Porphyrin Nanoplatform for Personalized Cancer Theranostics. ACS Nano. 2015;9:4484-95
169. Hsu JC, Naha PC, Lau KC, Chhour P, Hastings R, Moon BF. et al. An all-in-one nanoparticle (AION) contrast agent for breast cancer screening with DEM-CT-MRI-NIRF imaging. Nanoscale. 2018;10:17236-48
170. Liu T, Zhang M, Liu W, Zeng X, Song X, Yang X. et al. Metal Ion/Tannic Acid Assembly as a Versatile Photothermal Platform in Engineering Multimodal Nanotheranostics for Advanced Applications. ACS Nano. 2018;12:3917-27
171. Dean KM, Palmer AE. Advances in fluorescence labeling strategies for dynamic cellular imaging. Nat Chem Biol. 2014;10:512-23
172. Pittet MJ, Swirski FK, Reynolds F, Josephson L, Weissleder R. Labeling of immune cells for in vivo imaging using magnetofluorescent nanoparticles. Nat Protoc. 2006;1:73-9
173. Fortin P-Y, Genevois C, Koenig A, Heinrich E, Texier I, Couillaud F. Detection of brain tumors using fluorescence diffuse optical tomography and nanoparticles as contrast agents. J Biomed Opt. 2012;17:126004
174. Ma X, Hui H, Jin Y, Dong D, Liang X, Yang X. et al. Enhanced immunotherapy of SM5-1 in hepatocellular carcinoma by conjugating with gold nanoparticles and its in vivo bioluminescence tomographic evaluation. Biomaterials. 2016;87:46-56
175. Huang X, Chisholm J, Zhuang J, Xiao Y, Duncan G, Chen X. et al. Protein nanocages that penetrate airway mucus and tumor tissue. Proc Natl Acad Sci U S A. 2017;114:E6595-E602
176. Nam J, Son S, Ochyl LJ, Kuai R, Schwendeman A, Moon JJ. Chemo-photothermal therapy combination elicits anti-tumor immunity against advanced metastatic cancer. Nature Communications. 2018;9:1074 -
177. Muthu MS, Kutty RV, Luo Z, Xie J, Feng S-S. Theranostic vitamin E TPGS micelles of transferrin conjugation for targeted co-delivery of docetaxel and ultra bright gold nanoclusters. Biomaterials. 2015;39:234-48
178. Yeh C-Y, Hsiao J-K, Wang Y-P, Lan C-H, Wu H-C. Peptide-conjugated nanoparticles for targeted imaging and therapy of prostate cancer. Biomaterials. 2016;99:1-15
179. Devulapally R, Sekar NM, Sekar TV, Foygel K, Massoud TF, Willmann JK. et al. Polymer Nanoparticles Mediated Codelivery of AntimiR-10b and AntimiR-21 for Achieving Triple Negative Breast Cancer Therapy. ACS Nano. 2015;9:2290-302
180. Yamamoto Y, Lin PJC, Beraldi E, Zhang F, Kawai Y, Leong J. et al. siRNA Lipid Nanoparticle Potently Silences Clusterin and Delays Progression When Combined with Androgen Receptor Cotargeting in Enzalutamide-Resistant Prostate Cancer. Clin Cancer Res. 2015;21:4845-55
181. Singh A, Kim W, Kim Y, Jeong K, Kang CS, Kim Y. et al. Multifunctional Photonics Nanoparticles for Crossing the Blood-Brain Barrier and Effecting Optically Trackable Brain Theranostics. Adv Funct Mater. 2016;26:7057-66
182. Pu K, Chattopadhyay N, Rao J. Recent advances of semiconducting polymer nanoparticles in in vivo molecular imaging. J Control Release. 2016;240:312-22
183. Cheng S-H, Yu D, Tsai H-M, Morshed RA, Kanojia D, Lo L-W. et al. Dynamic In vivo SPECT Imaging of Neural Stem Cells Functionalized with Radiolabeled Nanoparticles for Tracking of Glioblastoma. J Nucl Med. 2016;57:279-84
184. Appel EA, Tibbitt MW, Webber MJ, Mattix BA, Veiseh O, Langer R. Self-assembled hydrogels utilizing polymer-nanoparticle interactions. Nature Communications. 2015;6:6295
185. Jiang W, Huang Y, An Y, Kim BY. Remodeling Tumor Vasculature to Enhance Delivery of Intermediate-Sized Nanoparticles. ACS Nano. 2015;9:8689-96
186. Guo P, Liu D, Subramanyam K, Wang B, Yang J, Huang J. et al. Nanoparticle elasticity directs tumor uptake. Nature Commun. 2018;9:130
187. Yang T, Tang Ya, Liu L, Lv X, Wang Q, Ke H. et al. Size-Dependent Ag 2 S Nanodots for Second Near-Infrared Fluorescence/Photoacoustics Imaging and Simultaneous Photothermal Therapy. ACS Nano. 2017;11:1848-57
188. Gao S, Wang G, Qin Z, Wang X, Zhao G, Ma Q. et al. Oxygen-generating hybrid nanoparticles to enhance fluorescent/photoacoustic/ultrasound imaging guided tumor photodynamic therapy. Biomaterials. 2017;112:324-35
189. Zhu H, Li J, Qi X, Chen P, Pu K. Oxygenic Hybrid Semiconducting Nanoparticles for Enhanced Photodynamic Therapy. Nano Letters. 2018;18:586-94
190. Chen Q, Liang C, Wang C, Liu Z. An Imagable and Photothermal “Abraxane-Like” Nanodrug for Combination Cancer Therapy to Treat Subcutaneous and Metastatic Breast Tumors. Advanced Materials. 2015;27:903-10
191. Taratula O, Schumann C, Duong T, Taylor KL, Taratula O. Dendrimer-encapsulated naphthalocyanine as a single agent-based theranostic nanoplatform for near-infrared fluorescence imaging and combinatorial anticancer phototherapy. Nanoscale. 2015;7:3888-902
192. Chen Q, Liang C, Sun X, Chen J, Yang Z, Zhao H. et al. H2O2-responsive liposomal nanoprobe for photoacoustic inflammation imaging and tumor theranostics via in vivo chromogenic assay. Proc Natl Acad Sci U S A. 2017;114:5343-8
193. Li Z, Zhang Y, Wu X, Huang L, Li D, Fan W. et al. Direct Aqueous-Phase Synthesis of Sub-10 nm “Luminous Pearls” with Enhanced in vivo Renewable Near-Infrared Persistent Luminescence. J Am Chem Soc. 2015;137:5304-7
194. Miao Q, Xie C, Zhen X, Lyu Y, Duan H, Liu X. et al. Molecular afterglow imaging with bright, biodegradable polymer nanoparticles. Nat Biotechnol. 2017;35:1102-10
195. Zebibula A, Alifu N, Xia L, Sun C, Yu X, Xue D. et al. Ultrastable and Biocompatible NIR-II Quantum Dots for Functional Bioimaging. Adv Funct Mater. 2018;28:1703451
196. Rieffel J, Chen F, Kim J, Chen G, Shao W, Shao S. et al. Hexamodal Imaging with Porphyrin-Phospholipid-Coated Upconversion Nanoparticles. Advanced Materials. 2015;27:1785-90
197. Zhang J, Li C, Zhang X, Huo S, Jin S, An F-F. et al. In vivo tumor-targeted dual-modal fluorescence/CT imaging using a nanoprobe co-loaded with an aggregation-induced emission dye and gold nanoparticles. Biomaterials. 2015;42:103-11
198. Nahrendorf M, Waterman P, Thurber G, Groves K, Rajopadhye M, Panizzi P. et al. Hybrid In vivo FMT-CT Imaging of Protease Activity in Atherosclerosis With Customized Nanosensors. Arterioscler Thromb Vasc Biol. 2009;29:1444-51
199. Gremse F, Doleschel D, Zafarnia S, Babler A, Jahnen-Dechent W, Lammers T. et al. Hybrid µCT-FMT imaging and image analysis. J Vis Exp. 2015:52770
200. Hyde D, de Kleine R, MacLaurin SA, Miller E, Brooks DH, Krucker T. et al. Hybrid FMT-CT imaging of amyloid-β plaques in a murine Alzheimer's disease model. NeuroImage. 2009;44:1304-11
201. Dai Q, Wilhelm S, Ding D, Syed AM, Sindhwani S, Zhang Y. et al. Quantifying the Ligand-Coated Nanoparticle Delivery to Cancer Cells in Solid Tumors. ACS Nano. 2018;12:8423-35
202. Peng F, Setyawati MI, Tee JK, Ding X, Wang J, Nga ME. et al. Nanoparticles promote in vivo breast cancer cell intravasation and extravasation by inducing endothelial leakiness. Nature Nanotechnology. 2019;14:279-86
203. Shen J, Kim H-C, Su H, Wang F, Wolfram J, Kirui D. et al. Cyclodextrin and Polyethylenimine Functionalized Mesoporous Silica Nanoparticles for Delivery of siRNA Cancer Therapeutics. Theranostics. 2014;4:487-97
204. Seynhaeve ALB, Hoving S, Schipper D, Vermeulen CE, Wiel-Ambagtsheer Gad, Tiel STv. et al. Tumor Necrosis Factor A Mediates Homogeneous Distribution of Liposomes in Murine Melanoma that Contributes to a Better Tumor Response. Cancer Res. 2007;53:3765-70
205. Murphy EA, Majeti BK, Barnes LA, Makale M, Weis SM, Lutu-Fuga K. et al. Nanoparticle-mediated drug delivery to tumor vasculature suppresses metastasis. Proc Natl Acad Sci U S A. 2008;105:9343-8
206. Popović Z, Liu W, Chauhan VP, Lee J, Wong C, Greytak AB. et al. A Nanoparticle Size Series for In vivo Fluorescence Imaging. Angew Chem Int Ed Engl. 2010;49:8649-52
207. Cabral H, Makino J, Matsumoto Y, Mi P, Wu H, Nomoto T. et al. Systemic Targeting of Lymph Node Metastasis through the Blood Vascular System by Using Size-Controlled Nanocarriers. ACS Nano. 2015;9:4957-67
208. Hak S, Helgesen E, Hektoen HH, Huuse EM, Jarzyna PA, Mulder WJM. et al. The Effect of Nanoparticle Polyethylene Glycol Surface Density on Ligand-Directed Tumor Targeting Studied in vivo by Dual Modality Imaging. ACS Nano. 2012;6:5648-58
209. Smith BR, Kempen P, Bouley D, Xu A, Liu Z, Melosh N. et al. Shape Matters: Intravital Microscopy Reveals Surprising Geometrical Dependence for Nanoparticles in Tumor Models of Extravasation. Nano Letters. 2012;12:3369-77
210. Smith BR, Cheng Z, De A, Rosenberg J, Gambhir SS. Dynamic Visualization of RGD-Quantum Dot Binding to Tumor Neovasculature and Extravasation in Multiple Living Mouse Models Using Intravital Microscopy. Small. 2010;6:2222-9
211. van de Ven AL, Kim P, Haley OH, Fakhoury JR, Adriani G, Schmulen J. et al. Rapid tumoritropic accumulation of systemically injected plateloid particles and their biodistribution. J Control Release. 2012;158:148-55
212. Leimgruber A, Berger C, Cortez-Retamozo V, Etzrodt M, Newton AP, Waterman P. et al. Behavior of Endogenous Tumor-Associated Macrophages Assessed In vivo Using a Functionalized Nanoparticle. Neoplasia. 2009;11:459-68
213. Miller MA, Chandra R, Cuccarese MF, Pfirschke C, Engblom C, Stapleton S. et al. Radiation therapy primes tumors for nanotherapeutic delivery via macrophage-mediated vascular bursts. Sci Transl Med. 2017;9:1-12
214. Matsumoto Y, Nichols JW, Toh K, Nomoto T, Cabral H, Miura Y. et al. Vascular bursts enhance permeability of tumour blood vessels and improve nanoparticle delivery. Nat Nanotechnol. 2016;11:533-8
215. Jones SW, Roberts RA, Robbins GR, Perry JL, Kai MP, Chen K. et al. Nanoparticle clearance is governed by Th1/Th2 immunity and strain background. J Clin Invest. 2013;123:3061-73
216. Tsourkas A, Shinde-Patil VR, Kelly KA, Patel P, Wolley A, Allport JR. et al. In vivo Imaging of Activated Endothelium Using an Anti-VCAM-1 Magnetooptical Probe. Bioconjug Chem. 2005;16:576-81
217. Mulder WJM, Castermans K, van Beijnum JR, oude Egbrink MGA, Chin PTK, Fayad ZA. et al. Molecular imaging of tumor angiogenesis using αvβ3-integrin targeted multimodal quantum dots. Angiogenesis. 2009;12:17-24
218. Patsialou A, Bravo-Cordero JJ, Wang Y, Entenberg D, Liu H, Clarke M. et al. Intravital multiphoton imaging reveals multicellular streaming as a crucial component of in vivo cell migration in human breast tumors. IntraVital. 2013;2:e25294
219. Pantel K, Alix-Panabières C. Liquid biopsy and minimal residual disease — latest advances and implications for cure. Nat Rev Clin Oncol. 2019;16:409-24
220. Tellez-Gabriel M, Heymann M-F, Heymann D. Circulating Tumor Cells as a Tool for Assessing Tumor Heterogeneity. Theranostics. 2019;9:4580-94
221. Xiang J, Cai X, Lou X, Feng G, Min X, Luo W. et al. Biocompatible Green and Red Fluorescent Organic Dots with Remarkably Large Two-Photon Action Cross Sections for Targeted Cellular Imaging and Real-Time Intravital Blood Vascular Visualization. ACS Applied Materials & Interfaces. 2015;7:14965-74
222. Fu A, Wilson RJ, Smith BR, Mullenix J, Earhart C, Akin D. et al. Fluorescent magnetic nanoparticles for magnetically enhanced cancer imaging and targeting in living subjects. ACS Nano. 2012;6:6862-9
223. Sandanaraj BS, Gremlich H-U, Kneuer R, Dawson J, Wacha S. Fluorescent Nanoprobes as a Biomarker for Increased Vascular Permeability: Implications in Diagnosis and Treatment of Cancer and Inflammation. Bioconjugate Chemistry. 2010;21:93-101
224. Gaber MH, Wu NZ, Hong K, Huang SK, Dewhirst MW, Papahadjopoulos D. Thermosensitive liposomes: Extravasation and release of contents in tumor microvascular networks. Int J Radiat Oncol Biol Phys. 1996;36:1177-87
225. Ziemys A, Yokoi K, Kai M, Liu YT, Kojic M, Simic V. et al. Progression-dependent transport heterogeneity of breast cancer liver metastases as a factor in therapeutic resistance. J Control Release. 2018;291:99-105
226. Wiench B, Eichhorn T, Korn B, Paulsen M, Efferth T. Utilizing inherent fluorescence of therapeutics to analyze real-time uptake and multi-parametric effector kinetics. Methods. 2012;57:376-82
227. Besse HC, Barten-van Rijbroek AD, van der Wurff-Jacobs KMG, Bos C, Moonen CTW, Deckers R. Tumor drug distribution after local drug delivery by hyperthermia, in vivo. Cancers. 2019;11:1512
228. Lee SS-Y, Bindokas VP, Kron SJ. Multiplex Three-Dimensional Mapping of Macromolecular Drug Distribution in the Tumor Microenvironment. Molecular cancer therapeutics. 2019;18:213-26
229. Lamberts LE, Koch M, de Jong JS, Adams ALL, Glatz J, Kranendonk MEG. et al. Tumor-Specific Uptake of Fluorescent Bevacizumab-IRDye800CW Microdosing in Patients with Primary Breast Cancer: A Phase I Feasibility Study. Clin Cancer Res. 2017;23:2730-41
230. van Keulen S, van den Berg NS, Nishio N, Birkeland A, Zhou Q, Lu G. et al. Rapid, non-invasive fluorescence margin assessment: Optical specimen mapping in oral squamous cell carcinoma. Oral Oncol. 2019;88:58-65
231. Rosenthal EL, Moore LS, Tipirneni K, de Boer E, Stevens TM, Hartman YE. et al. Sensitivity and Specificity of Cetuximab-IRDye800CW to Identify Regional Metastatic Disease in Head and Neck Cancer. Clin Cancer Res. 2017;23:4744-52
232. Tainaka K, Kuno A, Kubota SI, Murakami T, Ueda HR. Chemical Principles in Tissue Clearing and Staining Protocols for Whole-Body Cell Profiling. Annu Rev Cell Dev Biol. 2016;32:713-41
233. Liu YA, Chen Y, Chiang AS, Peng SJ, Pasricha PJ, Tang SC. Optical clearing improves the imaging depth and signal-to-noise ratio for digital analysis and three-dimensional projection of the human enteric nervous system. Neurogastroenterol Motil. 2011;23:e446-57
234. Ariel P. A beginner's guide to tissue clearing. Int J Biochem Cell Biol. 2017;84:35-9
235. Boutin ME, Hoffman-Kim D. Application and assessment of optical clearing methods for imaging of tissue-engineered neural stem cell spheres. Tissue Eng Part C Methods. 2015;21:292-302
236. Moy AJ, Wiersma MP, Choi B. Optical histology: a method to visualize microvasculature in thick tissue sections of mouse brain. PLoS One. 2013;8:e53753
237. Chen YY, Silva PN, Syed AM, Sindhwani S, Rocheleau JV, Chan WC. Clarifying intact 3D tissues on a microfluidic chip for high-throughput structural analysis. Proc Natl Acad Sci U S A. 2016;113:14915-20
238. Chung K, Wallace J, Kim SY, Kalyanasundaram S, Andalman AS, Davidson TJ. et al. Structural and molecular interrogation of intact biological systems. Nature. 2013;497:332-7
239. Carrillo M, Chuecos M, Gandhi K, Bednov A, Moore DL, Maher J. et al. Optical tissue clearing in combination with perfusion and immunofluorescence for placental vascular imaging. Medicine (Baltimore). 2018;97:e12392
240. Pan C, Cai R, Quacquarelli FP, Ghasemigharagoz A, Lourbopoulos A, Matryba P. et al. Shrinkage-mediated imaging of entire organs and organisms using uDISCO. Nat Methods. 2016;13:859-67
241. Neu CP, Novak T, Gilliland KF, Marshall P, Calve S. Optical clearing in collagen- and proteoglycan-rich osteochondral tissues. Osteoarthritis Cartilage. 2015;23:405-13
242. Sindhwani S, Syed AM, Wilhelm S, Glancy DR, Chen YY, Dobosz M. et al. Three-Dimensional Optical Mapping of Nanoparticle Distribution in Intact Tissues. ACS Nano. 2016;10:5468-78
243. Sindhwani S, Syed AM, Wilhelm S, Chan WC. Exploring Passive Clearing for 3D Optical Imaging of Nanoparticles in Intact Tissues. Bioconjug Chem. 2017;28:253-9
244. Togami K, Daisho T, Yumita Y, Kitayama A, Tada H, Chono S. Evaluation of various tissue-clearing techniques for the three-dimensional visualization of liposome distribution in mouse lungs at the alveolar scale. Int J Pharm. 2019;562:218-27
245. Cuccarese MF, Dubach JM, Pfirschke C, Engblom C, Garris C, Miller MA. et al. Heterogeneity of macrophage infiltration and therapeutic response in lung carcinoma revealed by 3D organ imaging. Nat Commun. 2017;8:14293
246. van Royen ME, Verhoef EI, Kweldam CF, van Cappellen WA, Kremers GJ, Houtsmuller AB. et al. Three-dimensional microscopic analysis of clinical prostate specimens. Histopathology. 2016;69:985-92
247. Wang M, Kimbrell HZ, Sholl AB, Tulman DB, Elfer KN, Schlichenmeyer TC. et al. High-Resolution Rapid Diagnostic Imaging of Whole Prostate Biopsies Using Video-Rate Fluorescence Structured Illumination Microscopy. Cancer Res. 2015;75:4032-41
248. Joshi BP, Wang TD. Targeted Optical Imaging Agents in Cancer: Focus on Clinical Applications. Contrast Media Mol Imaging. 2018;2018:2015237
249. Phillips E, Penate-Medina O, Zanzonico PB, Carvajal RD, Mohan P, Ye Y. et al. Clinical translation of an ultrasmall inorganic optical-PET imaging nanoparticle probe. Sci Transl Med. 2014;6:260ra149
250. Bradbury MS, Phillips E, Montero PH, Cheal SM, Stambuk H, Durack JC. et al. Clinically-translated silica nanoparticles as dual-modality cancer-targeted probes for image-guided surgery and interventions. Integr Biol (Camb). 2013;5:74-86
251. Tummers WS, Warram JM, van den Berg NS, Miller SE, Swijnenburg R-J, Vahrmeijer AL. et al. Recommendations for reporting on emerging optical imaging agents to promote clinical approval. Theranostics. 2018;8:5336-47
252. DeLong JC, Hoffman RM, Bouvet M. Current status and future perspectives of fluorescence-guided surgery for cancer. Expert Rev Anticancer Ther. 2016;16:71-81
253. Hernot S, van Manen L, Debie P, Mieog JSD, Vahrmeijer AL. Latest developments in molecular tracers for fluorescence image-guided cancer surgery. The Lancet Oncology. 2019;20:e354-e67
254. Sieroń A, Sieroń-Stołtny K, Kawczyk-Krupka A, Latos W, Kwiatek S, Straszak D. et al. The role of fluorescence diagnosis in clinical practice. Onco Targets Ther. 2013;6:977-82
255. Wang LV, Yao J. A practical guide to photoacoustic tomography in the life sciences. Nat Methods. 2016;13:627-38
256. Manohar S, Razansky D. Photoacoustics: a historical review. Adv Opt Photon. 2016;8:586-617
257. Wang LV, Hu S. Photoacoustic Tomography In vivo Imaging from Organelles to Organs. Science. 2012;335:1458-62
258. Weber J, Beard PC, Bohndiek SE. Contrast agents for molecular photoacoustic imaging. Nature Methods. 2016;13:639-50
259. Gujrati V, Mishra A, Ntziachristos V. Molecular imaging probes for multi-spectral optoacoustic tomography. Chem Commun (Camb). 2017;53:4653-72
260. Laufer J, Johnson P, Zhang E, Treeby B, Cox B, Pedley B. et al. In vivo preclinical photoacoustic imaging of tumor vasculature development and therapy. J Biomed Opt. 2012;17:056016
261. Heijblom M, Klaase JM, van den Engh FM, van Leeuwen TG, Steenbergen W, Manohar S. Imaging tumor vascularization for detection and diagnosis of breast cancer. Technol Cancer Res Treat. 2011;10:607-23
262. Tomaszewski MR, Gehrung M, Joseph J, Quiros-Gonzalez I, Disselhorst JA, Bohndiek SE. Oxygen-Enhanced and Dynamic Contrast-Enhanced Optoacoustic Tomography Provide Surrogate Biomarkers of Tumor Vascular Function, Hypoxia, and Necrosis. Cancer Res. 2018;78:5980-91
263. May JP, Hysi E, Wirtzfeld LA, Undzys E, Li SD, Kolios MC. Photoacoustic Imaging of Cancer Treatment Response: Early Detection of Therapeutic Effect from Thermosensitive Liposomes. PLoS One. 2016;11:e0165345
264. Hu S, Wang LV. Photoacoustic imaging and characterization of the microvasculature. J Biomed Opt. 2010;15:011101
265. Fehm TF, Deán-Ben XL, Ford SJ, Razansky D. In vivo whole-body optoacoustic scanner with real-time volumetric imaging capacity. Optica. 2016;3:1153-9
266. Mallidi S, Kim S, Karpiouk A, Joshi PP, Sokolov K, Emelianov S. Visualization of molecular composition and functionality of cancer cells using nanoparticle-augmented ultrasound-guided photoacoustics. Photoacoustics. 2015;3:26-34
267. Levi J, Kothapalli SR, Bohndiek S, Yoon JK, Dragulescu-Andrasi A, Nielsen C. et al. Molecular photoacoustic imaging of follicular thyroid carcinoma. Clin Cancer Res. 2013;19:1494-502
268. Okumura K, Yoshida K, Yoshioka K, Aki S, Yoneda N, Inoue D. et al. Photoacoustic imaging of tumour vascular permeability with indocyanine green in a mouse model. Eur Radiol Exp. 2018;2:5
269. Li L, Zemp RJ, Lungu G, Stoica G, Wang LV. Photoacoustic imaging of lacZ gene expression in vivo. J Biomed Opt. 2007;12:020504
270. Paproski RJ, Forbrich AE, Wachowicz K, Hitt MM, Zemp RJ. Tyrosinase as a dual reporter gene for both photoacoustic and magnetic resonance imaging. Biomed Opt Express. 2011;2:771-80
271. Krumholz A, Vanvickle-Chavez SJ, Yao J, Fleming TP, Gillanders WE, Wang LV. Photoacoustic microscopy of tyrosinase reporter gene in vivo. J Biomed Opt. 2011;16:080503
272. Filonov GS, Krumholz A, Xia J, Yao J, Wang LV, Verkhusha VV. Deep-tissue photoacoustic tomography of a genetically encoded near-infrared fluorescent probe. Angew Chem Int Ed Engl. 2012;51:1448-51
273. Peters L, Weidenfeld I, Klemm U, Loeschcke A, Weihmann R, Jaeger KE. et al. Phototrophic purple bacteria as optoacoustic in vivo reporters of macrophage activity. Nat Commun. 2019;10:1191
274. Binnemars-Postma K, Storm G, Prakash J. Nanomedicine Strategies to Target Tumor-Associated Macrophages. Int J Mol Sci. 2017;18:979
275. Manivasagan P, Bharathiraja S, Bui NQ, Jang B, Oh YO, Lim IG. et al. Doxorubicin-loaded fucoidan capped gold nanoparticles for drug delivery and photoacoustic imaging. Int J Biol Macromol. 2016;91:578-88
276. Cong Z, Yang F, Cao L, Wen H, Fu T, Ma S. et al. Multispectral optoacoustic tomography (MSOT) for imaging the particle size-dependent intratumoral distribution of polymeric micelles. Int J Nanomedicine. 2018;13:8549-60
277. Herzog E, Taruttis A, Beziere N, Lutich AA, Razansky D, Ntziachristos V. Optical imaging of cancer heterogeneity with multispectral optoacoustic tomography. Radiology. 2012;263:461-8
278. Song W, Tang Z, Zhang D, Yu H, Chen X. Coadministration of Vascular Disrupting Agents and Nanomedicines to Eradicate Tumors from Peripheral and Central Regions. Small. 2015;11:3755-61
279. Kim C, Cho EC, Chen J, Song KH, Au L, Favazza C. et al. In vivo molecular photoacoustic tomography of melanomas targeted by bioconjugated gold nanocages. ACS Nano. 2010;4:4559-64
280. Wang Z, Chen Z, Liu Z, Shi P, Dong K, Ju E. et al. A multi-stimuli responsive gold nanocage-hyaluronic platform for targeted photothermal and chemotherapy. Biomaterials. 2014;35:9678-88
281. Zhong J, Yang S, Wen L, Xing D. Imaging-guided photoacoustic drug release and synergistic chemo-photoacoustic therapy with paclitaxel-containing nanoparticles. J Control Release. 2016;226:77-87
282. Hannah A, Luke G, Wilson K, Homan K, Emelianov S. Indocyanine green-loaded photoacoustic nanodroplets: dual contrast nanoconstructs for enhanced photoacoustic and ultrasound imaging. ACS Nano. 2014;8:250-9
283. Yang Z, Song J, Tang W, Fan W, Dai Y, Shen Z. et al. Stimuli-Responsive Nanotheranostics for Real-Time Monitoring Drug Release by Photoacoustic Imaging. Theranostics. 2019;9:526-36
284. Li Y, Jiang C, Zhang D, Wang Y, Ren X, Ai K. et al. Targeted polydopamine nanoparticles enable photoacoustic imaging guided chemo-photothermal synergistic therapy of tumor. Acta Biomater. 2017;47:124-34
285. Nam J, Son S, Ochyl LJ, Kuai R, Schwendeman A, Moon JJ. Chemo-photothermal therapy combination elicits anti-tumor immunity against advanced metastatic cancer. Nat Commun. 2018;9:1074
286. Zhu H, Cheng P, Chen P, Pu K. Recent progress in the development of near-infrared organic photothermal and photodynamic nanotherapeutics. Biomater Sci. 2018;6:746-65
287. Kim HS, Lee DY. Near-Infrared-Responsive Cancer Photothermal and Photodynamic Therapy Using Gold Nanoparticles. Polymers (Basel). 2018:10
288. Pinto A, Pocard M. Photodynamic therapy and photothermal therapy for the treatment of peritoneal metastasis: a systematic review. Pleura Peritoneum. 2018;3:20180124
289. Swales JG, Dexter A, Hamm G, Nilsson A, Strittmatter N, Michopoulos F. et al. Quantitation of Endogenous Metabolites in Mouse Tumors Using Mass-Spectrometry Imaging. Anal Chem. 2018;90:6051-8
290. Paine MRL, Liu J, Huang D, Ellis SR, Trede D, Kobarg JH. et al. Three-Dimensional Mass Spectrometry Imaging Identifies Lipid Markers of Medulloblastoma Metastasis. Sci Rep. 2019;9:2205
291. Mirnezami R, Veselkov K, Strittmatter N, Goldin RD, Kinross JM, Stebbing J. et al. Spatially resolved profiling of colorectal cancer lipid biochemistry via DESI imaging mass spectrometry to reveal morphology-dependent alterations in fatty acid metabolism. J Clin Oncol. 2016;34:e15104
292. Bauer JA, Chakravarthy AB, Rosenbluth JM, Mi D, Seeley EH, De Matos Granja-Ingram N. et al. Identification of markers of taxane sensitivity using proteomic and genomic analyses of breast tumors from patients receiving neoadjuvant paclitaxel and radiation. Clin Cancer Res. 2010;16:681-90
293. Reyzer ML, Caldwell RL, Dugger TC, Forbes JT, Ritter CA, Guix M. et al. Early changes in protein expression detected by mass spectrometry predict tumor response to molecular therapeutics. Cancer Res. 2004;64:9093-100
294. Cole LM, Djidja MC, Bluff J, Claude E, Carolan VA, Paley M. et al. Investigation of protein induction in tumour vascular targeted strategies by MALDI MSI. Methods. 2011;54:442-53
295. Swales JG, Hamm G, Clench MR, Goodwin RJA. Mass spectrometry imaging and its application in pharmaceutical research and development: A concise review. Int J Mass Spectrom. 2019;437:99-112
296. Schulz S, Becker M, Groseclose MR, Schadt S, Hopf C. Advanced MALDI mass spectrometry imaging in pharmaceutical research and drug development. Curr Opin Biotechnol. 2019;55:51-9
297. Ashton S, Song YH, Nolan J, Cadogan E, Murray J, Odedra R. et al. Aurora kinase inhibitor nanoparticles target tumors with favorable therapeutic index in vivo. Sci Transl Med. 2016;8:325ra17
298. Nilsson A, Goodwin RJ, Swales JG, Gallagher R, Shankaran H, Sathe A. et al. Investigating nephrotoxicity of polymyxin derivatives by mapping renal distribution using mass spectrometry imaging. Chem Res Toxicol. 2015;28:1823-30
299. Karlsson O, Hanrieder J. Imaging mass spectrometry in drug development and toxicology. Arch Toxicol. 2017;91:2283-94
300. Munteanu B, Meyer B, von Reitzenstein C, Burgermeister E, Bog S, Pahl A. et al. Label-free in situ monitoring of histone deacetylase drug target engagement by matrix-assisted laser desorption ionization-mass spectrometry biotyping and imaging. Anal Chem. 2014;86:4642-7
301. Giordano S, Zucchetti M, Decio A, Cesca M, Fuso Nerini I, Maiezza M. et al. Heterogeneity of paclitaxel distribution in different tumor models assessed by MALDI mass spectrometry imaging. Sci Rep. 2016;6:39284
302. Connell JJ, Sugihara Y, Torok S, Dome B, Tovari J, Fehniger TE. et al. Localization of sunitinib in in vivo animal and in vitro experimental models by MALDI mass spectrometry imaging. Anal Bioanal Chem. 2015;407:2245-53
303. Lukowski JK, Weaver EM, Hummon AB. Analyzing Liposomal Drug Delivery Systems in Three-Dimensional Cell Culture Models Using MALDI Imaging Mass Spectrometry. Anal Chem. 2017;89:8453-8
304. Prideaux B, Dartois V, Staab D, Weiner DM, Goh A, Via LE. et al. High-sensitivity MALDI-MRM-MS imaging of moxifloxacin distribution in tuberculosis-infected rabbit lungs and granulomatous lesions. Anal Chem. 2011;83:2112-8
305. Kertesz V, Van Berkel GJ, Vavrek M, Koeplinger KA, Schneider BB, Covey TR. Comparison of drug distribution images from whole-body thin tissue sections obtained using desorption electrospray ionization tandem mass spectrometry and autoradiography. Anal Chem. 2008;80:5168-77
306. Khatib-Shahidi S, Andersson M, Herman JL, Gillespie TA, Caprioli RM. Direct molecular analysis of whole-body animal tissue sections by imaging MALDI mass spectrometry. Anal Chem. 2006;78:6448-56
307. Giordano S, Morosi L, Veglianese P, Licandro SA, Frapolli R, Zucchetti M. et al. 3D Mass Spectrometry Imaging Reveals a Very Heterogeneous Drug Distribution in Tumors. Sci Rep. 2016;6:37027
308. Cesca M, Morosi L, Berndt A, Fuso Nerini I, Frapolli R, Richter P. et al. Bevacizumab-Induced Inhibition of Angiogenesis Promotes a More Homogeneous Intratumoral Distribution of Paclitaxel, Improving the Antitumor Response. Mol Cancer Ther. 2016;15:125-35
309. Torok S, Rezeli M, Kelemen O, Vegvari A, Watanabe K, Sugihara Y. et al. Limited Tumor Tissue Drug Penetration Contributes to Primary Resistance against Angiogenesis Inhibitors. Theranostics. 2017;7:400-12
310. Goodwin RJ, Nilsson A, Mackay CL, Swales JG, Johansson MK, Billger M. et al. Exemplifying the Screening Power of Mass Spectrometry Imaging over Label-Based Technologies for Simultaneous Monitoring of Drug and Metabolite Distributions in Tissue Sections. J Biomol Screen. 2016;21:187-93
311. Fuchs K, Kiss A, Bize PE, Duran R, Denys A, Hopfgartner G. et al. Mapping of drug distribution in the rabbit liver tumor model by complementary fluorescence and mass spectrometry imaging. J Control Release. 2018;269:128-35
312. Liu X, Flinders C, Mumenthaler SM, Hummon AB. MALDI Mass Spectrometry Imaging for Evaluation of Therapeutics in Colorectal Tumor Organoids. J Am Soc Mass Spectrom. 2018;29:516-26
313. Bruinen AL, van Oevelen C, Eijkel GB, Van Heerden M, Cuyckens F, Heeren RM. Mass Spectrometry Imaging of Drug Related Crystal-Like Structures in Formalin-Fixed Frozen and Paraffin-Embedded Rabbit Kidney Tissue Sections. J Am Soc Mass Spectrom. 2016;27:117-23
314. Groseclose MR, Castellino S. An Investigation into Retigabine (Ezogabine) Associated Dyspigmentation in Rat Eyes by MALDI Imaging Mass Spectrometry. Chem Res Toxicol. 2019;32:294-303
315. Gamble LJ, Anderton CR. Secondary Ion Mass Spectrometry Imaging of Tissues, Cells, and Microbial Systems. Micros Today. 2016;24:24-31
316. Passarelli MK, Newman CF, Marshall PS, West A, Gilmore IS, Bunch J. et al. Single-Cell Analysis: Visualizing Pharmaceutical and Metabolite Uptake in Cells with Label-Free 3D Mass Spectrometry Imaging. Anal Chem. 2015;87:6696-702
317. Newman CF, Havelund R, Passarelli MK, Marshall PS, Francis I, West A. et al. Intracellular Drug Uptake-A Comparison of Single Cell Measurements Using ToF-SIMS Imaging and Quantification from Cell Populations with LC/MS/MS. Anal Chem. 2017;89:11944-53
318. Chandra S, Lorey ID, Smith DR. Quantitative subcellular secondary ion mass spectrometry (SIMS) imaging of boron-10 and boron-11 isotopes in the same cell delivered by two combined BNCT drugs: in vitro studies on human glioblastoma T98G cells. Radiat Res. 2002;157:700-10
319. Vanbellingen QP, Castellanos A, Rodriguez-Silva M, Paudel I, Chambers JW, Fernandez-Lima FA. Analysis of Chemotherapeutic Drug Delivery at the Single Cell Level Using 3D-MSI-TOF-SIMS. J Am Soc Mass Spectrom. 2016;27:2033-40
320. Giesen C, Wang HA, Schapiro D, Zivanovic N, Jacobs A, Hattendorf B. et al. Highly multiplexed imaging of tumor tissues with subcellular resolution by mass cytometry. Nat Methods. 2014;11:417-22
321. Chang Q, Ornatsky OI, Siddiqui I, Straus R, Baranov VI, Hedley DW. Biodistribution of cisplatin revealed by imaging mass cytometry identifies extensive collagen binding in tumor and normal tissues. Sci Rep. 2016;6:36641
322. Theiner S, Kornauth C, Varbanov HP, Galanski M, Van Schoonhoven S, Heffeter P. et al. Tumor microenvironment in focus: LA-ICP-MS bioimaging of a preclinical tumor model upon treatment with platinum(IV)-based anticancer agents. Metallomics. 2015;7:1256-64
323. Zandanel C, Legouffe R, Trochon-Joseph V, Tomezyk A, Gaudin M, Bonnel D. et al. Biodistribution of polycyanoacrylate nanoparticles encapsulating doxorubicin by Matrix-Assisted Laser Desorption Ionization (MALDI) Mass Spectrometry Imaging (MSI). J Drug Deliv Sci Technol. 2018;47:55-61
324. Fulop A, Sammour DA, Erich K, von Gerichten J, van Hoogevest P, Sandhoff R. et al. Molecular imaging of brain localization of liposomes in mice using MALDI mass spectrometry. Sci Rep. 2016;6:33791
325. Xue J, Liu H, Chen S, Xiong C, Zhan L, Sun J. et al. Mass spectrometry imaging of the in situ drug release from nanocarriers. Sci Adv. 2018;4:eaat9039
326. Aichler M, Elsner M, Ludyga N, Feuchtinger A, Zangen V, Maier SK. et al. Clinical response to chemotherapy in oesophageal adenocarcinoma patients is linked to defects in mitochondria. J Pathol. 2013;230:410-9
327. Yanagisawa K, Shyr Y, Xu BJ, Massion PP, Larsen PH, White BC. et al. Proteomic patterns of tumour subsets in non-small-cell lung cancer. The Lancet. 2003;362:433-9
328. Guo L, Panderi I, Yan DD, Szulak K, Li Y, Chen YT. et al. A comparative study of hollow copper sulfide nanoparticles and hollow gold nanospheres on degradability and toxicity. ACS Nano. 2013;7:8780-93
329. Mascini NE, Cheng M, Jiang L, Rizwan A, Podmore H, Bhandari DR. et al. Mass Spectrometry Imaging of the Hypoxia Marker Pimonidazole in a Breast Tumor Model. Anal Chem. 2016;88:3107-14
330. Masaki Y, Shimizu Y, Yoshioka T, Tanaka Y, Nishijima K, Zhao S. et al. The accumulation mechanism of the hypoxia imaging probe "FMISO" by imaging mass spectrometry: possible involvement of low-molecular metabolites. Sci Rep. 2015;5:16802
331. Venkatesan AM, Kadoury S, Abi-Jaoudeh N, Levy EB, Maass-Moreno R, Krücker J. et al. Real-time FDG PET guidance during biopsies and radiofrequency ablation using multimodality fusion with electromagnetic navigation. Radiology. 2011;260:848-56
332. Sheth RA, Heidari P, Esfahani SA, Wood BJ, Mahmood U. Interventional optical molecular imaging guidance during percutaneous biopsy. Radiology. 2014;271:770-7
333. Borresen B, Henriksen JR, Clergeaud G, Jorgensen JS, Melander F, Elema DR. et al. Theranostic Imaging May Vaccinate against the Therapeutic Benefit of Long Circulating PEGylated Liposomes and Change Cargo Pharmacokinetics. ACS Nano. 2018;12:11386-98
334. Yang CT, Ghosh KK, Padmanabhan P, Langer O, Liu J, Eng DNC. et al. PET-MR and SPECT-MR multimodality probes: Development and challenges. Theranostics. 2018;8:6210-32
335. Lahooti A, Sarkar S, Laurent S, Shanehsazzadeh S. Dual nano-sized contrast agents in PET/MRI: a systematic review. Contrast Media Mol Imaging. 2016;11:428-47
336. Key J, Leary JF. Nanoparticles for multimodal in vivo imaging in nanomedicine. Int J Nanomedicine. 2014;9:711-26
337. Porta Siegel T, Hamm G, Bunch J, Cappell J, Fletcher JS, Schwamborn K. Mass Spectrometry Imaging and Integration with Other Imaging Modalities for Greater Molecular Understanding of Biological Tissues. Mol Imaging Biol. 2018;20:888-901
338. Huber K, Feuchtinger A, Borgmann DM, Li Z, Aichler M, Hauck SM. et al. Novel approach of MALDI drug imaging, immunohistochemistry, and digital image analysis for drug distribution studies in tissues. Anal Chem. 2014;86:10568-75
339. Zhu Y, Wang X, Chen J, Zhang J, Meng F, Deng C. et al. Bioresponsive and fluorescent hyaluronic acid-iodixanol nanogels for targeted X-ray computed tomography imaging and chemotherapy of breast tumors. J Control Release. 2016;244:229-39
340. Park J, Pei Y, Hyun H, Castanares MA, Collins DS, Yeo Y. Small molecule delivery to solid tumors with chitosan-coated PLGA particles: A lesson learned from comparative imaging. J Control Release. 2017;268:407-15
341. Sun Q, You Q, Wang J, Liu L, Wang Y, Song Y. et al. Theranostic Nanoplatform: Triple-Modal Imaging-Guided Synergistic Cancer Therapy Based on Liposome-Conjugated Mesoporous Silica Nanoparticles. ACS Appl Mater Interfaces. 2018;10:1963-75
342. Tata A, Zheng J, Ginsberg HJ, Jaffray DA, Ifa DR, Zarrine-Afsar A. Contrast Agent Mass Spectrometry Imaging Reveals Tumor Heterogeneity. Anal Chem. 2015;87:7683-9
343. Abdelmoula WM, Regan MS, Lopez BGC, Randall EC, Lawler S, Mladek AC. et al. Automatic 3D Nonlinear Registration of Mass Spectrometry Imaging and Magnetic Resonance Imaging Data. Anal Chem. 2019;91:6206-16
344. Thiele H, Heldmann S, Trede D, Strehlow J, Wirtz S, Dreher W. et al. 2D and 3D MALDI-imaging: conceptual strategies for visualization and data mining. Biochim Biophys Acta. 2014;1844:117-37
345. Oetjen J, Aichler M, Trede D, Strehlow J, Berger J, Heldmann S. et al. MRI-compatible pipeline for three-dimensional MALDI imaging mass spectrometry using PAXgene fixation. J Proteomics. 2013;90:52-60
346. Sinha TK, Khatib-Shahidi S, Yankeelov TE, Mapara K, Ehtesham M, Cornett DS. et al. Integrating spatially resolved three-dimensional MALDI IMS with in vivo magnetic resonance imaging. Nat Methods. 2008;5:57-9
347. Van de Plas R, Yang J, Spraggins J, Caprioli RM. Image fusion of mass spectrometry and microscopy: a multimodality paradigm for molecular tissue mapping. Nat Methods. 2015;12:366-72
Author contact
![]() Corresponding author: Ms. Josanne Sophia de Maar <j.s.demaarnl>
Corresponding author: Ms. Josanne Sophia de Maar <j.s.demaarnl>