Impact Factor
- Issue 14; 2026
- Issue 13; 2026
- Issue 12; 2026
- Issue 11; 2026
- Issue 10; 2026
- Volume 16; 2026
- Advance Articles
- Past Issues
- Cover Images
- Cover Suggestion
- Index & Coverage
- Special Issues
Introduction
Experimental Section
Results and Discussions
Conclusions
Supplementary Material
Acknowledgements
References
International Journal of Biological Sciences
International Journal of Medical Sciences
 Global reach, higher impact

Theranostics 2020; 10(4):1544-1554. doi:10.7150/thno.40439 This issue Cite
Research Paper
Glucose Oxidase-Instructed Traceable Self-Oxygenation/Hyperthermia Dually Enhanced Cancer Starvation Therapy
Ting He1,2*, Han Xu1*, Yifan Zhang1, Shijian Yi3, Run Cui1, Shaojun Xing1, Chaoliang Wei1, Jing Lin1, Peng Huang1 ![]()
1. Marshall Laboratory of Biomedical Engineering, International Cancer Center, Laboratory of Evolutionary Theranostics (LET), School of Biomedical Engineering, Shenzhen University Health Science Center, Shenzhen 518060, China.
2. Key Laboratory of Optoelectronic Devices and Systems of Ministry of Education and Guangdong Province, College of Optoelectronic Engineering, Shenzhen University, Shenzhen 518060, China.
3. Department of General Surgery, Shenzhen University General Hospital, Shenzhen 518055, China.
*These authors contributed equally to this work.
Received 2019-9-18; Accepted 2019-11-4; Published 2020-1-1
Abstract

Cancer theranostics based on glucose oxidase (GOx)-induced starvation therapy has got more and more attention in cancer management. Herein, GOx armed manganese dioxide nanosheets (denoted as MNS-GOx) were developed as cancer nanotheranostic agent for magnetic resonance (MR)/photoacoustic (PA) dual-modal imaging guided self-oxygenation/hyperthermia dually enhanced starvation cancer therapy. The manganese dioxide nanomaterials with different morphologies (such as nanoflowers, nanosheets and nanowires) were synthesized by a biomimetic approach using melanin as a biotemplate. Afterwards, the manganese dioxide nanosheets (MNS) with two sides and large surface area were selected as the vehicle to carry and deliver GOx. The as-prepared MNS-GOx can perform the circular reaction of glucose oxidation and H2O2 decomposition for enhanced starvation therapy. Moreover, the catalytic activity of GOx could be further improved by the hyperthermia of MNS-GOx upon near-infrared laser irradiation. Most intriguingly, MNS-GOx could achieve “turn-on” MR imaging and “turn-off” PA imaging simultaneously. The theranostic capability of MNS-GOx was evaluated on A375 tumor-bearing mice with all tumor elimination. Our findings integrated molecular imaging and starvation-based synergistic cancer therapy, which provided a new platform for cancer nanotheranostics.
Keywords: manganese oxidase, melanin, photothermal therapy, starvation therapy, synergistic therapy.
Introduction
Glucose is an important source of energy in living organisms, the occurrence and development of many diseases are closely related to the glucose metabolism1-2. Utilization of glucose oxidation through the catalytic reaction of glucose oxidase (GOx) can cut off energy supply to inhibit the tumor growth3-5, which are known as GOx-based starvation therapy that has attracted more and more attention in cancer management in recent years4, 6-11. However, the starvation therapies based on GOx are restricted by the hypoxic state of tumor tissues, because glucose oxidation reactions need a large amount of oxygen (O2)12-13. Therefore, how to improve the O2 level of tumor tissues will directly decide the therapeutic effect of GOx-based starvation therapy.
The products of glucose oxidation are including gluconic acid and hydrogen peroxide (H2O2). Meanwhile, tumor microenvironments also contain a high content of H2O2. As we know, the decomposition of H2O2 can produce water and O2, thus promising the melioration of tumor hypoxia. Manganese oxide (MnO2) nanomaterials can catalyze decomposition reaction to produce O2 to modulate solid tumor hypoxia for effective starvation therapy14-18. Therefore, the combination of MnO2 and GOx will accelerate glucose consumption to improve the starvation therapeutic effect. Recently, MnO2-based theranostic agents have been widely explored14,19-23, such as urchin-shaped MnO2 nanoparticles17, 24-25, hollow MnO2 nanoplatform26-27, MnO2 nanosheets28-31 and Mn-based layered double hydroxide32 and so on. However, most of MnO2 nanomaterials need polyethylene glycol (PEG) modification to improve their biocompatibility and water solubility28. Melanin, an endogenous biomolecule, has been employed as coating materials to endow nanoplatforms with good biocompatibility, dispersibility, and strong near-infrared (NIR) absorption33-37. Moreover, melanin-based nanoplatforms have great potential in the biomedical applications of photoacoustic imaging (PAI) and photothermal therapy (PTT).
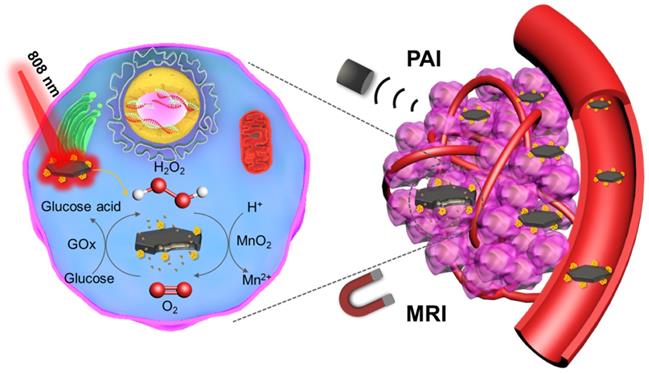
Herein, we used melanin as the biotemplate to directly synthesize MnO2 nanomaterials with different morphologies (such as nanoflowers, nanosheets and nanowires). The melanin coated MnO2 have good biocompatibility and strong NIR absorption. Afterwards, GOx armed manganese dioxide nanosheets (denoted as MNS-GOx) were explored for cancer nanotheranostics with following characteristics (Scheme 1): (i) the circular reaction of glucose oxidation and H2O2 decomposition; (ii) the enhancement of catalytic activity of GOx by the hyperthermia of MNS-GOx; (iii) activatable magnetic resonance (MR)/photoacoustic (PA) dual-modal imaging. The theranostic capability of MNS-GOx was carefully investigated both in vitro and in vivo. The as-prepared MNS-GOx has great potential in traceable cancer therapy, especially for MR/PA dual-modal imaging guided self-oxygenation/hyperthermia dually enhanced starvation cancer therapy.
Schematic illustration of MNS-GOx for magnetic resonance (MR)/photoacoustic (PA) dual-modal imaging guided self-oxygenation/hyperthermia dually enhanced starvation cancer therapy.
Experimental Section
Synthesis of MNS
MnO2 nanosheets (MNS) were synthesized by the biomimetic synthesis method using melanin as the biomimetic template. Typically, 0.4 mL melanin (2 mg/mL) and 3.2 mL ethanol were added into 48 mL deionized (DI) water. The pH value of the mixed solution was adjusted to 7.4~7.8. Then the solution was heated to 90 °C, 0.32 mL potassium permanganate (KMnO4) (0.05 M) was slowly added under vigorous stirring. The system was kept stirring for 30 min at 90 °C. The product was purified and concentrated by an ultrafilter (30 kDa).
Synthesis of MNS-GOx
GOx was conjugated on the surface of MNS through the 1-(3-Dimethylaminopropyl)-3-ethylcarbodiimide hydrochloride (EDC)/N-Hydroxysuccinimide (NHS) reaction between carboxyl groups of MNS and amine groups of GOx. In brief, 10 mg EDC and 5 mg NHS were added into 4 mL MNS (1 mg/mL). After 2 h, 40 µL GOx (2 mg/mL) was added and the mixture solution was stirred for another 8 h. The MNS-GOx was washed with DI water for several times and suspended in water for further use. In further experiments, the ratios of 200:1 and 1:1 of MNS: GOx were prepared for in vitro and in vivo experiments, respectively.
Characterization
The morphologies of MnO2 nanomaterials were observed by high-resolution field emission transmission electron microscope (TEM) (JEM-3200FS, JEOL, Japan). The thickness of MNS was measured by atom force microscope (AFM) (MultiMode 8, Bruker, Germany). X-ray diffraction (XRD) pattern of MNS was detected by X-ray diffractometer (D8 Advance, Bruker, Germany). Dynamic light scattering (DLS) and Zeta potential was measured on Zetasizer Nano-ZS90 (Malven, England). Fourier-transform infrared (FT-IR) spectra were collected on a FT-IR spectrometer (Spectrum Two, PerkinElmer, USA). UV/Vis absorption spectra were measured on a Cary 60 UV/Vis spectrophotometer (Agilent Technologies, Santa Clara, CA, USA). The Mn element concentration of MNS was quantified by an inductively coupled plasma-atomic emission spectrometry (ICP-AES) (JY 2000-2, Horiba, France).
pH-Responsive Degradations of MNS and MNS-GOx
The pH-responsive degradations of MNS and MNS-GOx were monitored by UV/Vis spectrophotometer. The optical density (OD) at 400 nm of MNS (100 µg/mL) or MNS-GOx (100 µg/mL) in PBS solutions (5 mM glucose, pH 7.4) was measured over time. Additionally, 4 mL of MNS (100 µg/mL) or MNS-GOx (100 µg/mL) was loaded into a dialysis bag with the molecular weight cut-off of 3500 Da. Then the bag was immersed into 50 mL of buffer solutions with different pH values (5 mM glucose pH 5.0, 6.0, 7.4) under vigorous stirring at room temperature. At different time points, 2 mL of buffer solution was taken out and the released Mn2+ was detected by ICP-AES. Meanwhile, an isometric buffer solution was added to keep the total volume same.
Photothermal Performance of MNS
The aqueous solutions of MNS (0~200 µg/mL) were stored in Eppendorf tubes, and exposed to 808 nm laser at power density of 1 W/cm2 for 3 min. The photothermal stability of MNS (200 µg/mL) were irradiated upon different laser power density of 1 W/cm2 for four on/off cycles (on: 2 min, off: 6 min). Real-time thermal imaging was recorded by a SC300 infrared camera (FLIR, Arlington, VA) and quantified by FLIR Examiner software.
T1 Relaxivity of MNS and MNS-GOx
MNS and MNS-GOx with different Mn element concentration (0.2, 0.4, 0.6, 0.8, 1.0 mM) were dispersed in PBS solutions with different pH values (5, 6, 7.4) for 4 h. Then the T1 relaxivity was detected by a 3 T clinical MRI scanner (UMR 790, United-Imaging, Shanghai, China). An fast spin echo (FSE) sequence with 19 different values of T1 (TR (repetition time)=5000 ms; TE (ehco time) =100, 150, 200, 250, 300, 350, 400, 450, 500, 550, 600, 700, 800, 900, 1000, 1200, 1300, 1500, 2000 ms) for T1 measurements. T1 relaxation times were calculated by fitting the signal intensities with increasing T1 to I(t)=I0[1-k•exp(-t/T1)] by using a nonlinear least-squares fit of the Levenberg-Marquardt algorithm.
Catalytic Activity of GOx
30 µL of MNS-GOx (1 mg/mL) or GOx (1 mg/mL) was added into 1 mL of glucose solution (30 mM) under oxygen gas flow (5 mL/min). The glucose concentrations were immediately detected by Yuwell 590 glucometer at different time points (0, 2, 4, 6, 8 min). Moreover, the glucose solutions were heated up to 30, 40, 50 or 60 ºC. The kinetic parameters (Vmax) of GOx obtained from the Michaelis-Menten plots at different temperatures38-41. Meanwhile, the catalytic activity of GOx in MNS-GOx was investigated before and after laser irradiation (808 nm laser, 1 W/cm2 for 5 min).
In Vitro Synergistic Therapy
For in vitro synergistic therapy, four parallel groups were set: control, MNS + laser, MNS-GOx, and MNS-GOx + laser. A375 cells were seeded into a 96-well plate at 104/well and then cultured at 37 °C for 24 h. The cells were incubated with MNS or MNS-GOx (0~1 mM) for 4 h and then exposed to an 808 nm laser at 1 W/cm2 for 5 min. Then the old dulbecco's modified eagle medium (DMEM) media were removed and 5 mg/mL 3-(4,5-dimethylthiazol-2-yl)-2,5-diphenyltetrazolium bromide (MTT) in 100 μL DMEM media was added into each well. After co-incubation for another 4 h, the old DMEM media were replaced with 150 μL dimethylsulfoxide (DMSO) per well, and the absorbance at 490 nm was monitored by a microplate reader. The cytotoxicity was finally expressed as the viabilities of different-treated cells in contrast to the untreated control cells.
A375 cells were seeded into a 12-well plate at 7*104/well and then cultured at 37 °C for 24 h. MNS or MNS-GOx (1 mM, DMEM media) was added into each well and co-incubated for 4 h. Then the cells were exposed to an 808 nm laser at 1W/cm2 for 5 min. After co-incubation for another 24 h, the cells were co-stained by Calcein acetoxymethyl ester (calcein AM) and propidium iodide (PI), and then imaged using an Olympus FV1000 fluorescent microscope.
In Vivo MR/PA Dual-Modal Imaging
The tumor-bearing nude mice (∼20 g) were intratumoral injected with MNS or MNS-GOx (5 mg/kg). Magnetic resonance imaging (MRI) was performed by a UMR 790 3.0T (United-Imaging, Shanghai, China). T1-weighted images were acquired by FSE sequence at 0, 0.5, 1, 4, 8, 24 h and the parameters were as follows: TR=700 ms; TE=14.3 ms; Flip Angle=145 º; matrix size, 160 × 160; slice thickness, 1.5 mm. Signal intensities were measured in defined regions of interest (ROI) with software named Image J. The PA images were recorded by a Vevo LAZR2100 system (VisualSonics Inc. New York, NY) equipped with a 40 MHz, 256-element linear array transducer on tumors.
In Vivo Synergistic Therapy
A375 cells were implanted subcutaneously into nude mice (∼20 g). In vivo treatment was performed when the tumor reached 6 mm in average diameter (10 days after implant). The mice were divided into six groups: PBS as the control group; PBS with laser irradiation (PBS + laser); MNS; MNS-GOx; MNS with laser irradiation (MNS + laser); MNS-GOx with laser irradiation (MNS-GOx + laser). For laser irradiation groups, 808 nm laser with the power of 0.6 W/cm2 was used to irradiate tumor tissues for 5 min after intratumoral injection (dose: 5 mg/kg). For each group, the tumor volumes and body weight were measured every two days, and volume of tumors was calculated as (tumor length) × (tumor width/2)2. Relative tumor volume was calculated as V/V0 (V0 is the tumor volume when the treatment was initiated).
Hemolysis Assay
The red blood cells (RBCs) were isolated from serum by centrifugation of the mixture containing 0.5 mL blood sample and 1 mL PBS solution at 4500 rpm for 3.5 min, then washed the RBCs over five times and diluted the purified cells to 5 mL. Then 0.3 mL volume diluted RBCs suspension was added to quadruple volume of PBS solution with different concentrations of MNS (12.5 to 400 µg/mL). The mixtures were vortexed and kept to stand for 4 h at room temperature. Samples were then centrifuged to measure the absorbance of the supernatants at 541 nm by an UV-vis spectroscopy. RBCs treated with deionized water and PBS were set as positive and negative controls.
Ex vivo Histological Staining
Tumor tissues were collected from tumor-bearing mice in different groups at day 16 and sectioned into slices for hematoxylin and eosin (H&E) staining. For the toxicity evaluation of MNS or MNS-GOx, mice with intratumoral injection of MNS or MNS-GOx (dose: 5 mg/kg) were sacrificed at day 30 (3 mice per group). Then tumor tissues and major organs (including heart, liver, spleen, lung, kidney and tumor.) were collected, fixed in 10% neutral buffered formalin, embedded in paraffin, cut into 4 µm sections and stained with H&E. Finally, the images of these histological tissue sections were obtained by a BX41 bright field microscopy (Olympus).
Statistical Analysis
Data were presented as mean ± standard deviation (SD). Statistical differences among experimental groups were analyzed using one-way analysis of variance (ANOVA) followed by two-tailed Student's t test. P < 0.05 was considered as statistically significant.
Results and Discussions
Preparation and Characterization of MNS and MNS-GOx
MNS were prepared by one-step reduction of KMnO4 using melanin as a template under neutral conditions, and then modified with GOx by a cross-linker, as shown in Figure 1A. Due to an abundant of catechol groups of melanin, it can anchor on the surface of metals oxides42. Therefore, the morphologies of MnO2 were strongly depended on the solubility of melanin under different reaction conditions. The as-prepared MnO2 nanomaterials were nanoflowers (Figure 1B) at acidic condition (pH < 7), ultrathin nanosheets (Figure 1C) at neutral condition (pH 7) and nanowires (Figure 1D) at alkaline condition (pH 10). The nanoflowers can be formed when the decomposition rate of KMnO4 was faster in acidic condition and the nanowires were probably formed when the solubility of melanin increased in alkaline solution43. The MNS with two sides and large surface area was chosen as the vehicle to carry and deliver GOx. As shown in Figure S1, the hydrodynamic diameter of MNS was about ~70 nm measured by DLS. High resolution TEM image of MNS indicated that the lattice fringe spacing of MNS were 0.232 and 0.288 nm (Figure S2), which can be attributed to (311) and (411) according to the XRD pattern (Figure S3). EDS spectrum confirmed the high concentration of manganese and oxygen elements in MNS, which is further supported by element mapping images in Figure S4. As shown in Figure S5, the thickness of MNS was ~ 2 nm, which indicated the MNS with ultrathin sheet structure.
(A) Scheme of the synthesis process of MNS-GOx. TEM images of nanoflowers (B), nanosheets (C), nanowires (D). Scale bar: 200 nm. (E) UV-vis-NIR absorption spectrum of MNS. (F) FT-IR spectra of melanin, MNS, GOx and MNS-GOx. (G) Zeta potentials of MNS and MNS-GOx.
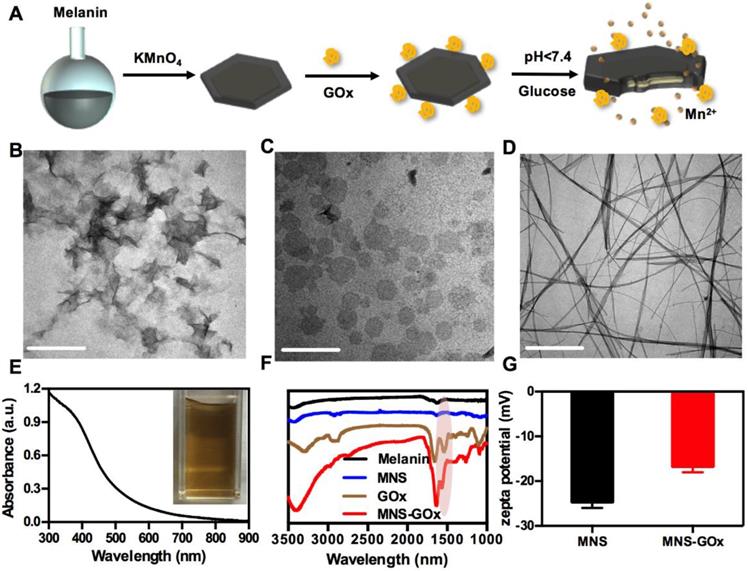
Melanin as the biotemplate plays an important role in regulating the morphology of MnO2 nanomaterials during the synthesis process. It can be adsorbed on the surface of MNS through the abundant catechol groups of melanin42, 44. As shown in Figure 1E, UV-vis-NIR absorption spectrum of MNS contained the broad absorbance of melanin35 and the characteristic peak of MnO2 (~400 nm)44. The absorbance at 808 nm of MNS was positively correlated with MnO2 concentration, and the typical equation was Y = 0.003X + 0.0102 (R2 = 0.9736) (Figure S6). The photothermal effect of MNS exhibited a MNS concentration-dependent under 808 nm laser irradiation (Figure S7A-C). After 4 cycles of laser irradiation, MNS still remained its excellent photothermal conversion property, suggested that MNS has a great photostability (Figure S7D). The melanin modified MnO2 had a large number of carboxyls for further surface modification. GOx can be covalently conjugated onto the surface of MNS by EDC/NHS reaction. FT-IR spectrum of MNS-GOx showed a new peak at about 1650 cm-1, indicating that GOx was successfully grafted onto the surface of MNS (Figure 1F). The zeta potentials of MNS and MNS-GOx were -24.6 and -16.7 mV, respectively (Figure 1G). These results indicated GOx was successfully loaded by MNS.
pH-Responsive Degradation of MNS-GOx
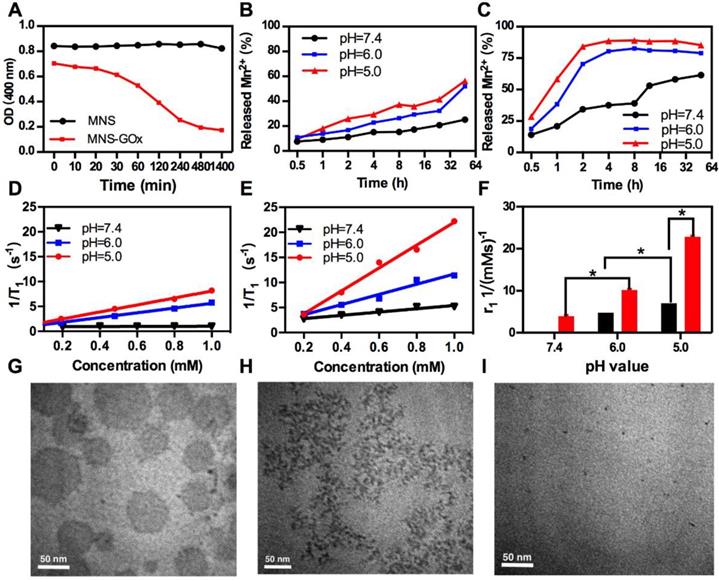
MnO2 nanomaterials can be decomposed into Mn2+ in the tumor microenvironment for MRI and alleviating the hypoxia of tumor24, 28, 45-46. As shown in Figure 2A, the OD at 400 nm of MNS-GOx decreased from 0.70 to 0.17 within 8 h in 5 mM glucose solution, while that of MNS kept stable at about 0.84. Because MNS-GOx can catalyze glucose to produce gluconic acid and H2O2, which promoted the degradation of MNS. The color of MNS-GOx solution was changed from brown to colorless over time (Figure S8). Moreover, the quantified concentration of Mn2+ released from MNS or MNS-GOx was further verified the degradation of MNS. As shown in Figure 2B-C, the Mn2+ released from MNS-GOx can reach 89% at pH 5, but it was only 56.3% of MNS at the same condition. The concentration of released Mn2+ will directly affect the following longitudinal relaxivity (r1). Because the released Mn2+ had five unpaired electrons, Mn-based contrast agents have been widely explored as T1 contrast agents. Based on the profile of 1/T1 vs Mn element concentration of MNS (Figure 2D) and MNS-GOx (Figure 2E), the r1 MNS increased from 0.084 to 7.0 mM-1s-1 from pH 7.4 to 5.0, while r1 MNS-GOx increased from 3.3 to 22.8 mM-1s-1(Figure 2F). The r1 MNS enhancement is due to the pH-responsive degradation of MNS, while the r1 MNS-GOx enhancement is due to pH/glucose dual-responsive degradation of MNS, which accelerated the release of Mn2+. In order to observe the degradation process of MNS-GOx, their morphology change was recorded by TEM imaging. As shown in Figure 2G-I, when MNS-GOx was incubated with 5 mM glucose, most of MNS was decomposed at 17 min, and no MNS can be found at 30 min. These results suggested MNS-GOx exhibited pH/glucose dual-responsive performance.
(A) The OD at 400 nm of MNS and MNS-GOx in PBS solutions (5 mM glucose, pH 7.4). The quantified concentration of Mn2+ released from MNS (B) or MNS-GOx (C) in PBS solutions (5 mM glucose, pH 5.0, 6.0, 7.4). The profile of 1/T1 vs Mn element concentration in MNS (D) and MNS-GOx (E) after 4 h incubation in PBS solutions (5 mM glucose, pH 5.0, 6.0, 7.4). (F) The corresponding T1 relaxivity of MNS and MNS-GOx solutions. TEM images of MNS-GOx in PBS solutions (5 mM glucose, pH 7.4), before (G), 17 min (H), and 30 min (I).
In vitro Synergistic Therapy
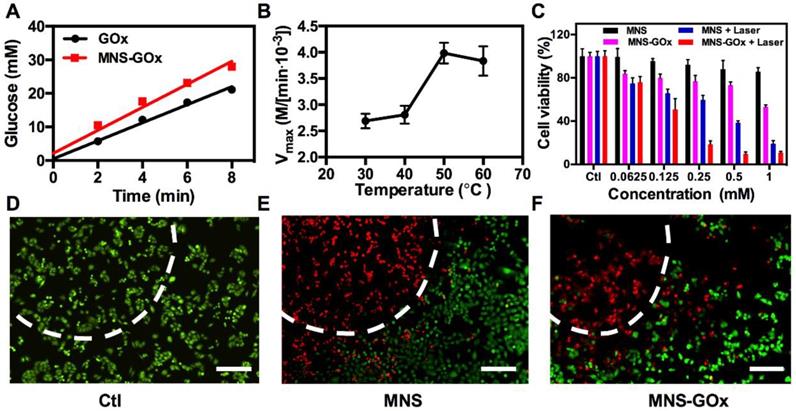
MnO2 nanomaterials can catalyze the decomposition reaction of H2O2 to produce O2, which can promote the reaction of glucose oxidation16. As shown in Figure 3A, the glucose oxidation rate of GOx and MNS-GOx were 2.69 and 3.43 mM/min, respectively. The catalytic activity enhancement of GOx by MNS can be attributed to the self-oxygenation of MNS-GOx during the glucose oxidation reaction that is an O2-depandent reaction. Afterwards, we investigated the catalytic activity of GOx at different temperature. The glucose concentrations were recorded by a glucometer, and extra O2 was supplied into glucose solution for sufficient O2 during the reaction. The results shown that Vmax of MNS-GOx increased from 2.69✕103 M/min at 30 °C to 3.43✕103 M/min at 50 °C (Figure 3B). It was consistent with previous reports that the maximum activity of GOx at 50 °C 40-41, 47-48. Encouraged by the catalytic activity enhancement of GOx at high temperature, in vitro experiments were conducted on A375 cells for hyperthermia-enhanced synergistic therapy. MNS or MNS-GOx was incubated with A375 cells for 24 h, and then irradiation with or without 808 nm laser (1 W/cm2, 5 min). As shown in Figure 3C, cells incubated with MNS kept their viability over 81%. Cell viabilities of MNS + laser, MNS-GOx and MNS-GOx + Laser groups showed concentration-dependent therapeutic effect. Importantly, MNS-GOx + laser group exhibited better therapeutic effect than that of MNS-GOx only. The synergistic therapeutic effect was further evidenced by live/dead cell staining (Figure 3D-F). No dead cells were found in control group (Figure 3D). For MNS + laser and MNS-GOx + laser groups, most of cells were dead in laser spots (Figure 3E-F). These results indicated the catalytic activity of GOx could be further improved by the hyperthermia of MNS-GOx upon 808 nm laser irradiation. Additionally, we assessed the catalytic activity of GOx before and after laser irradiation. As shown in Figure S9, the glucose reaction rates of MNS-GOx kept similar, which suggested the laser irradiation (808 nm, 1 W/cm2, 5 min) can preserve the catalytic activity of GOx.
(A) The glucose oxidation rates of GOx and MNS-GOx at room temperature. (B) Kinetic parameters (Vmax) of GOx obtained from the Michaelis-Menten plots at different temperatures. (C) A375 cell viability with four different treatments, including: control, MNS, MNS-GOx, MNS + laser, MNS-GOx + laser. Fluorescence images of Calcein AM (live cells, green fluorescence) and propidium iodide (PI) (dead cells, red fluorescence) co-stained A375 cells with different treatments, including control (D), MNS (E), MNS-GOx (F) (100 μg mL-1) for 12 h with/without laser irradiation (808 nm, 1 W cm-2, 5 min). Scale bar 100 µm.
In Vivo Dual-Modal Imaging
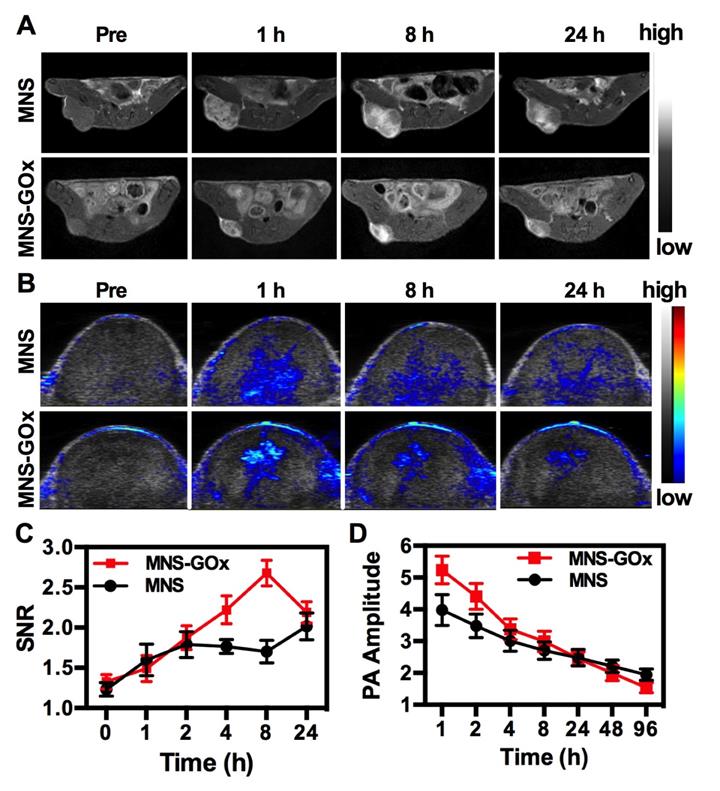
MNS-GOx was composed of Mn element and melanin, which can be used as contrast agents for MRI and PAI, respectively. In vivo MR/PA dual-modal imaging was performed on the A375 tumor-bearing mice. MNS or MNS-GOx was intratumoral injected into A375 tumor-bearing mice at 5 mg/kg dose. Then the treated mice were scanned on 3T clinic MRI scanner. Both MNS and MNS-GOx displayed an obvious T1-weighted enhancement in tumor tissues (Figure 4A). Compared with MNS treated mice, mice in MNS-GOx group exhibited stronger contrast effect at each scan time point. Because MNS-GOx are pH/glucose dual-responsive, it can release more Mn2+ in tumor microenvironment than MNS, and the concentration of released Mn2+ will directly affect the longitudinal relaxivity and MRI contrast effect. So MNS-GOx group exhibited stronger contrast effect compared with MNS group. On the contrary to the increase of MR signal, PA signal of gradually decreased after injection over time (Figure 4B, Figure S10). As shown in Figure 4C, the quantified MR signal/noise ratio (SNR) of tumors treated with MNS-GOx gradually increased to the peak value of 2.67 at 8 h post-injection, while the SNR of tumors treated with MNS was only increased to 2.0 at 24 h post-injection. As shown in Figure 4D, the quantified PA signals of tumors treated with MNS or MNS-GOx gradually decreased over time. These results suggested MNS-GOx could achieve “turn-on” MR imaging and “turn-off” PA imaging simultaneously. MRI can offer high resolution contrast for soft tissue without tissue depth limits, but restricted by its poor sensitivity and time-consuming. PAI is convenient and time-saving possesses high optical imaging contrast, but limited imaging depth. So the dual-model imaging can integrate different information to provide accurate diagnosis. A “turn on” MRI can light the deep tissues for precision cancer diagnosis, and the “turn off” PAI can monitor the treatment progress for individual treatment.
T1-weigthed MR (A) and PA images of mice treated with MNS or MNS-GOx at 0, 1, 8, 24 h post-injection. (C) The corresponding MR signal SNR analysis of tumor tissues in (A). (D) The corresponding PA signals of tumor tissues in (B).
In Vivo Synergistic Therapy
Based on in vitro synergistic PTT/starvation therapy effect, the in vivo synergistic therapy was conducted on A375 tumor-bearing mice. Mice were randomly divided into six groups: PBS, laser only, MNS, MNS+laser, MNS-GOx and MNS-GOx+laser. For all groups, the intratumoral injection dose was 5 mg/kg. For laser groups, 808 nm laser (0.6 W/cm2, 5 min) was immediately irradiated on A375 tumor tissues after injection. The tumor volumes were measured every 2 days during 16 days. As shown in Figure 5A, the tumors of PBS and PBS + laser groups grew very fast, while MNS-GOx treated group shown great suppression effect compared with MNS group. Interestingly, the tumors of MNS-GOx + laser group were completely eliminated; while MNS + laser group began to regrow at 10 days after treatment.
(A) Tumor growth curve, (B) survival curve and (C) body weight of A375 tumor-bearing mice (PBS, laser only, MNS, MNS+laser, MNS-GOx and MNS-GOx+laser) during the treatment process. (D) Digital photographs of A375 tumor-bearing mice of six groups after treatments. (E) H&E staining images of tumor sections harvested from A375 tumor-bearing mice (PBS, MNS only, MNS-GOx, MNS+laser and MNS-GOx+laser) after treatments. Scale bar: 100 µm. ***p<0.001.
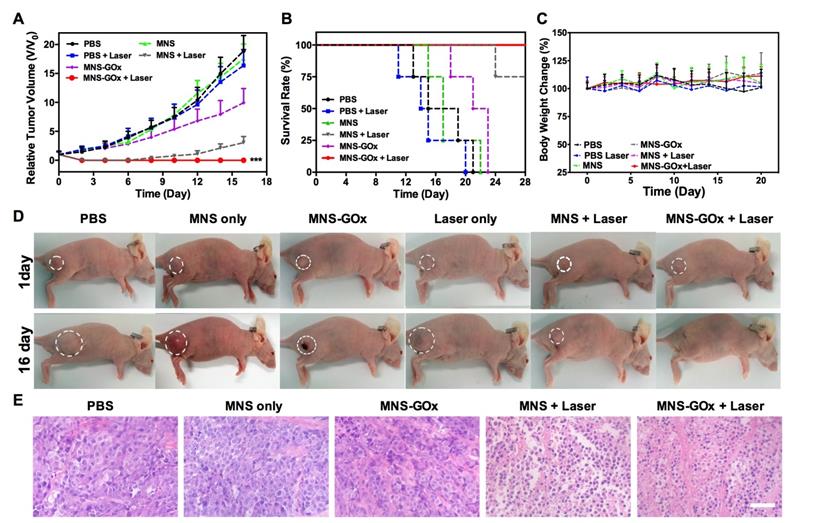
On the one hand, the increase of tumor local temperature upon laser irradiation can improve the catalytic activity of GOx, thus consuming more intratumoral glucose(∼50 °C, Figure S11), on the other hand, MNS-GOx can perform the circular reaction of glucose oxidation and H2O2 decomposition for enhanced starvation therapy. The self-oxygenation/hyperthermia dually enhanced starvation cancer therapy shown higher tumor suppression effect than any single treatment. Furthermore, the survival rate of mice in MNS-GOx group was greatly prolonged (Figure 5B). All treated mice had no obvious body weight change during different treatments (Figure 5C). The photographs of A375 tumor-bearing mice further evidenced the synergistic PTT/starvation effect (Figure 5D). Hematoxylin and eosin (H&E) staining images of tumor sections after treatments also indicated an obviously membrane fragmentation or shrinkage of nuclei in MNS + laser group and MNS-GOx + laser group (Figure 5E). But no significant damage or inflammation from H&E stained images of main organs (heart, liver, spleen, lung, kidney), negligible change of blood biochemistry results, and the hemolysis rates of virous concentrations (15.5-400 µg/mL) of MNS were lower than 5.5% (Figure S12-14). These findings indicated that MNS-GOx exhibited a great potential in hyperthermia enhanced starvation synergistic therapy.
Conclusions
In summary, three different morphologies of MnO2 nanomaterials were successfully synthesized by a biomimetic approach using melanin as a biotemplate at different pH conditions. Afterwards, GOx loaded MnO2 nanosheets (MNS) was explored as cancer nanotheranostics, especially for self-oxygenation/hyperthermia dually enhanced starvation therapy. The as-prepared MNS can decompose H2O2 to supply O2 for the GOx catalyzed glucose oxidation reaction, thus promising the circular reaction of H2O2 decomposition and glucose oxidation. Moreover, the catalytic activity of GOx could be further improved by the hyperthermia of MNS-GOx upon NIR laser irradiation. Most intriguingly, MNS-GOx could achieve “turn-on” MR imaging and “turn-off” PA imaging simultaneously. The theranostic capability of MNS-GOx was evaluated both in vitro and in vivo. Finally, the as-prepared MNS-GOx exhibited pH/glucose dual-responsive performance, activatable MR/PA dual-modal imaging, and hyperthermia enhanced starvation synergistic cancer therapy, which provided a new nanoplatform for cancer nanotheranostics.
Supplementary Material
Supplementary figures.
Acknowledgements
This work is financially supported by the Basic Research Program of Shenzhen (JCYJ20180507182413022), the National Natural Science Foundation of China (51573096, 51703132, 31771036), the National Key Research and Development Program (2018YFA0704003), the Guangdong Province Natural Science Foundation of Major Basic Research and Cultivation Project (2018B030308003), the Fok Ying-Tong Education Foundation for Young Teachers in the Higher Education Institutions of China (161032). We thank Instrumental Analysis Center of Shenzhen University (Lihu Campus).
Competing Interests
The authors have declared that no competing interest exists.
References
1. Birsoy K, Possemato R, Lorbeer FK. et al. Metabolic determinants of cancer cell sensitivity to glucose limitation and biguanides. Nature. 2014;508:108-12
2. Wu D, Hu D, Chen H. et al. Glucose-regulated phosphorylation of tet2 by ampk reveals a pathway linking diabetes to cancer. Nature. 2018;559:637-41
3. Fan W, Lu N, Huang P. et al. Glucose-responsive sequential generation of hydrogen peroxide and nitric oxide for synergistic cancer starving-like/gas therapy. Angew Chem Int Ed Engl. 2017;56:1229-33
4. Fu LH, Qi C, Lin J. et al. Catalytic chemistry of glucose oxidase in cancer diagnosis and treatment. Chem Soc Rev. 2018;47:6454-72
5. Yu Z, Zhou P, Pan W. et al. A biomimetic nanoreactor for synergistic chemiexcited photodynamic therapy and starvation therapy against tumor metastasis. Nat Commun. 2018;9:5044-53
6. Zhao W, Hu J, Gao W. Glucose oxidase-polymer nanogels for synergistic cancer-starving and oxidation therapy. ACS Appl Mater Inter. 2017;9:23528-35
7. Chang K, Liu Z, Fang X. et al. Enhanced phototherapy by nanoparticle-enzyme via generation and photolysis of hydrogen peroxide. Nano Lett. 2017;17:4323-9
8. Li J, Dirisala A, Ge Z. et al. Therapeutic vesicular nanoreactors with tumor-specific activation and self-destruction for synergistic tumor ablation. Angew Chem Int Ed Engl. 2017;56:14025-30
9. Fu LH, Qi C, Hu YR. et al. Glucose oxidase-instructed multimodal synergistic cancer therapy. Adv Mater. 2019;31:e1808325
10. Chu C, Su M, Zhu J. et al. Metal-organic framework nanoparticle-based biomineralization: A new strategy toward cancer treatment. Theranostics. 2019;9:3134-49
11. Zhang YF, Yang YC, Jiang SS. et al. Degradable silver-based nanoplatform for synergistic cancer starving-like/metal ion therapy. Mater Horiz. 2019;6:169-75
12. Thews O, Wolloscheck T, Dillenburg W. et al. Microenvironmental adaptation of experimental tumours to chronic vs acute hypoxia. Br J Cancer. 2004;91:1181-8
13. Zheng X, Wang X, Mao H. et al. Hypoxia-specific ultrasensitive detection of tumours and cancer cells in vivo. Nat Commun. 2015;6:5834-46
14. Chen Q, Feng L, Liu J. et al. Intelligent albumin-MnO2 nanoparticles as pH-/H2O2-responsive dissociable nanocarriers to modulate tumor hypoxia for effective combination therapy. Adv Mater. 2016;28:7129-36
15. Prasad P, Gordijo CR, Abbasi AZ. et al. Multifunctional albumin-MnO2 nanoparticles modulate solid tumor microenvironment by attenuating hypoxia, acidosis, vascular endothelial growth factor and enhance radiation response. ACS Nano. 2014;8:3202-12
16. Yang X, Yang Y, Gao F. et al. Biomimetic hybrid nanozymes with self-supplied H+ and accelerated O2 generation for enhanced starvation and photodynamic therapy against hypoxic tumors. Nano Lett. 2019;19:4334-42
17. Lin T, Zhao X, Zhao S. et al. O2-generating MnO2 nanoparticles for enhanced photodynamic therapy of bladder cancer by ameliorating hypoxia. Theranostics. 2018;8:990-1004
18. Fan W, Yung B, Huang P. et al. Nanotechnology for multimodal synergistic cancer therapy. Chem Rev. 2017;117:13566-638
19. Zhao Z, Fan H, Zhou G. et al. Activatable fluorescence/mri bimodal platform for tumor cell imaging via MnO2 nanosheet-aptamer nanoprobe. J Am Chem Soc. 2014;136:11220-3
20. Lin LS, Song J, Song L. et al. Simultaneous fenton-like ion delivery and glutathione depletion by MnO2 -based nanoagent to enhance chemodynamic therapy. Angew Chem Int Ed Engl. 2018;57:4902-6
21. Gordijo CR, Abbasi AZ, Amini MA. et al. Design of hybrid MnO2-polymer-lipid nanoparticles with tunable oxygen generation rates and tumor accumulation for cancer treatment. Adv Funct Mater. 2015;25:1858-72
22. Yang R, Hou M, Gao Y. et al. Biomineralization-inspired crystallization of manganese oxide on silk fibroin nanoparticles for in vivo MR/fluorescence imaging-assisted tri-modal therapy of cancer. Theranostics. 2019;9:6314-33
23. Pan W, Ge Y, Yu Z. et al. A cancer cell membrane-encapsulated MnO2 nanoreactor for combined photodynamic-starvation therapy. Chem Commun. 2019;55:5115-8
24. Kim T, Cho EJ, Chae Y. et al. Urchin-shaped manganese oxide nanoparticles as pH-responsive activatable T1 contrast agents for magnetic resonance imaging. Angew Chem Int Ed Engl. 2011;50:10589-93
25. Hu D, Chen L, Qu Y. et al. Oxygen-generating hybrid polymeric nanoparticles with encapsulated doxorubicin and chlorin e6 for trimodal imaging-guided combined chemo-photodynamic therapy. Theranostics. 2018;8:1558-74
26. Yang G, Xu L, Chao Y. et al. Hollow MnO2 as a tumor-microenvironment-responsive biodegradable nano-platform for combination therapy favoring antitumor immune responses. Nat Commun. 2017;8:902-10
27. Shang J, Xie B, Li Y. et al. Inflating strategy to form ultrathin hollow MnO2 nanoballoons. ACS Nano. 2016;10:5916-21
28. Chen Y, Ye D, Wu M. et al. Break-up of two-dimensional MnO2 nanosheets promotes ultrasensitive pH-triggered theranostics of cancer. Adv Mater. 2014;26:7019-26
29. Chen JL, Li L, Wang S. et al. A glucose-activatable trimodal glucometer self-assembled from glucose oxidase and MnO2 nanosheets for diabetes monitoring. J Mater Chem B. 2017;5:5336-44
30. Sheng J, Jiang X, Wang L. et al. Biomimetic mineralization guided one-pot preparation of gold clusters anchored two-dimensional MnO2 nanosheets for fluorometric/magnetic bimodal sensing. Anal Chem. 2018;90:2926-32
31. Liu Z, Zhang S, Lin H. et al. Theranostic 2D ultrathin MnO2 nanosheets with fast responsibility to endogenous tumor microenvironment and exogenous NIR irradiation. Biomaterials. 2018;155:54-63
32. Li B, Gu Z, Kurniawan N. et al. Manganese-based layered double hydroxide nanoparticles as a T1 -MRI contrast agent with ultrasensitive pH response and high relaxivity. Adv Mater. 2017;29:1700373-8
33. Meredith P, Sarna T. The physical and chemical properties of eumelanin. Pigm. Cell Melanoma Res. 2006;19:572-94
34. Longo DL, Stefania R, Aime S. et al. Melanin-based contrast agents for biomedical optoacoustic imaging and theranostic applications. Int J Mol Sci. 2017;18:1719-20
35. Lin J, Wang M, Hu H. et al. Multimodal-imaging-guided cancer phototherapy by versatile biomimetic theranostics with UV and gamma-irradiation protection. Adv Mater. 2016;28:3273-9
36. Zhang L, Sheng D, Wang D. et al. Bioinspired multifunctional melanin-based nanoliposome for photoacoustic/magnetic resonance imaging-guided efficient photothermal ablation of cancer. Theranostics. 2018;8:1591-606
37. Zhang YF, Bo SW, Feng T. et al. A versatile theranostic nanoemulsion for architecture-dependent multimodal imaging and dually augmented photodynamic therapy. Adv Mater. 2019:31 e1806444
38. Zhang H, Liang X, Han L. et al. "Non-naked" gold with glucose oxidase-like activity: A nanozyme for tandem catalysis. Small. 2018 e1803256
39. Fan L, Lou D, Wu H. et al. A novel aunp-based glucose oxidase mimic with enhanced activity and selectivity constructed by molecular imprinting and O2-containing nanoemulsion embedding. Adv Mater Interfaces. 2018;5:1801070
40. Wang C, Zhang Q, Wang X. et al. Dynamic modulation of enzyme activity by near-infrared light. Angew Chem Int Ed Engl. 2017;56:6767-72
41. Golikova EP, Lakina NV, Grebennikova OV. et al. A study of biocatalysts based on glucose oxidase. Faraday Discuss. 2017;202:303-14
42. Ye Q, Zhou F, Liu W. Bioinspired catecholic chemistry for surface modification. Chem Soc Rev. 2011;40:4244-58
43. Guo X, Chen S, Hu Y. et al. Preparation of water-soluble melanin from squid ink using ultrasound-assisted degradation and its anti-oxidant activity. J Food Sci Tech Mys. 2013;51:3680-90
44. Park M, Lee N, Choi SH. et al. Large-scale synthesis of ultrathin manganese oxide nanoplates and their applications to T1 MRI contrast agents. Chem Mater. 2011;23:3318-24
45. Lim EK, Huh YM, Yang J. et al. pH-triggered drug-releasing magnetic nanoparticles for cancer therapy guided by molecular imaging by MRI. Adv Mater. 2011;23:2436-42
46. Fan W, Bu W, Shen B. et al. Intelligent MnO2 nanosheets anchored with upconversion nanoprobes for concurrent pH-/H2O2-responsive ucl imaging and oxygen-elevated synergetic therapy. Adv Mater. 2015;27:4155-61
47. Kriaa M, Hammami I, Sahnoun M. et al. Purification, biochemical characterization and antifungal activity of a novel aspergillus tubingensis glucose oxidase steady on broad range of pH and temperatures. Bioprocess Biosyst Eng. 2015;38:2155-66
48. Wu P, He Y, Wang HF. et al. Conjugation of glucose oxidase onto Mn-doped ZnS quantum dots for phosphorescent sensing of glucose in biological fluids. Anal Chem. 2010;82:1427-33
Author contact
![]() Corresponding author: Peng Huang, 1066 Xueyuan Boulevard Shenzhen University Health Science Center, Shenzhen, 518060, China. E-mail: peng.huangedu.cn (Peng Huang).
Corresponding author: Peng Huang, 1066 Xueyuan Boulevard Shenzhen University Health Science Center, Shenzhen, 518060, China. E-mail: peng.huangedu.cn (Peng Huang).