Impact Factor
- Issue 14; 2026
- Issue 13; 2026
- Issue 12; 2026
- Issue 11; 2026
- Issue 10; 2026
- Volume 16; 2026
- Advance Articles
- Past Issues
- Cover Images
- Cover Suggestion
- Index & Coverage
- Special Issues
Introduction
Results and Discussion
Conclusion
Experimental
Supplementary Material
Acknowledgements
References
International Journal of Biological Sciences
International Journal of Medical Sciences
 Global reach, higher impact

Theranostics 2020; 10(25):11607-11621. doi:10.7150/thno.46228 This issue Cite
Research Paper
Hemoglobin-mediated biomimetic synthesis of paramagnetic O2-evolving theranostic nanoprobes for MR imaging-guided enhanced photodynamic therapy of tumor
Xiudong Shi1,2#, Weitao Yang3#, Qiong Ma1, Yang Lu1, Yan Xu3, Kexin Bian3, Fengjun Liu1,4, Chunzi Shi1, Han Wang2 ![]() , Yuxin Shi1,4
, Yuxin Shi1,4 ![]() , Bingbo Zhang3
, Bingbo Zhang3 ![]()
1. Department of Radiology, Shanghai Public Health Clinical Center, Fudan University, Shanghai 201508, China.
2. Department of Radiology, Shanghai General Hospital, Shanghai Jiao Tong University School of Medicine, Shanghai 200080, China.
3. The Institute for Translational Nanomedicine, Shanghai East Hospital; The Institute for Biomedical Engineering & Nano Science, Tongji University School of Medicine, Shanghai 200092, China.
4. Translational Medicine Center, Shanghai Key Laboratory of Molecular Imaging, Shanghai University of Medicine and Health Sciences, Shanghai 201318, China.
#These authors contributed equally to this study.
Received 2020-3-22; Accepted 2020-9-7; Published 2020-9-19
Abstract

The hypoxic microenvironment in solid tumors severely limits the efficacy of photodynamic therapy (PDT). Therefore, the development of nanocarriers co-loaded with photosensitizers and oxygen, together with imaging guidance ability, is of great significance in cancer therapy. However, previously reported synthetic methods for these multi-functional probes are complicated, and the raw materials used are toxic.
Methods: Herein, the human endogenous protein, hemoglobin (Hb), was used for the simultaneous biomimetic synthesis of Gd-based nanostructures and co-loading of Chlorine e6 (Ce6) and oxygen for alleviating the hypoxic environment of tumors and accomplishing magnetic resonance imaging (MRI)-guided enhanced PDT. The Gd@HbCe6-PEG nanoprobes were synthesized via a green and protein biomimetic approach. The physicochemical properties, including relaxivity, oxygen-carrying/release capability, and PDT efficacy of Gd@HbCe6-PEG, were measured in vitro and in vivo on tumor-bearing mice after intravenous injection. Morphologic and functional MRI were carried out to evaluate the efficacy of PDT.
Results: The results demonstrated the successful synthesis of compact Gd@HbCe6-PEG nanostructures with desired multi-functionalities. Following treatment with the nanoparticles, the embedded MR moiety was effective in lighting tumor lesions and guiding therapy. The oxygen-carrying capability of Hb after biomimetic synthesis was confirmed by spectroscopic analysis and oxygen detector in vitro. Further, tumor oxygenation for alleviating tumor hypoxia in vivo after intravenous injection of Gd@HbCe6-PEG was verified by photoacoustic imaging and immunofluorescence staining. The potent treatment efficacy of PDT on early-stage was observed by the morphologic and functional MR imaging. Importantly, rapid renal clearance of the particles was observed after treatment.
Conclusion: In this study, by using a human endogenous protein, we demonstrated the biomimetic synthesis of multi-functional nanoprobes for simultaneous tumor oxygenation and imaging-guided enhanced PDT. The therapeutic efficacy could be quantitatively confirmed at 6 h post PDT with diffusion-weighted imaging (DWI).
Keywords: biomimetic synthesis, MR imaging, tumor hypoxia, photodynamic therapy, endogenous protein
Introduction
Photodynamic therapy (PDT) entails energy transfer from an injected photosensitizer to molecular oxygen under light irradiation generating reactive oxygen species to eradicate tumor cells [1-3]. Compared to traditional cancer treatments, PDT is an effective and promising treatment with the advantages of simple operation, high selectivity, and minimal invasiveness [4, 5]. However, PDT is highly dependent on the local oxygen concentration of tumor lesions, and the hypoxic microenvironment in solid tumors limits the effectiveness of PDT treatment [6, 7]. Therefore, delivering photosensitizers together with oxygen into tumor tissues is highly desired [8].
At present, a few approaches reported the co-delivery of photosensitizers and oxygen by using nanostructures, including oxygen-adsorbing porous nanomaterials like silica and metal-organic frame (MOF) and oxygen-carrying materials like perfluorohexane [9-12]. PDT efficacy can also be enhanced either by in-situ production of oxygen in tumor tissues via chemical reactions or by circumventing the use of oxygen during PDT [13-17]. Regardless of the efficiency, each strategy involves the fabrication of integrated multi-functional nanocomposites critical for clinical application.
Currently, protein-mediated biomimetic synthesis is an eco-friendly technology for fabricating nanomaterials with favorable green synthesis features, flexibility of functional integration and high biocompatibility [18-20]. Biomimetic synthesis is generally regarded as a fascinating research area with great potentials in the biomedical fields. In this process, proteins play multiple roles, including reducing as well as stabilizing agents and reaction region providers [21]. We previously used bovine serum albumin (BSA) to synthesize a series of nanoprobes, including single-function probes like gadolinium-based hybrid nanoparticles for angiography [22], and dual/multi-function probes like near infrared paramagnetic Ag2S quantum dots, and Gd:CuS@BSA nanoparticles for cancer imaging and photothermal therapy [20]. Besides BSA, we also explored a human endogenous protein, glutathione S-transferase (GST), to synthesize a bimodal probe for cancer computerized tomography (CT)/magnetic resonance (MR) imaging [23]. Our previous work and other published studies have shown advantages of proteins for the biomimetic synthesis of nanostructures, particularly for facile integration of multiple functionalities [20, 24-27].
In this study, we used the oxygen-carrier protein, hemoglobin amply produced in humans, and demonstrated retention of its oxygen-carrying ability following protein-mediated biomimetic synthesis of the paramagnetic nanoprobe with PDT function (Gd@HbCe6-PEG). Hemoglobin was chosen because of its biocompatibility as there are safety concerns with the chemosynthetic oxygen carriers. The second important reason was the intrinsic oxygen-carrying capability of hemoglobin in blood circulation [28, 29]. Finally, the hemoglobin structure was conducive for the biomimetic synthesis of imaging nanoparticles and simultaneous loading photosensitizers for imaging-guided enhanced PDT. Our study demonstrated that besides serving as a stabilizing agent, providing reaction region in the biomimetic chemistry of Gd nanoparticles, and loading Ce6 molecules via hydrophobic binding force, hemoglobin maintains oxygen-carrying capability. The main physicochemical properties, including the size, morphology, relaxivity, oxygen-carrying/release capability, and PDT efficacy of Gd@HbCe6-PEG, were measured and confirmed in vitro and in vivo in tumor-bearing mice after intravenous injection. The MR moiety showed significant tumor uptake of Gd@HbCe6-PEG with a wide time window for imaging, providing noninvasive precise guidance for PDT. The enhanced PDT treatment efficacy of oxygenated Gd@HbCe6-PEG (oxy-Gd@HbCe6-PEG) was evaluated by functional MR imaging besides the routine morphologic MR imaging.
Results and Discussion
Synthesis and characterization of Gd@HbCe6-PEG nanoparticles
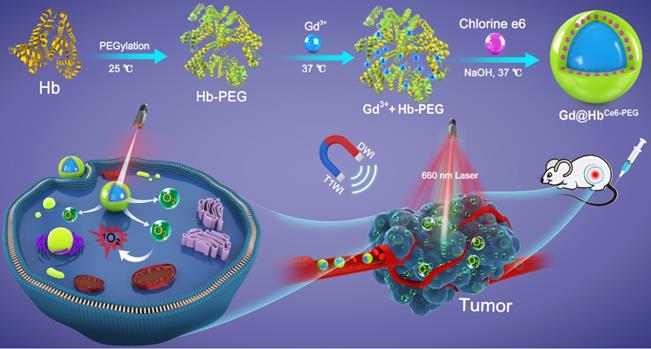
As depicted in Scheme 1, hemoglobin was first PEGylated in a classical manner to enhance its biocompatibility and non-specific repellency, improving its stability and prolonging the half-life during the circulation [30]. Without PEGylation, the precipitate component could be found in the final reaction product. Unlike the traditional chemical synthesis, Gd@HbCe6-PEG nanoparticles were synthesized via a green and biomimetic approach based on hemoglobin's multiple roles. It functions as a biological template, stabilizer for the nanoparticle formation, and substrate for the loading of Ce6 via the hydrophobic domains. The synthetic principle of Gd@HbPEG nanoparticles is mainly attributed to the high affinity of Hb's amino acid residues with Gd3+ metal ions and the constrained effect of Hb, providing reaction sites for Gd-containing nanoparticle formation and also inhibits their overgrowth into large particles [22].
Schematic representation of the hemoglobin-mediated biomimetic synthesis of multi-functional nanoparticles for tumor oxygenation and MR imaging-guided enhanced PDT of tumors.
The main physicochemical properties of Gd@HbCe6-PEG were investigated by transmission electron microscopy (TEM), showing a uniform spherical structure with an ultrasmall size of about 4.0 nm (Figure 1A). The ultrasmall size mainly benefited from the protein-mediated constrained synthesis process [31, 32]. The small-sized probes favor tumor theranostics since they can be cleared from the body via kidneys after imaging and therapy, as demonstrated below. The hydrodynamic size (HD) of the Gd@HbCe6-PEG was ca. 21.0 nm with a good size distribution (PDI: 0.126) (Figure 1B), which was larger than the TEM result due to Hb-PEG encapsulation but difficult to be observed in Figure 1A. The size of Gd nanoparticles could be tuned by adjusting the ratio of raw materials (Figure S1, Supporting Information). The Gd@HbCe6-PEG nanoparticles showed favorable stability in deionized water, PBS, fatal bovine serum (FBS) (Figure S2), sodium chloride with various ionic strengths, and various pH buffer solutions with slight fluctuations in their HDs (Figure S3). These results indicated good colloidal stability of Gd@HbCe6-PEG nanoparticles due to the strong of hemoglobin encapsulation.
Characterizations of Gd@HbCe6-PEG. (A) TEM image of Gd@HbCe6-PEG. (B) Size distribution of Gd@HbCe6-PEG determined by dynamic light scattering (DLS). (C) XPS survey spectrum of Gd@HbCe6-PEG. (D, E) XPS spectra of Gd 4d (D) and O 1s (E) in Gd@HbCe6-PEG structure with the corresponding fitting curves analyzed by XPS Peak 4.1 software. (F) UV-vis absorbance spectra of Ce6, Hb-PEG, and Gd@HbCe6-PEG. (G, H) Longitudinal (r1) (G) and transverse (r2) (H) relaxation rates obtained from solutions of Gd@HbCe6-PEG nanoparticles and the clinical contrast agent Magnevist (Gd-DTPA). (I) In vitro T1-weighted images of Gd@HbCe6-PEG and Gd-DTPA.
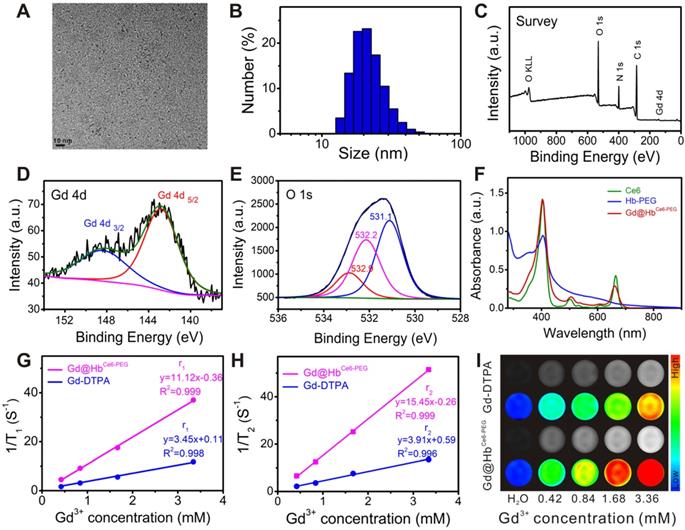
X-ray photoelectron spectroscopy (XPS) analysis was conducted to determine the elemental composition and chemical states of the synthesized material. Figure 1C demonstrates the co-existence of Gd and O elements. Their specific chemical states in the Gd@HbCe6-PEG nanoparticles were confirmed by analyzing the Gd (4d) and O (1s) peaks. As shown in Figure 1D, the peaks of binding energies located at 142.9 eV and 148.2 eV in the Gd 4d spectrum represented Gd (OH)3 and Gd2O3, respectively. The peaks of binding energies located at 531.1 eV and 532.2 eV corresponded to the oxygen in Gd2O3 and Gd(OH)3, respectively. The 532.9 eV peak was attributed to the oxygen in -OH and -COOH of Hb molecule (Figure 1E) [22, 33-35]. As shown in the UV-vis absorption spectrum in Figure 1F, the absorption peaks centered at 504 nm and 656 nm in Gd@HbCe6-PEG were the characteristic Ce6 peaks, indicating the successful loading of Ce6. The release of Ce6 from Gd@HbCe6-PEG nanoparticles was determined in vitro by investigating the UV-vis spectra of the filtrate obtained at different time points before and after ultrafiltration. The results (Figure S4) showed that the cumulative Ce6 release rate increased within 1 h and then saturated, indicating that Ce6 bound to proteins was relatively stable. These results collectively showed a successful synthesis of Gd@HbCe6-PEG by using hemoglobin.
To determine the T1-weighted imaging performance of Gd@HbCe6-PEG, longitudinal and transverse relaxation rates (r1 and r2) were evaluated by measuring 1/T1 and 1/T2 (s-1) slopes of the corresponding Gd3+ concentrations. According to previous studies [36, 37], the proton retention lifetime (τm), the number of coordinated water molecules (q) bound to the paramagnetic metal ions, and the rotation correlation time (τR) are the three crucial factors that determine the T1 relaxation rate. Thus, acquiring a longer rotation correlation time or a larger number of bound water molecules effectively improves the longitudinal relaxation rate. For Gd-DTPA used in clinical practice, only one coordination site is utilized to form a coordination bond with a water molecule, and the molecular rotational correlation time(τR) of Gd3+ small molecule chelate compounds is much shorter compared to that of the Gd-based macromolecules [38].
In this study, the proper size of 4.0 nm brought about a larger number of bound water molecules (q) and the encapsulation of biomacromolecule offered a longer rotation correlation time (τR), resulting in increased relaxivity. As displayed in Figure 1G and 1H, the longitudinal and transverse proton relaxation rates (r1 and r2) were 11.12 mM-1•s-1 and 15.45 mM-1•s-1, respectively, and the value of r2/r1 ratio was calculated to be 1.39, indicating the suitability of Gd@HbCe6-PEG as a T1-weighted imaging contrast agent [38]. The MRI stability Gd@HbCe6-PEG was good in deionized water, PBS, and FBS, without obvious fluctuations in T1 relaxation time (Figure S5). To further evaluate the Gd ions dissociation quantitatively, we measured the Gd concentration by ICP-AES before and after ultrafiltration. The results are summarized in the supporting information as Table S1, showing the leakage percentage of Gd ions to be less than 0.1% after 1 day and 7 days. These results indicated that the synthesized Gd@HbCe6-PEG nanoprobes were stable without leakage of Gd ions and were suitable for in vivo applications. The r1 of Gd@HbCe6-PEG was almost three times higher than the clinically-used Gd-DTPA (r1 = 3.45 mM-1•s-1). Furthermore, the in vitro T1-weighted images of Gd@HbCe6-PEG and Gd-DTPA (Figure 1I) and their corresponding quantified MR signal intensities (Figure S6) confirmed that Gd@HbCe6-PEG nanoparticles could produce higher T1-weighted signal intensity than Gd-DTPA.
Oxygen-carrying ability/release and singlet oxygen generation capability of Gd@HbCe6-PEG
Using hemoglobin, a compact structure of Gd@HbCe6-PEG with integrated functional moieties was biomimetically synthesized. As mentioned earlier, besides the biomimetic chemistry, another important advantage of using hemoglobin in this study was to deliver oxygen into tumor tissues. To eliminate the interference of the absorption spectrum of Ce6, Gd@HbPEG nanoparticles were prepared and the UV-vis spectra were applied to examine the ability of de-oxygenation and oxygenation of the Gd@HbPEG (Figure 2A) and pure Hb (Figure 2B). After the addition of sodium dithionite, Gd@HbPEG exhibited two maximum absorption peaks located at 428 nm and 565 nm, denoting 100% de-oxygenation (deoxy-Gd@HbPEG) [39]. When pure oxygen gas was allowed to draw into the sample chamber, three maximum peaks located at 412 nm, 540 nm, and 575 nm were observed, of which bimodal peaks (540 nm and 575 nm) were the characteristic absorption peaks of oxygenated Gd@HbPEG. For comparison, the oxygenation process of pure Hb was conducted and its spectral changes were found to be similar to that of Gd@HbPEG, demonstrating the oxygen-carrying ability of Hb after biomimetic synthesis. Also, the UV-vis spectra and T1 relaxation times displayed no significant fluctuations after oxygenation (Figure S7), indicating that the oxygenation of Hb exerted no obvious influence on Ce6 and Gd.
Oxygen-carrying ability/release and 1O2 generation capability study of Gd@HbCe6-PEG. (A, B) UV-vis absorbance spectra of (A) Gd@HbPEG and (B) pure Hb in the oxygen-free and oxygen saturation conditions. The inset image shows details of the absorption between 450 nm and 660 nm. (C) Oxygen-dissociation curves of oxy-Hb and oxy-Gd@HbCe6-PEG. (D) 1O2 generation of oxy-Gd@HbCe6-PEG and Gd@HbCe6-PEG measured by the SOSG fluorescence intensity under 660 nm laser illumination (0.6 mW/cm2).
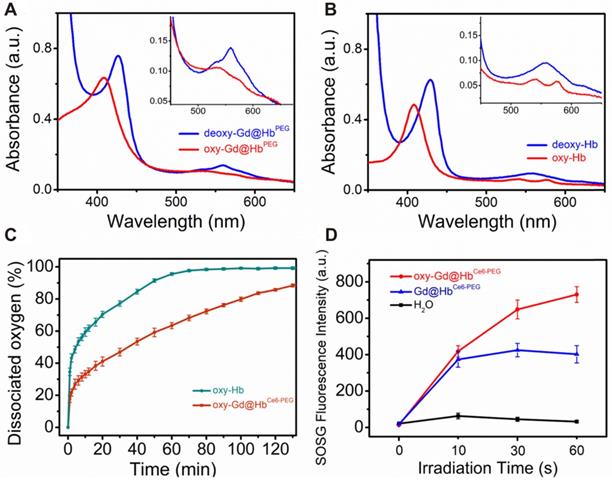
Furthermore, the oxygen-dissociation curve was determined to monitor the oxygen release behavior of oxy-Gd@HbCe6-PEG and oxy-Hb. As shown in Figure 2C, the half-dissociation time value measured for oxy-Hb was about 6.2 min, consistent with a previous study [40]. In contrast, oxy-Gd@HbCe6-PEG showed slower oxygen release behavior, with 34 min of the half-dissociation time of oxy-Gd@HbCe6-PEG. This difference in release kinetics could be mainly attributed to the structure change of Hb with improved stability.
To observe the photodynamic effect of oxy-Gd@HbCe6-PEG and Gd@HbCe6-PEG, the amount of singlet oxygen (1O2) generation was evaluated by using the singlet oxygen sensor green (SOSG) probe. As Figure 2D and Figure S8 display, after laser irradiation for 1 min, the SOSG fluorescence intensity of oxy-Gd@HbCe6-PEG group was two times higher than Gd@HbCe6-PEG under the same condition, indicating enhanced 1O2 generation due to more oxygen involvement.
Cellular uptake, cytotoxicity, and photodynamic effects of Gd@HbCe6-PEG nanoparticles
Cellular uptake of Gd@HbCe6-PEG was observed by using a confocal laser scanning microscope (CLSM). Figure S9 shows the confocal images of 4T1 breast cancer cells treated with 30 μg/mL Gd@HbCe6-PEG nanoparticles for 1 h, 2 h, and 4 h. The fluorescence signals were observed in 4T1 breast cancer cells, indicating efficient internalization of Gd@HbCe6-PEG nanoparticles.
Subsequently, CCK-8 assay was performed to measure the cytotoxicity of Gd@HbCe6-PEG on 4T1 cells. As displayed in Figure 3A, negligible effect was noticed on viability of 4T1 cells incubated with Gd@HbCe6-PEG in the absence of light at tested concentrations (0, 3.75, 7.5, 15, 30, and 60 μg/mL) for 24 h at 37 °C, 5% CO2. The cell viability was about 80% at 60 μg/mL, indicating low toxicity of Gd@HbCe6-PEG nanoparticles. The 4T1 cell viability following treatment with 660 nm laser irradiation at different concentrations of Gd@HbCe6-PEG was also analyzed (Figure S10). Results showed more efficient PDT efficacy on 4T1 cells with increasing concentrations of Gd@HbCe6-PEG.
Cytotoxicity and photodynamic effects of Gd@HbCe6-PEG (A) 4T1 cell viability after treatment with different concentrations of Gd@HbCe6-PEG nanoparticles (0-60 µg/mL). (B) 4T1 cell viability with Gd@HbCe6-PEG or oxy-Gd@HbCe6-PEG (30 µg/mL each) nanoparticles and with or without 660 nm laser irradiation. L, Laser.
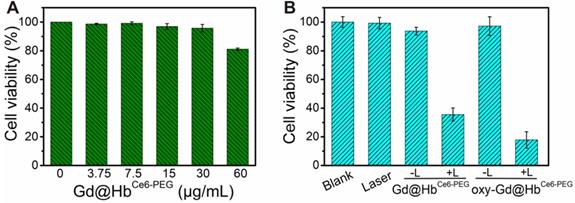
Next, the in vitro photodynamic therapy of oxy-Gd@HbCe6-PEG was examined in 4T1 cells. The viability of 4T1 cells incubated with 30 μg/mL Gd@HbCe6-PEG and oxy-Gd@HbCe6-PEG and 660 nm laser irradiation decreased to 34% and 18%, respectively, indicating efficient killing of 4T1 cells (Figure 3B). Compared with Gd@HbCe6-PEG, oxy-Gd@HbCe6-PEG showed an enhanced photodynamic effect with the same laser irradiation condition, mainly attributed to the oxygen-carrying capability of oxy-Gd@HbCe6-PEG. These results indicated the low dark toxicity but good photodynamic effects of oxy-Gd@HbCe6-PEG on 4T1 breast cancer cells.
In vivo MR imaging guidance
As described above, we verified the oxygen-carrying/release capability of Gd@HbCe6-PEG and its PDT effect on tumor cells. PDT is a promising treatment strategy for superficial and lumen tumors but it is difficult to find a therapeutic window due to the lack of clear imaging guidance. In this study, the paramagnetic Gd element was selectively incorporated into the nanoparticles to realize MR imaging-guided PDT. MR images (Figure 4A) and the corresponding quantified intensities (Figure 4B) showed a gradual increase in tumor signal intensity after intravenous injection and a decrease beginning at 2 h post-injection. The maximal tumor uptake occurred at 1 h post-injection. The tumor uptake of Gd@HbCe6-PEG was demonstrated in MR imaging, displaying a remarkably higher signal intensity than in the Gd-DTPA group (Figure S11). The dynamic process of MR signal intensity changes was further revealed by MIP (maximum intensity projection) images, reflecting the presence of blood vessels in the tumor (Figure S12).
In vivo time-dependent MR imaging of the tumor, liver, and kidneys in 4T1 tumor-bearing mice before and after intravenous injection of Gd@HbCe6-PEG. (A, C, E) In vivo T1-weighted MR images of the tumor (A, white circle), liver (C), and kidneys (E, white arrow). Quantified MR signal intensity of 4T1 tumor (B), liver (D), and kidneys (F).
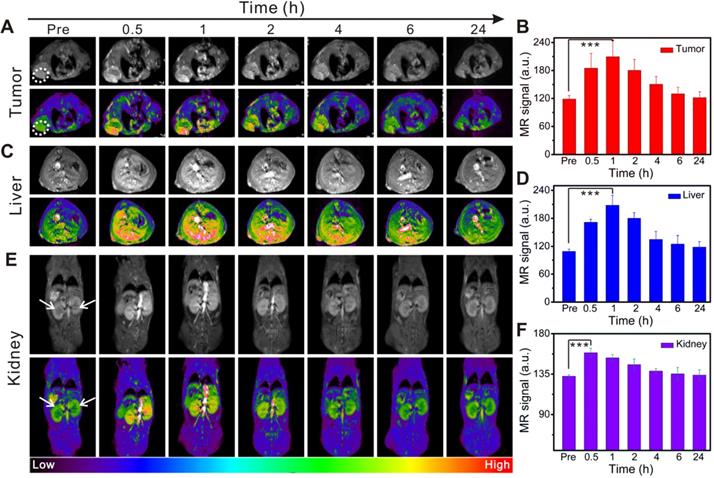
Besides imaging the tumor sites, MR imaging of the liver and kidneys was acquired to dynamically assess Gd@HbCe6-PEG nanoparticles' biodistribution in vivo. Figure 4C shows a gradual increase in the MR signal intensity of liver, reaching the maximum at 1 h after injection, followed by a gradual decrease. At 24 h post-injection, the signal decreased, almost to pre-injection levels, as quantified in Figure 4D. The signals in kidneys were very similar to the liver (Figure 4E and 4F). These in vivo imaging data showed hepatic and renal clearance pathways of Gd@HbCe6-PEG nanoparticles from the body within 24 h. The renal clearance was attributed to the ultrasmall size of the synthesized Gd@HbCe6-PEG, conducive to reducing exposure time/dosage of nanoparticles in the liver. Nanoparticles synthesized by traditional chemical methods usually accumulate in the liver for more than 24 h, resulting in long-term accumulation and presenting potential hepatotoxicity [41, 42]. Distinctly different from most previously reported nanoparticles, this biomimetic synthesis of Gd@HbCe6-PEG nanoparticles was beneficial for reducing liver toxicity.
The circulation half-life of Gd@HbCe6-PEG was determined to be ~1 h (Figure S13) by measuring Gd content with ICP-AES. Furthermore, angiography of Gd@HbCe6-PEG was performed in mice. As is evident from Figure 5A and 5C, the MIP images of aortic abdominalis (red ellipse) reflected the imaging time window difference with Gd@HbCe6-PEG showing much longer imaging time than Gd-DTPA in blood vessels. This difference could mainly be attributed to the particle size of the injected agent. Gd-DTPA is a small molecule that can be rapidly cleared from the body via the renal pathway [43], while Gd@HbCe6-PEG is sub-10 nm in size that favors its circulation in blood.
In vivo MR angiography and MRI of the bladder in mice. (A, C) MIP images of aorticus abdominalis (red ellipse) with intravenous injection of Gd@HbCe6-PEG nanoparticles (A) and Gd-DTPA (C). (B, D) T1-weighted MR imaging of the bladder (white ellipse) of mice with intravenous injection of Gd@HbCe6-PEG nanoparticles (B) and Gd-DTPA (D). MIP, maximum intensity projection.
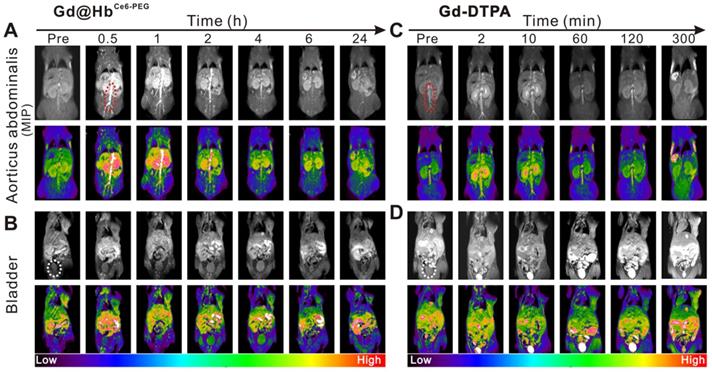
Besides the size, hemoglobin, an endogenous protein functions like an invisible cloak on nanoparticles, and escapes capturing by the liver. Figure 5B and Figure S14A show the process by which the contrast agent excretes into the bladder via the renal pelvis route during the circulation. The imaging time window of the abdominal aorta in mice receiving intravenous injection of Gd@HbCe6-PEG nanoparticles was wider and less contrast agent was excreted in the renal pelvis at 1 h after the injection. For mice injected with Gd-DTPA, the imaging time of the aorticus abdominalis was much shorter with a weaker signal intensity, and most of the nanoparticles were excreted into the renal pelvis and bladder at 2 min after the injection (Figure 5D and Figure S14B). Overall, compared with the clinical contrast agent (Gd-DTPA), the signal intensity in the tumor increased significantly after intravenous injection of Gd@HbCe6-PEG particles, possibly benefiting from the enhanced permeability and retention effect (EPR) of nanomaterials and its improved relaxivity. More importantly, the imaging time window was extended from a few min to 1 h-2 h, providing more time for guiding treatment and ultimately improving the therapeutic effect.
In vivo measurement of tumor oxygenation
After demonstrating the oxygen-carrying and release capacity and tumor targeting of Gd@HbCe6-PEG, we evaluated the oxygen delivering capability of oxy-Gd@HbCe6-PEG for improving the overall oxygen saturation in the tumor area by using photoacoustic (PA) imaging in vivo. As shown in the PA images taken under the oxy-hemo mode, the PA signal intensity in the tumor area increased after intravenous injection of oxy-Gd@HbCe6-PEG nanoparticles (Figure 6A). However, only a slight effect on the tumor oxygenation level was observed in the Gd@HbCe6-PEG nanoparticle-treated mice. The semiquantitative analysis was performed for the region of interest (ROI) in tumor sites by PA imaging. The results showed that the overall tumor oxygenation saturation (sO2 average total) level increased from ca. 2.9% before the injection of oxy-Gd@HbCe6-PEG nanoparticles to about 8.7% at 2-4 h post-injection (Figure 6B).
In vivo assessment of tumor oxygenation in mice with 4T1 tumor. (A) PA images of the tumor sites recorded in the oxy-hemo mode before and at 1 h, 2 h, and 4 h post intravenous injection of Gd@HbCe6-PEG or oxy-Gd@HbCe6-PEG nanoparticles. (B) Corresponding semiquantitative analysis of overall tumor oxygenation saturation (sO2 average total) at different time points. (C) Images of immunofluorescence staining collected from mice tumor tissues with intravenous injection of Gd@HbCe6-PEG or oxy-Gd@HbCe6-PEG nanoparticles. The hypoxic areas and cell nuclei were stained with anti-HIF-1α antibody (green) and DAPI (blue). (D) Corresponding semiquantitative analysis of the percentages of positive hypoxic areas by calculating HIF-α protein expression density in the image. PA, photoacoustic imaging; US, ultrasound imaging.
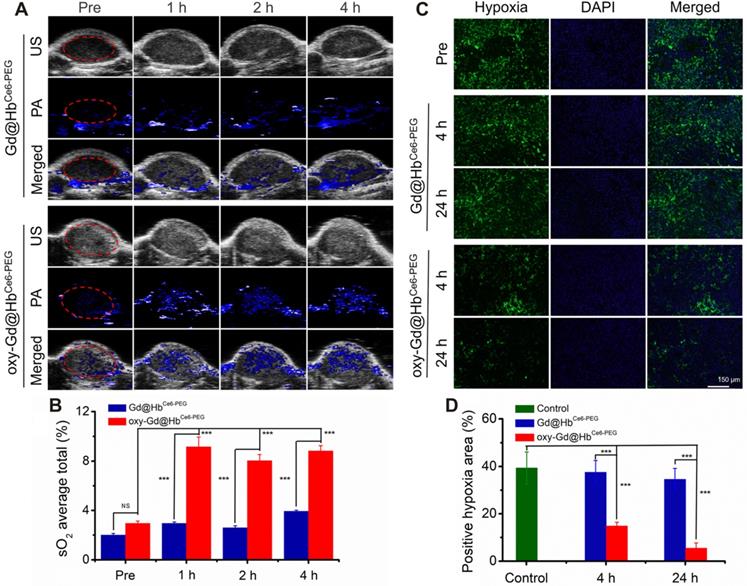
Hypoxia is one of the important features of the tumor microenvironment and is directly related to the expression of HIF-1α protein [44]. To determine the ability of oxy-Gd@HbCe6-PEG to alleviate tumor hypoxia, immunofluorescence staining was performed for evaluating the change of hypoxic state (expression of HIF-1α protein) in the tumor following intravenous injection of oxy-Gd@HbCe6-PEG nanoparticles. HIF-1α immunofluorescence staining displayed decreased tumor hypoxia in the tumor slices collected at 4 h post-injection of oxy-Gd@HbCe6-PEG compared with the images obtained from the control group mice (Figure 6C). In contrast, mice injected with Gd@HbCe6-PEG showed minimal hypoxic state change in the tumor. Compared with the control group, the percentage of hypoxic tumor area decreased from ca. 39% to ca.14% and ca. 6% at 4 h and 24 h post-injection of oxy-Gd@HbCe6-PEG (Figure 6D). However, no obvious change was observed in the tumor slices of mice injected with Gd@HbCe6-PEG. Collectively, these data confirmed that oxy-Gd@HbCe6-PEG could deliver oxygen for tumor oxygenation and alleviate tumor hypoxia in vivo.
In vivo PDT and morphological MR imaging evaluation of therapeutic efficacy
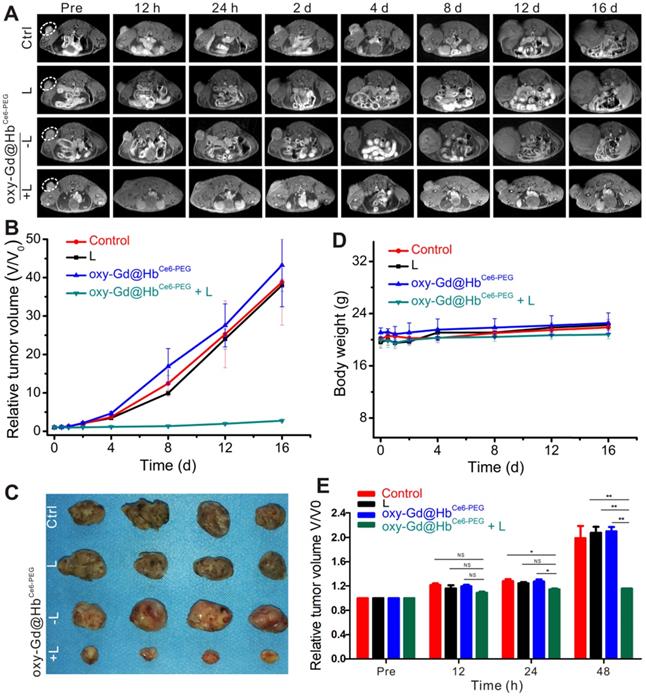
We exposed 4T1 tumor-bearing mice to PDT with 660 nm laser irradiation for 10 min after 2 h of intravenous administration of oxy-Gd@HbCe6-PEG nanoparticles. The tumor size was accurately measured during the treatment by MR imaging to assess therapeutic efficacy. As displayed in Figures 7A, 7B, and 7C, the tumor volumes of mice in the control, laser irradiation only, and oxy-Gd@HbCe6-PEG nanoparticle groups were significantly increased during treatment, while tumor growth was inhibited in the oxy-Gd@HbCe6-PEG+laser irradiation group. Also, there were no changes in the body weights of mice in the experimental groups during the treatment (Figure 7D), indicating no obvious adverse systemic effects after PDT. Statistical analysis of the data using MR imaging of tumor morphology indicated therapeutic efficacy at day 2 after treatment (Figure 7E).
In vivo PDT in tumor-bearing mice and MR imaging-based morphology evaluation of therapeutic efficacy. (A) T1-weighted MR imaging of mice in four groups before and after respective treatments. (B) Relative tumor volume changes of mice in four groups during the experiment. (C) Digital pictures of tumors obtained from the four groups after respective treatments. (D) Body weight changes of mice in four groups during the experiment. (E) MR imaging evaluation of therapeutic efficacy based on morphological changes. The therapeutic effect could be determined on day 2 after treatment. Data are presented as the mean ± standard deviation. (*P< 0.05; **P< 0.01; ***P< 0.001; n = 4). L, Laser.
Functional MRI-based early evaluation of therapeutic efficacy
To evaluate the efficacy of PDT, functional MRI was carried out. Estimating the gross tumor volume by measuring the physical diameters of the tumor with calipers is a common method for evaluating PDT's efficacy [45, 46]. However, this method cannot determine morphological changes of tumors. In clinical studies, MR imaging-based evaluation is usually utilized to assess the curative effect of anti-tumor treatment. Monitoring the morphological changes of the tumor provides clinicians with more precise feedback for tumor treatment [47, 48]. However, the morphological changes of tumors are not always sensitive to the treatment in the early term.
Diffusion-weighted imaging (DWI) is a functional MR imaging that reflects changes in tissue microstructure by detecting the extent and direction of localized diffusion of water molecules in living tissues. This method can accurately reflect the changes in the body tissues' microscopic spatial composition and the functional status of water exchange between various tissue components under pathophysiological conditions [49]. The pathophysiological intracellular changes occurring within tumor tissue after treatment reflected by DWI can indicate the early changes in the tumor's interior prior to visible changes in tumor morphology or size [50]. The diffusion coefficient measured by DWI can be quantified by the apparent diffusion coefficient (ADC) parameter [49]. ADC value can reflect the tissue-specific diffusion capacity and detect early changes in tumor cell structure after treatment [50]. An increase in the ADC value indicates that the treatment of malignant tumors is effective and has been confirmed in a variety of malignant tumors, including breast cancer [51]. PDT induces tumor cell necrosis or apoptosis within the first 24 h of treatment [52]. These microscopic structural changes cause a limited decrease in the diffusion motion of water molecules, resulting in an increased ADC value. On the contrary, when the tumor is in the progressive stage without the drug intervention, the ADC value gradually decreases with time as the tumor cells proliferate [50].
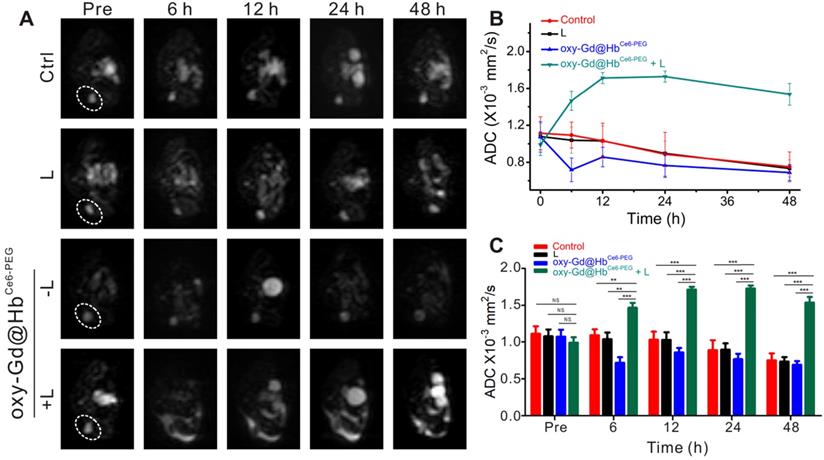
As shown in Figure 8A, the lesion areas of four groups present high signal intensity on the DWI map before treatment. During the treatment observation time, the lesion areas of mice from the groups treated with saline, laser irradiation, or oxy-Gd@HbCe6-PEG nanoparticles showed high signal intensity on the DWI map and a gradual decrease of ADC values (Figure 8A and 8B). In the experimental group, however, the lesion areas consistently showed low intensity on DWI map after treatment and the ADC values were higher than pretreatment. Statistical analysis showed that, compared with the control group, the ADC values of the experimental group at different time points were significantly higher after treatment (Figure 8C). Using ADC values, the noticeable therapeutic efficacy of oxy-Gd@HbCe6-PEG nanoparticles-based PDT was quantitatively confirmed at 6 h post-PDT, much earlier than that (day 2 post-PDT) evaluated by structural MR imaging (Figure 7E).
DW imaging for early evaluation of therapeutic efficacy of PDT. (A, B) DW imaging with b value for 1000 s/mm2 (A) and the corresponding changes of ADC values of lesions (B) in four groups during the first 48 h of treatment. (C) Quantification analysis of ADC values for early evaluation. Data are presented as the mean ± standard deviation. (*P< 0.05; **P< 0.01; ***P< 0.001; n = 4). L, Laser.
In vivo toxicology analysis
Routine blood tests, biochemistry parameters, and H&E staining were performed at day 1 and day 14 post injection of Gd@HbCe6-PEG nanoparticles (Gd dose: 0.11 mmol/kg) to examine the safety. As shown in Figure S15, no or slight changes were observed in the main parameters of the routine blood test, including red blood cells (RBC), mean corpuscular volume (MCV), red blood cell volume distribution width (RDW), hematocrit (HCT), reticulocyte (RET), hemoglobin (HGB), mean corpuscular hemoglobin (MCH), mean corpuscular hemoglobin concentration (MCHC), white blood cells (WBC), and platelets (PLT). After intravenous injection of Gd@HbCe6-PEG nanoparticles, biochemistry blood tests, including alanine aminotransferase (ALT), aspartate aminotransferase (AST), alkaline phosphatase (ALP), total protein (TP), albumin (ALB), globulin (GLOB), A/G (ALB/GLOB), and blood urea nitrogen (BUN) indicated no or slight damage to the function of liver, kidneys and hematopoietic system.
H&E staining of major mouse organs was also conducted to determine the in vivo toxicity of Gd@HbCe6-PEG nanoparticles. As displayed in Figure S16, compared with the control group (physiological saline injection), slightly reduced numbers of spleen lymphocytes were observed at day 1 and day 14 after intravenous injection of Gd@HbCe6-PEG and no obvious inflammatory lesions or tissue damage could be detected in other organ tissues.
Conclusion
We synthesized a hemoglobin-mediated biomimetic of paramagnetic nanostructure for tumor oxygenation and improved therapeutic outcomes of PDT. We demonstrated that hemoglobin could maintain tumor oxygenation activity in the Gd nanoparticles after loading the Ce6 photosensitizer. Thus, Gd@HbCe6-PEG nanoparticles could simultaneously deliver oxygen and a photodynamic agent to the tumor tissues. The MR imaging moiety of Gd@HbCe6-PEG showed good tumor-targeted accumulation and provided precise guidance for PDT. The hemoglobin moiety of Gd@HbCe6-PEG delivered oxygen and overcame tumor hypoxia in tumor-bearing mice, as demonstrated by PA imaging and HIF-1α protein expression analysis. As expected, Gd@HbCe6-PEG enabled good tumor-specific PDT by ameliorating tumor hypoxia together with MRI guidance. Furthermore, the therapeutic efficacy could be quantified with DWI at 6 h post-PDT.
To the best of our knowledge, our study is the first demonstration of biomimetic synthesis of ultrasmall paramagnetic Gd nanostructures on endogenous human Hb. Also, integration of Ce6 photosensitizers could be realized for MR imaging-guided oxygen-supplying PDT of tumors. Significantly, the design of the nanostructures did not require complicated chemical synthesis and the raw materials, including a human endogenous protein, were biocompatible and non-toxic. We believe that the method used here would find broad applications for fabricating advanced probes for biomedical uses.
Experimental
Materials
Human hemoglobin (Hb), gadolinium chloride hexahydrate (GdCl3·6H2O), and sodium dithionite (Na2S2O4) were obtained from Sigma Aldrich (USA). Chlorin e6 (Ce6) was acquired from J&K Scientific Ltd. (China). N-Hydroxylsuccinimide-derivatized methoxy-poly (ethylene glycol) (mPEG-NHS, MW = 2000 Da) was purchased from Thermo Fisher Scientific (USA). Sodium hydroxide (NaOH), borate saline buffer (BBS, pH 8.2) and phosphate-buffered saline (PBS, pH 7.4) were obtained from Sinopharm. Cell Counting Kit-8 (CCK-8) was purchased from KeyGEN bioTECH (Nanjing, China).
Biomimetic synthesis of Gd@HbCe6-PEG nanoparticles
Synthesis of Hb-PEG bioconjugates: First, 62.5 mg of Hb powder and 20 mg of mPEG-NHS were dissolved in 8 mL and 1 mL of BBS. Next, the two solutions were mixed and magnetically stirred at 25 °C for 4 h. The resulting solution was transferred to a dialysis bag and dialyzed against PBS for 12 h to remove byproducts.
Synthesis of Gd@HbCe6-PEG: 150 μL of GdCl3·6H2O (100 mM) was added into the above Hb-PEG solution, followed by mixing with 12 mg of Ce6, which was dissolved in 1 mL of DMSO. Then, 150 μL of NaOH (1.0 M) was added to the above solution 3 min later. After the mixture was magnetically stirred at 37 °C for 5 h, the solution was collected into a dialysis bag and dialyzed against PBS for 6 h. Gd@HbPEG was prepared according to the same procedure but without the addition of Ce6.
The oxy-Gd@HbCe6-PEG was prepared following a previously reported method [28, 29]. Briefly, the sodium ascorbate (2-fold molar of Hb) was added to the Gd@HbCe6-PEG solution and sealed under N2 atmosphere to perform de-oxygenation process. After de-oxygenation, pure oxygen gas was allowed to run through the Gd@HbCe6-PEG (deoxy-Gd@HbCe6-PEG) solution under a low flow rate to perform the oxygenation process.
Characterization of nanoparticles
Transmission electron microscopy (TEM) was used to characterize the morphology and size of nanoparticles with an accelerating voltage of 200 kV. The X-ray photoelectron spectroscopy (XPS) studies were conducted to determine the elemental composition and chemical states of nanoparticles by using a PHI-5000 CESCA system (PerkinElmer). The hydrodynamic size and size distribution were monitored by dynamic light scattering (DLS) on a Malvern Zetasizer Nano ZS instrument. The UV-vis absorption spectrum of Gd@HbCe6-PEG was recorded by using a Cary 50 spectrophotometer (VARIAN). The Gd content was measured by inductively coupled plasma-atomic emission spectroscopy (ICP-AES, Thermal Scientific, iCAP 7400).
Ce6 release behavior study
The release of Ce6 from Gd@HbCe6-PEG nanoparticles was determined in vitro by investigating the UV-vis spectra of the filtrate obtained at 656 nm at different time points before and after ultrafiltration. Subsequently, the cumulative Ce6 release curve versus time was obtained, and the solution was slowly stirred during the process. To evaluate the Gd dissociation in vitro quantitatively, we measured the Gd concentration by ICP-AES before and after ultrafiltration.
Measurement of relaxivity and in vitro MR imaging study
The longitudinal (T1) and transverse (T2) proton magnetic relaxation times of Gd@HbCe6-PEG were analyzed with a 1.41 T minispec mq 60 NMR Analyzer (Bruker) at 37 °C. The relaxation rates (r1 and r2) were determined by measuring 1/T1 and 1/T2 (s-1) slopes to the corresponding Gd3+concentrations. For comparison, the relaxation times of Magnevist (Gd-DTPA) were also measured.
The SE (spin echo) T1-weighted MR images of Gd@HbCe6-PEG and Gd-DTPA were obtained with a 3.0 T MRI scanner (Ingenia; Philips, The Netherlands) with an animal coil. The used scan parameters were set as follows: TR = 595 ms; TE = 20 ms; flip angle=90°; FOV = 120×120 mm; voxel size = 0.42×0.51×2.5 mm; slice gap = 0.8 mm; slice thickness = 2.5 mm; Total Scan Duration = 1 min 50 s.
Oxygen-carrying capacity study
The capability of de-oxygenation and oxygenation of Gd@HbPEG were investigated by using a previously reported method [39, 53]. First, the Gd@HbPEG (7 mg/mL) solution was de-oxygenated by sodium dithionite. After removing oxygen, the absorption spectrum of the solution was measured in the wavelength range 350 nm-700 nm. Then, the de-oxygenated solution was allowed to run with pure oxygen gas, followed by the measurement of the absorption spectrum of oxygenated Gd@HbPEG (oxy-Gd@HbPEG) solution. Also, the oxygenation effect of Hb on Ce6 and Gd was evaluated by investigating UV-vis spectra and T1 relaxation time of Gd@HbCe6-PEG nanoparticles before and after oxygenation. As a comparison, the oxygenation processes of pure Hb (4 mg/mL) were also carried out under the same conditions.
Release of oxygen study
0.2 mL of oxy-Gd@HbCe6-PEG (4 mg/mL) was quickly injected into 10 mL of de-oxygenated PBS and sealed. A dissolved oxygen detector (INESA Scientific Instrument Co., Ltd., China) was applied to record the real-time concentration of dissolved oxygen in the mixed solution, and an oxygen-dissociation curve was drawn [29]. The process was repeated under the same conditions to draw the oxygen-dissociation curve of oxygenated Hb (oxy-Hb).
Determination of singlet oxygen generation capacity of Gd@HbCe6-PEG and oxy-Gd@HbCe6-PEG
200 μL of oxy-Gd@HbCe6-PEG (7 mg/mL) was added to 3 mL of de-oxygenated PBS and sealed. Following the addition of oxygen sensor green (SOSG) (10 μmol) to the solution, the SOSG fluorescence emission spectra induced by oxy-Gd@HbCe6-PEG was recorded before and after laser irradiation (0.6 mW/cm2) with an excitation wavelength of 488 nm, and a SOSG fluorescence intensity curve then drawn. The process was also performed under the same conditions to draw the SOSG fluorescence intensity change curve by Gd@HbCe6-PEG (7 mg/mL).
Cellular uptake
To investigate the cellular uptake of Gd@HbCe6-PEG, 4T1 breast cancer cells seeded in 6-well plates were incubated with Gd@HbCe6-PEG nanoparticles at the concentration of 30 μg/mL for 1, 2 and 4 hrs, followed by washing twice with PBS and fixing with 4% paraformaldehyde solution. Fixed cells were then stained with 4′, 6-diamidino-2-phenylindole (DAPI) and observed with confocal laser scanning microscopy (SP5II, Leica) under 405 nm excitation.
Cytotoxicity study
The mouse 4T1 tumor cell line was obtained from the Shanghai Institute of Cell Biology, Chinese Academy of Sciences (Shanghai, China). The cytotoxicity of Gd@HbCe6-PEG was examined using cell counting kit-8 (CCK-8) assay. The 4T1 cells were seeded in 96-well microplates at a density of ~8000/well and incubated at 37 °C and 5% CO2. Then, the cells were incubated in fresh culture medium supplemented with 0 μg/mL, 3.75 μg/mL, 7.5 μg/mL, 15 μg/mL, 30 μg/mL, and 60 μg/mL of Gd@HbCe6-PEG for 24 h. Subsequently, the cells were incubated in fresh culture medium containing 10 μL of CCK-8 reagent for another 2 h, followed by absorbance measurement at 450 nm with a multifunction microplate reader. The relative cell viability was calculated by comparing the absorbance intensity with the control cell samples.
PDT on tumor cells
4T1 breast cancer cells at a density of ~8000/well in 96-well plates were incubated with Gd@HbCe6-PEG or oxy-Gd@HbCe6-PEG nanoparticles at the concentration of 30 μg/mL for 2 h, followed by 660 nm laser irradiation (12 mW/cm2) for 25 min and incubation for another 4 h in the dark. The cells without nanoparticles and subjected to laser irradiation were used as the control group. The relative cell viability was calculated by comparing the absorbance intensity with the control cell samples.
Establishment of a tumor model
Experiments were conducted according to the protocols approved by the Institutional Animal Care and Use Committee of Tongji University. To construct the subcutaneous tumor model, 4T1 cells at a density of ~1×10⁶ dispersed in 100 μL of aseptic PBS were injected into the right foreleg or hindleg of BALB/C mice (22 g, 5 weeks, female, Shanghai Slac Laboratory Animal Co. Ltd.).
In vivo MR imaging
The SE T1-weighted MR imaging of 4T1 tumor-bearing mice was conducted on the 3.0 T MRI scanner with a receiver coil for mice (Chenguang Med Tech, Shanghai, China). The mice were intravenously administrated with Gd@HbCe6-PEG or Gd-DTPA in normal saline (Gd dose: 0.11 mmol/kg). Subsequently, the T1-weighted images of the liver, kidney, bladder, and tumor were acquired at six time points of 0.5 h, 1 h, 2 h, 4 h, 6 h, and 24 h after injecting Gd@HbCe6-PEG or five time points; 2 min, 15 min, 1.5 h, 3 h, and 6 h after injecting Gd-DTPA. All images of kidneys and tumors except for background MR images were reconstructed with a maximum-intensity-projection (MIP) algorithm. Scanning parameters were set as follows: TR = 600 ms; TE = 20 ms; flip angle = 90°; FOV = 50×50 mm; voxel size = 0.2×0.198×1.0 mm; slice gap = 0.5 mm; slice thickness =1.0 mm; Total Scan Duration =4 min 44 s.
In vivo tumor oxygenation evaluation
The level of oxygen in the tumor tissues was evaluated using the Visualsonic Vevo 2100 LAZER photoacoustic (PA) imaging system with the Oxy-hemo mode (750 nm and 850 nm) before and after the intravenous administration of Gd@HbCe6-PEG or oxy-Gd@HbCe6-PEG nanoparticles. The tumor-bearing mice with a tumor volume of approximately 80 mm3 were randomly divided into two groups (n = 3). The in vivo PA imaging of the tumor was recorded before and at 1 h, 2 h, and 4 h post-injection of plain Gd@HbCe6-PEG or oxy-Gd@HbCe6-PEG nanoparticles (Gd dose: 0.11 mmol/kg). The tumor oxygen saturation level of each mouse was determined by calculating the value of sO2 average total after placing a region of interest (ROI) of PA images covering the whole tumor.
To further evaluate the change in tumor hypoxia levels before and after the intravenous administration of Gd@HbCe6-PEG or oxy-Gd@HbCe6-PEG, mice were sacrificed before and at 4 h and 24 h post-injection (Gd dose: 0.11 mmol/kg). The tumors were removed and fixed with tissue fixative and then dehydrated, embedded, and sliced for 4′,6-diamidino-2-phenylindole (DAPI) and hypoxia-inducible factor 1-alpha (HIF-1α) immunofluorescence staining. The tumor-bearing mice without the administration of Gd@HbCe6-PEG served as controls.
In vivo PDT and morphological MR imaging of tumor
The tumor-bearing mice were divided into 4 groups randomly (n = 4). Each group received different treatments as follows: (1) Saline injection; (2) Laser irradiation (1.0 W/cm2); (3) oxy-Gd@HbCe6-PEG nanoparticles injection (Gd dose: 0.11 mmol/kg); (4) oxy-Gd@HbCe6-PEG nanoparticles injection (Gd dose: 0.11 mmol/kg) plus laser irradiation (1.0 W/cm2). Subsequently, SE T1-weighted MR images of tumors were recorded for observing the size before treatment and at seven time points; 0.5 d, 1 d, 2 d, 4 d, 8 d, 12 d, and 16 d after the treatment. The body weight of each mouse was also recorded. The maximum height (a), maximum width (b), and maximum anteroposterior diameter (c) of the tumor were measured at the maximum transverse position of the MR and at the sagittal position. The volume of the tumor was calculated according to the formula: volume = a*b*c. The one-way analysis of variance (ANOVA) was used to compare the differences of mean relative tumor volume among groups. At the end of the experiment, the mice were sacrificed and the tumors were removed for further study.
Diffusion-weighted imaging (DWI) for early evaluation of PDT efficacy of oxy-Gd@HbCe6-PEG
The multi-shot echo-planar imaging technique was conducted to acquire DW images. The scanning parameters were set as follows: TR = 1003 ms; TE = 95 ms; flip angle = 90°; FOV = 50×50 mm; voxel size = 0.78×0.93×2.0 mm; slice gap = 0.1 mm; slice thickness = 2.0 mm; b factors = 0, 1000 s/mm2; Total Scan Duration = 3 min 04 s. Apparent diffusion coefficient (ADC) maps were then constructed automatically and used for the measurement of ADC values.
ADC measurement and data analysis
T1-weighted images were used for the localization of tumor lesions. The Philips MR Extended Workspace was used to process ADC maps. The ADC value in the tumor was calculated by drawing an ROI that covered the entire tumor. The one-way ANOVA was applied to compare the differences of the mean ADC values among groups.
In vivo toxicity study
Blood toxicology study: Healthy mice (n=3) were intravenously administrated with Gd@HbCe6-PEG (Gd dose: 0.11 mmol/kg) and the blood was collected on day 1 and day 14 post-injection, and routine serum biochemistry analysis was performed at the Shanghai Institute of Materia Medica. Saline-treated mice were used as the control group.
Organ toxicology study: Organ samples including lungs, heart, liver, spleen, kidneys, were removed, washed, fixed with tissue fixative, dehydrated, embedded, sliced (thickness: 4 microns), and stained with routine hematoxylin and eosin (H&E) using a standard protocol. The digital microscopy was used to observe the H&E staining images of organs. The saline-treated mice were used as the control group.
Supplementary Material
Supplementary figures and tables.
Acknowledgements
This research was sponsored by Program of Shanghai Academic Research Leader (20XD1423700), National Natural Science Foundation of China (81922035, 81871399, 81801823), the Science and Technology Commission of Shanghai Municipality (19411965800), State Key Laboratory of Molecular Engineering of Polymers (Fudan University, K2020-16), Natural Science Foundation of Shanghai (20ZR1462100), and Shanghai Municipal Commission of Health and Family Planning Project (20204Y0030).
Competing Interests
The authors have declared that no competing interest exists.
References
1. Sasidharan Swarnalatha L, Khee Chee S, Yong Z. Nanoparticles in photodynamic therapy. Chem Rev. 2015;115:1990-2042
2. de Bruijn HS, Mashayekhi V, Schreurs TJ, van Driel PB, Strijkers GJ, van Diest PJ. et al. Acute cellular and vascular responses to photodynamic therapy using EGFR-targeted nanobody-photosensitizer conjugates studied with intravital optical imaging and magnetic resonance imaging. Theranostics. 2020;10:2436-52
3. Yang L, Gao P, Huang Y, Lu X, Chang Q, Pan W. et al. Boosting the photodynamic therapy efficiency with a mitochondria-targeted nanophotosensitizer. Chin Chem Lett. 2019;30:1293-6
4. Abbas M, Zou Q, Li S, Yan X. Self-assembled peptide- and protein-based nanomaterials for antitumor photodynamic and photothermal therapy. Adv Mater. 2017;29:1605021
5. Zhou Z, Song J, Nie L, Chen X. Reactive oxygen species generating systems meeting challenges of photodynamic cancer therapy. Chem Soc Rev. 2016;45:6597-626
6. Liu Y, Liu Y, Bu W, Cheng C, Zuo C, Xiao Q. et al. Hypoxia induced by upconversion-based photodynamic therapy: Towards highly effective synergistic bioreductive therapy in tumors. Angew Chem Int Ed. 2015;54:8105-9
7. Zhu W, Dong Z, Fu T, Liu J, Chen Q, Li Y. et al. Modulation of hypoxia in solid tumor microenvironment with MnO2 nanoparticles to enhance photodynamic therapy. Adv Func Mater. 2016;26:5490-8
8. Hu D, Zhong L, Wang M, Li H, Qu Y, Liu Q. et al. Perfluorocarbon-loaded and redox-activatable photosensitizing agent with oxygen supply for enhancement of fluorescence/photoacoustic imaging guided tumor photodynamic therapy. Adv Func Mater. 2019;29:1806199
9. Kim J, Cho HR, Jeon H, Kim D, Song C, Lee N. et al. Continuous O2-evolving MnFe2O4 nanoparticle-anchored mesoporous silica nanoparticles for efficient photodynamic therapy in hypoxic cancer. J Am Chem Soc. 2017;139:10992-5
10. Gao S, Zheng P, Li Z, Feng X, Yan W, Chen S. et al. Biomimetic O2-evolving metal-organic framework nanoplatform for highly efficient photodynamic therapy against hypoxic tumor. Biomaterials. 2018;178:83-94
11. Liu C, Dong H, Wu N, Cao Y, Zhang X. Plasmonic resonance energy transfer enhanced photodynamic therapy with Au@SiO2@Cu2O/perfluorohexane nanocomposites. ACS Appl Mater Interfaces. 2018;10:6991-7002
12. Li N, Xu F, Cheng J, Zhang Y, Huang G, Zhu J. et al. Perfluorocarbon nanocapsules improve hypoxic microenvironment for the tumor ultrasound diagnosis and photodynamic therapy. J Biomed Nanotechnol. 2018;14:2162-71
13. Wu J, Williams GR, Niu S, Yang Y, Li Y, Zhang X. et al. Biomineralized bimetallic oxide nanotheranostics for multimodal imaging-guided combination therapy. Theranostics. 2020;10:841-55
14. Wan Y, Lu G, Zhang J, Wang Z, Li X, Chen R. et al. A biocompatible free radical nanogenerator with real-time monitoring capability for high performance sequential hypoxic tumor therapy. Adv Func Mater. 2019;29:1903436
15. Yu W, Liu T, Zhang M, Wang Z, Ye J, Li C-X. et al. O2 economizer for inhibiting cell respiration to combat the hypoxia obstacle in tumor treatments. ACS Nano. 2019;13:1784-94
16. Wu K, Zhao H, Sun Z, Wang B, Tang X, Dai Y. et al. Endogenous oxygen generating multifunctional theranostic nanoplatform for enhanced photodynamic-photothermal therapy and multimodal imaging. Theranostics. 2019;9:7697-713
17. Hu D, Chen L, Qu Y, Peng J, Chu B, Shi K. et al. Oxygen-generating hybrid polymeric nanoparticles with encapsulated doxorubicin and Chlorin e6 for trimodal imaging-guided combined chemo-photodynamic therapy. Theranostics. 2018;8:1558-74
18. Yang T, Tang Y, Liu L, Lv X, Wang Q, Ke H. et al. Size-dependent Ag2S nanodots for second near-infrared fluorescence/photoacoustics imaging and simultaneous photothermal therapy. ACS Nano. 2017;11:1848-57
19. Zhang L, Han F. Protein coated gold nanoparticles as template for the directed synthesis of highly fluorescent gold nanoclusters. Nanotechnology. 2018;29:165702
20. Yang W, Guo W, Le W, Lv G, Zhang F, Shi L. et al. Albumin-bioinspired Gd:CuS nanotheranostic agent for in vivo photoacoustic/magnetic resonance imaging-guided tumor-targeted photothermal therapy. ACS Nano. 2016;10:10245-57
21. Yang W, Guo W, Jin C, Zhang B. Protein / peptide-templated biomimetic synthesis of inorganic nanoparticles for biomedical applications. J Mater Chem B. 2016;5:401-17
22. Zhang B, Jin H, Li Y, Chen B, Liu S, Shi D. Bioinspired synthesis of gadolinium-based hybrid nanoparticles as MRI blood pool contrast agents with high relaxivity. J Mater Chem. 2012;22:14494-501
23. Yang W, Wu X, Dou Y, Chang J, Xiang C, Yu J. et al. A human endogenous protein exerts multi-role biomimetic chemistry in synthesis of paramagnetic gold nanostructures for tumor bimodal imaging. Biomaterials. 2018;161:256-69
24. Yang T, Wang Y, Ke H, Wang Q, Lv X, Wu H. et al. Protein-nanoreactor-assisted synthesis of semiconductor nanocrystals for efficient cancer theranostics. Adv Mater. 2016;28:5923-30
25. Zhao Y, Peng J, Li J, Huang L, Yang J, Huang K. et al. Tumor-targeted and clearable human protein-based MRI nanoprobes. Nano Lett. 2017;17:4096-100
26. Harmatys KM, Chen J, Charron DM, MacLaughlin CM, Zheng G. Multipronged biomimetic approach to create optically tunable nanoparticles. Angew Chem Int Ed. 2018;57:8125-9
27. Liang K, Li Z, Luo Y, Zhang Q, Yin F, Xu L. et al. Intelligent nanocomposites with intrinsic blood-brain-barrier crossing ability designed for highly specific MR imaging and sonodynamic therapy of glioblastoma. Small. 2020;16:1906985
28. Wang S, Yuan F, Chen K, Chen G, Tu K, Wang H. et al. Synthesis of hemoglobin conjugated polymeric micelle: A ZNPc carrier with oxygen self-compensating ability for photodynamic therapy. Biomacromolecules. 2015;16:2693-700
29. Jiang L, Bai H, Liu L, Lv F, Ren X, Wang S. Luminescent, oxygen-supplying, hemoglobin-linked conjugated polymer nanoparticles for photodynamic therapy. Angew Chem Int Ed. 2019;58:10660-5
30. Conover CD, Malatesta P, Lejeune L, Chang C-L, Shorr R. The effects of hemodilution with polyethylene glycol bovine hemoglobin (PEG-Hb) in a conscious porcine model. J Investig Med. 1996;44:238-46
31. Huang K, Ma H, Liu J, Huo S, Kumar A, Wei T. et al. Size-dependent localization and penetration of ultrasmall gold nanoparticles in cancer cells, multicellular spheroids, and tumors in vivo. ACS Nano. 2012;6:4483-93
32. Ehlerding EB, Chen F, Cai W. Biodegradable and renal clearable inorganic nanoparticles. Adv Sci. 2016;3:1500223
33. Soderlind F, Pedersen H, Petoral RM Jr, Kall PO, Uvdal K. Synthesis and characterisation of Gd2O3 nanocrystals functionalised by organic acids. J Colloid Interface Sci. 2005;288:140-8
34. Rahman AA, Vasilev K, Majewski P. Ultra-small Gd2O3 nanoparticles: Absorption and emission properties. J Colloid Interface Sci. 2011;354:592-6
35. Zhou J-P, Chai C-L, Yang S-Y, Liu Z-K, Song S-L, Li Y-L. et al. Properties of high k gate dielectric gadolinium oxide deposited on Si (100) by dual ion beam deposition (DIBD). J Cryst Growth. 2004;270:21-9
36. Zheng X-Y, Zhao K, Tang J, Wang X-Y, Li L-D, Chen N-X. et al. Gd-dots with strong ligand-water interaction for ultrasensitive magnetic resonance renography. ACS Nano. 2017;11:3642-50
37. Kobayashi H, Kawamoto S, Jo S-K, Bryant HL, Brechbiel MW, Star RA. Macromolecular MRI contrast agents with small dendrimers: Pharmacokinetic differences between sizes and cores. Bioconjug Chem. 2003;14:388-94
38. Caravan P, Ellison JJ, Mcmurry TJ, Lauffer RB. Gadolinium (III) chelates as MRI contrast agents: structure, dynamics, and applications. Chem Rev. 1999;99:2293-352
39. Duan L, Yan X, Wang A, Jia Y, Li J. Highly loaded hemoglobin spheres as promising artificial oxygen carriers. ACS Nano. 2012;6:6897-904
40. Luo Z, Zheng M, Zhao P, Chen Z, Siu F, Gong P. et al. Self-monitoring artificial red cells with sufficient oxygen supply for enhanced photodynamic therapy. Sci Rep. 2016;6:23393
41. Li B, Gu Z, Kurniawan N, Chen W, Xu ZP. Manganese-based layered double hydroxide nanoparticles as a T1-MRI contrast agent with ultrasensitive pH response and high relaxivity. Adv Mater. 2017;29:1700373
42. Lin LS, Yang X, Zhou Z, Yang Z, Jacobson O, Liu Y. et al. Yolk-shell nanostructure: An ideal architecture to achieve harmonious integration of magnetic-plasmonic hybrid theranostic platform. Adv Mater. 2017;29:1606681
43. Le Fur M, Rotile NJ, Correcher C, Clavijo-Jordan V, Ross AW, Catana C. et al. Yttrium-86 is a positron emitting surrogate of gadolinium for noninvasive quantification of whole-body distribution of gadolinium-based contrast agents. Angew Chem Int Ed. 2019;59:1474-8
44. Dahmani FZ, Xiao Y, Zhang J, Yu Y, Zhou J, Yao J. Multifunctional polymeric nanosystems for dual-targeted combinatorial chemo/angiogenesis therapy of tumors. Adv Healthc Mater. 2016;5:1447-61
45. Mao B, Liu C, Zheng W, Li X, Ge R, Shen H. et al. Cyclic cRGDfk peptide and Chlorin e6 functionalized silk fibroin nanoparticles for targeted drug delivery and photodynamic therapy. Biomaterials. 2018;161:306-20
46. Wang H, Chao Y, Liu J, Zhu W, Wang G, Xu L. et al. Photosensitizer-crosslinked in-situ polymerization on catalase for tumor hypoxia modulation & enhanced photodynamic therapy. Biomaterials. 2018;181:310-7
47. Horvat N, Carlos Tavares Rocha C, Clemente Oliveira B, Petkovska I, Gollub MJ. MRI of rectal cancer: Tumor staging, imaging techniques, and management. RadioGraphics. 2019;39:367-87
48. Qian M, Du Y, Wang S, Li C, Jiang H, Shi W. et al. Highly crystalline multicolor carbon nanodots for dual-modal imaging-guided photothermal therapy of glioma. ACS Appl Mater Interfaces. 2018;10:4031-40
49. Partridge SC, Nissan N, Rahbar H, Kitsch AE, Sigmund EE. Diffusion-weighted breast MRI: Clinical applications and emerging techniques. J Magn Reson Imaging. 2017;45:337-55
50. Bonekamp S, Corona-Villalobos CP, Kamel IR. Oncologic applications of diffusion-weighted MRI in the body. J Magn Reson Imaging. 2012;35:257-79
51. Yoshikawa MI, Ohsumi S, Sugata S, Kataoka M, Takashima S, Mochizuki T. et al. Relation between cancer cellularity and apparent diffusion coefficient values using diffusion-weighted magnetic resonance imaging in breast cancer. Radiat Med. 2008;26:222-6
52. Tadayoshi K, Hiroshige C, Takashi Y, Kaoru K. Detection of photodynamic therapy-induced early apoptosis in human salivary gland tumor cells in vitro and in a mouse tumor model. Oral Oncol. 2004;40:787-92
53. Wang S, Fang Y, Chen G, Tu K, Wang H, Wang LQ. Dextran-based thermo-responsive hemoglobin-polymer conjugates with oxygen-carrying capacity. RSC Adv. 2014;4:52940-8
Author contact
![]() Corresponding authors: Bingbo Zhang, E-mail: bingbozhangedu.cn; Yuxin Shi, E-mail: shiyx828288com; Han Wang, E-mail: han.wangedu.cn.
Corresponding authors: Bingbo Zhang, E-mail: bingbozhangedu.cn; Yuxin Shi, E-mail: shiyx828288com; Han Wang, E-mail: han.wangedu.cn.