Impact Factor
- Issue 14; 2026
- Issue 13; 2026
- Issue 12; 2026
- Issue 11; 2026
- Issue 10; 2026
- Volume 16; 2026
- Advance Articles
- Past Issues
- Cover Images
- Cover Suggestion
- Index & Coverage
- Special Issues
Introduction
Results
Discussion
Materials and Methods
Abbreviations
Supplementary Material
Acknowledgements
References
International Journal of Biological Sciences
International Journal of Medical Sciences
 Global reach, higher impact

Theranostics 2020; 10(23):10548-10562. doi:10.7150/thno.46826 This issue Cite
Research Paper
E. coli nitroreductase NfsA is a reporter gene for non-invasive PET imaging in cancer gene therapy applications
Alexandra Marie Mowday1,2,5*, Janine Naomi Copp3,6*, Sophie Philippa Syddall1,2,7*, Ludwig Jerome Dubois4#, Jingli Wang1, Natasja Gabi Lieuwes4, Rianne Biemans4, Amir Ashoorzadeh1,2, Maria Rosaria Abbattista1,2, Elsie May Williams3, Christopher Paul Guise1,2, Philippe Lambin4, David Francis Ackerley2,3, Jeff Bruce Smaill1,2#, Jan Theys4#, Adam Vorn Patterson1,2 ![]() #
#
1. Auckland Cancer Society Research Centre, University of Auckland, Auckland, New Zealand.
2. Maurice Wilkins Centre for Molecular Biodiscovery, School of Biological Sciences, University of Auckland, Auckland, New Zealand.
3. School of Biological Sciences, Victoria University of Wellington, Wellington 6012, New Zealand.
4. The M-Lab, Department of Precision Medicine, University of Maastricht, Maastricht, The Netherlands.
5. Current address: The M-Lab, Department of Precision Medicine, University of Maastricht, Maastricht, The Netherlands.
6. Current address: Michael Smith Laboratories, University of British Columbia, Vancouver, BC, V6T 1Z4, Canada.
7. Current address: Walter and Eliza Hall Institute of Medical Research, 4 Research Avenue, Bundoora, Victoria, 3083, Australia.
*Equal contributions to this work.
#Equal contributions to this work.
Received 2020-4-8; Accepted 2020-7-30; Published 2020-8-21
Abstract

The use of reporter genes to non-invasively image molecular processes inside cells has significant translational potential, particularly in the context of systemically administered gene therapy vectors and adoptively administered cells such as immune or stem cell based therapies. Bacterial nitroreductase enzymes possess ideal properties for reporter gene imaging applications, being of non-human origin and possessing the ability to metabolize a range of clinically relevant nitro(hetero)cyclic substrates.
Methods: A library of eleven Escherichia coli nitroreductase candidates were screened for the ability to efficiently metabolize 2-nitroimidazole based positron emission tomography (PET) probes originally developed as radiotracers for hypoxic cell imaging. Several complementary methods were utilized to detect formation of cell-entrapped metabolites, including various in vitro and in vivo models to establish the capacity of the 2-nitroimidazole PET agent EF5 to quantify expression of a nitroreductase candidate. Proof-of-principle PET imaging studies were successfully conducted using 18F-HX4.
Results: Recombinant enzyme kinetics, bacterial SOS reporter assays, anti-proliferative assays and flow cytometry approaches collectively identified the major oxygen-insensitive nitroreductase NfsA from E. coli (NfsA_Ec) as the most promising nitroreductase reporter gene. Cells expressing NfsA_Ec were demonstrably labelled with the imaging agent EF5 in a manner that was quantitatively superior to hypoxia, in monolayers (2D), multicellular layers (3D), and in human tumor xenograft models. EF5 retention correlated with NfsA_Ec positive cell density over a range of EF5 concentrations in 3D in vitro models and in xenografts in vivo and was predictive of in vivo anti-tumor activity of the cytotoxic prodrug PR-104. Following PET imaging with 18F-HX4, a significantly higher tumor-to-blood ratio was observed in two xenograft models for NfsA_Ec expressing tumors compared to the parental tumors thereof, providing verification of this reporter gene imaging approach.
Conclusion: This study establishes that the bacterial nitroreductase NfsA_Ec can be utilized as an imaging capable reporter gene, with the ability to metabolize and trap 2-nitroimidazole PET imaging agents for non-invasive imaging of gene expression.
Keywords: reporter gene imaging, PET imaging, nitroreductase, gene therapy, drug repurposing
Introduction
Non-invasive reporter gene imaging is an indirect method to detect the process of gene expression inside cells [1]. One of the major translational applications of reporter gene imaging is the ability to monitor quantitatively the spatial and temporal distribution of gene therapy vectors as a surrogate of imaging transgene expression [1-3]. In addition, reporter genes can also be used to non-invasively and repetitively monitor adoptive cell-based therapies, providing the opportunity to study the cell trafficking, targeting, proliferation, and persistence of transplanted and stem/progenitor cells [2, 4]. Early examples of reporter gene imaging involved optical methodology such as fluorescence [5] or bioluminescence [6], but more recently radionuclide-based methods have been developed following increased interest in positron emission tomography imaging (PET).
PET is a highly sensitive imaging method that takes advantage of coincident detection of two opposing 511 KeV gamma rays, emitted when positrons collide with electrons [7]. This annihilation event allows precise positional detection and quantification of positron radiolabeled molecules, usually associated with a specific molecular probe or reporter gene [8]. A general paradigm for non-invasive reporter gene imaging using radiolabeled probes was first described in 1995, whereby a reporter transgene (HSV1-tk) encodes an enzyme that selectively interacts with the probe (2-[14C]FIAU) to result in trapping and accumulation of radioactivity inside the transduced cell [9]. Since then, several fluorinated ganciclovir analogues have been developed as novel probes to image HSV1-tk expression, including 18F-FHBG [10, 11]. Preclinical safety evaluation of this probe has led to US FDA investigational new drug status [12] although potential toxicity associated with the systemic administration of nucleoside analogues and early degradation may limit signal integrity [13]. The only clinically approved method available for reporter gene imaging is the human Sodium Iodide Symporter (hNIS), transfer of which allows visualization of the accumulated radioisotope 124I. Non-invasive imaging following viral gene transfer has been demonstrated as feasible in both preclinical animal models and humans [14-16], but it is possible that endogenous hNIS expression in the thyroid, stomach or other organs could limit sensitivity of the reporter assay in adjacent tissues [17].
Bacterial nitroreductase (NTR) enzymes are ideal candidates for reporter gene imaging applications, being of non-human origin and capable of metabolizing a diverse range of nitroheterocyclic substrates [18]. NTR has been widely used in the context of gene-directed enzyme prodrug therapy (GDEPT), where sustained expression from either viral or bacterial vectors has produced significant therapeutic efficacy in combination with various prodrugs [19-21]. In addition, NTR expression in zebrafish and rodent models in a tissue-restricted manner can provide chemically inducible single cell ablation, allowing studies of cellular function and regeneration [22-24]. At present, NTRs are commonly imaged using fluorescent and near-infrared probes [25, 26] but tissue penetration of even the most effective near-infrared probes is typically attenuated beyond 1 cm, making this method unsuitable for routine clinical use [27]. However, there are several well-studied nitroheterocyclic PET probes available at various stages of clinical development and validation for the imaging of hypoxia including the 18F-labeled 2-nitroimidazoles (2-NIs) fluoromisonidazole (F-Miso) [28], EF5 [29], EF3 [30] and HX4 [31]. These probes can penetrate into tumors to detect a subset of hypoxic cells and, following an oxygen-sensitive one-electron reduction step, reactive products are formed that bind covalently to cell components and cause intracellular accumulation of the 2-NI [32]. We considered it possible that certain oxygen-insensitive (Type I) bacterial NTR enzymes might offer the potential to bypass the oxygen sensitive step to generate the reactive product directly by a concerted two-electron reduction mechanism [18]. This is an attractive option given that all clinical-enabling processes are a posteriori achieved, negating the need for de novo development of a radionuclide PET probe to image NTR expression. The principle caveats are whether an NTR can be identified that is capable of metabolizing 2-NI substrates, and whether an NTR-expressing cell can be accurately quantified against a background of non-specific probe retention.
The NTR NfsB from Escherichia coli has been extensively studied as a model nitroreductase for gene therapy vectors (for a more comprehensive review, see Williams et al., 2015 [18]). However, the only study to date to report activity of NfsB with a 2-NI substrate describes this enzyme as being inactive with misonidazole (a non-fluorinated analogue of the hypoxia probe F-Miso) [33]. Here we confirm that NfsB is ineffective at reducing 2-NI substrates. In contrast, we demonstrate that an alternative oxygen-insensitive nitroreductase from E. coli, NfsA (NfsA_Ec; UniProt P17117), exhibits a significant metabolic capacity for 2-NI agents, several of which have demonstrated clinical utility as hypoxia PET imaging agents. Cells expressing nfsA_Ec were shown to be efficiently labelled with the 2-NI EF5 in a manner that was dose-dependent and quantitatively superior to that of hypoxic activation, in monolayers (in vitro 2D), multi-cellular layers (in vitro 3D), and in human tumor xenografts (in vivo 3D). The presence of nfsA_Ec in tumor xenografts was also predictive of prodrug efficacy in vivo. Proof-of-principle microPET imaging studies were successfully conducted using 18F-HX4.
Results
NfsA_Ec is efficient at metabolizing 2-nitroimidazole compounds in vitro
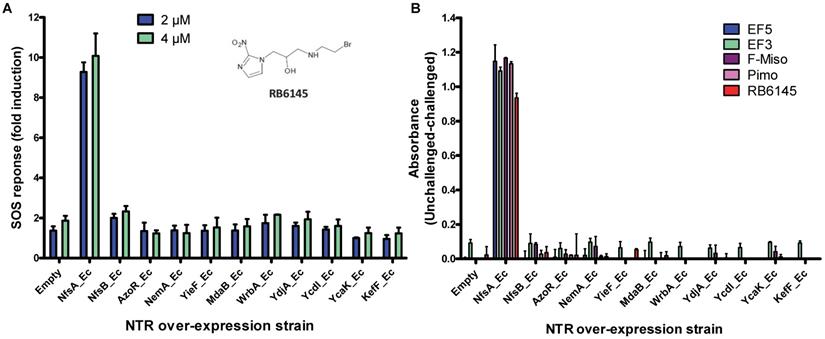
To determine whether NTR enzymes can successfully metabolize 2-NI compounds with clinical utility as PET imaging substrates, we over-expressed each of a previously identified panel of eleven candidate NTRs from E. coli [34] in a reporter strain of E. coli, SOS-R2, which expresses quantifiable β-galactosidase from an SOS (DNA damage response) promoter [35]. We then challenged each over-expression strain with RB6145, a 2-NI prodrug that is converted to an alkylating agent following nitroreduction [36]. The NfsA_Ec over-expressing strain, which exhibited a ~10-fold induction in SOS response following challenge with either 2 µM or 4 µM RB6145, was the only strain with a significantly different response from the empty plasmid control (P < 0.01, Figure 1A). To conduct a more comprehensive analysis of activity with diverse 2-NI substrates we subjected each NTR over-expressing E. coli strain to an NADPH depletion assay. We observed that crude lysates derived from the NfsA_Ec over-expressing strain consumed NADPH at a greatly heightened rate when incubated with any of the 2-NI substrates HX4, EF5, EF3, F-Miso, pimonidazole or RB6145 (Figure 1B). In contrast, NADPH consumption by crude lysates from the other NTR over-expression strains or the empty plasmid control was not increased in the presence of these substrates. When grown in liquid cultures, the NfsA_Ec over-expression strain was substantially more sensitive than the other strains to each of the 2-NI compounds, as quantified in IC50 assays (Table 1). The NfsB over-expression strain exhibited low-level sensitivity to HX4, F-Miso and EF3, but sensitivity of this strain to the remaining 2-NI compounds was above the detection threshold. None of the other strains had any detectable sensitivity to any of the 2-NI compounds tested. Consistent with these observations, the catalytic efficiency (kcat/KM) of purified NfsA_Ec protein was at least 40-fold greater than that of purified NfsB for every substrate tested, with the exception of HX4, with which NfsA_Ec was approximately 3-fold more efficient than NfsB (Table 2).
A) RB6145 induced SOS response of the E. coli NTR over-expression library. SOS-R2 NTR over-expression strains were grown as individual cultures in 96 well microplates and challenged with either 2 μM or 4 μM RB6145 for 4 hours prior to quantification of the SOS response induction by β-galactosidase assay. Fold induction is derived from the Miller units recorded on drug exposure divided by those of unchallenged replicate cultures. Data are the mean of two independent experiments ± SD. B) NADPH consumption by SOS-R2::ntr cell lysates in the presence of 2-nitroimidazole compounds. Crude cell lysates were incubated with 200 µM NADPH and 150 µM of each 2-NI test compound for 30 mins. Addition of NBT/PMS post-incubation yielded formazan dye in proportion to the residual NADPH, which was quantified by measuring absorbance at OD590. Plotted values indicate the extent of 2-NI metabolism by each NTR over-expressing strain and were derived by subtracting the OD590 of compound challenged lysates from the OD590 of unchallenged duplicate controls. Data are the average of two independent assays ± SD.
Micromolar IC50 values for NTR-expressing E. coli strains exposed to a panel of 2-nitroimidazole compounds
 | ||||||
|---|---|---|---|---|---|---|
| R = |  |  |  |  |  |  |
| NTR | EF5 | EF3 | Pimonidazole | F-Miso | RB6145 | HX4 |
| NfsA | 140 ± 9 | 83 ± 4 | 180 ± 5 | 110 ± 0.5 | 14 ± 1 | 280 ± 20 |
| NfsB | >1000 | 690 ± 80 | >1000 | 860 ± 20 | >250 | 670 ± 30 |
| AzoR | >1000 | >1000 | >1000 | >1000 | >250 | >1500 |
| NemA | >1000 | >1000 | >1000 | >1000 | >250 | >1500 |
| Yief | >1000 | >1000 | >1000 | >1000 | >250 | >1500 |
| MdaB | >1000 | >1000 | >1000 | >1000 | >250 | >1500 |
| WrbA | >1000 | >1000 | >1000 | >1000 | >250 | >1500 |
| YdjA | >1000 | >1000 | >1000 | >1000 | >250 | >1500 |
| YcdI | >1000 | >1000 | >1000 | >1000 | >250 | >1500 |
| YcaK | >1000 | >1000 | >1000 | >1000 | >250 | >1500 |
| KefF | >1000 | >1000 | >1000 | >1000 | >250 | >1500 |
| Empty | >1000 | >1000 | >1000 | >1000 | >250 | >1500 |
Steady state kinetic parameters for reduction 2-nitroimidazole substrates by purified His6-tagged nitroreductase candidates
| Nitroreductasea | Compound | k catb (s-1) | KMb (µM) | kcat/KM (mM-1 s-1) |
|---|---|---|---|---|
| NfsA | EF5 | 8.9 ± 0.3 | 160 ± 20 | 56 ± 8 |
| EF3 | 10.7 ± 0.4 | 160 ± 21 | 66 ± 9 | |
| F-misonidazole (F-miso) | 8.8 ± 0.6 | 480 ± 70 | 18 ± 3 | |
| HX-4 | 13.5 ± 0.6 | 180 ± 25 | 75 ± 11 | |
| Pimonidazole (Pimo) | 11.3 ± 0.5 | 240 ± 26 | 47 ± 5 | |
| RB6145 | 2.7 ± 0.2 | 200 ± 33 | 14 ± 2 | |
| NfsB | EF5 | 0.4 ± 0.1 | 1800 ± 840 | 0.2 ± 0.1 |
| EF3 | 1.1 ± 0.5 | 5800 ± 3700 | 0.2 ± 0.1 | |
| F-misonidazole | 2.1 ± 0.1 | 5200 ± 3100 | 0.4 ± 0.3 | |
| HX-4 | 29.5 ± 0.1 | 1100 ± 160 | 26 ± 4 | |
| Pimonidazole, RB6145 | No detectable activity | |||
| AzoR | EF5, EF3, F-miso, HX4, Pimo, RB6145 | No detectable activity | ||
| NemA | EF5, EF3, F-miso, HX4, Pimo, RB6145 | No detectable activity | ||
| Yief | EF5, EF3, F-miso, HX4, Pimo, RB6145 | No detectable activity | ||
| MdaB | EF5, EF3, F-miso, HX4, Pimo, RB6145 | No detectable activity | ||
| WrbA | EF5, EF3, F-miso, HX4, Pimo, RB6145 | No detectable activity |
a: YcdI and KefF were recovered in the insoluble fraction and were not able to be purified;
b: Apparent KM and kcat as determined at 200 mM NADPH.
We next sought to investigate the performance of the different NTR candidates with 2-NI compounds within a human tumor cell environment. A previously generated panel of HCT116 cell lines individually over-expressing each NTR candidate [34] was screened using a surrogate endpoint of relative sensitivity to the panel of 2-NI compounds by anti-proliferative assay (Table 3). Again, significantly increased sensitivity to 2-NI substrates was observed exclusively in cell lines expressing NfsA_Ec or NfsB, in comparison to non-transfected wild type (WT) controls. Cells expressing NfsA_Ec were generally the most sensitive, with WT:NTR IC50 ratios (WT IC50/NTR IC50) ranging from 52-1600 fold (see Table S1 for actual IC50 values). In contrast, sensitivity of NfsB expressing cells to most 2-NI substrates was more modest (WT:NTR IC50 ratios between 2-203 fold). PR-104A was included as a nitroaromatic prodrug reference, with NfsA_Ec and NfsB (and to a lesser extent MdaB and NemA) demonstrating anti-proliferative activity consistent with our previous assessment of these enzyme activities in E. coli cell lines and as purified proteins [35].
Comparative sensitivity of nitroreductase-expressing HCT116 cells to HCT116 WT cells for various nitro(hetero)aromatic compounds
 | |||||||
|---|---|---|---|---|---|---|---|
 | R = | ||||||
 |  |  |  |  |  | ||
| Cell Line | PR-104A | EF5 | EF3 | Pimo | F-miso | RSU1069 | HX4 |
| NfsA_Ec | 985 | 1600 | 1050 | 71 | 690 | 108 | 52 |
| NfsB_Ec | 1643 | 57 | 60 | 2 | 203 | 13 | 103 |
| YcaK_Ec | 1 | 1 | 1 | 1 | 1 | 1 | 1 |
| YieF_Ec | 2 | 1 | 2 | 1 | 1 | 2 | 1 |
| AzoR_Ec | 3 | 1 | 1 | 1 | 1 | 2 | 3 |
| MdaB_Ec | 33 | 1 | 1 | 1 | 1 | 2 | 1 |
| WrbA_Ec | 4 | 2 | 1 | 1 | 1 | 2 | 1 |
| KefF_Ec | 3 | 1 | 1 | 1 | 1 | 1 | 1 |
| YcdI_Ec | 1 | 1 | 1 | 1 | 1 | 1 | 1 |
| YdjA_Ec | 1 | 2 | 2 | 1 | 1 | 1 | 1 |
| NemA_Ec | 14 | 4 | 8 | 2 | 28 | 5 | 4 |
Cell lines were exposed to compounds for 18 hours at a range of concentrations followed by 5 days growth in drug-free media. IC50 values were determined as the concentration required to inhibit cell growth by 50% of untreated controls. Values in the table represent the fold change in IC50 of the stated cell line relative to HCT116 WT cells. Raw IC50 values are provided in Supplementary table 1.
NfsA_Ec-dependent activation of EF5 is superior to hypoxia-dependent activation at low cell density
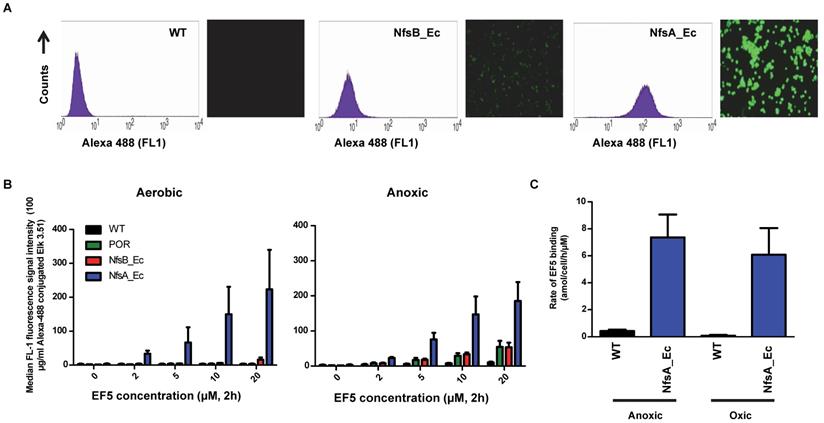
EF5 was selected as the preferred 2-NI substrate for proof-of-principle studies into NTR activation due to the availability of well-validated methodology for quantitative adduct detection using a fluorescently-tagged monoclonal antibody [37]. To establish if NTR activation of EF5 is superior to that of hypoxia-dependent activation (i.e. activation by one-electron reductases such as POR), NfsA_Ec and NfsB cells were exposed to EF5 and the ability to produce detectable adducts was first investigated (Figure 2). NfsA_Ec expressing cells provided the greatest increase in fluorescence intensity (and therefore EF5 adduct formation) in comparison to WT cells under aerobic conditions (Figure 2A), an observation consistent with the IC50 screen. NfsB expressing cells did provide some increase in fluorescence intensity, but to a much lesser degree than NfsA_Ec. Adduct formation under anoxic conditions was then quantified in these cell lines over a range of EF5 concentrations and compared to that of POR, a major one-electron reductase involved in the metabolism of hypoxia-activated prodrugs [38, 39] (Figure 2B). Our results clearly demonstrate that metabolism of EF5 and retention of adducts is concentration-dependent with respect to both one and two-electron reduction. Although POR and NfsB show an increase in adduct retention at 20 µM EF5 under anoxia in comparison to WT cells (5.7-fold and 5.3-fold respectively at 20 µM EF5), NfsA_Ec is far superior to both, demonstrating a 19-fold increase in fluorescence in the same conditions. To further demonstrate this, we examined the cumulative binding of 14C-EF5 over a 4-hour period under aerobic and anoxic conditions in WT and NfsA_Ec cells (Figure 2C). Under anoxia, this methodology confirmed that retention of 14C-EF5 adducts in NfsA_Ec expressing cells is significantly greater than observed in HCT116 WT cells (17-fold increase in 14C-EF5 binding, P < 0.01). Rates of 14C-EF5 binding in NfsA_Ec expressing cells were similar under both aerobic and anoxic conditions (P > 0.05).
NfsA_Ec dependent activation of EF5 is superior to hypoxia dependent activation at low cell density. A) Flow cytometry analysis and fluorescent microscopy of nitroreductase-expressing HCT116 cells after 2 h aerobic exposure to 20 µM EF5. EF5 adducts were detected using a specific antibody conjugated to Alexa 488. B) Metabolism of EF5 after 2 h exposure in aerobic and anoxic conditions in parental HCT-116 cells and cells over-expressing NfsA_Ec, NfsB_Ec or POR. EF5 adducts were detected by flow cytometry using the Alexa 488 conjugated antibody. Values are mean ±SEM of two independent experiments. C) Rate of 14C-EF5 binding in HCT116 WT and HCT116 NfsA_Ec cells during a 2 mM exposure for 4 hours under aerobic or anoxic conditions.
NfsA_Ec-dependent metabolism of EF5 is detectable at high cell density
In three dimensions (3D) it is possible that efficient metabolic consumption of EF5 may lower the available concentration at distal locations in a dense, multi-cellular environment [40, 41]. Therefore, the influence of increased reductive metabolism of EF5 by NfsA_Ec was analyzed using high cell density multicellular layers (MCLs) (Figure 3). MCL populations containing a mixture of WT and NfsA_Ec-expressing cells were used, necessitating the development of a method to differentiate between the two cell types following completion of the experiment and dissociation of the MCL. Subsequent incubation with pimonidazole under aerobic conditions directly phenotyped the cell populations by exploiting the oxygen-insensitive catalytic activity of the NfsA_Ec-expressing cells (pimonidazole positive), distinguishing them from the WT cells (pimonidazole negative) also in the MCL (Figure S2).
Evaluation of NfsA_Ec dependent EF5 metabolism at high cell density. A) Representative dot plots from each mixed NfsA_Ec MCL treated with 200 µmol-hr EF5. B) Total EF5/CY5 fluorescence in MCLs with varying densities of nfsA-expressing cells under oxic conditions compared to 100% HCT116 WT MCLs in anoxic conditions, R2 = 0.99. Values are mean ±SEM of 3 independent experiments. C) Level of EF5/CY5 expression in pimonidazole positive (NfsA_Ec) cells only, R2 = 0.80 (all data points) and R2 = 0.99 (all but data point for 100% NfsA_Ec MCL). Values are mean ±SEM of 3 independent experiments.
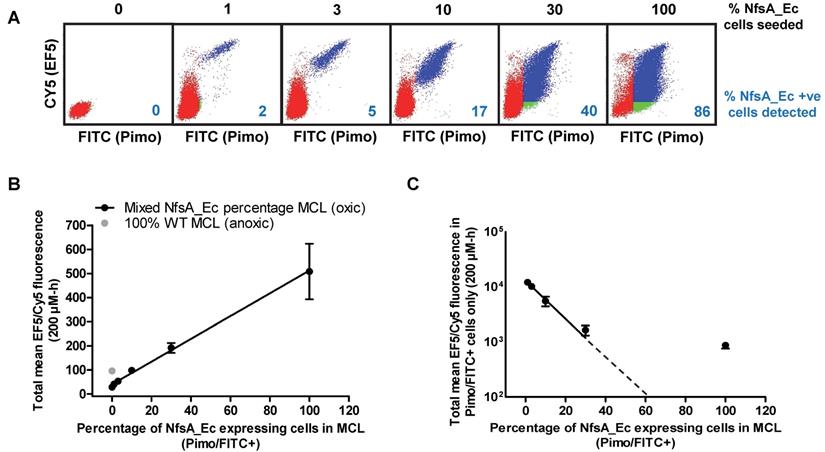
MCLs were treated with EF5 under hyperoxic conditions (95% O2, 5% CO2) to prevent hypoxic activation by one-electron reductases. For MCLs with a small percentage of NfsA_Ec cells (1, 3 or 10% of cells seeded), two defined populations were observed; a pimonidazole negative (WT) population with reduced levels of EF5 binding was present (Figure 3A, red dots) in addition to a pimonidazole positive (NfsA_Ec) population with high levels of EF5 binding (Figure 3A, blue dots). A minor proportion of the pimonidazole negative cells was EF5 positive, indicating that diffusion of EF5 metabolites may occur from NfsA_Ec cells into surrounding WT cells.
At higher NfsA_Ec densities (30% and 100% of cells seeded), there was evidence of a pimonidazole positive cell population that was EF5 negative, consistent with extensive EF5 consumption leading to a lack of penetration into the MCL. (Figure 3A, green dots). However, of note, pimonidazole negative cells were also detected in MCLs that consisted of 100% NfsA_Ec expressing cells, possibly indicating a loss of metabolic capacity. Overall, the total mean EF5 fluorescence of all cells in the MCL correlated well with the NfsA_Ec positive cell subpopulation (r2 = 0.99; P < 0.001, Figure 3B), demonstrating that EF5 detection is proportional to the NfsA_Ec positive cells present. However, the EF5 fluorescence of the NfsA_Ec positive cells alone deviated from linearity above approximately 30% NfsA_Ec cells suggesting the presence of a metabolic barrier (Figure 3C).
EF5 metabolism can identify NfsA_Ec expressing cells in human tumor xenografts
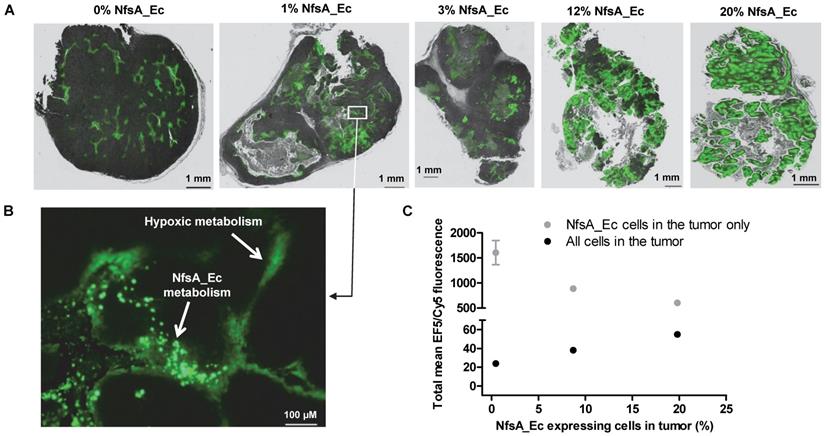
Although high cell density MCLs are more informative than two-dimensional monolayers, these models lack key pharmacokinetic/pharmacodynamics features that are inherent to an in vivo setting. Therefore, the ability of EF5 to label NfsA_Ec expressing cells and the spatial distribution of the resulting EF5 adducts was assessed using tumor xenografts containing variable proportions of NfsA_Ec expressing cells (Figure 4). The spatial distribution of EF5 adducts throughout tumor sections was relatively homogeneous and, consistent with the MCL data, there did not appear to be EF5 consumption or penetration problems in xenografts with an NfsA_Ec proportion ≤ 20%, with large sections of the tumor demonstrating significant EF5 retention (Figure 4A). Lower intensity staining of the hypoxic regions was clearly evident, particularly in the peri-necrotic regions of the xenografts containing a low proportion of NfsA_Ec expressing cells, but it is clear that EF5 adduct retention in NfsA_Ec expressing cells was superior to EF5 adduct retention in hypoxic parental cells (Figure 4B; inset of the 1% NfsA_Ec xenograft). Upon dissociation of these tumors into single cell suspensions to determine the EF5 fluorescence of individual cells, a similar trend to the in vitro data (Figure 3) was observed; the percentage of Nfs_Ec expressing cells showed a positive correlation with the mean EF5 fluorescence for all tumor cells (R2 = 0.99) and a negative correlation with the NfsA_Ec expressing cells (R2 = 0.90). Overall, this indicates that EF5 dependent labelling of tumor cells is efficient when the frequency of NfsA_Ec-positive subpopulation is ≤ 20%.
EF5 labelling can be used to detect NfsA_Ec-expressing cells in vivo. A) Intensity of EF5 staining in tumours consisting of a majority of HCT116 WT and a minority (1, 3, 12 or 20%) of HCT116 NfsA_Ec cells. EF5 adducts were detected using an Alexa 488 conjugated antibody, fluorescent images were overlaid onto adjacent sections stained with H&E. B) Magnification of a section of the 1% HCT116 NfsA_Ec xenograft. C) Intensity of EF5 labelling in mixed HCT116 WT/HCT116 NfsA_Ec xenografts. NIH-III mice bearing 300 mm3 tumours were treated with EF5 and 24 hours later tumours were excised, enzymatically dissaggregated, and 1 x10⁶ cells were treated with 20 µM pimonidazole for 1hr to label NfsA_Ec expressing cells ex vivo. EF5 adducts were detected using a specific antibody conjugated to Alexa 488. EF5 staining intensity relative to the percentage of NfsA_Ec expressing cells is shown for all cells in the tumour (R2 = 0.99) and the pimonidazole positive NfsA_Ec-expressing population (R2 = 0.90). Values are Mean ±SEM for 2-3 tumours/group.
The presence of NfsA_Ec predicts for PR-104 efficacy in vivo
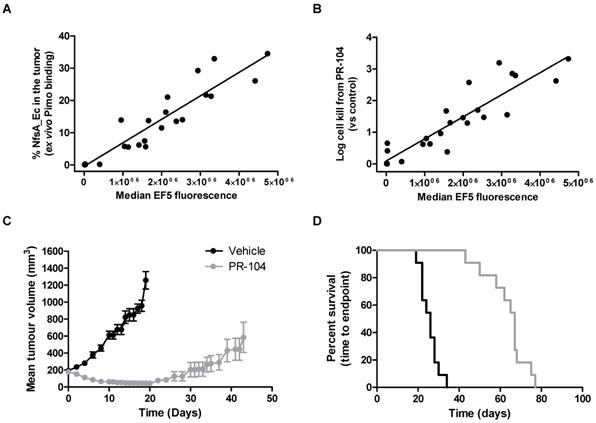
Next, we critically determined whether the proportion of NfsA_Ec positive cells in individual tumors correlated with the total EF5 signal, and whether this in turn could predict the therapeutic activity of the dual hypoxia/NfsA_Ec-activated prodrug PR-104 in vivo. Here animals bearing HCT116 tumors which were composed of a range of NfsA_Ec positive cells were treated with PR-104, followed by EF5 three hours later. Single cell suspensions of these tumors were isolated and employed to quantify median EF5 signal generated from both hypoxic and NfsA_Ec metabolism, and actual proportions of NfsA_Ec positive cells in the tumor at the time of treatment (ex vivo aerobic pimonidazole labelling). Median EF5 fluorescence of the entire tumor correlated with the percentage of NfsA_Ec positive cells in the tumor at the time of treatment (Figure 5A); increasing the proportion of NfsA_Ec positive cells (0% - 33%) yielded a detectable increase in median EF5 signal (R2 = 0.87). This indicates in vivo EF5 signal arising from hypoxia only accounts for a small fraction of the variability and is consistent with the findings in figure 2B and 2C. Concurrently, PR-104 dependent tumor clonogenic cell kill was monitored by colony forming assay. Here, tumor cell kill following PR-104 treatment was greatly increased, exceeding 99% loss of viability and correlating with the quantum of EF5 signal (R2 = 0.83, Figure 5B). Following this, we determined whether PR-104-dependent loss of tumor clonogenicity translated into significant tumor growth delay (TGD). We have previously shown that HCT116 wild type xenografts are refractory to single agent PR-104 in a growth delay setting [42]. In this study, xenografts of the same genetic background that express a minority of NfsA_Ec cells (21.9% ± 2%) produced significant tumor regressions when treated with single dose PR-104 (Figure 5C). A TGD of 158% was generated, with the median survival endpoint of 67 days representing an increase of 41 days over untreated controls (Log rank, P < 0.001, Figure 5D).
The presence of NfsA_Ec is predictive of PR-104 efficacy in vivo. A and B) The in vivo relationship between EF5 reduction, pimonidazole reduction and cell kill from PR-104. Tumours composed of 0-40% NfsA_Ec cells were grown in NIH-III mice and excised when the tumours reached a mean diameter of 10mm. Prior to excision, mice were dosed with 562 μmol/kg PR-104 followed by 30 mg/kg EF5 two hours later. Tumour cells were treated with 20 µM pimonidazole ex vivo for two hours before being labelled for both EF5 and pimonidazole adducts and plated to obtain a clonogenic endpoint for cell kill from PR-104. C and D) In vivo efficacy of PR-104 in 22% NfsA_Ec-expressing tumour xenografts. Average tumour volume and Kaplan-Meier survival plots for 100% WT and 22% NfsA_Ec/78% WT HCT116 xenografts grown subcutaneously on NIH-III mice and treated with PR-104 (1000 µmol/kg) or vehicle. N= 8-11 per group.
18F-HX4 microPET establishes in vivo proof-of-principle
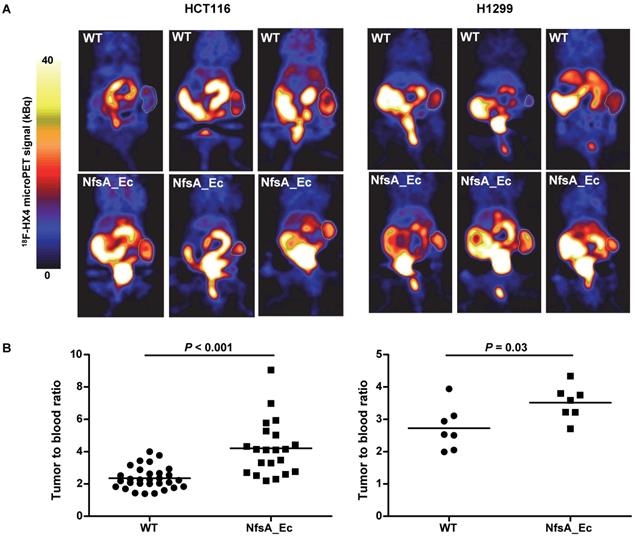
To establish whether PET imaging could be used as a tool to detect NfsA_Ec expression, two xenograft models (HCT116 and H1299), with or without NfsA_Ec overexpression, were treated with the 2-NI nucleoside analogue 18F-HX4 [43] prior to imaging with microPET. 18F-EF5 could not be used in this setting due to requirement of 18F2 gas for radiolabeling by electrophilic fluorination. 18F-HX4 has been in clinical development for imaging of tumor hypoxia [31, 44] and is significantly more water soluble than 18F-EF5, clearing faster from non-hypoxic tissue [27, 45]. In addition, NfsA_Ec had demonstrable anti-proliferative activity with HX4 (Table 3). A heterogeneous high accumulation of 18F-HX4 was observed in both tumor models (Figure 6 and Figure S3), with low 18F-HX4 levels in the surrounding normal tissues, except for the bladder and kidneys (the major route of excretion). This was not unexpected, given that 18F-HX4 is used as a hypoxia-marker, whereby the heterogeneous HX4 pattern in tumors is representing the hypoxic heterogeneity within the tumor microenvironment (hypoxic fraction HCT116 = 10-12%, H1299 = 1-7%). A significantly higher tumor-to-blood ratio was observed for the NfsA_Ec overexpressing tumors in both the HCT116 tumor model (4.21 ± 1.71 and 2.34 ± 0.68 for NfsA_Ec and parental tumors respectively; P < 0.001) and the H1299 tumor model (3.52 ± 0.52 and 2.73 ± 0.68 for NfsA_Ec and parental tumors respectively; P = 0.03), providing initial proof-of-principle for the ability to detect NfsA_Ec expression by non-invasive PET imaging.
18F-HX4 microPET establishes in vivo proof-of-principle. A) Reconstruction of representative PET images two hours after tracer injection in HCT116 and H1299 xenografts. Tumours are delineated using a white line. Uptake of 18F-HX4 is higher in NfsA_Ec expressing tumours in comparison to WT. B) Quantification of tumour:blood ratios of the different experimental groups.
Discussion
Non-invasive reporter gene imaging has the potential to expedite clinical development in a variety of therapeutic settings, given recent progress in the use of biomarkers and companion diagnostics for drug development and treatment monitoring [46-48]. For example, extensive invasive biopsy and blood sampling was used to monitor virus replication and transgene expression in Phase II clinical trials of Reolysin and Pexa-vec [49, 50]. However, it is recognized that these methods are labor intensive and can be logistically and ethically challenging. In contexts such as these, the inclusion of a reporter gene that can metabolize and trap a PET imaging agent for non-invasive imaging of gene expression as a surrogate of vector deposition and spread may offer significant advantages. By screening and biochemically characterizing a collection of eleven E. coli nitroreductase candidates for activity with 2-NI substrates that have demonstrated clinical utility as hypoxia PET probes, NfsA_Ec was identified in this study as a possible candidate for radionuclide-based reporter gene imaging.
EF5 was initially selected for further evaluation in combination with NfsA_Ec as availability of a fluorescent antibody allowed for quantitative assessment of adduct detection. As standard hypoxic activation of EF5 will inevitably occur simultaneously with NfsA_Ec activation, it was important to demonstrate that that retention of EF5 adducts in NfsA_Ec positive cells was superior to retention in WT anoxic cells (Figure 2). Even in cases where cells were engineered for high-level overexpression of POR, a known EF5 reductase [51], these cells were still 4-fold less fluorescent than NfsA_Ec expressing cells. Notably there was no increase in fluorescence in anoxic NfsA_Ec cells compared to oxic NfsA_Ec cells, consistent with a high relative contribution of oxygen-insensitive NfsA_Ec metabolism versus that of human one-electron reduction.
A linear relationship is required if PET probe retention (and therefore NfsA_Ec activity) is to be used to quantify reporter gene expression non-invasively. It has previously been demonstrated that inefficient penetration of drugs into tissue-like structures can occur due to rapid metabolic consumption [52]. Since NfsA_Ec was a demonstrably efficient metabolizer of EF5 (Figure 2B, Supplementary Table 1), the ability of EF5 to penetrate and label high cell density, mixed cell population MCLs was tested (Figure 3A). At this high cell density, a shift towards greater aerobic EF5 labelling in pimonidazole negative (i.e. WT) cells was observed as the percentage of pimonidazole positive (NfsA_Ec expressing) cells in the mixture increased, suggestive of a metabolic activation of EF5 in NfsA_Ec cells and subsequent metabolite distribution into surrounding WT cells. There was also evidence that increased reductive metabolism of EF5 by NfsA_Ec compromised penetration under conditions of excess NfsA_Ec positive cells (> 30%), as seen by the presence of a subset of pimonidazole positive (NfsA_Ec) cells that were not labelled by EF5 within the MCL. MCLs consisting of 100% NfsA_Ec cells showed evidence of a pimonidazole negative population, a phenotype normally associated with cells lacking NfsA_Ec expression. Several factors likely contribute to the decreased rates of EF5 labelling in NfsA_Ec cells with increasing concentrations of NfsA_Ec positive cells in the mixture. One explanation for this finding could be the loss of transgene expression in a proportion of cells. It is also possible that at 200 µmol-hr EF5, a concentration exceeding the EF5 IC50 of 5 µM (ca. 90 µmol-hr with 18 hours of exposure), cells which lie at the periphery of the MCL may no longer be viable at the time of pimonidazole labelling, or may show a marked reduction in metabolic capability owing to EF5 adduct toxicity (Figure 3C). Despite the caveats of the method described above, a positive linear correlation between the percentage of NfsA_Ec cells present in the MCL and the mean EF5 fluorescence for all cell populations was observed (Figure 3B).
Tumor xenograft data suggested that the large metabolic advantage of NfsA_Ec metabolism that was observed in vitro was also apparent in vivo. Using xenografts with an NfsA_Ec proportion ≤ 20% there was no apparent evidence of excessive EF5 consumption or marked penetration problems (Figure 4). Consistent with this interpretation, xenografts with up to 30% NfsA_Ec-positive cell populations displayed linearity with respect to median EF5 signal intensity (Figure 5A). When applied in a GDEPT setting, a 21% level of NfsA_Ec expressing cells in a tumor xenograft achieved significant clinical efficacy with PR-104, and the quantum of EF5 signal in vivo (and therefore proportion of NfsA_Ec positive cells) was also shown to predict the amount of cell kill achieved with PR-104 (Figure 5B).
A therapeutic enzyme such as NfsA_Ec that can coordinately metabolize PET imaging agents and bioreductive prodrugs in a GDEPT context may potentially be applied to a wide variety of different vector platforms. The cofactor (NAD(P)H) dependence of NfsA_Ec will limit activity to intact cells, possibly restricting the ability to image transgene expression in potent viral systems where accelerated lysis occurs. Imaging would only be biologically functional for a brief period during the active life cycle of the virus, and may not be entirely predictive of total intra-tumor viral titer. For example, differentiation between an inactive virus yielding minimal NTR activity and an active virus exhibiting rapid propagation and cell lysis may not be possible. Alternatively, monitoring of the active viral life cycle with exogenous substrates may instead confer an accurate measure of real-time viral behavior, as opposed to a method that determines cumulative lytic burden. This would not be a problem for bacterial vectors such as Clostridium species, which germinate and metabolize autonomously and do not cause cell lysis [53], making nfsA_Ec a particularly attractive transgene for gene therapy approaches using this vector platform. Elsewhere, we have reported that an NfsA_Ec variant engineered for improved metabolism of PR-104A appeared more effective in a bacterial rather than human cell environment [54], which would also support the use of bacterial vectors. Species of bacteria have previously been detected in tumors using microPET, where there was a linear correlation between the number of viable bacteria in the tumor and accumulation of the PET tracer [55, 56]. This indicates that using a PET imaging approach to non-invasively image colonized tumors is possible, however further in vivo testing using the appropriate vector platform will be required for future development of this technology in a GDEPT context.
Immune responses against transduced cells could represent a major obstacle to the success of reporter gene imaging. Cellular and humoral responses to reporter gene derived proteins can result in clearance of transduced cells, abrogating the possibility for repeated non-invasive imaging [57]. The major strategy to circumvent this issue is to induce immunologic tolerance to these new antigens, usually by immunosuppression, the use of different routes of administration or optimization of the gene promoter [57, 58]. Nevertheless, in the context of cancer gene therapy or GDEPT applications perhaps a pro-inflammatory response in the tumor microenvironment could be of short term benefit, providing an influx of immune cells and the possibility of an anti-tumor immune response [59].
Although NfsA_Ec demonstrates activity with all of the agents (listed in Table 3), particularly EF5, 18F-EF5 faces significant commercial development challenges due to the requirement for 18F2 gas for radiolabeling by electrophilic fluorination [60]. Most clinical imaging sites routinely utilize the nucleophilic substitution method for routine radiolabeling of 18F-FDG [61]. Thus, it is likely that successful development of NfsA_Ec based PET imaging will involve probes that can be radiolabeled in the same manner as 18F-FDG, for example 18F-HX4 [62]. We therefore selected 18F-HX4 to exemplify the preclinical proof-of-principle, particularly as it has other desirable properties (e.g. faster clearance from normal tissues) relative to other radiolabeled 2-NI PET probes such as F-miso [27, 31, 63]. Successful 18F-HX4 microPET imaging of NfsA_Ec expressing tumors indicated that NfsA_Ec-mediated metabolism of 2-NI probes has the potential for non-invasive monitoring of NfsA_Ec by using the clinically relevant PET imaging tool. However, background hypoxic signal will always be a confounding issue with the use of 2-NIs in this context. Mitigation for this could include the selection of non-hypoxic individual tumors, carbogen breathing to suppress hypoxic signal, and pre/post imaging correction strategies. We are currently developing novel NTR-selective 2-NI probe analogues to overcome this limitation by virtue of being refractory to hypoxic metabolism [64].
Materials and Methods
Preparation and storage of chemicals
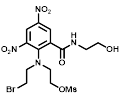
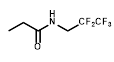
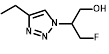
For in vitro studies, PR-104A was synthesized, purified and stored as previously reported [65, 66]. Pimonidazole (Hypoxyprobe-1, Chemicon International), HX4 (synthesized at the ACSRC using published methods [67]), F-Misonidazole (ABX Company, Germany), RSU-1069 and RB6145 (synthesized at the ACSRC using published methods [68]), EF5 and EF3 (generous gifts from Professor Cameron Koch, University of Pennsylvania) were either dissolved in DMSO and stored at -80 °C or dissolved in α-MEM immediately prior to commencing the experiment. For in vivo studies, PR-104 (PR-104 sodium salt lyophilized with mannitol) was supplied by Proacta Inc., and reconstituted in 2 mL water before dilution in PBS. EF5 was dissolved in phosphate buffered saline, and pimonidazole was dissolved in saline. The 18F-HX4 PET tracer was delivered from the VU University Medical Center Amsterdam, the Netherlands and synthesized as previously described [43]. Radiochemical purity was higher than 95% and specific activity was 32.8 ± 0.79 GBq/µmol.
E. coli SOS, NADPH depletion, and IC50 assays
SOS assays were performed as previously described using the strain SOS-R2 [35]. Briefly, test enzyme over-expression was induced and exponential growth phase bacteria were exposed to either 0 µM, 2 µM or 4 µM RB6145 for four hours prior to quantification of the SOS response induction by β-galactosidase assay. Data were calculated as fold induction of Miller units recorded for the drug exposed cultures relative to the unchallenged replicates. NADPH consumption assays were performed by nitroblue tetrazolium/phenazine methosulphate (NBT/PMS) assay as previously described [34]. E. coli IC50 assays were performed in SOS-R2 host cells as previously described [35], with the substitution of CB1954 from that study with a two-fold dilution series of each 2-NI test compound. IC50 values were calculated as the 2-NI concentration required to reduce the turbidity of a nitroreductase expressing culture to 50% that of an unchallenged control, using GraphPad Prism 6 (GraphPad Software Inc. La Jolla, CA, USA).
Protein purification and steady state kinetics
Recombinant His6-tagged NTRs were purified post-expression from plasmid pET28a(+) by nickel-affinity chromatography (Novagen, Merck, Darmstadt, Germany). FMN cofactors (or FAD in the case of MdaB) were reconstituted and proteins were desalted, quantified, assessed for purity and stored as previously described [34]. The molar extinction coefficient was determined for each 2-NI substrate at 340 nm, accounting for the oxidation of two moles of NDAPH oxidized per mole of 2-NI substrate converted to hydroxylamine. For this, 100 µM of 2-NI was incubated with 300 µM NADPH and excess purified NfsA_Ec for 30 minutes, with the low-level intrinsic NADPH oxidase activity of NfsA_Ec ensuring the complete oxidation of all NADPH remaining in the cuvette within the timeframe of the experiment. On this basis the 340 nm extinction coefficients (M-1 cm-1) for each 2-NI test compound were calculated as EF5, 19 000; EF3, 19 100; F-Miso, 18 900; pimonidazole, 18 600; RB6145, 19 500; HX4, 19 000. Steady-state enzyme kinetics for purified nitroreductase candidates were assessed as previously described [34] over a 2-NI concentration range of 6.25-1200 µM.
Cell lines and candidate gene expression
HCT116 WT and H1299 WT cells were purchased from the ATCC (Manassas, VA, USA). HCT116 cell lines over-expressing POR and the E. coli nitroreductases had been previously generated and validated for candidate gene expression [34, 35, 69], in addition to the H1299 cell line over-expressing NfsA_Ec [54] (Figure S1). Cell cultures were re-established from STR-authenticated frozen stocks every 3 months and were confirmed to be mycoplasma free by PCR enzyme-linked immunosorbent assay (ELISA) (Roche Diagnostics Corp, Basel, Switzerland). Cell lines were cultured in α-MEM using a humidified incubator (37 °C, 5% CO2) as previously described [70, 71] for a maximum of 12 weeks. Harvested cells were counted using an electronic particle counter (Z2 Coulter Particle Analyzer, Beckman Coulter, Florida, USA).
Anti-proliferative (IC50) tumor cell assay
The anti-proliferative IC50 was determined as the concentration of prodrug required for 50% inhibition of cell growth, following an 18 hour drug exposure and five days regrowth in the absence of drug. Assays were performed under oxic conditions as described previously [70, 72].
14C covalent binding assay
The 14C-EF5 binding assay was performed as described previously [51]. In brief, 1x10⁵ cells/well of a 96-well plate were incubated with 2 mM 14C-EF5 under oxic or anoxic conditions for 4 h. Reduced and bound 14C-EF5 adducts were measured in the trichloroacetic acid fixed cell pellets using a scintillation counter.
3D multicellular layer assay
Multicellular layers (MCLs) were grown and assays performed as previously reported [71]. MCLs were exposed to drug for five hours and flushed continuously during drug exposure with 5% CO2/95% O2 gas to minimize hypoxia and therefore drug activation by endogenous one electron reductases [52]. MCL inserts were then dissociated with trypsin, counted, and resuspended in fresh media for use in further experiments.
Flow cytometry
Following treatment (either in vitro culture or ex vivo cells following enzymatic dissociation), 1x10⁶ cells were fixed with 4% (w/v) paraformaldehyde (pH 7.4) in PBS for one hour at room temperature. Cells were permeabilized in 0.2% (v/v) Triton X-100 in PBS for 30 minutes at room temperature, before blocking in 10% BSA (w/v) in PBS for 30 minutes at room temperature. Cells were then suspended in primary antibody diluted in 1% BSA (w/v) in PBS for 2 hours at 37 °C (anti-EF5 mouse monoclonal conjugated with Alexa-488 or Cy5 and diluted to 100 μg/mL, a gift from Professor Cameron Koch, University of Pennsylvania, or Hypoxyprobe-1 mouse monoclonal (anti-pimonidazole, Chemicon International) conjugated with FITC and diluted 1:100). Cells were washed 3 times in 1% BSA (w/v) in PBS to remove antibody and resuspended in a final volume of 500 μL. Single cells were then analyzed on a Becton Dickinson FACscan flow cytometer.
Immunohistochemistry
In vitro: 1x10⁶ cells were fixed with 4% (w/v) paraformaldehyde (pH 7.4) in PBS for one hour at room temperature. Cells were permeabilized in 0.2% (v/v) Triton X-100 in PBS for 30 minutes at room temperature, before blocking in 10% BSA (w/v) in PBS for 30 minutes at room temperature. Cells were then suspended in primary antibody diluted in 1% BSA (w/v) in PBS for 2 hours at 37 °C (anti-EF5 mouse monoclonal conjugated with Alexa-488 or Cy5 and diluted to 100 μg/mL, a gift from Professor Cameron Koch, University of Pennsylvania, or Hypoxyprobe-1 mouse monoclonal (anti-pimonidazole, Chemicon International) conjugated with FITC and diluted 1:100). Cells were washed 3 times in 1% BSA (w/v) in PBS to remove antibody and four drops of cell suspension was then added to a cytospin chamber containing a poly-L-lysine coated slide and centrifuged for 5 minutes at low acceleration in a cytospinner (Shandon Cytospin 2). Cells were left to dry for 30 minutes then mounted with a coverslip using Prolong Gold anti-fade reagent (Invitrogen, USA) and sealed with nail polish.
In vivo: NIH-III mice were treated with 120 mg/kg EF5 24 hours prior to tumor excision. Tumors were excised, cut in half and fixed in 10% (v/v) formalin in PBS for 48 hours, before being transferred to 70% (v/v) ethanol and embedded in paraffin. Sections (5 μM) were cut and mounted onto poly-L-lysine coated slides, before being heat fixed for one hour at 60 °C. Sections were then de-waxed, rehydrated, washed in MilliQ water, and rinsed in 0.01 M Tris buffered saline (TBS, pH 7.4). Antigen retrieval was achieved by boiling samples in 10 mM sodium citrate buffer (pH 6) for 25 minutes. Sections were washed with TBS containing 0.1% (v/v) Tween-20 (TBS-T) and blocked with 1% mouse serum in TBS. After rinsing, samples were incubated for two hours at room temperature with 100 μg/mL anti-EF5 primary antibody (Alexa-488 conjugated) diluted in PBS containing 0.2% (v/v) Tween-20. After rinsing in TBS-T coverslips were mounted with Prolong Gold anti-fade reagent (Invitrogen, USA) and sealed with nail polish. Following completion of fluorescent imaging, coverslips were removed and the sections were stained with hematoxylin and eosin. Slides were viewed on an inverted fluorescent microscope (Eclipse TE-2000E, Nikon, Japan) and images were analyzed using Adobe Photoshop software (Adobe Photoshop 4.0).
Animal husbandry
All tumor excision assay and growth delay experiments were performed in accordance with local institutional guidelines for animal welfare and were approved by the Animal Ethical Committee of the University of Auckland. Specific pathogen-free homozygous NIH-III (NIH-Lystbg Foxn1nu Btkxid) nude mice were obtained from Charles River Laboratories (Wilmington, MA, USA) and bred in Vernon Jansen Unit (University of Auckland). They were supplied at 7-9 weeks of age. Mice were housed in groups of ≤ 6 in Techniplast microisolator cages with a 12 hour light/dark cycle, and were fed a standard rodent diet (Harlan Teklad diet 2018i) and water ad libitum. All animals were uniquely identifiable by ear tag number and weighed 18 to 25 g at the time of the experiment.
Tumor excision assay
Tumors were inoculated onto the lateral flank of NIH-III nude mice by subcutaneous injection of 107 cells. Tumor-bearing mice were randomized to treatment groups when tumors reached treatment size (10-12 mm diameter) and administered a single dose of drug (PR-104 = 562 µmol/kg, EF5 = 30 mg/kg) by intraperitoneal injection. After the appropriate exposure time, tumors were excised and homogenized using sterile scissors and an enzyme mix (2.5 mg/mL pronase, 1 mg/mL collagenase and 0.2 mg/mL DNAase in αMEM containing 10% (v/v) fetal bovine serum and 1% (v/v) penicillin/streptomycin). Tumor samples were incubated at 37 °C on a magnetic stirrer, before part of the suspension was collected and resuspended in fresh α-MEM for counting. Serial dilutions of 105-102 cells were plated on 60 mm dishes in triplicate, and grown for 10 days before staining with methylene blue (2 g/L in 50% aqueous alcohol). Colonies containing > 50 cells were counted as clonogenic survivors. Plating efficiency and log cell kill relative to untreated controls was then calculated.
Tumor growth delay
Tumor-bearing mice were randomized to treatment groups when tumors reached treatment size (300-350 mm3) and injected with a single intraperitoneal dose of PR-104 (1000 µmol/kg) or vehicle. Tumor size and body weights were measured 2-3 times per week. Tumor volume was calculated as L x w2 x π/6 where L is the major axis and w is the perpendicular minor axis. Animals were culled when the tumor volume had increased four-fold relative to pre-treatment volume (RTV4, survival endpoint) or if body weight loss exceeded 20% of the pre-treatment value. Kaplan Meier plots were constructed to calculate median time to endpoint. Treatment efficacy was assessed by comparing the median survival time with untreated animals using the Log-rank test P-test (Sigmaplot version 14.0).
PET imaging and analysis
All PET experiments were in accordance with local institutional guidelines for animal welfare and were approved by the Animal Ethical Committee of Maastricht University (2012-102). Exponentially growing human colorectal (HCT116) or lung (H1299) carcinoma cells (5 × 10⁶) with or without NfsA_Ec overexpression were resuspended in 50 µl Basement Membrane Matrix (MatrigelTM BD Biosciences) and inoculated subcutaneously into the lateral flank of NIH-III nude mice (age 8 weeks). Tumors were measured using a Vernier Caliper in three orthogonal tumor diameters (A, B and C), each corrected for the thickness of the skin, and tumor volumes were calculated based on the formula A × B × C × π/6. Animals were injected with 18F-HX4 (3.15 ± 1.30 MBq) via the lateral tail vein at a tumor volume of 525 ± 296 mm³. This is a diagnostic amount of probe (100 µCi), as previously described [73-75]. Isoflurane inhalation anesthesia (2.5% isoflurane in pressured air at a flow rate of 3 L/min) was used during all animal experiments.
PET imaging was performed on a Focus 120 MicroPET (Concorde Microsystems Inc., Knoxville) with an axial field of view of 7.6 cm and a resolution of approximately 1.4 mm. A 10-min emission scan was performed on 2 hours post tracer injection with correction for random counts, dead time and decay. Data were acquired using three-dimensional list-mode settings using an energy window of 350-750 keV and a coincidence window of 6 ns. After sinogramming, data were reconstructed iteratively using 3D-OSEM (Fourier rebinning, 16 subsets, 10 iterations and 5 EM iterations, Gaussian smooth 1.73 mm). Images were visualized with ASIPro VM software (version 6.3.3.0; Concorde Microsystems Inc., Knoxville, TN). For each data set, three-dimensional regions of interest (3D-ROIs) were manually drawn over the heart outflow area (representing blood pool) and tumors. Maximum activity data (in Bq/ml) of the voxels, corrected for 18F decay towards injection, within the ROIs were obtained and tumor-to-blood uptake ratios were calculated.
Statistical analysis
Statistical analyses were performed using Sigmaplot version 11.0 (Systat Software) or GraphPad Prism versions 5.02 and 5.03 for Windows (GraphPad Software, 2009). For all tests, P < 0.05 was considered significant.
Abbreviations
FDA: U.S. food and drug administration; GDEPT: gene-directed enzyme-prodrug therapy; GCV: ganciclovir; hNIS: human sodium iodide symporter; HSV1-tk: herpes simplex virus 1 thymidine kinase; MCL: multicellular layer; 2-NI: 2-nitroimidazole; NTR: nitroreductase; PET: positron emission tomography; 3D: three dimensions; TGD: tumor growth delay; WT: wild type.
Supplementary Material
Supplementary figures and tables.
Acknowledgements
This work was funded by the Health Research Council of New Zealand (Grants 11/1103 and 14/289), the Cancer Society of New Zealand (Grant 07-01), the ZonMW TGO program (Grant 43400009), and by Doctoral scholarships from the University of Auckland (awarded to AMM), the Maurice Wilkins Centre (awarded to SPS), and the Tertiary Education Commission Top Achiever Doctoral program (awarded to EMW). Salary support from the Cancer Society Auckland Northland (JBS, AVP) is also gratefully acknowledged.
Authors' contributions
AMM, JNC, SPS, LJD, PL, DFA, JBS, JT and AVP conceived and designed the experiments; AMM, JNC, SPS, LJD, JW, NGL, RB, MRA, EMW and JT performed the experiments, AMM, JNC, SPS, LJD, CPG, DFA, JBS, JT and AVP analyzed the data; LJD, JNC, AA, DFA, JBS, JT and AVP contributed reagents/materials/analysis tools; AMM, LJD, CPG, DFA, JBS, JT and AVP wrote the paper.
Competing Interests
The authors have declared that no competing interest exists.
References
1. Serganova I, Blasberg RG. Molecular Imaging with Reporter Genes: Has Its Promise Been Delivered? J Nuc Med. 2019;60:1665-81
2. Serganova I, Blasberg R. Reporter gene imaging: potential impact on therapy. Nucl Med Biol. 2005;32:763-80
3. Tangney M. Editorial: in vivo imaging & gene therapy. Curr Gene Ther. 2012;12:1
4. Brader P, Serganova I, Blasberg RG. Noninvasive molecular imaging using reporter genes. J Nucl Med. 2013;54:167-72
5. Tsien RY. The green fluorescent protein. Annu Rev Biochem. 1998;67:509-44
6. Contag CH, Spilman SD, Contag PR, Oshiro M, Eames B, Dennery P. et al. Visualizing Gene Expression in Living Mammals Using a Bioluminescent Reporter. Photochem and Photobiol. 1997;66:523-31
7. Gambhir SS. Molecular imaging of cancer with positron emission tomography. Nat Rev Cancer. 2002;2:683-93
8. Yaghoubi SS, Campbell DO, Radu CG, Czernin J. Positron Emission Tomography Reporter Genes and Reporter Probes: Gene and Cell Therapy Applications. Theranostics. 2012;2:374-91
9. Tjuvajev JG, Stockhammer G, Desai R, Uehara H, Watanabe K, Gansbacher B. et al. Imaging the expression of transfected genes in vivo. Cancer Res. 1995;55:6126-32
10. Kuruppu D, Brownell AL, Zhu A, Yu M, Wang X, Kulu Y. et al. Positron emission tomography of herpes simplex virus 1 oncolysis. Cancer Res. 2007 67
11. Bhaumik S. Advances in imaging gene-directed enzyme prodrug therapy. Curr Pharm Biotechno. 2011;12:497-507
12. Yaghoubi SS, Couto MA, Chen CC, Polavaram L, Cui G, Sen L. et al. Preclinical safety evaluation of 18F-FHBG: a PET reporter probe for imaging herpes simplex vrius type 1 thymidine kinase (HSV1-tk) or mutant HSV1-sr39tk's expression. J Nucl Med. 2006;47:706-15
13. Miyagawa M, Anton M, Wagner B, Haubner R, Souvatzoglou M, Gansbacher B. et al. Non-invasive imaging of cardiac transgene expression with PET: comparison of the human sodium/iodide symporter gene and HSV1-tk as the reporter gene. Eur J Nucl Med Mol I. 2005;11:1108-14
14. Msaouel P, Dispenzieri A, Galanis E. Clinical testing of engineered oncolytic measles virus strains in the treatment of cancer: an overview. Curr Opin Mol Ther. 2009;11:43-53
15. Barton KN, Stricker H, Brown SL, Elshaikh M, Aref I, Lu M. et al. Phase I study of noninvasive imaging of adenovirus-mediated gene expression in the human prostate. Mol Ther. 2008;16:1761-9
16. Ahn B. Sodium iodide symporter for nuclear molecular imaging and gene therapy: from bedside to bench and back. Theranostics. 2012;2:392-402
17. Rajecki M, Sarparanta M, Hakkarainen T, Tenhunen M, Diaconu I, Kuhmonen V. et al. SPECT/CT imaging of hNIS-expression after intravenous delivery of an oncolytic adenovirus and 131I. PloS one. 2012;7:e32871-e
18. Williams EM, Little RF, Mowday AM, Rich MH, Chan-Hyams JVE, Copp JN. et al. Nitroreductase gene-directed enzyme prodrug therapy: insights and advances toward clinical utility. Biochem J. 2015 471
19. Liu SC, Ahn GO, Kioi M, Dorie MJ, Patterson AV, Brown JM. Optimized clostridium-directed enzyme prodrug therapy improves the antitumor activity of the novel DNA cross-linking agent PR-104. Cancer Res. 2008;68:7995-8003
20. Heap JT, Theys J, Ehsaan M, Kubiak AM, Dubois L, Paesmans K. et al. Spores of Clostridium engineered for clinical efficacy and safety cause regression and cure of tumours in vivo. Oncotarget. 2014;5:1761-9
21. Singleton DC, Li D, Bai SY, Syddall SP, Smaill JB, Shen Y. et al. The nitroreductase prodrug SN 28343 enhances the potency of systemically administered armed oncolytic adenovirus ONYX-411(NTR). Cancer Gene Ther. 2007;14:953-67
22. Pisharath H, Parsons MJ. Nitroreductase-mediated cell ablation in transgenic zebrafish embryos. Methods Mol Biol. 2009;546:133-43
23. Mathias JR, Zhang Z, Saxena MT, Mumm JS. Enhanced cell-specific ablation in zebrafish using a triple mutant of Escherichia coli nitroreductase. Zebrafish. 2014;11:85-97
24. Kwak SP, Malberg JE, Howland DS, Cheng K-Y, Su J, She Y. et al. Ablation of central nervous system progenitor cells in transgenic rats using bacterial nitroreductase system. J Neurosci Res. 2007;85:1183-93
25. Yang D, Tian HY, Zang TN, Li M, Zhou Y, Zhang JF. Hypoxia imaging in cells and tumor tissues using a highly selective fluorescent nitroreductase probe. Sci Rep. 2017;7:9174
26. Zhou L, Gong L, Hu S. Construction of an efficient two-photon fluorescent probe for imagin nitroreductase in live cells and tissues. Spectrochim Acta A. 2018;199:254-9
27. Peeters SG, Zegers CM, Lieuwes NG, van Elmpt W, Eriksson J, van Dongen GA. et al. A comparative study of the hypoxia PET tracers [18F]HX4, [18F]FAZA and [18F]FMISO in a preclinical tumour model. Int J Radiat Oncol Biol Phys. 2015;91:351-9
28. Vera P, Thureau S, Chaumet-Riffaud P, Modzelewski R, Bohn P, Vermandel M. et al. Phase II Study of a Radiotherapy Total Dose Increase in Hypoxic Lesions Identified by 18F-Misonidazole PET/CT in Patients with Non-Small Cell Lung Carcinoma (RTEP5 Study). J Nucl Med. 2017;58:1045-53
29. Silvoniemi A, Suilamo S, Laitinen T, Forsback S, Lottyniemi E, Vaittinen S. et al. Repeatability of tumour hypoxia imaging using [18F]EF5 PET/CT in head and neck cancer. Eur J Nucl Med Mol I. 2018;45:161-9
30. Mahy P, Geets X, Lonneux M, Levque P, Christian N, De Bast M. et al. Determination of tumour hypoxia with [18F]EF3 in patients with head and neck tumours: a phase I study to assess the tracer pharmacokinetics, biodistribution and metabolism. Eur J Nucl Med Mol I. 2008;35:1282-9
31. van Loon J, Janssen MHM, Ollers M, Aerts HJWL, Dubois L, Hochstenbag M. et al. PET imaging of hypoxia using [18F]HX4: a phase I trial. Eur J Nucl Med Mol I. 2010;37:1663-8
32. Nunn A, Linder K, Strauss HW. Nitroimidazoles and imaging hypoxia. Eur J Nucl Med. 1995;22:265-80
33. Anlezark GM, Melton RG, Sherwood RF, Wilson WR, Denny WA, Palmer BD. et al. Bioacitvation of dinitrobenzamide mustards by an E. coli B nitroreductase. Biochem Pharmacol. 1995;50:609-18
34. Prosser GA, Copp JN, Syddall SP, Williams EM, Smaill JB, Wilson WR. et al. Discovery and evaluation of Eschericia coli nitroreductases that activate the anticancer prodrug CB 1954. Biochem Pharmacol. 2010;79:678-87
35. Prosser GA, Copp JN, Mowday AM, Guise CP, Syddall SP, Williams EM. et al. Creation and screening of a multi-family bacterial oxidoreductase library to discover novel nitroreductases that efficiently activate the bioreductive prodrugs CB 1954 and PR-104A. Biochem Pharmacol. 2013;85:1091-103
36. Ahmed I, Jenkins TC, Walling JM, Stratford IJ, Sheldon PW, Adams GE. et al. Analogues of RSU-1069: radiosensitisation and toxicity in vitro and in vivo. Int J Radiat Oncol Biol Phys. 1986;12:1079-81
37. Koch CJ. Importance of Antibody Concentration in the Assessment of Cellular Hypoxia by Flow Cytometry: EF5 and Pimonidazole. Radiat Res. 2008;169:677-88
38. Guise CP, Wang AT, Theil A, Bridewell DJ, Wilson WR, Patterson AV. Identification of human reductases that activate the dinitrobenzamide mustard prodrug PR-104A: A role for NADPH:cytochrome P450 oxidoreductase under hypoxia. Biochem Pharmacol. 2007;74:810-20
39. Hunter FW, Young RJ, Shalev Z, Vellanki RN, Wang J, Gu Y. et al. Identification of P450 Oxidoreductase as a Major Determinant of Sensitivity to Hypoxia-Activated Prodrugs. Cancer Res. 2015;75:4211-23
40. Hicks KO, Pruijn FB, Secomb TW, Hay MP, Hsu R, Brown JM. et al. Use of three-dimensional tissue cultures to model extravascular transport and predict in vivo activity of hypoxia-targeted anticancer drugs. J Natl Cancer I. 2006;98:1118-28
41. Pruijn FB, Patel K, Hay MP, Wilson WR, Hicks KO. Prediction of tumour tissue diffusion coefficients of hypoxia-activated prdrugs from physiochemical parameters. Aust J Chem. 2008;61:687-93
42. Guise CP, Abbattista MR, Singleton RS, Holford SD, Connolly J, Dachs GU. et al. The bioreductive prodrug PR-104A is activated under aerobic conditions by human aldo-keto reductase 1C3. Cancer Res. 2010;70:1573-84
43. Dubois LJ, Lieuwes NG, Janssen MH, Peeters WJ, Windhorst AD, Walsh JC. et al. Preclinical evaluation and validation of [18F]HX4, a promising hypoxia marker for PET imaging. P Natl Acad Sci USA. 2011;108:14620-5
44. Zegers CML, van Elmpt W, Reyman B, Even AJG, Troost EGC, Ollers MC. et al. In vivo Quantification of Hypoxic and Metabolic Status of NSCLC Tumors Using [18F]HX4 and [18F]FDG-PET/CT Imaging. Clin Cancer Res. 2014;20:6389-97
45. Dubois L, Landuyt W, Cloetens L, Bol A, Bormans G, Haustermans K. et al. [18F]EF3 is not superior to [18F]FMISO for PET-based hypoxia evaluation as measured in a rat rhabdomyosarcoma tumour model. Eur J Nucl Med Mol I. 2009;36:209-18
46. Lavezzari G, Womack AW. Industry perspectives on biomarker qualification. Clin Pharmacol Ther. 2016;99:208-13
47. Hu C, Dignam JJ. Biomarker-Driven Oncology Clinical Trials: Key Design Elements, Types, Features, and Practical Considerations. JCO Precis Oncol. 2019:1-12
48. Yu C, Bashaw ED. Regulatory perspective of biomarker bioanalysis during drug development. Bioanalysis. 2019;11:607-10
49. Heo J, Reid T, Ruo L, Breitbach CJ, Rose S, Bloomston M. et al. Randomized dose-finding clinical trial of oncolytic immunotherapeutic vaccinia JX-594 in liver cancer. Nat Med. 2013;19:329-36
50. Galanis E, Markovic SN, Suman VJ, Nuovo GJ, Vile RG, Kottke TJ. et al. Phase II trial of intravenous administration of Reolysin (Reovirus serotype-3-dearing strain) in patients with metastatic melanoma. Mol Ther. 2012;20:1998-2003
51. Wang J, Foehrenbacher A, Su J, Patel R, Hay MP, Hicks KO. et al. The 2-nitroimidazole EF5 is a biomarker for oxidoreductases that activate the bioreductive prodrug CEN-209 under hypoxia. Clin Cancer Res. 2012;18:1684-95
52. Hicks KO, Fleming Y, Siim BG, Koch CJ, Wilson WR. Extravascular diffusion of tirapazamine: effect of metabolic consumption assessed using the multicellular layer model. Int J Radiat Oncol Biol Phys. 1998;42:641-9
53. Mowday AM, Guise CP, Ackerley DF, Minton NP, Lambin P, Dubois L. et al. Advancing Clostridia to clinical trial: past lessons and recent progress. Cancers. 2016;8:63-76
54. Copp JN, Mowday AM, Williams EM, Guise CP, Ashoorzadeh A, Sharrock AV. et al. Engineering a multifunctional nitroreductase for improved activation of prodrugs and PET probes for cancer gene therapy. Cell Chem Biol. 2017;24:391-403
55. Brader P, Stritzker J, Riedl CC, Zanzonico P, Cai S, Burnazi EM. et al. Escherichia coli Nissle 1917 facilitates tumor detection by positron emission tomography and optical imaging. Clin Cancer Res. 2008;14:2295-302
56. Soghomonyan SA, Doubrovin M, Pike J, Luo X, Ittensohn M, Runyan JD. et al. Positron emission tomography (PET) imaging of tumor-localized Salmonella expressing HSV1-TK. Cancer Gene Ther. 2005;12:101-8
57. Zhou H-s, Liu D-p, Liang C-c. Challenges and strategies: The immune responses in gene therapy. Med Res Rev. 2004;24:748-61
58. Ciancio G, Burke GW, Miller J. Current treatment practice in immunosuppression. Expert Opin Pharmacother. 2000;1:1307-30
59. Cook KW, Durrant LG, Brentville VA. Current Strategies to Enhance Anti-Tumour Immunity. Biomedicines. 2018;6:37
60. Dolbier WR Jr, Li AR, Koch CJ, Shiue CY, Kachur AV. [18F]-EF5, a marker for PET detection of hypoxia: synthesis of precursor and a new fluorination procedure. Appl Radiat Isot. 2001;54:73-80
61. Yu S. Review of F-FDG Synthesis and Quality Control. Biomed Imaging Interv J. 2006;2:e57-e
62. Turton DR, Betts HM, Dutton D, Perkins AC. Automated radiosynthesis of GMP quality [18F]HX4 for PET imaging of hypoxia. Nucl Med and Biol. 2015;42:494-8
63. Verwer EE, Zegers CML, van Elmpt W, Wierts R, Windhorst AD, Mottaghy FM. et al. Pharmacokinetic modeling of a novel hypoxia PET tracer [(18)F]HX4 in patients with non-small cell lung cancer. EJNMMI Phys. 2016;3:30
64. Williams EM, Rich MH, Mowday AM, Ashoorzadeh A, Copp JN, Guise CP. et al. Engineering Escherichia coli NfsB To Activate a Hypoxia-Resistant Analogue of the PET Probe EF5 To Enable Non-Invasive Imaging during Enzyme Prodrug Therapy. Biochemistry. 2019;58:3700-10
65. Atwell GJ, Denny WA. Synthesis of 3H and 2H4-labelled versions of the hypoxia-activated pre-prodrug 2-[(2-bromoethyl)-2,4-dinitro-6-[[[2-(phosphonooxy)ethyl]amino]carbonyl]anilino]ethyl methanesulfonate (PR-104). J Labelled Compd Rad. 2007;50:7-12
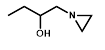
66. Yang S, Atwell GJ, Denny WA. Synthesis of asymmetric halomesylate mustards with aziridineethanol/alkali metal halides: application to an improved synthesis of the hypoxia prodrug PR-104. Tetrahedron. 2007;63:5470-6
67. Kolb HC, Walsh JC, Gadharmath UB, Karimi F, Padgett HC, Kasi D. et al. Nitroimidazole hypoxia imaging agents. International Patent. 2008 WO2008124651A2
68. Jenkins TC, Naylor MA, O'Neill P, Threadgill MD, Cole S, Stratford IJ. et al. Synthesis and evaluation of alpha-[[(2-haloethyl)amino]methyl]-2- nitro-1H-imidazole-1-ethanols as prodrugs of alpha-[(1-aziridinyl)methyl]-2- nitro-1H-imidazole-1-ethanol (RSU-1069) and its analogues which are radiosensitizers and bioreductively activated cytotoxins. J Med Chem. 1990;33:2603-10
69. Guise CP, Abbattista MR, Tipparaju SR, Lambie NK, Su J, Li D. et al. Diflavin oxidoreductases activate the bioreductive prodrug PR-104A under hypoxia. Mol Pharmacol. 2012;81:31-40
70. Patterson AV, Ferry DM, Edmunds SJ, Gu Y, Singleton RS, Patel K. et al. Mechanism of action and preclinical antitumor activity of the novel hypoxia-activated DNA crosslinking agent PR-104. Clin Cancer Res. 2007;13:3922-32
71. Wilson WR, Hicks KO, Pullen SM, Ferry DM, Helsby NA, Patterson AV. Bystander effects of bioreductive drugs: potential for exploiting pathological tumor hypoxia with dinitrobenzamide mustards. Radiat Res. 2007;167:625-36
72. Helsby NA, Atwell GJ, Yang S. Aziridinyldinitrobenzamides: synthesis and structure-activity relationships for activation by E. coli nitroreductase. J Med Chem. 2004;47:3295-307
73. Aerts HJ, Dubois L, Perk L, Vermaelen P, van Dongen GA, Wouters BG. et al. Disparity between in vivo EGFR expression and 89Zr-labeled cetuximab uptake assessed with PET. J Nucl Med. 2009;50:123-31
74. Sneddon D, Niemans R, Bauwens M, Yaromina A, van Kuijk SJA, Lieuwes NG. et al. Synthesis and in vivo Biological Evaluation of 68Ga-Labeled Carbonic Anhydrase IX Targeting Small Molecules for Positron Emission Tomography. J Med Chem. 2016;59:6431-43
75. Peeters SGJA, Dubois L, Lieuwes NG, Laan D, Mooijer M, Schuit RC. et al. [18F]VM4-037 MicroPET Imaging and Biodistribution of Two In vivo CAIX-Expressing Tumor Models. Mol Imaging Biol. 2015;17:615-9
Author contact
![]() Corresponding author: Auckland Cancer Society Research Centre, The University of Auckland, Private Bag 92019, Auckland, New Zealand. Phone 64-9-3737599, Ext 86941, Fax 64-9-3737577, E-mail a.pattersonac.nz.
Corresponding author: Auckland Cancer Society Research Centre, The University of Auckland, Private Bag 92019, Auckland, New Zealand. Phone 64-9-3737599, Ext 86941, Fax 64-9-3737577, E-mail a.pattersonac.nz.