Impact Factor
- Issue 14; 2026
- Issue 13; 2026
- Issue 12; 2026
- Issue 11; 2026
- Issue 10; 2026
- Volume 16; 2026
- Advance Articles
- Past Issues
- Cover Images
- Cover Suggestion
- Index & Coverage
- Special Issues
Introduction
Methods
Results and Discussion
Conclusions
Abbreviations
Supplementary Material
Acknowledgements
References
International Journal of Biological Sciences
International Journal of Medical Sciences
 Global reach, higher impact

Theranostics 2020; 10(22):10262-10273. doi:10.7150/thno.49047 This issue Cite
Research Paper
An ultrasensitive hybridization chain reaction-amplified CRISPR-Cas12a aptasensor for extracellular vesicle surface protein quantification
Shan Xing1,2#, Zedong Lu1#, Qi Huang1#, Huilan Li1, Yu Wang1, Yanzhen Lai1,3, Yi He1, Min Deng4 ![]() , Wanli Liu1
, Wanli Liu1 ![]()
1. Department of Clinical Laboratory, State Key Laboratory of Oncology in South China, Collaborative Innovation Center for Cancer Medicine, Guangdong Key Laboratory of Nasopharyngeal Carcinoma Diagnosis and Therapy, Sun Yat-sen University Cancer Center, 651 Dongfeng Road East, Guangzhou 510060, P. R. China.
2. School of Biomedical Engineering, Sun Yat-sen University, No. 132 Waihuandong Road, University Town, Guangzhou 510006, PR China.
3. Heyuan People's Hospital, Heyuan, China.
4. Affiliated Cancer Hospital & Institute of Guangzhou Medical University, No.78, Hengzhigang Road, Guangzhou 510095, P. R. China.
#These authors contributed equally to this work.
Received 2020-6-3; Accepted 2020-8-4; Published 2020-8-13
Abstract

Tumor-derived extracellular vesicle (TEV) protein biomarkers facilitate cancer diagnosis and prognostic evaluations. However, the lack of reliable and convenient quantitative methods for evaluating TEV proteins prevents their clinical application.
Methods: Here, based on dual amplification of hybridization chain reaction (HCR) and CRISPR-Cas12a, we developed the apta-HCR-CRISPR assay for direct high-sensitivity detection of TEV proteins. The TEV protein-targeted aptamer was amplified by HCR to produce a long-repeated sequence comprising multiple CRISPR RNA (crRNA) targetable barcodes, and the signals were further amplified by CRISPR-Cas12a collateral cleavage activities, resulting in a fluorescence signal.
Results: The established strategy was verified by detecting the TEV protein markers nucleolin and programmed death ligand 1 (PD-L1). Both achieved limit of detection (LOD) values as low as 102 particles/µL, which is at least 104-fold more sensitive than aptamer-ELISA and 102-fold more sensitive than apta-HCR-ELISA. We directly applied our assay to a clinical analysis of circulating TEVs from 50 µL of serum, revealing potential applications of nucleolin+ TEVs for nasopharyngeal carcinoma cancer (NPC) diagnosis and PD-L1+ TEVs for therapeutic monitoring.
Conclusion: The platform was simple and easy to operate, and this approach should be useful for the highly sensitive and versatile quantification of TEV proteins in clinical samples.
Keywords: Tumor-derived exosomes, CRISPR-Cas12a, Hybridization chain reaction, Aptamer, Fluorescence
Introduction
Extracellular vesicles (EVs) are a heterogeneous class of membrane-bound phospholipid vesicles that are shed by cells into a variety of bodily fluids [1, 2]. The CD9, CD63 and CD81 tetraspanin proteins serve as putative common EV markers and have been routinely applied in the immuno-isolation of circulating EVs [3-7]. Tumor-derived EV (TEV) protein biomarkers are closely associated with the diagnosis, prognosis, progression and immune response of certain cancers [7-12]; however, they are often expressed at extremely low levels and thus require a highly sensitive detection method [13]. Conventional EV detection methods such as ELISA, Western blotting or flow cytometry molecular characterization generally require large amounts of biopsy samples (> 1 mL) for sufficient sensitivity and time-consuming ultracentrifugation for purification and concentration [14, 15]. Despite the improved sensitivity and efficiency, recent developed biosensors, such as the thermophoretic aptasensor [16], nanoplasmonic exosome sensors [17], ExoPCD-chips [18], integrated magnetic-electrochemical exosome sensors [19], and micro-nuclear magnetic resonance [20], often require expensive equipment or sophisticated sensing procedures, creating critical challenges for clinical applications. We previously established a proximity ligation assay-recombinase polymerase amplification (PLA-RPA) transcription-mediated amplification (TMA) assay [21] to detect trace TEV protein directly in serum. This platform is highly sensitive and requires a less complex instrument; however, possible issues limiting its wide clinical application include a high cost, background noise, stringent reaction conditions for RPA and the laborious process of labeling oligonucleotides to antibodies. Therefore, clinically feasible techniques to detect low-abundance EV proteins that are sensitive, easy to operate and cost-effective urgently need to be developed to expand the routine clinical utility of circulating TEVs.
The hybridization chain reaction (HCR) is a simple but robust and efficient isothermal amplifycation process [22, 23]. Due to its enzyme-free reaction nature, HCR is low cost and easy to perform [24]. Moreover, the HCR isothermal amplification technique is a probe amplification technique that does not involve target amplification, effectively reducing cross-contamination from amplicons and false-positive results, which often occur in RPA and PCR [24]. Beyond these properties, HCR has the advantage of structural versatility, enabling DNA to be used as both a recognition molecule (through combination with antibodies or aptamers) and an amplifying transducer for biosensing simultaneously [25]. Given these favorable attributes, the application of HCR as a biosensor has undergone tremendous development during the last few decades [26-28].
Clustered regularly interspaced short palindromic repeats (CRISPR)/Cas12a has recently been demonstrated to cleave the nonspecific single-stranded DNA (ssDNA) reporter induced by Cas-CRISPR RNA (crRNA) target recognition-and-cleavage events [29, 30]. Cas endonuclease activity is activated only when the target DNA has the perfect complementary sequence to the crRNA and is thus highly specific [31-35]. The method is also highly efficient, providing collateral cleavage rates of at least 1250 turnovers/second per target DNA recognition [29]. Coupled with nucleic acid amplification technique, CRISPR/Cas12a enables DNA detection with sensitivity at the attomolar level [29, 36, 37]. Despite the highly efficient signal amplification ability, most of the CRISPR-based sensors reported to date are employed in nucleic acid detection [38-43]. Nucleic acid aptamers obtained by in vitro selection methods [44-47] generalize CRISPR-based sensor application to a wide range of non-nucleic acid targets such as ions and small molecules; however, access to protein detection remains limited [48-50].
Aptamers are a low-cost alternative to antibodies but exhibit comparable excellent affinities and specificities towards target proteins [44-46]. AS1411 (a 26-mer G-rich DNA aptamer) has been widely proven to bind to nucleolin protein with high affinity and has even been assessed in oncology clinical trials [51]. Notably, nucleolin protein is overexpressed on the surfaces of most malignant cells and malignant cell-derived exosomes but not on normal cells [52, 53]. Owing to these two features, we initially set up our model for nucleolin+ TEV detection. Given that circulating EV programmed death ligand 1 (PD-L1) has been reported to be an ideal predictive biomarker for monitoring clinical responses to anti-PD-1/PD-L1 therapy [9] and that an aptamer for this protein has been reported previously [54], we also explored the application of our platform for PD-L1+ TEV detection.
Here, we combined aptamers that specifically bind to protein targets on EVs to transduce the target recognition event signal to DNA effectors, HCR for DNA amplification and the production of multi-repeated CRISPR-targetable DNA units, and CRISPR/Cas12a collateral endonuclease activity for amplification, real-time DNA detection and readable signal outputs to develop an alternative CRISPR Cas12a strategy, termed the apta-HCR-CRISPR assay, to detect nucleolin+ and PD-L1+ TEVs. Based on the concept of apta-HCR-CRISPR, we developed our sensitive, simple, clinically feasible and cost-effective platform as a potential broad biosensing strategy for the detection of EV proteins.
Methods
Chemicals
The oligonucleotides used were synthesized and purified by polyacrylamide gel electrophoresis (PAGE) or HPLC by Sangon Biotechnology Co., Ltd. (Shanghai, China) or Ruibiotech Co. (Guangzhou, China). All of the DNA sequences and modifications are listed in Table S1. Exosome-human isolation reagent (anti-CD63, anti-CD9 and anti-CD81 antibody-conjugated magnetic beads (MBs)) and 10× phosphate-buffered saline (PBS) (0.1 M, pH 7.4) were purchased from Thermo Fisher Scientific (Rockford, IL, USA). Streptavidin-coated MBs were acquired from Roche, Basel, Switzerland. EV-free fetal bovine serum (FBS) was obtained from Suer, Shanghai, China. The EV identification antibodies used were as follows: anti-CD9 (Proteintech, 20597-1-AP, Wuhan, China); anti-CD81 (SAB, 41779-2, College Park, USA); anti-CD63 (Abcam, ab68418, Cambridge, UK); anti-TSG101 (Abcam, ab83) and anti-β-actin (Proteintech, 20536-1-AP). PCR buffer for annealing, T7 RNA polymerase, T7 polymerase buffer, murine RNAse inhibitor, and nucleotide triphosphates (NTPs) used to obtain crRNA and NEBuffer 2.1 were purchased from New England Biolabs (Ipswich, USA). NaCl, MgCl2 and HEPES were obtained from Sigma-Aldrich (Guangzhou, China). Other chemical reagents were procured from Guangzhou Chemical Reagents Factory (Guangzhou, China). All reagents used in this study were of analytical grade and were used directly without any purification. All solutions were prepared using RNAase-free water.
HCR-CRISPR detection
DNA sequences of the HCR system were designed according to the literature and modified to include an aptamer region [39]. In preparation, H1 and H2 were heated separately to 95 °C for 2 min and then cooled to room temperature for 1 h. Then, H0, H1 and H2 were mixed together at concentrations of 0.5, 2 and 2 μM, respectively, in reaction buffer (100 mM Na2HPO4, 1 mM NaCl and 5 mM EDTA, pH 7.0) and incubated at 37 °C for 1 h. Agarose gels (2%) and PAGE gels were run to confirm the formation of HCR products. After Goldview (Maygene, Guangzhou, China) staining, the gels were transferred to the Tanon-2500 (Shanghai, China) for gel imaging.
For a standard CRISPR-Cas12a method, crRNAs were transcribed in vitro as previously reported [31, 55]. The Cas12a-crRNA duplex was preassembled by mixing 250 nM Cas12a and 500 nM crRNA and performing target recognition in 1× NEBuffer 2.1. After incubation for 30 min at 37 °C, 50 nM collateral ssDNA was added, and the mixture was incubated in a fluorescent plate reader (Tecan spark, Shanghai, China) for 0.5-2 h at 37 °C, with the fluorescence intensity (FI) measured every 5 min (ssDNA reporter = λex: 535 nm; λem: 572 nm).
For heterogeneous HCR-CRISPR, H0 at a specified concentration was added to the 0.72 mg/mL streptavidin MBs and incubated at 37 °C for 0.5 h followed by three washes. Then, the beads were resuspended with 50 μL of 2 μM H1 and 50 μL of 2 μM H2 and incubated for 1 h at 37 °C. After three washes, we carried out the standard CRISPR-Cas12a method.
Cell culture, cell-derived EV isolation and EV characterization
The human nasopharyngeal carcinoma cancer (NPC) cell line SUNE2 (Chinese Academy of Sciences, Shanghai, China) was cultured in RPMI-1640 medium (Invitrogen, Carlsbad, USA) containing 10% heat-inactivated FBS (Thermo Fisher, Rockford, IL, USA) at 37 °C with 5% CO2. EVs secreted from SUNE2 cells were isolated by the ultracentrifugation method as described in our previous study [21]. Briefly, cells were cultured to 70-80% confluence and subsequently washed three times with PBS. Then, the cells were maintained in media without FBS for 24 h. All culture media were collected for EV isolation by ultracentrifugation at 100,000 ×g for 75 min at 4 °C twice and resuspended in PBS.
The isolated EVs were observed using a JEM-1200EX transmission electron microscope (TEM) (JEOL, Japan), and the concentration and size were verified by nanoparticle tracking analysis (NTA) performed with a NanoSight NS300 (Malvern Instruments Ltd, UK). The characteristic proteins of the EVs were analyzed by Western blotting as previously reported [21].
Apta-ELISA
Next, 100-µL serial dilutions of SUNE2-derived EVs (10 -106 particles/µL) were added to the anti-CD63, anti-CD81 and anti-CD9 MBs and incubated with 100 μL of 500 nM biotin-labeled aptamer at 37 °C for 1 h. After washing three times, 100 μL of diluted streptavidin-HRP (1:200 in PBS, R&D Systems, Minnesota, USA) was added per well, followed by incubation for 20 min at room temperature. The MBs were washed three times with wash solution (0.01% Tween 20 and 5 mM MgCl2 in PBS) between each binding incubation. Finally, the 100-μL substrate (tetramethylbenzidine) to HRP was added, followed by incubation at 37 °C for 10-15 min in the dark. The reaction was stopped with 50 μL of 2 N H2SO4, and the OD was measured immediately at a wavelength of 450/630 nm.
Apta-HCR-ELISA
Prior to each experiment, biotin-labeled H1 and H2 stock solutions were heated to 95 °C for 2 min and then allowed to cool to room temperature for 1 h before use. SUNE2-derived EVs were captured and recognized by 500 nM H0 using the same protocol for the apta-ELISA. At the same time, 50 μL of 2 μM H1-biotin and 50 μL of 2 μM H2-biotin were mixed with 5 μL of 10 μg/mL streptavidin-HRP and incubated for 0.5 h at room temperature. Next, EV-captured beads with the aptamer bound were washed three times with PBST followed by resuspension in the above mixture of HRP-labeled H1 and H2 and incubated for 1 h at 37 °C. The subsequent steps and OD measurement were the same as those for the apta-ELISA.
Apta-HCR-CRISPR
First, 100-μL serial dilutions of the EVs (64-106 particles/µL) were captured and recognized by 500 nM H0 using the same protocol as for the apta-ELISA. Then, the beads were resuspended with 50 μL of 2 μM H1 and 50 μL of 2 μM H2 and incubated for 1 h at 37 °C; after washing, the HCR products contained repetitive sequences bound to the beads, serving as targets for subsequent CRISPR-Cas12a recognition. Then, the standard CRISPR-Cas12a method was performed.
Clinical samples (50% dilution; 50 µL of serum in 50 µL of PBS) were also processed with a similar protocol to that described above.
Clinical characteristics and ethics statement
For the NPC detection experiment, pretreated serum from 20 pathologically confirmed NPC patients was obtained from Sun Yat-sen University Cancer Center (SYSUCC), and 20 volunteers who underwent routine physical examinations with negative results were also selected from the health examination department at our center. To evaluate PD-L1+ EV changes after immunotherapy initiation, ten advanced cancer patients with serum collected within 7 days before (day -7) and after 4 courses of nivolumab or pembrolizumab therapy were enrolled and analyzed.
The serum from the enrolled subjects was centrifuged at 3600 rpm for 8 min and then stored at -80 °C until use. The clinical characteristics of the patients with NPC and the healthy controls are shown in Table S2, and the details of the patients treated with PD-1 therapy are shown in Table S3.
This study was reviewed and approved by the Institutional Review Board and Ethics Committee of SYSUCC (GZR2018-197). Written informed consent for the use of clinical parameters and collected samples for further studies at the time of patient admission was obtained as a general standard procedure; the samples were anonymous and de-identified before use.
Statistical analysis
Statistical analyses were performed using GraphPad Prism version 8.0 software and Microsoft Excel. A two-tailed Student's t-test was used to analyze differences between the two groups. To evaluate the value of PD-L1+ EVs for immunotherapy surveillance, a paired t-test was applied. The diagnostic efficacy of nucleolin+ EVs was evaluated using the area under the receiver operating characteristic (ROC) curve (AUC). All tests were two tailed, and a p-value less than 0.05 was considered statistically significant. Three replicates were performed to improve the statistics.
Results and Discussion
Scheme
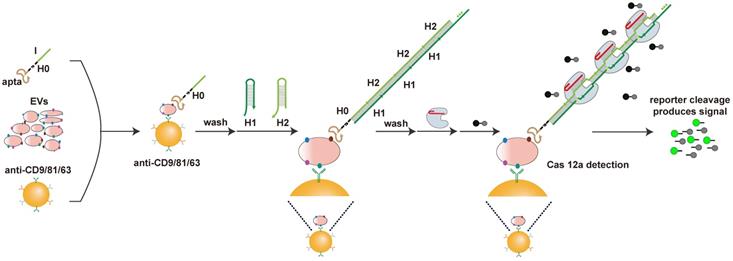
Our apta-HCR-CRISPR assay comprised three processes (Figure 1): aptamer-based ELISA (apta-ELISA) for EV capture and target recognition, HCR amplification and CRISPR-Cas12a DNA detection. In this proof-of-principle work, the initiator strand H0 was designed with three functional domains, including an aptamer for receptor recognition (apta), a nine-T spacer for structural steric hindrance diminishment (T) and an ssDNA region to initiate HCR (I), serving as the bridge for protein target recognition and DNA signal amplification. First, we captured EVs with a cocktail of anti-CD63-, anti-CD81- and anti-CD9 antibody-coated beads and recognized the targets with H0. If the EV membranes express target proteins, H0 binds to the target with the help of the corresponding aptamers and forms antibody-protein-H0 complexes, opening up H1s; this triggers a cascade reaction, which opens up H2s to form a long-nicked dsDNA with tens to hundreds of repetitive units containing protospacer adjacent motif (PAM) structures and target sequences for specific recognition by the predesigned crRNA. After washing off unbound nucleic acids, the added crRNA/Cas12a duplex binds the repetitive units in H1/H2 within the HCR assembly and induces the trans-cleavage activity of Cas12a, resulting in nearby nontarget ssDNA cleavage. Here, an ssDNA probe labeled with a donor fluorophore (FAM) at the 5' end and a quencher (BHQ) close to the 3' end was introduced as a reporter (FQ probe). When the reporter is intact, the proximity of the FAM to the BHQ suppresses its fluorescence, primarily via the Förster-type of energy transfer [56]. Once target-activated Cas12a trans-cleaves the ssDNA reporter, a fluorescent signal will be produced due to the separation of the FAM from the BHQ, and the fluorescence will be proportional to the target concentration. In the absence of the target protein on EVs, H0 is washed away because no target is available to bind, resulting in no target DNA for Cas12a trans-cleavage and thus no change in the fluorescence signal. As a result, the concentration of the EV target protein can be calculated by monitoring the fluorescence change in the system. Using this strategy, we can transform the CRISPR-Cas12a system into a general sensor for quantification of a wide range of EV proteins.
Schematic of apta-HCR-CRISPR. The EVs are captured by a cocktail of anti-CD63-, anti-CD81- and anti-CD9 antibody-coated beads and recognized with H0. The formed antibody-EV-H0 complexes trigger HCR and generate long repetitive target sequences that are specifically recognized by the added crRNA/Cas12a duplex. Target-activated Cas12a trans-cleaves nearby ssDNA-FQ reporter, resulting in readable and accumulating fluorescence signal proportional to the concentration of target positive EVs.
Feasibility of the HCR-CRISPR
Prior to conducting the apta-HCR-CRISPR, we set up HCR-CRISPR using nucleolin and PD-L1 as examples. The feasibility of HCR was validated by both agarose and polyacrylamide gel electrophoresis (PAGE) (Figure 2A). As Cas12a endonuclease from Francisella novicida (Fn) exhibits a fast cleavage effect on dsDNA [57, 58], we expressed and purified FnCas12a (Figure S1) and developed our platform based on it.
Establishment of the HCR-CRISPR assay. (A) Agarose gel (left) and PAGE (right) images of the HCR nucleic acid amplification assay. Lane 1, 2.0 μM H1; lane 2, 2.0 μM H2; lane 3, 2.0 μM H1 and 2 μM H2 mixture; lane 4, NHCR, 0.5 μM nucleolin H0 mixed with a mixture of 2 μM H1 and 2 μM H2; lane 5, PHCR, 0.5 μM PD-L1 H0 mixed with a mixture of 2 μM H1 and 2 μM H2. (B) Diagram of the H1/H2 sequences within the HCR targeted by Cas12a and the respective crRNA. Highlighted bases indicate the 5′ PAM sequence. The same color represents a paired crRNA and PAM. (C) Observed FI of HCR-CRISPR using different crRNAs to target 1μL of nucleolin HCR (NHCR) products. The nonspecific (NS) crRNA controls showed a low or zero value after subtracting the background FI. The P values were calculated by comparison with the crRNA2 group using a one-way ANOVA followed by a Sidak multiple-comparisons test. *** and **** represent P < 0.001 and P < 0.0001, respectively. (D) Representative real-time fluorescence kinetic measurement of CRISPR-Cas12a using different targets: nucleolin H0 (NH0), PD-L1 H0 (PH0), H1, H2, NHCR and PD-L1 HCR (PHCR) products. Fluorescence measurements were taken every 5 min for 2 h. Error bars represent the mean ± SD, where n = 3. (E) Heterogeneous HCR-CRISPR mechanism. Real-time fluorescence kinetic measurement (F) and the observed FI (G) of the heterogeneous HCR-CRISPR. HCR (+): 50 nM H0 mixed with a mixture of 2 μM H1 and 2 μM H2; HCR (-): 0 nM H0 mixed with a mixture of 2 μM H1 and 2 μM H2. Unbound DNA sequences were discarded by washing three times. Error bars represent the mean ± SD, where n = 3. (H) Observed FI of CRISPR-Cas12a using 0.4 nM, 2 nM and 10 nM H2 dsDNA or duplicate consecutive H2 (H2-H2) as activators. dsDNA, double-stranded DNA. Error bars represent the mean ± SD, where n = 3. FI, fluorescence intensity. For G and H, statistical analyses were performed using a two-tailed Student's t-test.
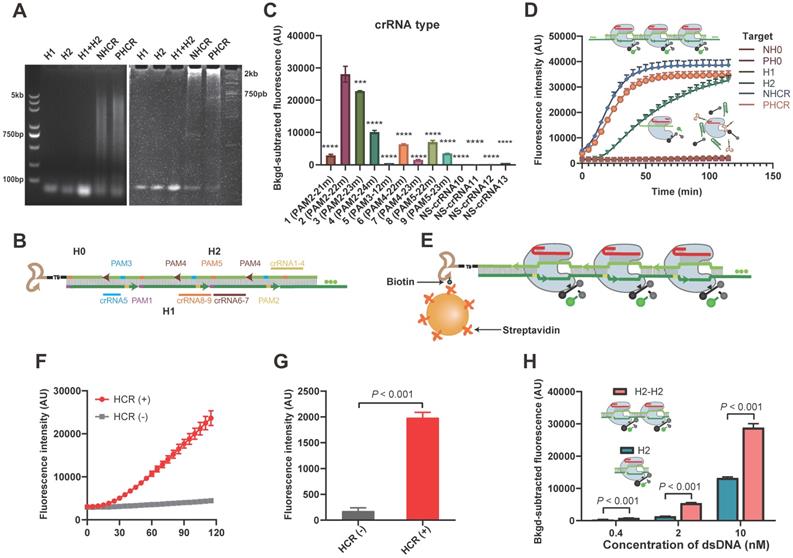
The composition and length of complementarity between the crRNA and DNA largely modulate Cas12a nuclease activation [40, 59]. Hence, prudent crRNA design and repeated testing are required to optimize the cleavage effect. To maximally trigger Cas12a endonuclease activity, crRNA must be adjacent to the PAM sequence of the target in its 3' region. As shown in Figure 2B, five PAMs (highlighted region) were found in the HCR dsDNA assembly. Considering that introducing a nick near the 5' region of the PAM could perturb DNA rigidity [60] and affect Cas12a-induced DNA bending for cleavage to slow down cleavage, PAM1 was skipped for the crRNA design. For the remaining four PAMs, we designed nine crRNAs covering different compositions and lengths, as shown in Table S1 and Figure 2B. Similar to previous reports, 22m and 23m crRNA-DNA heteroduplexes achieved good cleavage rates, especially PAM2-22m and PAM2-23m [29, 59]. Cas12a/crRNA cleavage events also occurred in the 21m and 24m crRNA-DNA duplex group. However, 12 matched bases (12m) between crRNA5 and the target showed almost no Cas12a/crRNA cleavage events (Figure 2C), which is consistent with previous studies reporting that fewer than 15 base pairs of the crRNA-DNA heteroduplex was not sufficient to trigger NTS cleavage of Cas12a [29, 59]. Nonspecific crRNAs (NS-crRNA10-13) were used as negative controls, and no fluorescence changes were observed. The crRNA2-H2 assembly at the PAM2 proximal end triggered the best catalytic activity and was selected as the universal DNA barcode for the next assay (Figure 2C). The PAGE result in Figure S2 confirmed that the Cas12a-crRNA2 duplex largely cis-cleaved the HCR products.
Given that HCR produces nicked dsDNA structures, to explore whether the nicks affect Cas12a-crRNA2 duplex cleavage events, we introduced ligase to close the nicks (Figure S3A). A standard CRISPR-Cas12a assay was performed with both sets (with and without nicks) of nucleolin HCR products (NHCR) at 10-fold and 50-fold dilutions, and no significant differences were found between the two sets (Figure S3B), indicating that nicks on the HCR products did not prevent cleavage events. Based on these data, our HCR-CRISPR assay was successfully established and worked well without preligation.
Next, target specificity was explored using H1, H2, and H0. We observed that the fluorescence intensity (FI) increased with the reaction time for Cas12a-crRNA cleavage in both the HCR products and the H2 ssDNA group but not in the H1 ssDNA and H0 groups (Figure 2D), which is consistent with previous reports showing that both crRNA-complementary ssDNA (here, H2) and dsDNA (here, HCR products) could activate Cas12a to cleave the ssDNA-FQ reporter substrate [29]. We further designed our platform in a heterogeneous assay format using solid beads and included washing steps to remove unbound H2. As illustrated in Figure 2E, streptavidin-MBs captured biotinylated H0, triggering HCR amplification to form long repetitive dsDNA structures. After excess H1 and H2 were removed by washing, the bound products were detected by CRISPR-Cas12a. The fluorescence kinetic curves showed that the FI increased in the HCR group but was barely evident in the control group (Figure 2F). Moreover, the FI value in the HCR group was substantially stronger than that in the negative control group (Figure 2G), indicating that HCR and CRISPR-Cas12a can work successfully in a solid-phase format.
Considering that our methodology is based on the speculation that a repeated sequence comprising multiple crRNA targetable barcodes confers Cas12a with higher collateral cleavage activity than a single target sequence, we chemically synthesized duplicate consecutive H2 dsDNA as activators (H2-H2) and considered H2 to be the cognate target. The fluorescence signals in duplicate consecutive H2 dsDNA were almost twice those in individual H2 dsDNA at three concentrations (Figure 2H), suggesting that the sequentially repetitive target sequences amplify the CRISPR/Cas12a signal. Similar results were also observed for ssDNA (Figure S4). We also confirmed that the gap was long enough to not hinder Cas12a-crRNA target recognition events (Figure S5 and supplementary information). These results laid a foundation for our HCR-based CRISPR amplification system.
Cas12a cleavage could be improved by buffer, crRNA, Cas12a concentration, and reaction temperature optimization (Figure S6 and supplementary information). With these optimized experimental conditions, we could detect a synthetic target dsDNA and target ssDNA with limits of detection (LODs) of 0.01 nM and 0.5 nM (Figure S7), respectively, which are similar to those in previous CRISPR/Cas12a-Dx studies, and the LOD was lower when a dsDNA activator was bound because of the higher Cas12a trans cleavage efficiency [29]. Our HCR-CRISPR platform also used dsDNA activators and was therefore likely to be more sensitive than the technique using an ssDNA target assembly.
Comparison of apta-ELISA, apta-HCR-ELISA and apta-HCR-CRISPR
Prior to the detection of EV-derived proteins using the proposed apta-HCR-CRISPR platform, nasopharyngeal carcinoma cancer (NPC) EVs secreted from SUNE2 cells were harvested. The enriched EVs were confirmed to be cup-shaped vesicles with diameters of approximately 100 nm and were positive for the CD63, CD9, TSG101 and CD81 markers (Figure S8), indicating the successful extraction of NPC EVs.
Our platform used aptamers as substitutes for antibodies to recognize surface proteins on EVs. Thus, we tested the feasibility of using the aptamers to recognize target proteins using apta-ELISA, and the mechanism is shown in Figure 3A. SUNE2 TEVs (64 - 106 particles/µL) spiked in PBS were used as samples, and PBS served as a blank. After subtracting the PBS background OD, we found that the OD values of apta-ELISA were barely detectable until the EV concentration reached 106 particles/µL for both nucleolin+ and PD-L1+ TEVs (Figure 3B, Figure S9A), indicating that the aptamers could recognize the corresponding proteins on TEVs but exhibited low sensitivity. To increase the sensitivity, we constructed an apta-HCR-ELISA to combine nucleic acid-based amplification and recognition events (the mechanism is shown in Figure 3C) and found that the LOD was enhanced 100-fold to approximately 104 particles/µL (Figure 3D, Figure S9B). Despite the significant improvement in sensitivity, given that the average number of EVs in bodily fluids ranges from 1 × 10² to 3 × 10⁶ particles/µL [61], further effort should be focused on improving the sensitivity for EV detection.
Comparison of the apta-ELISA, apta-HCR-ELISA and apta-HCR-CRISPR assays. (A) apta-ELISA mechanism. In the apta-ELISA assay, EVs were added to the anti-CD63, anti-CD81 and anti-CD9 MBs, incubated with a biotinylated aptamer, and washed and resuspended in streptavidin-HRP. The reaction was launched by adding the substrate, and the OD was proportional to the original concentration of target positive EVs. (B) Detection of nucleolin+ EVs by apta-ELISA with serial concentrations of SUNE2 EVs spiked in PBS from 64-106 particles/µL. (C) apta-ELISA-HCR mechanism. EVs were added to the anti-CD63, anti-CD81 and anti-CD9 MBs, incubated with a biotinylated aptamer, and washed and resuspended in premixture HRP-labeled H1 and H2. The reaction was launched by adding the substrate, and the OD was proportional to the original concentration of target positive EVs. (D) Detection of nucleolin+ EVs by apta-HCR-ELISA with serial concentrations of SUNE2 EVs spiked in PBS from 64-106 particles/µL. (E) apta-HCR-CRISPR mechanism. Based on the apta-ELISA-HCR assay, the HCR products were targeted by Cas12a/crRNA duplex and triggered Cas12a to cleave the ssDNA-FQ reporter substrate, resulting in readable and accumulating FI proportional to the concentration of target positive EVs. (F) Detection of nucleolin+ EVs by apta-HCR- CRISPR with serial concentrations of SUNE2 EVs spiked in PBS from 64-106 particles/µL. (G) Comparison of the LOD of apta-HCR-CRISPR, apta-HCR-ELISA and apta-ELISA in detecting nucleolin+ EV spiked in PBS. (H) The concentration change in nucleolin+ EVs is linearly related to the FI through fitting curves, Y= 7663 lg (EVs) - 12852 (R2 = 0.9848). FI, fluorescence intensity. PBS served as a blank. The P values were calculated using a one-way ANOVA followed by a Sidak multiple-comparison with the former group. *, **, *** and **** represent P < 0.05, P < 0.01, P < 0.001 and P < 0.0001, respectively. Error bars represent the mean ± SD, where n = 3.
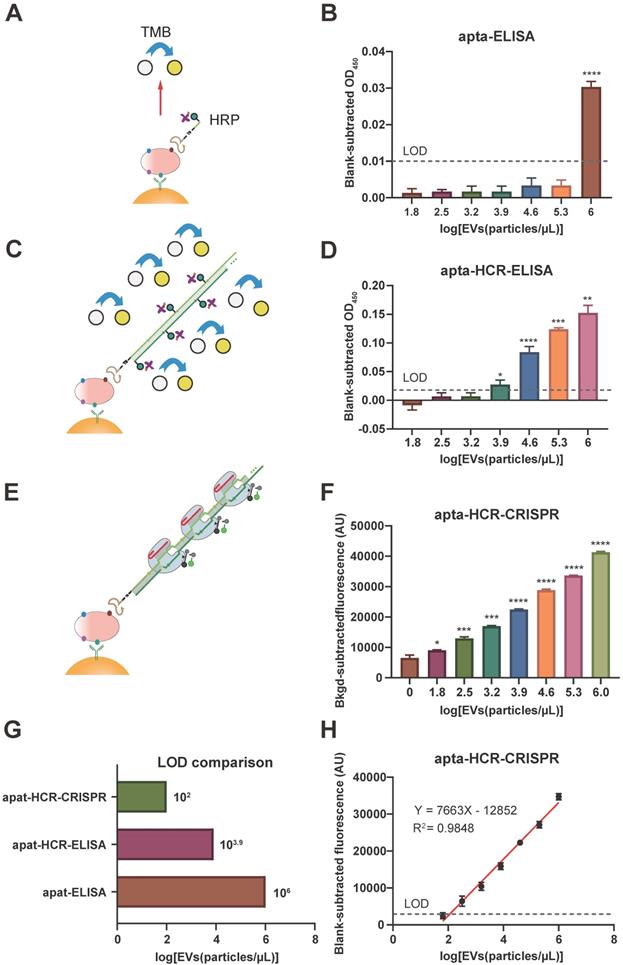
Therefore, we detected EV-derived proteins by combining the apta-ELISA and the highly efficient signal amplification HCR-CRISPR/Cas12a platform (Figure 3E). SUNE2 TEVs (106 particles/µL) with 5-fold serial dilutions spiked in PBS (64 - 106 particles/µL) were used as samples (Figure 3F), and an FI alteration was observed that gradually increased with increasing concentrations of EVs, with its alteration between adjacent groups being statistically significant (P < 0.05). The LOD of apta-HCR-CRISPR for nucleolin+ TEVs was 102 particles/µL based on 3σb (σb is the standard deviation of the PBS, n = 3), which was approximately four orders of magnitude lower than that of the apta-ELISA and 100-fold lower than that of the apta-HCR-ELISA (Figure 3G, Figure S9C). A linear correlation between the concentration of nucleolin+ EVs (X) and the FI (Y) ranging from 64 to 106 particles/µL was observed (Figure 3H), with the following equation: Y = 7,663 lg(X) - 12,852, R2 = 0.9848. Evidently, the increased sensitivity is due to both amplification by HCR and the turnover trans-cleavage effects of CRISPR-Cas12a. Similarly, our platform for PD-L1+ EV detection achieved a linear range of 64-106 particles/µL and an LOD of 102 particles/µL (Figure S9D, S9E). The linear equation was Y = 7895 lg(X) - 14376 (Figure S8E, R2 = 0.9652).
We believe that our approach is potentially suitable for analyzing TEVs in clinical applications given the low cost, easy operation, high sensitivity and wide linear range. A comparison of our proposed platform and recently reported methods for EV-derived protein detection is shown in Table S4. In general, our strategy is sensitive, convenient, and cost effective and requires no sophisticated equipment. Despite the capacities of our strategy, limitations are still present compared to the enzyme-assisted nucleic acid amplification-based methods, such as RPA-based or LAMP CRISPR/Cas12a assays, especially in terms of the kinetic efficiency. By controlling the optimal conditions, such as hairpins with relatively large loops, preparation by heating to 95 °C for 2 min, and using a 37 °C amplification temperature and HCR reaction buffer containing sufficient Na+, with the help of CRISPR-Cas12a, the HCR time could be reduced to 1 h with a low LOD of 102 particles/µL.
Apta-HCR-CRISPR assay for clinical samples and serum nucleolin+ and PD-L1+ EVs in clinical applications
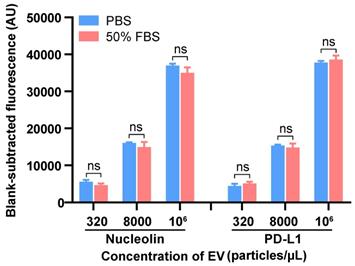
We next tested the applicability of our method in complex serum samples by spiking EVs into 50% EV-depleted fetal bovine serum (FBS) at three different concentrations, and comparable results between the signal of the EVs spiked in FBS and those in PBS were observed (Figure 4). This assay achieved good recovery rates within the range of 83.7-115.6% with relative standard deviations (RSDs) of 2.8-9.1% for detecting both nucleolin+ and PD-L1+ EVs (Table S5). The results suggested that this platform has good reproducibility and high specificity with an acceptable sample matrix effect. As the procedure for our method includes washing steps as in a conventional ELISA, we can easily understand that the apta-HCR-CRISPR platform possesses an excellent anti-interference property. We further evaluated the sensitivity performance of our platform for complex samples. Similarly, the LOD of apta-HCR-CRISPR with serum was approximately 102 particles/µL (Figure S10), surpassing that of apta-HCR-ELISA (approximately 104 particles/ul) and apta-ELISA (106 particles/ul). Therefore, the proposed assay can work well for complex biological samples and has great potential for use in clinical serum samples (Figure 5A).
Detection of the EVs in spiked EV-depleted FBS using the apta-HCR-CRISPR assay. The FIs were blank subtracted. Statistical analyses were performed using a two-tailed Student's t-test. ns represents P > 0.05. Error bars represent the mean ± SD, where n = 3.
Serum sample detection of nucleolin+ EVs with the apta-HCR-CRISPR assay. (A) Mechanism of serum sample detection with the apta-HCR-CRISPR assay. (B) Non-supervised hierarchical clustering analysis of nucleolin+ EVs in early-stage and advanced-stage NPC patients and controls. Samples 1-10 were early-stage NPC, samples 11-20 were advanced-stage NPC, and samples 21-40 were the controls. (C) Representative immunofluorescence staining image of nucleolin proteins on serum EV membranes. Scale bar represents 100 µm. (D) Scatter plots of the nucleolin+ EV levels in the serum samples from the controls, early-stage NPC patients and advanced-stage NPC patients measured by the apta-HCR-CRISPR. The FIs measured for individual subjects were adjusted by the background and the blank. A statistical comparison of two groups was performed by a two-tailed Student's t-test. (E) ROC curve analysis evaluating the diagnostic power of nucleolin+ EVs to differentiate early-stage NPC (pink line) or early + advanced stage NPC (orange line) from controls.
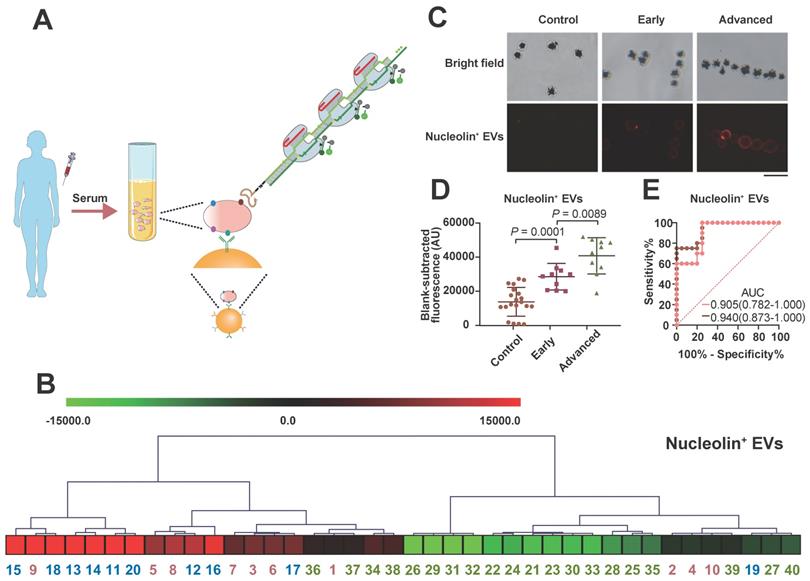
Nucleolin has been identified to be markedly upregulated in NPC tissues by iTRAQ and tissue microarray methods and has been confirmed to be expressed on the surfaces of malignant cell-derived EVs [62]. However, the value of EV-derived nucleolin has not been explored in NPC. NPC, which is prevalent in China, is a deadly cancer because most cases are diagnosed at late stages [63]. To investigate their clinical value for early NPC detection, the serum levels of nucleolin+ TEVs in 20 healthy people, 10 early-stage (stages I and II) NPC patients, and 10 advanced NPC patients were measured with the apta-HCR-CRISPR assay. No significant differences in sex or age were found between the three groups. As shown in Figure 5B, the expression levels of nucleolin+ EVs varied across individual participants. Both immunofluorescence (IF, Figure 5C) and apta-HCR-CRISPR (Figure 5D) experiments showed that the levels of nucleolin+ EVs in early NPC patients were significantly higher than those in healthy controls (Figure 5D, P = 0.0001), and the advanced NPC group exhibited higher levels compared to the early-stage NPC group (Figure 5D, P = 0.0089), suggesting that nucleolin+ TEVs may be potential biomarkers for NPC diagnosis. Receiver operating characteristic (ROC) curve analysis and the area under the curve (AUC) were used to assess the diagnostic effect. A superior diagnostic effect (Figure 5E, AUC = 0.940) in differentiating NPC patients from control subjects was observed. The excellent accuracy (AUC = 0.905) was maintained even when discriminating early NPC patients from controls, indicating the potential clinical application value of nucleolin+ TEVs for early NPC diagnosis. We will continue to verify the performance of nucleolin+ TEVs in NPC screening in samples from larger patient cohorts.
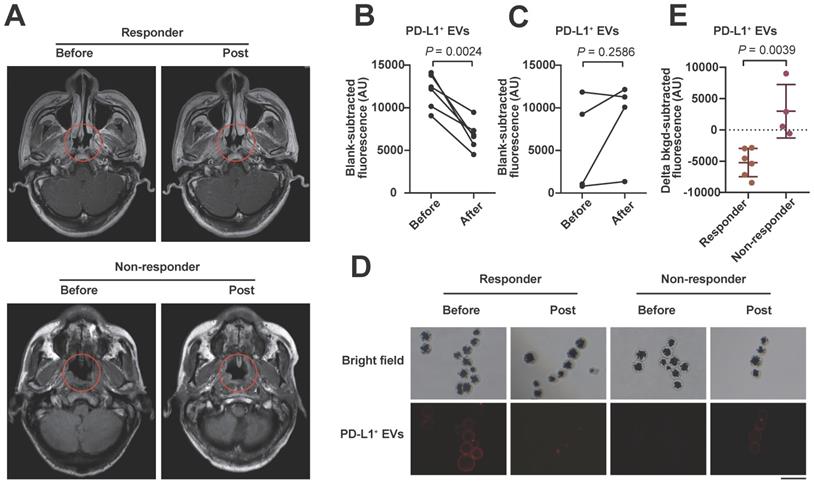
We also examined serum PD-L1+ EVs with the proposed assay in 10 stage IV tumor patients (including 6 responders and 4 non-responders; 8 NPC and 2 lung cancer patients) undergoing anti-PD-1 therapy. After 4 courses of anti-PD-1 treatment, the level of circulating EV PD-L1 decreased significantly in the clinical responders (Figure 6A, upper) but not in the non-responders (Figure 6A, lower) compared to the levels of EV PD-L1 at the pretreatment baseline (Figure 6B, 6C), which was also confirmed by the IF results (Figure 6D). The decline in EV PD-L1 levels stratified clinical responders from non-responders (Figure 6E, P = 0.0039). These results are consistent with those of other studies showing that dynamic changes in PD-L1 levels are ideal predictive biomarkers for immune checkpoint blockade therapy responses [9, 64], suggesting that our method may be useful for monitoring the efficacy of immunotherapy.
Serum sample detection of PD-L1+ EVs with the apta-HCR-CRISPR assay. (A) Representative MRI diagram of patients with different therapy responses. Upper panel shows the MRI images of a responder who had been assessed as having stable disease (SD): before treatment (left) and post-treatment (right). Lower panel shows the MRI images of a non-responder who had been assessed as having progressive disease (PD): before treatment (left) and post-treatment (right). Trend graph of PD-L1+ EV levels detected in the responders (B) and non-responders (C) before and after 4-course anti-PD-1 therapy. Statistical analyses were performed using a two-sided paired t-test. (D) Representative immunofluorescence staining image of PD-L1 proteins on serum EV membranes. Scale bar represents 100 µm. (E) Comparison of the changes in the levels of serum EV PD-L1 after 4 courses of anti-PD-1 therapy between responders (n = 6) and non-responders (n = 4). Statistical analyses were performed using a two-tailed Student's t-test. Abbreviations: FI, fluorescence intensity.
Conclusions
In conclusion, we successfully constructed a novel apta-HCR-CRISPR assay to detect TEV surface proteins. Our method can detect TEV 102 particles/µL directly from complex sample environments. The multiple HCR barcodes recognized by crRNA/Cas12a provide an easily designed and highly adaptable aptamer-based protein detection method. Considering its high sensitivity, cost efficiency and ease of operation, this structurally versatile and stable method has considerable potential to be exploited as a routine bioassay for efficient clinical diagnosis or therapy surveillance. Our experiment with a small sample preliminarily confirmed that serum nucleolin+ TEVs are potential biomarkers for NPC detection and that changes in PD-L1+ TEVs levels are potential predictive biomarkers for immune checkpoint blockade therapy responses.
Abbreviations
HCR: hybridization chain reaction; TEV: tumor-derived extracellular vesicle; crRNA: CRISPR RNA; PD-L1: programmed death ligand 1; LOD: limit of detection; NPC: nasopharyngeal carcinoma cancer; EVs: extracellular vesicles; PLA: proximity ligation assay; RPA: recombinase polymerase amplification; TMA: transcription-mediated amplification assay; CRISPR: clustered regularly interspaced short palindromic repeats; ssDNA: single-stranded DNA; PAGE: polyacrylamide gel electrophoresis; FBS: fetal bovine serum; FI: fluorescence intensity; NTA: nanoparticle tracking analysis; SYSUCC: Sun Yat-sen University Cancer Center; AUC: area under the curve; ROC: receiver operating characteristic; PAM: protospacer adjacent motif; Fn: Francisella novicida; NHCR: nucleolin HCR; apta-ELISA: aptamer-based ELISA; RSD: relative standard deviation.
Supplementary Material
Supplementary figures and tables.
Acknowledgements
This work was supported from a grant by the National Key Research and Development Project (2018YFC0910202), the Natural Science Foundation of Guangdong Province (2019A1515010798), the Science and Technology Planning Project of Guangzhou (201704020176), and the National Natural Science Foundation of China (No. 81871711).
Author Contributions
Shan Xing, Zedong Lu, and Qi Huang contributed equally to this work.
Shan Xing: Writing - Original Draft, Methodology, Software. Zedong Lu: Investigation, Data Curation. Qi Huang: Investigation, Validation. Huilan Li: Methodology. Yu Wang: Formal analysis. Yanzhen Lai: Visualization. Yi He: Investigation. Min Deng: Conceptualization, Supervision. Wanli Liu: Conceptualization, Writing - Review & Editing, Supervision, Funding acquisition.
Competing Interests
The authors have declared that no competing interest exists.
References
1. Colombo M, Raposo G, Thery C. Biogenesis, secretion, and intercellular interactions of exosomes and other extracellular vesicles. Annu Rev Cell Dev Biol. 2014;30:255-89
2. Thery C, Zitvogel L, Amigorena S. Exosomes: composition, biogenesis and function. Nat Rev Immunol. 2002;2:569-79
3. Abels ER, Breakefield XO. Introduction to Extracellular Vesicles: Biogenesis, RNA Cargo Selection, Content, Release, and Uptake. Cell Mol Neurobiol. 2016;36:301-12
4. Gori A, Romanato A, Greta B, Strada A, Gagni P, Frigerio R. et al. Membrane-binding peptides for extracellular vesicles on-chip analysis. J Extracell Vesicles. 2020;9:1751428
5. Mathieu M, Martin-Jaular L, Lavieu G, Thery C. Specificities of secretion and uptake of exosomes and other extracellular vesicles for cell-to-cell communication. Nat Cell Biol. 2019;21:9-17
6. Kowal J, Arras G, Colombo M, Jouve M, Morath JP, Primdal-Bengtson B. et al. Proteomic comparison defines novel markers to characterize heterogeneous populations of extracellular vesicle subtypes. P Natl Acad Sci USA. 2016;113:E968-E77
7. Pang B, Zhu Y, Ni J, Thompson J, Malouf D, Bucci J. et al. Extracellular vesicles: the next generation of biomarkers for liquid biopsy-based prostate cancer diagnosis. Theranostics. 2020;10:2309-26
8. Dorsam B, Reiners KS, von Strandmann EP. Cancer-derived extracellular vesicles: friend and foe of tumour immunosurveillance. Philos Trans R Soc Lond B Biol Sci. 2018 373
9. Chen G, Huang AC, Zhang W, Zhang G, Wu M, Xu W. et al. Exosomal PD-L1 contributes to immunosuppression and is associated with anti-PD-1 response. Nature. 2018;560:382-6
10. Wang H, Jiang D, Li W, Xiang X, Zhao J, Yu B. et al. Evaluation of serum extracellular vesicles as noninvasive diagnostic markers of glioma. Theranostics. 2019;9:5347-58
11. Zhang L, Lei Q, Wang H, Xu C, Liu T, Kong F. et al. Tumor-derived extracellular vesicles inhibit osteogenesis and exacerbate myeloma bone disease. Theranostics. 2019;9:196-209
12. Chang L, Ni J, Zhu Y, Pang B, Graham P, Zhang H. et al. Liquid biopsy in ovarian cancer: recent advances in circulating extracellular vesicle detection for early diagnosis and monitoring progression. Theranostics. 2019;9:4130-40
13. Zhang P, Zhou X, Zeng Y. Multiplexed immunophenotyping of circulating exosomes on nano-engineered ExoProfile chip towards early diagnosis of cancer. Chem Sci. 2019;10:5495-504
14. Tauro BJ, Greening DW, Mathias RA, Ji H, Mathivanan S, Scott AM. et al. Comparison of ultracentrifugation, density gradient separation, and immunoaffinity capture methods for isolating human colon cancer cell line LIM1863-derived exosomes. Methods. 2012;56:293-304
15. Momen-Heravi F, Balaj L, Alian S, Mantel PY, Halleck AE, Trachtenberg AJ. et al. Current methods for the isolation of extracellular vesicles. Biol Chem. 2013;394:1253-62
16. Liu C, Zhao J, Tian F, Cai L, Zhang W, Feng Q. et al. Low-cost thermophoretic profiling of extracellular-vesicle surface proteins for the early detection and classification of cancers. Nat Biomed Eng. 2019;3:183-93
17. Im H, Shao H, Park YI, Peterson VM, Castro CM, Weissleder R. et al. Label-free detection and molecular profiling of exosomes with a nano-plasmonic sensor. Nat Biotechnol. 2014;32:490-5
18. Xu H, Liao C, Zuo P, Liu Z, Ye BC. Magnetic-Based Microfluidic Device for On-Chip Isolation and Detection of Tumor-Derived Exosomes. Anal Chem. 2018;90:13451-8
19. Jeong S, Park J, Pathania D, Castro CM, Weissleder R, Lee H. Integrated Magneto-Electrochemical Sensor for Exosome Analysis. ACS Nano. 2016;10:1802-9
20. Shao H, Yoon TJ, Liong M, Weissleder R, Lee H. Magnetic nanoparticles for biomedical NMR-based diagnostics. Beilstein J Nanotechnol. 2010;1:142-54
21. Liu W, Li J, Wu Y, Xing S, Lai Y, Zhang G. Target-induced proximity ligation triggers recombinase polymerase amplification and transcription-mediated amplification to detect tumor-derived exosomes in nasopharyngeal carcinoma with high sensitivity. Biosens Bioelectron. 2018;102:204-10
22. Dirks RM, Pierce NA. Triggered amplification by hybridization chain reaction. Proc Natl Acad Sci U S A. 2004;101:15275-8
23. Lin R, Feng Q, Li P, Zhou P, Wang R, Liu Z. et al. A hybridization-chain-reaction-based method for amplifying immunosignals. Nat Methods. 2018;15:275-8
24. Yan L, Zhou J, Zheng Y, Gamson AS, Roembke BT, Nakayama S. et al. Isothermal amplified detection of DNA and RNA. Mol Biosyst. 2014;10:970-1003
25. Bi S, Yue S, Zhang S. Hybridization chain reaction: a versatile molecular tool for biosensing, bioimaging, and biomedicine. Chem Soc Rev. 2017;46:4281-98
26. An Y, Jin T, Zhu Y, Zhang F, He P. An ultrasensitive electrochemical aptasensor for the determination of tumor exosomes based on click chemistry. Biosens Bioelectron. 2019;142:111503
27. Zheng J, Hu Y, Bai J, Ma C, Li J, Li Y. et al. Universal surface-enhanced Raman scattering amplification detector for ultrasensitive detection of multiple target analytes. Anal Chem. 2014;86:2205-12
28. Xia Y, Liu M, Wang L, Yan A, He W, Chen M. et al. A visible and colorimetric aptasensor based on DNA-capped single-walled carbon nanotubes for detection of exosomes. Biosens Bioelectron. 2017;92:8-15
29. Chen JS, Ma E, Harrington LB, Da Costa M, Tian X, Palefsky JM. et al. CRISPR-Cas12a target binding unleashes indiscriminate single-stranded DNase activity. Science. 2018;360:436-9
30. Swarts DC, Jinek M. Mechanistic Insights into the cis- and trans-Acting DNase Activities of Cas12a. Mol Cell. 2019;73:589-600 e4
31. Li SY, Cheng QX, Wang JM, Li XY, Zhang ZL, Gao S. et al. CRISPR-Cas12a-assisted nucleic acid detection. Cell Discov. 2018;4:20
32. Huang X, Chen Z, Liu Y. RNAi-mediated control of CRISPR functions. Theranostics. 2020;10:6661-73
33. Wu J, Tang B, Tang Y. Allele-specific genome targeting in the development of precision medicine. Theranostics. 2020;10:3118-37
34. Wu SS, Li QC, Yin CQ, Xue W, Song CQ. Advances in CRISPR/Cas-based Gene Therapy in Human Genetic Diseases. Theranostics. 2020;10:4374-82
35. Hsu MN, Liao HT, Truong VA, Huang KL, Yu FJ, Chen HH. et al. CRISPR-based Activation of Endogenous Neurotrophic Genes in Adipose Stem Cell Sheets to Stimulate Peripheral Nerve Regeneration. Theranostics. 2019;9:6099-111
36. Zhou RX, Li YY, Dong TY, Tang YA, Li F. A sequence-specific plasmonic loop-mediated isothermal amplification assay with orthogonal color readouts enabled by CRISPR Cas12a. Chem Commun. 2020;56:3536-8
37. Li YY, Mansour H, Wang T, Poojari S, Li F. Naked-Eye Detection of Grapevine Red-Blotch Viral Infection Using a Plasmonic CRISPR Cas12a Assay. Analytical Chemistry. 2019;91:11510-3
38. Chen Q, Tian T, Xiong E, Wang P, Zhou X. CRISPR/Cas13a Signal Amplification Linked Immunosorbent Assay for Femtomolar Protein Detection. Anal Chem. 2020;92:573-7
39. Xiong Y, Zhang J, Yang Z, Mou Q, Ma Y, Xiong Y. et al. Functional DNA Regulated CRISPR-Cas12a Sensors for Point-of-Care Diagnostics of Non-Nucleic-Acid Targets. J Am Chem Soc. 2020;142:207-13
40. Dai Y, Somoza RA, Wang L, Welter JF, Li Y, Caplan AI. et al. Exploring the Trans-Cleavage Activity of CRISPR-Cas12a (cpf1) for the Development of a Universal Electrochemical Biosensor. Angew Chem Int Ed Engl. 2019;58:17399-405
41. Wang B, Wang R, Wang DQ, Wu J, Li JX, Wang J. et al. Cas12aVDet: A CRISPR/Cas12a-Based Platform for Rapid and Visual Nucleic Acid Detection. Anal Chem. 2019;91:12156-61
42. Nouri R, Jiang YQ, Lian XL, Guan WH. Sequence-Specific Recognition of HIV-1 DNA with Solid-State CRISPR-Cas12a-Assisted Nanopores (SCAN). ACS Sensors. 2020;5:1273-80
43. Weckman NE, Ermann N, Gutierrez R, Chen KK, Graham J, Tivony R. et al. Multiplexed DNA Identification Using Site Specific dCas9 Barcodes and Nanopore Sensing. ACS Sensors. 2019;4:2065-72
44. Hernandez LI, Machado I, Schafer T, Hernandez FJ. Aptamers overview: selection, features and applications. Curr Top Med Chem. 2015;15:1066-81
45. Zhao L, Qi X, Yan X, Huang Y, Liang X, Zhang L. et al. Engineering Aptamer with Enhanced Affinity by Triple Helix-Based Terminal Fixation. J Am Chem Soc. 2019;141:17493-7
46. Bunka DH, Stockley PG. Aptamers come of age - at last. Nat Rev Microbiol. 2006;4:588-96
47. Liu M, Wang ZF, Tan T, Chen ZS, Mou XB, Yu XC. et al. An Aptamer-Based Probe for Molecular Subtyping of Breast Cancer. Theranostics. 2018;8:5772-83
48. Li JJ, Yang SS, Zuo C, Dai L, Guo YC, Xie GM. Applying CRISPR-Cas12a as a Signal Amplifier to Construct Biosensors for Non-DNA Targets in Ultralow Concentrations. Acs Sensors. 2020;5:970-7
49. Xu LQ, Dai QQ, Shi ZY, Liu XT, Gao L, Wang ZZ. et al. Accurate MRSA identification through dual-functional aptamer and CRISPR-Cas12a assisted rolling circle amplification. J Microbiol Meth. 2020 173
50. Liang MD, Li ZL, Wang WS, Liu JK, Liu LS, Zhu GL. et al. A CRISPR-Cas12a-derived biosensing platform for the highly sensitive detection of diverse small molecules. Nature Communications. 2019 10
51. Rosenberg JE, Bambury RM, Van Allen EM, Drabkin HA, Lara PN Jr, Harzstark AL. et al. A phase II trial of AS1411 (a novel nucleolin-targeted DNA aptamer) in metastatic renal cell carcinoma. Invest New Drugs. 2014;32:178-87
52. Huang L, Wang DB, Singh N, Yang F, Gu N, Zhang XE. A dual-signal amplification platform for sensitive fluorescence biosensing of leukemia-derived exosomes. Nanoscale. 2018;10:20289-95
53. Zhang F, Correia A, Makila E, Li W, Salonen J, Hirvonen JJ. et al. Receptor-Mediated Surface Charge Inversion Platform Based on Porous Silicon Nanoparticles for Efficient Cancer Cell Recognition and Combination Therapy. ACS Appl Mater Interfaces. 2017;9:10034-46
54. Lai WY, Huang BT, Wang JW, Lin PY, Yang PC. A Novel PD-L1-targeting Antagonistic DNA Aptamer With Antitumor Effects. Mol Ther Nucleic Acids. 2016;5:e397
55. Gootenberg JS, Abudayyeh OO, Kellner MJ, Joung J, Collins JJ, Zhang F. Multiplexed and portable nucleic acid detection platform with Cas13, Cas12a, and Csm6. Science. 2018;360:439-44
56. Bernacchi S, Mely Y. Exciton interaction in molecular beacons: a sensitive sensor for short range modifications of the nucleic acid structure. Nucleic Acids Res. 2001;29:E62-2
57. Liao C, Slotkowski RA, Achmedov T, Beisel CL. The Francisella novicida Cas12a is sensitive to the structure downstream of the terminal repeat in CRISPR arrays. RNA Biol. 2019;16:404-12
58. Li B, Yan J, Zhang Y, Li W, Zeng C, Zhao W. et al. CRISPR-Cas12a Possesses Unconventional DNase Activity that Can Be Inactivated by Synthetic Oligonucleotides. Mol Ther Nucleic Acids. 2020;19:1043-52
59. Zhang L, Sun R, Yang M, Peng S, Cheng Y, Chen C. Conformational Dynamics and Cleavage Sites of Cas12a Are Modulated by Complementarity between crRNA and DNA. iScience. 2019;19:492-503
60. Singh D, Mallon J, Poddar A, Wang Y, Tippana R, Yang O. et al. Real-time observation of DNA target interrogation and product release by the RNA-guided endonuclease CRISPR Cpf1 (Cas12a). Proc Natl Acad Sci U S A. 2018;115:5444-9
61. Kalluri R. The biology and function of fibroblasts in cancer. Nat Rev Cancer. 2016;16:582-98
62. Cai XZ, Zeng WQ, Xiang Y, Liu Y, Zhang HM, Li H. et al. iTRAQ-Based Quantitative Proteomic Analysis of Nasopharyngeal Carcinoma. J Cell Biochem. 2015;116:1431-41
63. Tang LQ, Li CF, Li J, Chen WH, Chen QY, Yuan LX. et al. Establishment and Validation of Prognostic Nomograms for Endemic Nasopharyngeal Carcinoma. J Natl Cancer Inst. 2016;108:djv291
64. Costantini A, Julie C, Dumenil C, Helias-Rodzewicz Z, Tisserand J, Dumoulin J. et al. Predictive role of plasmatic biomarkers in advanced non-small cell lung cancer treated by nivolumab. Oncoimmunology. 2018;7:e1452581
Author contact
![]() Corresponding authors: Wanli Liu, Department of Clinical Laboratory, Sun Yat-sen University Cancer Center, 651 Dongfeng Road East, Guangzhou 510060, Guangdong Province, China. Telephone/Fax: +86 20 8734 3438; E-mail: liuwlorg.cn; Min Deng, Affiliated Cancer Hospital & Institute of Guangzhou Medical University, No.78, Hengzhigang Road, Guangzhou 510095, P. R. China. E-mail: dengmin510095com.
Corresponding authors: Wanli Liu, Department of Clinical Laboratory, Sun Yat-sen University Cancer Center, 651 Dongfeng Road East, Guangzhou 510060, Guangdong Province, China. Telephone/Fax: +86 20 8734 3438; E-mail: liuwlorg.cn; Min Deng, Affiliated Cancer Hospital & Institute of Guangzhou Medical University, No.78, Hengzhigang Road, Guangzhou 510095, P. R. China. E-mail: dengmin510095com.